
Simulation of the θ′ Precipitation Process with Interfacial Anisotropy Effects in Al-Cu Alloys

 , , , , and
Abstract
:1. Introduction
2. Model Descriptions
Multi-Phase-Field Model
3. Simulation Parameters
3.1. Thermodynamic Inputs
3.2. Other Thermophysical and Numerical Parameters
4. Experimental Details
5. Results and Discussion
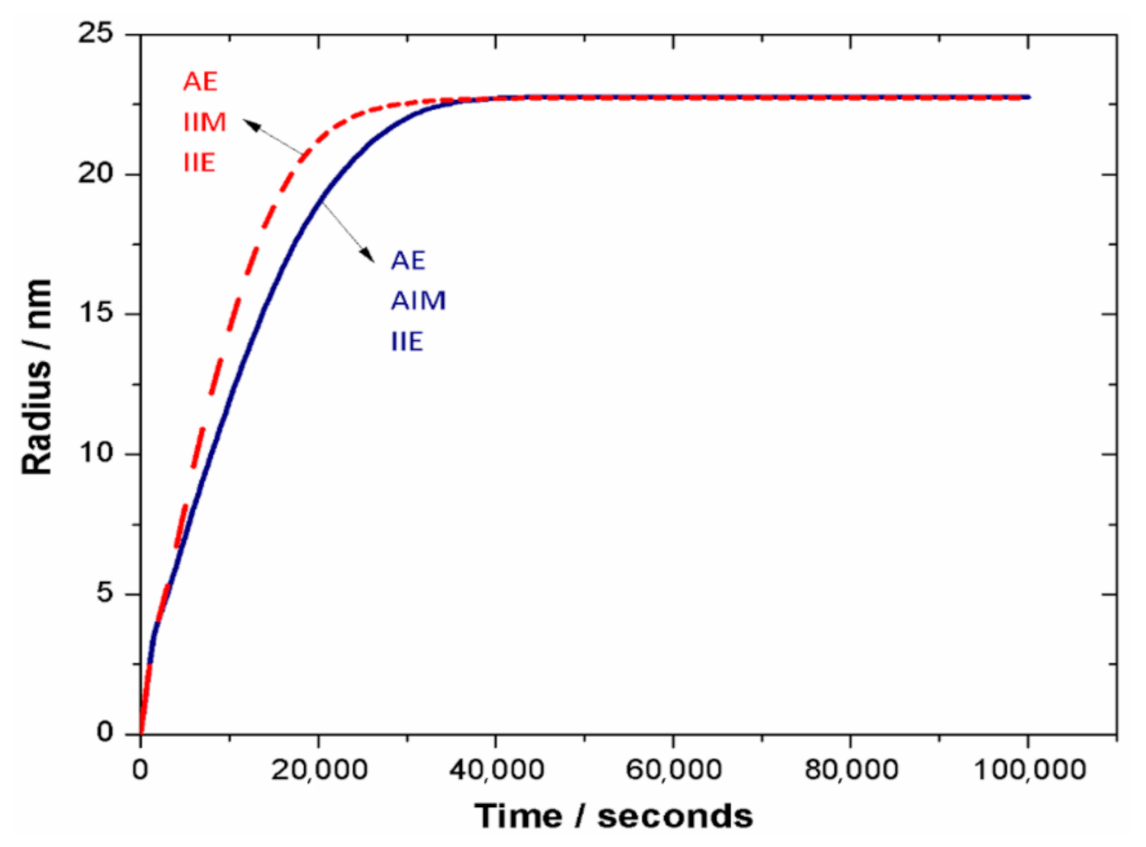
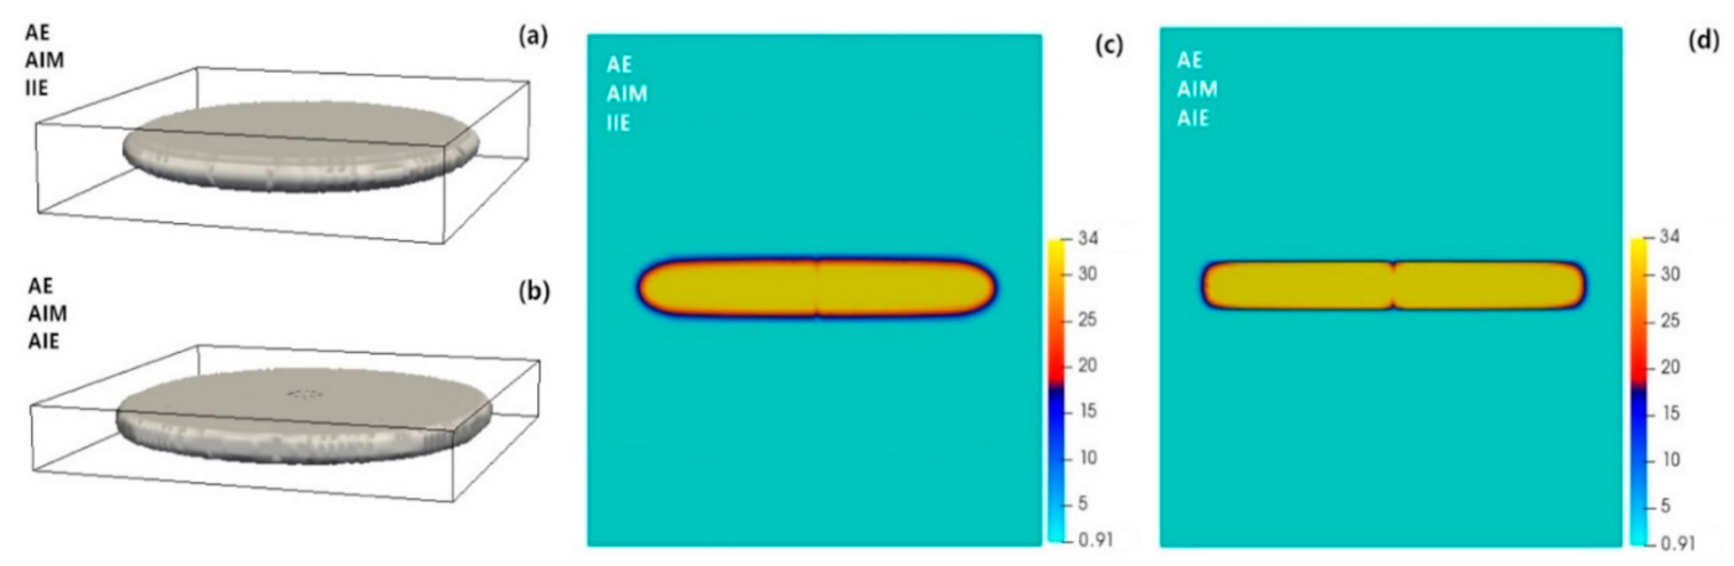
5.1. Single Precipitate
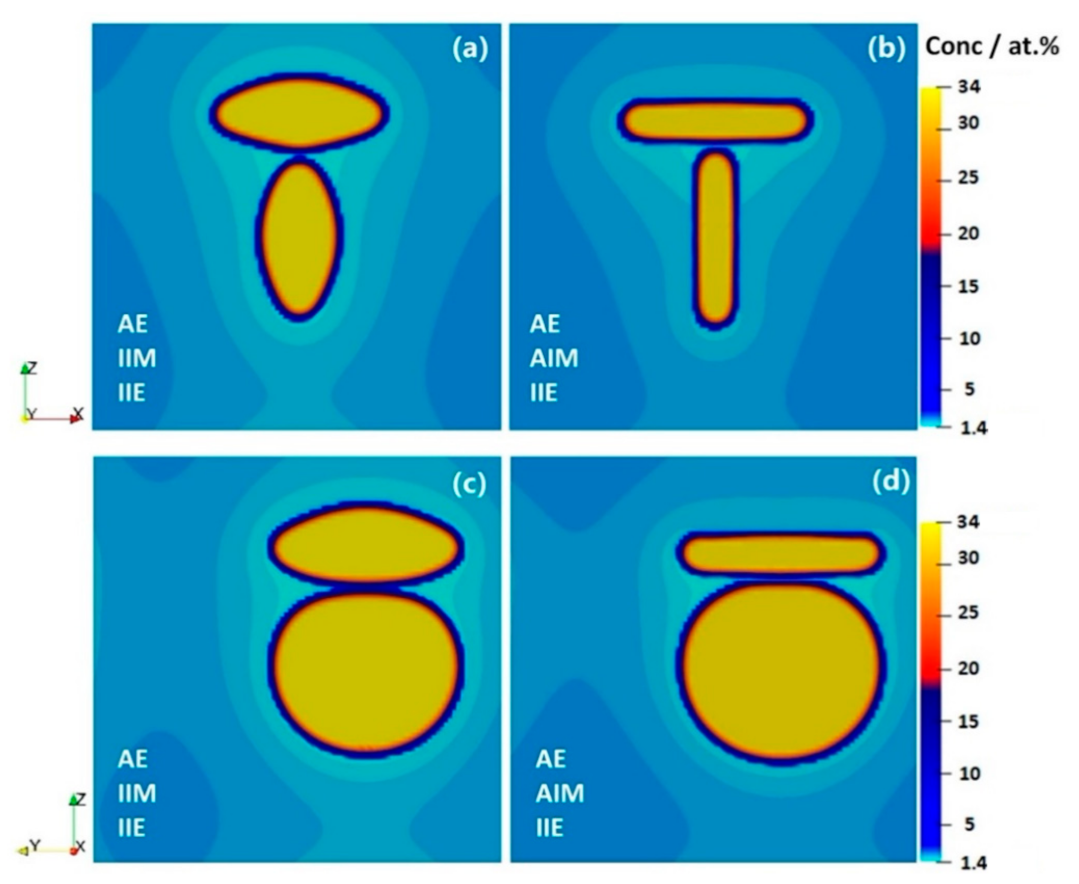
5.2. Two Precipitates
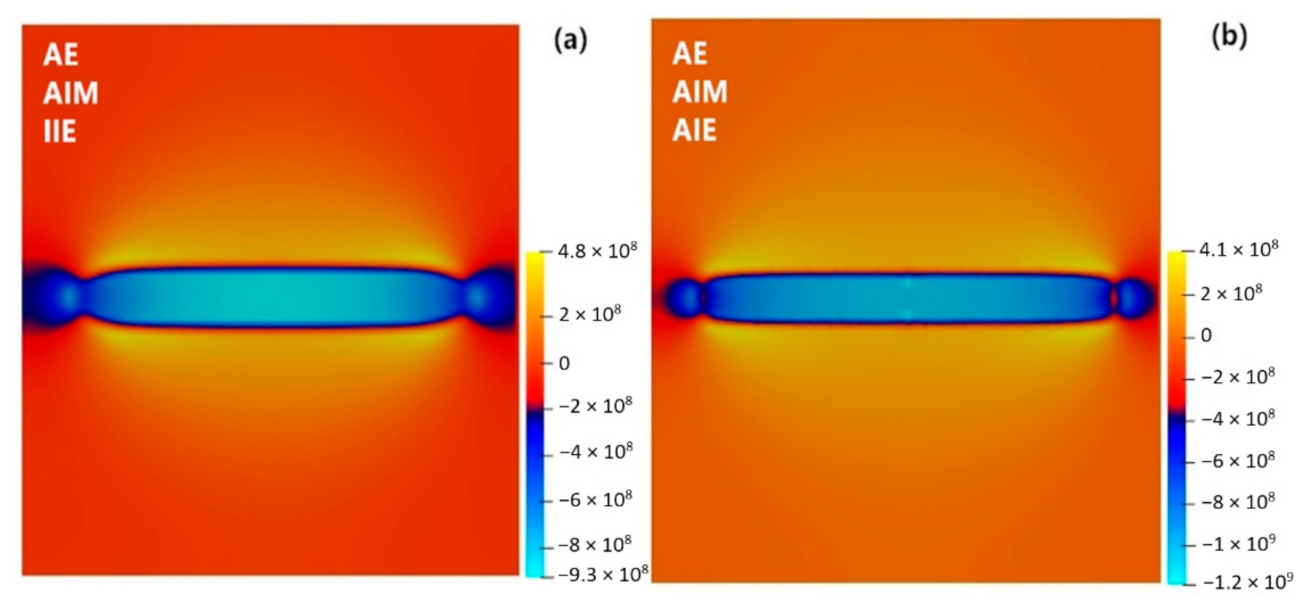
5.3. Effect of Chemo-Mechanical Coupling on θ′ Evolution
5.4. Large Scale Simulation and Comparison to the Experiments
6. Summary and Outlook
Author Contributions
Funding
Institutional Review Board Statement
Informed Consent Statement
Data Availability Statement
Acknowledgments
Conflicts of Interest
References
- Park, J.; Darvishi Kamachali, R.; Kim, S.-D.; Kim, S.-H.; Oh, C.-S.; Schwarze, C.; Steinbach, I. First Evidence for Mechanism of Inverse Ripening from In-situ TEM and Phase-Field Study of δ′ Precipitation in an Al-Li Alloy. Sci. Rep. 2019, 9, 3981. [Google Scholar] [CrossRef]
- Larché, F.C.; Cahn, J.W. Overview no. 41 the interactions of composition and stress in crystalline solids. Acta Metall. Mater. 1985, 33, 331–357. [Google Scholar]
- Larché, F.C.; Cahn, J.W. A nonlinear theory of thermochemical equilibrium of solids under stress. Acta Metall. Mater. 1978, 26, 53–60. [Google Scholar] [CrossRef]
- Fratzl, P.; Penrose, O.; Lebowitz, J.L. Modeling of Phase Separation in Alloys with Coherent Elastic Misfit. J. Stat. Phys. 1999, 95, 1429–1503. [Google Scholar] [CrossRef] [Green Version]
- Shi, S.; Markmann, J.; Weissmüller, J. Verifying Larché–Cahn elasticity, a milestone of 20th-century thermodynamics. Proc. Natl. Acad. Sci. USA 2018, 115, 10914–10919. [Google Scholar] [CrossRef] [Green Version]
- Singh, A.; Pal, S. Coupled chemo-mechanical modeling of fracture in polycrystalline cathode for lithium-ion battery. Int. J. Plast. 2020, 127, 102636. [Google Scholar] [CrossRef]
- Darvishi Kamachali, R.; Borukhovich, E.; Shchyglo, O.; Steinbach, I. Solutal gradients in strained equilibrium. Philos. Mag. Lett. 2013, 93, 680–687. [Google Scholar] [CrossRef]
- Darvishi Kamachali, R.; Borukhovich, E.; Hatcher, N.; Steinbach, I. DFT-supported phase-field study on the effect of mechanically driven fluxes in Ni4Ti3 precipitation. Model. Simul. Mater. Sci. Eng. 2014, 22, 034003. [Google Scholar] [CrossRef]
- Darvishi Kamachali, R.; Schwarze, C. Inverse Ripening and Rearrangement of Precipitates under Chemomechanical Coupling. Comput. Mater. Sci. 2017, 130, 292–296. [Google Scholar] [CrossRef]
- Schwarze, C.; Gupta, A.; Hickel, T.; Darvishi Kamachali, R. Phase-field study of ripening and rearrangement of precipitates under chemomechanical coupling. Phys. Rev. B 2017, 95, 174101. [Google Scholar] [CrossRef]
- Radmilovic, V.; Ophus, C.; Marquis, E.A.; Rossell, M.D.; Tolley, A.; Gautam, A.; Asta, M.; Dahmen, U. Highly monodisperse core–shell particles created by solid-state reactions. Nat. Mater. 2011, 10, 710–715. [Google Scholar] [CrossRef]
- Polmear, I.J. Light Alloys—From Traditional Alloys to Nanocrystals, 4th ed.; Butterworth-Heinemann: Burlington, MA, USA, 2006. [Google Scholar] [CrossRef]
- Prasad, N.E.; Gokhale, A.A.; Wanhill, R.J.H. Aluminum-Lithium-Alloys. Processing, Properties and Applications; Butterworth-Heinemann: Oxford, UK, 2014. [Google Scholar]
- Vaithyanathan, V.; Wolverton, C.; Chen, L.Q. Multiscale modeling of θ′ precipitation in Al-Cu binary alloys. Acta Mater. 2004, 52, 2973–2987. [Google Scholar] [CrossRef]
- Ringer, S.P.; Hono, K. Microstructural Evolution and Age Hardening in Aluminium Alloys: Atom Probe Field-Ion Microscopy and Transmission Electron Microscopy Studies. Mater. Charact. 2000, 44, 101–131. [Google Scholar] [CrossRef]
- Phillips, V.A. Lattice resolution measurement of strain fields at guinier-preston zones in Al-3.0 % Cu. Acta Metall. 1973, 21, 219–227. [Google Scholar] [CrossRef]
- Da Costa Teixeira, J.; Cram, D.G.; Bourgeois, L.; Bastow, T.J.; Hill, A.J.; Hutchinson, C.R. On the strengthening response of aluminum alloys containing shear-resistant plate-shaped precipitates. Acta Mater. 2008, 56, 6109–6122. [Google Scholar] [CrossRef]
- Nie, J.F.; Muddle, B.C. Microstructural design of high-strength aluminum alloys. J. Phase Equilib. 1998, 19, 543. [Google Scholar] [CrossRef]
- Wolverton, C. First-principles prediction of equilibrium precipitate shapes in aluminium-copper alloys. Philos. Mag. Lett. 1999, 79, 683–690. [Google Scholar] [CrossRef]
- Huang, Y.; Robson, J.D.; Prangnell, P.B. The formation of nanograin structures and accelerated room-temperature theta precipitation in a severely deformed Al-4 wt.% Cu alloy. Acta Mater. 2009, 58, 1643–1657. [Google Scholar] [CrossRef]
- Vaughan, D. Grain boundary precipitation in an aluminium-copper alloy. Acta Metall. 1968, 16, 563–577. [Google Scholar] [CrossRef]
- Hillert, M. On the theory of normal and abnormal grain growth. Acta Metall. 1965, 13, 227–238. [Google Scholar] [CrossRef]
- Jiang, H.; Faulkner, R.G. Modelling of grain boundary segregation, precipitation and precipitate free zones of high strength aluminium alloys—I. The model. Acta Mater. 1995, 44, 1857–1864. [Google Scholar] [CrossRef]
- Khan, I.N.; Starink, M.J.; Yan, J.L. A model for precipitation kinetics and strengthening in Al–Cu–Mg alloys. Mater. Sci. Eng. A 2008, 472, 66–74. [Google Scholar] [CrossRef] [Green Version]
- Campisano, S.U.; Costanzo, E.; Scaccianoce, F.; Cristofolini, R. Growth kinetics of the phase in aluminium-copper thin film bilayers. Thin Solid Films 1978, 52, 97–101. [Google Scholar] [CrossRef]
- Jena, A.K.; Gupta, A.K.; Chaturvedi, M.C. A differential scanning calorimetric investigation of precipitation kinetics in the Al-1.53 wt.% Cu-0.79 wt.% Mg alloy. Acta Metall. 1989, 37, 885–895. [Google Scholar] [CrossRef]
- Holzeri, J.C.; Kelton, K.F. Kinetics of the amorphous to icosahedral phase transformation in Al-Cu-V alloys. Acta Metall Mater. 1991, 39, 1833–1843. [Google Scholar] [CrossRef]
- Huang, B.P.; Zheng, Z.Q. Independent and combined roles of trace Mg and Ag additions in properties precipitation process and precipitation kinetics of Al–Cu–Li–(Mg)–(Ag)–Zr–Ti alloys. Acta Mater. 1998, 46, 4381–4393. [Google Scholar] [CrossRef]
- Larouche, D. Mixed mode growth of an ellipsoidal precipitate: Analytical solution for shape preserving growth in the quasi-stationary regime. Acta Mater. 2017, 123, 188–196. [Google Scholar] [CrossRef] [Green Version]
- Heugue, P.; Larouche, D.; Breton, F.; Martinez, R.; Chen, X.G. Evaluation of the Growth Kinetics of θ’ and θ-Al2Cu Precipitates in a Binary Al-3.5 wt.% Cu Alloy. Metall. Mater. Trans. A 2019, 50, 3048–3060. [Google Scholar] [CrossRef]
- Deschamps, A.; Brechet, Y. Influence of predeformation and aging of an Al–Zn–Mg alloy—II. Modeling of precipitation kinetics and yield stress. Acta Mater. 1998, 47, 293–305. [Google Scholar] [CrossRef]
- Mishin, Y.; Asta, M.; Li, J. Atomistic modeling of interfaces and their impact on microstructure and properties. Acta Mater. 2010, 58, 1117–1151. [Google Scholar] [CrossRef] [Green Version]
- Wang, J.; Wolverton, C.; Muller, S.; Liu, Z.K.; Chen, L.Q. First-principles growth kinetics and morphological evolution of Cu nanoscale particles in Al. Acta Mater. 2005, 53, 2759–2764. [Google Scholar] [CrossRef]
- Schleifer, F.; Fleck, M.; Holzinger, M.; Lin, Y.-Y.; Glatzel, U. Phase-field modeling of γ′ and γ′′ precipitate size evolution during heat treatment of Ni-base superalloys. In Superalloys 2020; Tin, S., Hardy, M., Clews, J., Cormier, J., Feng, Q., Marcin, J., O’Brien, C., Suzuki, A., Eds.; Springer: Cham, Switzerland, 2020; pp. 500–508. [Google Scholar] [CrossRef]
- Schwarze, C.; Darvishi Kamachali, R.; Kühbach, M.; Mießen, C.; Tegeler, M.; Barrales-Mora, L.; Steinbach, I.; Gottstein, G. Computationally Efficient Phase-field Simulation Studies Using RVE Sampling and Statistical Analysis. Comput. Mater. Sci. 2018, 147, 204–216. [Google Scholar] [CrossRef]
- Schleifer, F.; Holzinger, M.; Lin, Y.-Y.; Glatzel, U.; Fleck, M. Phase-field modeling of γ/γ″ microstructure formation in Ni-based superalloys with high γ″ volume fraction. Intermetallics 2020, 120, 106745. [Google Scholar] [CrossRef] [Green Version]
- Li, D.Y.; Chen, L.Q. Computer simulation of stress-oriented nucleation and growth of θ′ precipitates in Al–Cu alloys. Acta Mater. 1998, 46, 2573–2585. [Google Scholar] [CrossRef]
- Vaithyanathan, V.; Wolverton, C.; Chen, L.Q. Multiscale modeling of precipitate microstructure evolution. Phys. Rev. Lett. 2002, 88, 125503. [Google Scholar] [CrossRef] [PubMed]
- Darvishi Kamachali, R.; Schwarze, C.; Lin, M.; Diehl, M.; Shanthraj, P.; Prahl, U.; Steinbach, I.; Raabe, D. Numerical Benchmark of Phase-Field Simulations with Elastic Strains: Precipitation in the Presence of Chemo-Mechanical Coupling. Comput. Mater. Sci. 2018, 155, 541–553. [Google Scholar] [CrossRef] [Green Version]
- Tegeler, M.; Shchyglo, O.; Darvishi Kamachali, R.; Monas, A.; Steinbach, I.; Sutmann, G. Parallel multiphase field simulations with OpenPhase. Comput. Phys. Commun. 2017, 215, 173–187. [Google Scholar] [CrossRef]
- Steinbach, I. Phase-field models in materials science. Model. Simul. Mater. Sci. Eng. 2009, 17, 073001. [Google Scholar] [CrossRef]
- Steinbach, I. Phase-field model for microstructure evolution at the mesoscopic scale. Ann. Rev. Mater. Res. 2013, 43, 89–107. [Google Scholar] [CrossRef]
- Steinbach, I.; Pezzolla, F.; Nestler, B.; Seeßelberg, M.; Prieler, R.; Schmitz, G.J.; Rezende, J.L.L. A phase field concept for multiphase systems. Phys. D 1996, 94, 135–147. [Google Scholar] [CrossRef]
- Eiken, J.; Böttger, B.; Steinbach, I. Multiphase-field approach for multicomponent alloys with extrapolation scheme for numerical application. Phys. Rev. E 2006, 73, 066122. [Google Scholar] [CrossRef]
- Anderson, J.O.; Helander, T.; Höglund, L.; Shi, P.; Sundman, B. Thermo-Calc & DICTRA, Computational Tools for Materials Science. Calphad 2002, 26, 273–312. [Google Scholar]
- Steinbach, I.; Apel, M. Multi phase field model for solid state transformation with elastic strain. Phys. D 2006, 217, 153–160. [Google Scholar] [CrossRef]
- Borgenstam, A.; Höglund, L.; Agren, J.; Engström, A. DICTRA, a tool for simulation of diffusional transformations in alloys. J. Phase Equilib. 2000, 21, 269–280. [Google Scholar] [CrossRef]
- Häusler, I.; Schwarze, C.; Umer Bilal, M.; Valencia Ramirez, D.; Hetaba, W.; Darvishi Kamachali, R.; Skrotzki, B. Precipitation of T1 and θ′ Phase in Al-4Cu-1Li-0.25Mn During Age Hardening: Microstructural Investigation and Phase-Field Simulation. Materials 2017, 10, 117. [Google Scholar] [CrossRef] [Green Version]
- Ji, Y.; Ghaffari, B.; Li, M.; Chen, L.-Q. Phase-field modeling of θ′ precipitation kinetics in 319 aluminum alloys. Comput. Mater. Sci. 2018, 151, 84–94. [Google Scholar]
- Debierre, J.-M.; Karma, A.; Celestini, F.; Guérin, R. Phase-field approach for faceted solidification. Phys. Rev. E 2003, 68, 041604. [Google Scholar] [CrossRef] [PubMed] [Green Version]
- Eggleston, J.J.; McFadden, G.B.; Voorhees, P.W. A phase-field model for highly anisotropic interfacial energy. Phys. D 2001, 150, 91–103. [Google Scholar] [CrossRef]
- Fleck, M.; Federmann, H.; Pogorelov, E. Phase-field modeling of Li-insertion kinetics in single LiFePO4-nano-particles for rechargeable Li-ion battery application. Comput. Mater. Sci. 2018, 153, 288–296. [Google Scholar] [CrossRef] [Green Version]
- Thermo-Calc-Software. Available online: https://www.thermocalc.com/media/19849/tcal5_extended_info.pdf (accessed on 28 December 2020).
- Murray, J.L. The aluminium-copper system. Int. Mater. Rev. 1985, 30, 211–234. [Google Scholar] [CrossRef]
- Fuller, C.B.; Murray, J.L.; Seidman, D.N. Temporal evolution of the nanostructure of Al(Sc,Zr) alloys: Part I—Chemical compositions of Al3(Sc1−xZrx) precipitates. Acta Mater. 2005, 53, 5401–5413. [Google Scholar] [CrossRef]
- Liu, D.; Zhang, L.; Du, Y.; Xu, H.; Liu, S.; Liu, L. Assessment of atomic mobilities of Al and Cu in fcc Al-Cu alloys. Calphad 2009, 33, 761–768. [Google Scholar] [CrossRef]
- Vallin, J.; Mongy, M.; Salama, K.; Beckman, O. Elastic constants of aluminum. J. Appl. Phys. 1964, 35, 1825–1826. [Google Scholar] [CrossRef]
- Häusler, I.; Darvishi Kamachali, R.; Hetaba, W.; Skrotzki, B. Thickening of T1 Precipitates during Aging of a High Purity Al–4Cu–1Li–0.25Mn Alloy. Materials 2019, 12, 30. [Google Scholar] [CrossRef] [Green Version]
- Häusler, I. Determination of volume fraction of discrete oriented circlar disc-shaped preicpitates in the transmission mode. Pract. Metallogr. 2017, 54, 816–837. [Google Scholar] [CrossRef]
- Bourgeois, L.; Dwyer, C.; Weyland, M.; Nie, J.-F.; Muddle, B.C. The magic thicknesses of θ′ precipitates in Sn-microalloyed Al-Cu. Acta Mater. 2012, 60, 633–644. [Google Scholar] [CrossRef]
- Bourgeois, L.; Dwyer, C.; Weyland, M.; Nie, J.-F.; Muddle, B.C. Structure and energetics of the coherent interface between the θ′ precipitate phase and aluminium in Al-Cu. Acta Mater. 2011, 59, 7043–7050. [Google Scholar] [CrossRef]
- Bellón, B.; Haouala, S.; Llorca, J. An analysis of the influence of the precipitate type on the mechanical behavior of Al-Cu alloys by means of micropillar compression tests. Acta Mater. 2020, 194, 207–223. [Google Scholar] [CrossRef]
- Rodríguez-Veiga, A.; Bellón, B.; Papadimitriou, I.; Esteban-Manzanares, G.; Sabirov, I.; Llorca, J. A multidisciplinary approach to study precipitation kinetics and hardening in an Al-4Cu (wt.%) alloy. J. Alloy. Compd. 2018, 757, 504–519. [Google Scholar] [CrossRef] [Green Version]
- Stobbs, W.M.; Purdy, G.R. The Elastic Accommodation of Semicoherent θ′ in Al-4 wt.% Cu Alloy. Acta Metall. 1978, 26, 1069–1081. [Google Scholar] [CrossRef]
- Umer Bilal, M. Growth Kinetics and Coherency Loss from θ′ to θ in Al-Cu Alloy: A Phase-Field Study. Master’s Thesis, Ruhr-Universität Bochum, Bochum, Germany, 2016. [Google Scholar]


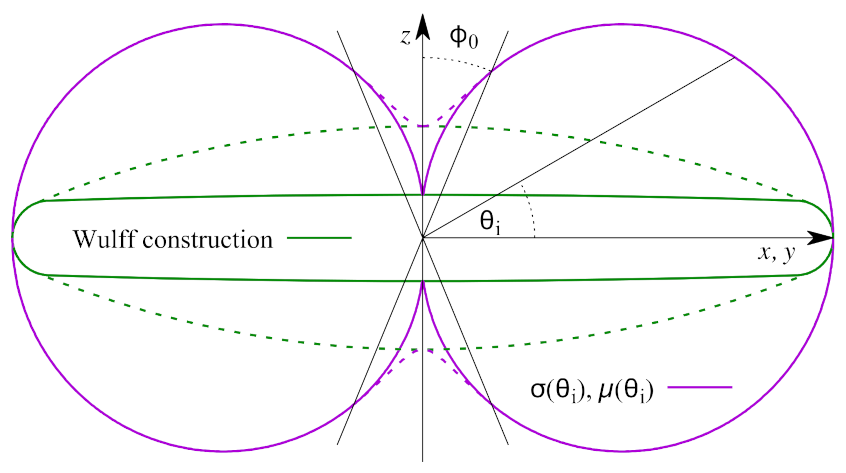
| Property | φ0 | β | |
|---|---|---|---|
| Interfacial mobility μ/cm4/Js | 1.0 × 10⁻¹⁹ | π/10,000 | 2000 |
| Interfacial energy σ/J/m2 | 0.245 | π/10,000 | 1.45 |
| Variable | Symbol | Value/Unit | Ref. |
|---|---|---|---|
| Interfacial width | η | 2.8 × 10⁻⁹–6 × 10⁻⁹ m | - |
| Grid spacing | Δx | 0.7 × 10⁻⁹–1.5 × 10⁻⁹ m | - |
| Time step | dt | 1 s | - |
| Interfacial energy | σ0 | 0.245 J/m2 | [24] |
| Interfacial mobility | μ0 | 1 × 10⁻¹⁹ m4/Js | - |
| Diffusivity of fcc Al | D | 1.66 × 10⁻²⁰ m2/s | [56] |
| Thermodynamics | Δg | Database | [54] |
| Eigenstrain | 0.00746, 0.00746, −0.051 | [14] |
| Phase | C11/GPa | C12/GPa | C44/GPa | A/- | C’/- |
|---|---|---|---|---|---|
| fcc Al matrix | 107.07 | 63.08 | 28.52 | 1.297 | 21.995 |
| θ′ | 190 | 80 | 90 | 1.636 | 55 |
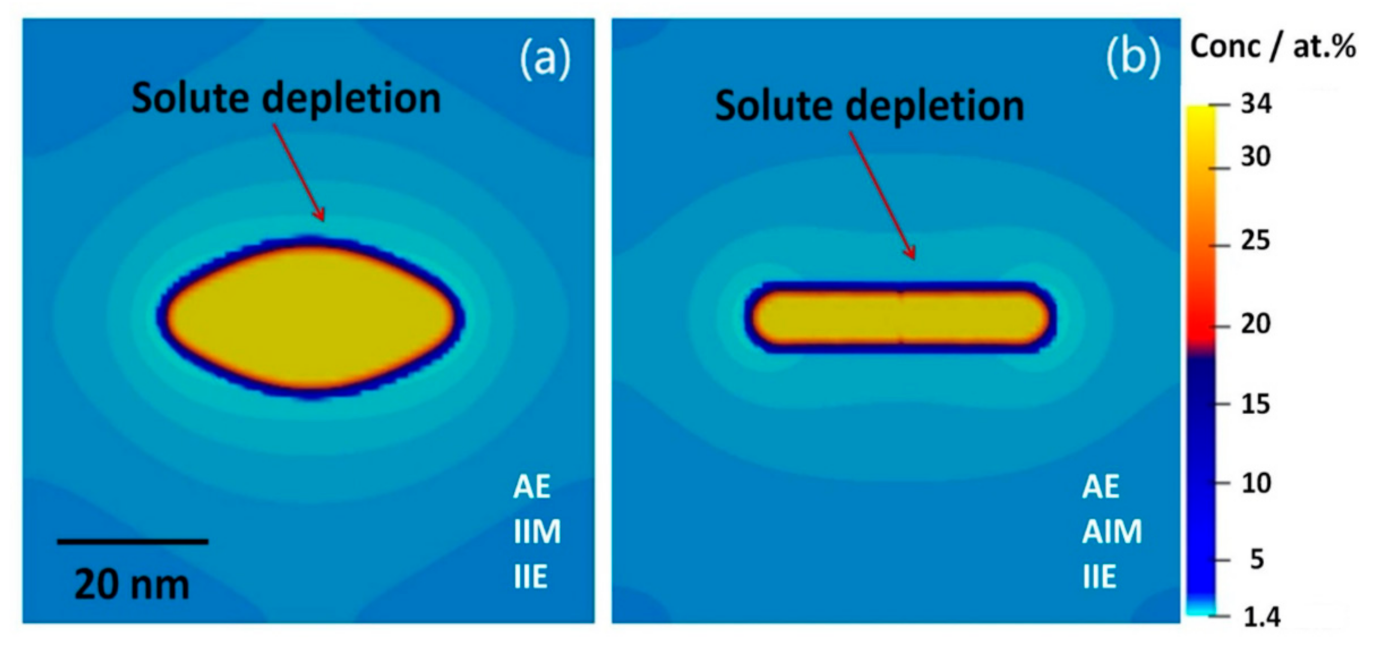
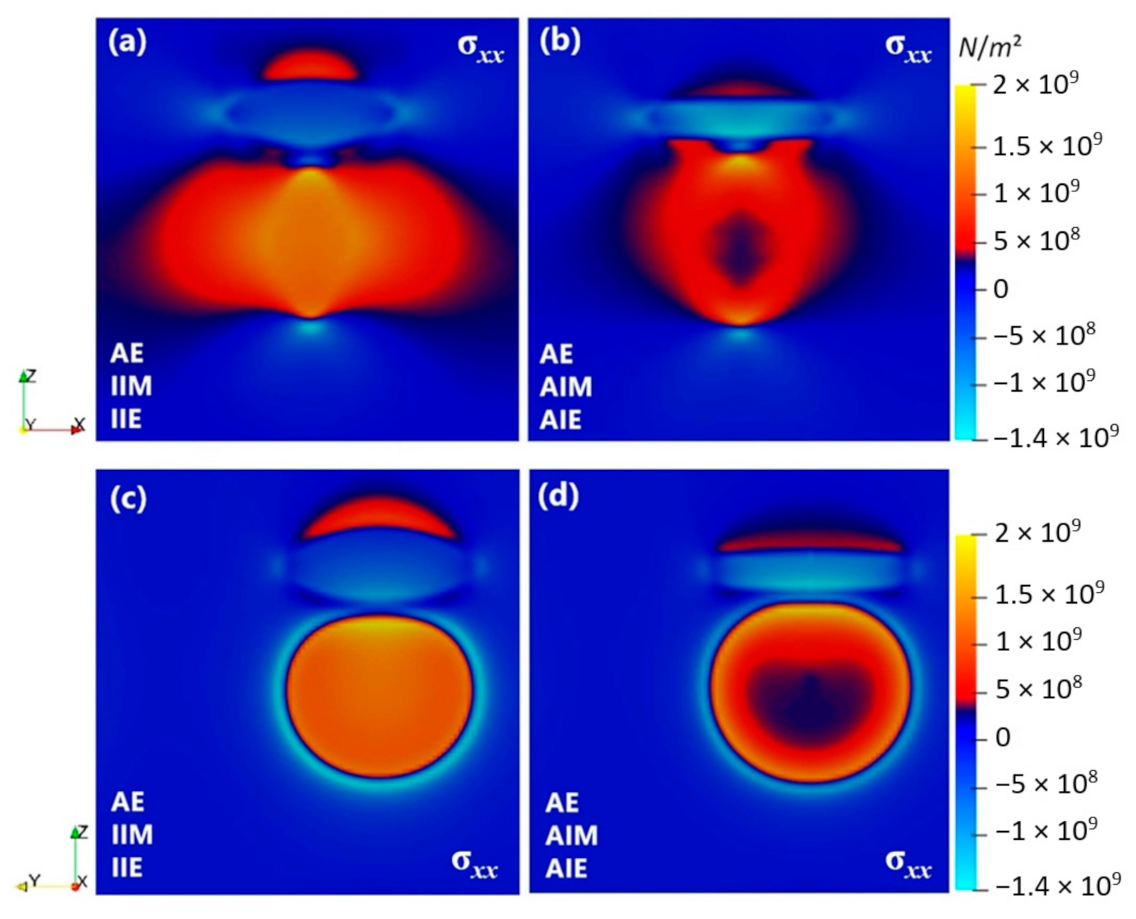
| Condition | Anisotropic Elasticity (Always Included) | Anisotropic Interfacial Mobility | Isotropic Interfacial Mobility | Anisotropic Interfacial Energy | Isotropic Interfacial Energy |
|---|---|---|---|---|---|
| Abbreviation | AE | AIM | IIM | AIE | IIE |
Publisher’s Note: MDPI stays neutral with regard to jurisdictional claims in published maps and institutional affiliations. |
© 2021 by the authors. Licensee MDPI, Basel, Switzerland. This article is an open access article distributed under the terms and conditions of the Creative Commons Attribution (CC BY) license (http://creativecommons.org/licenses/by/4.0/).
Share and Cite
Ta, N.; Bilal, M.U.; Häusler, I.; Saxena, A.; Lin, Y.-Y.; Schleifer, F.; Fleck, M.; Glatzel, U.; Skrotzki, B.; Darvishi Kamachali, R. Simulation of the θ′ Precipitation Process with Interfacial Anisotropy Effects in Al-Cu Alloys. Materials 2021, 14, 1280. https://doi.org/10.3390/ma14051280
Ta N, Bilal MU, Häusler I, Saxena A, Lin Y-Y, Schleifer F, Fleck M, Glatzel U, Skrotzki B, Darvishi Kamachali R. Simulation of the θ′ Precipitation Process with Interfacial Anisotropy Effects in Al-Cu Alloys. Materials. 2021; 14(5):1280. https://doi.org/10.3390/ma14051280
Chicago/Turabian StyleTa, Na, Muhammad Umer Bilal, Ines Häusler, Alaukik Saxena, Yueh-Yu Lin, Felix Schleifer, Michael Fleck, Uwe Glatzel, Birgit Skrotzki, and Reza Darvishi Kamachali. 2021. "Simulation of the θ′ Precipitation Process with Interfacial Anisotropy Effects in Al-Cu Alloys" Materials 14, no. 5: 1280. https://doi.org/10.3390/ma14051280