The Eco-Friendly Biochar and Valuable Bio-Oil from Caragana korshinskii: Pyrolysis Preparation, Characterization, and Adsorption Applications

 ,
, 
Abstract
:1. Introduction
2. Materials and Methods
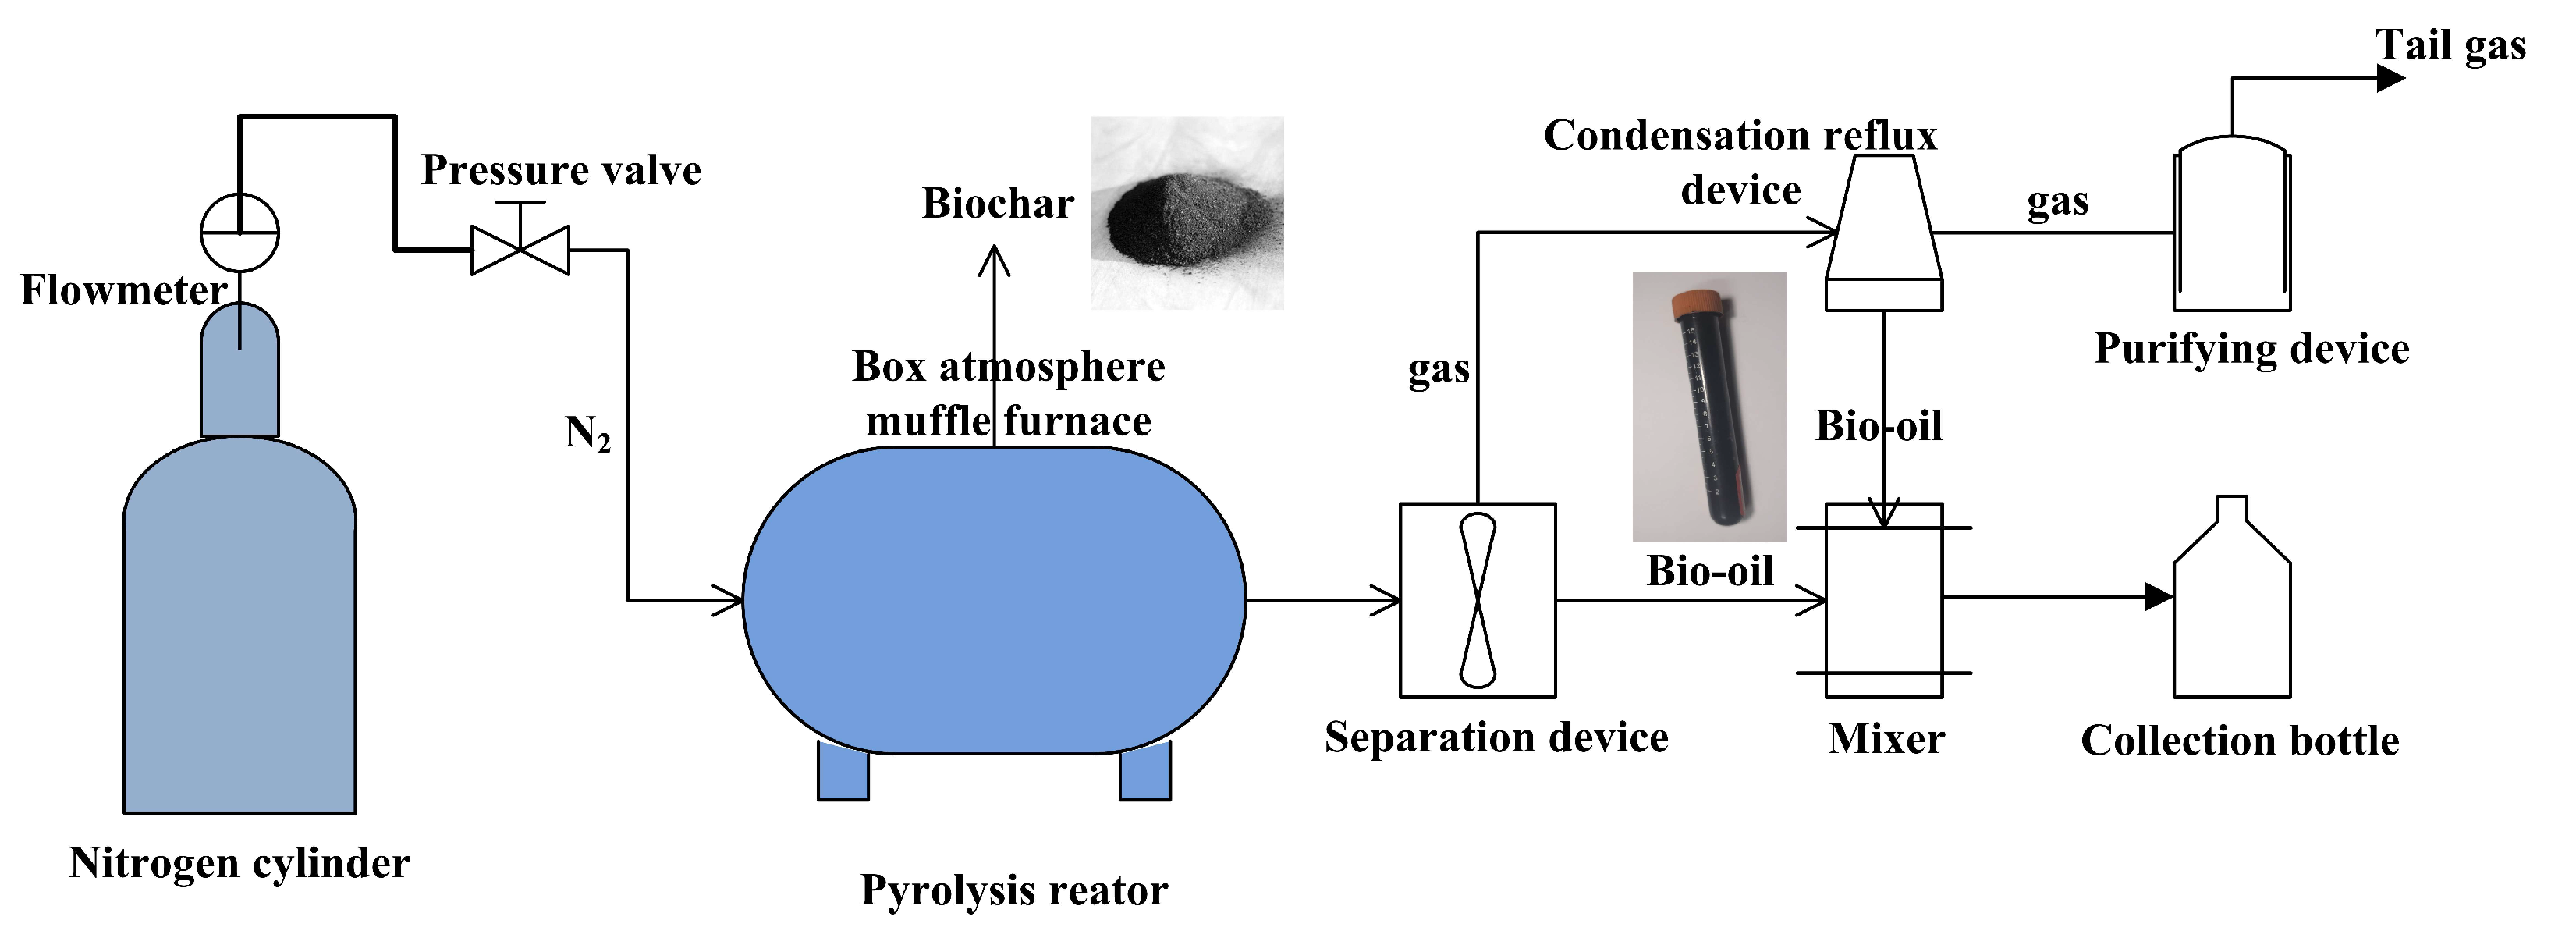
2.1. Production of Biochar and By-Products
2.2. Characterisation and Test
2.2.1. Basic Properties
2.2.2. Microscopic Indexes
2.2.3. By-Product Analysis
2.3. Batch Experiments
2.4. Adsorption Models and Data Analysis
3. Results and Discussion
3.1. Basic Physicochemical Properties
3.2. Biochar Characterization
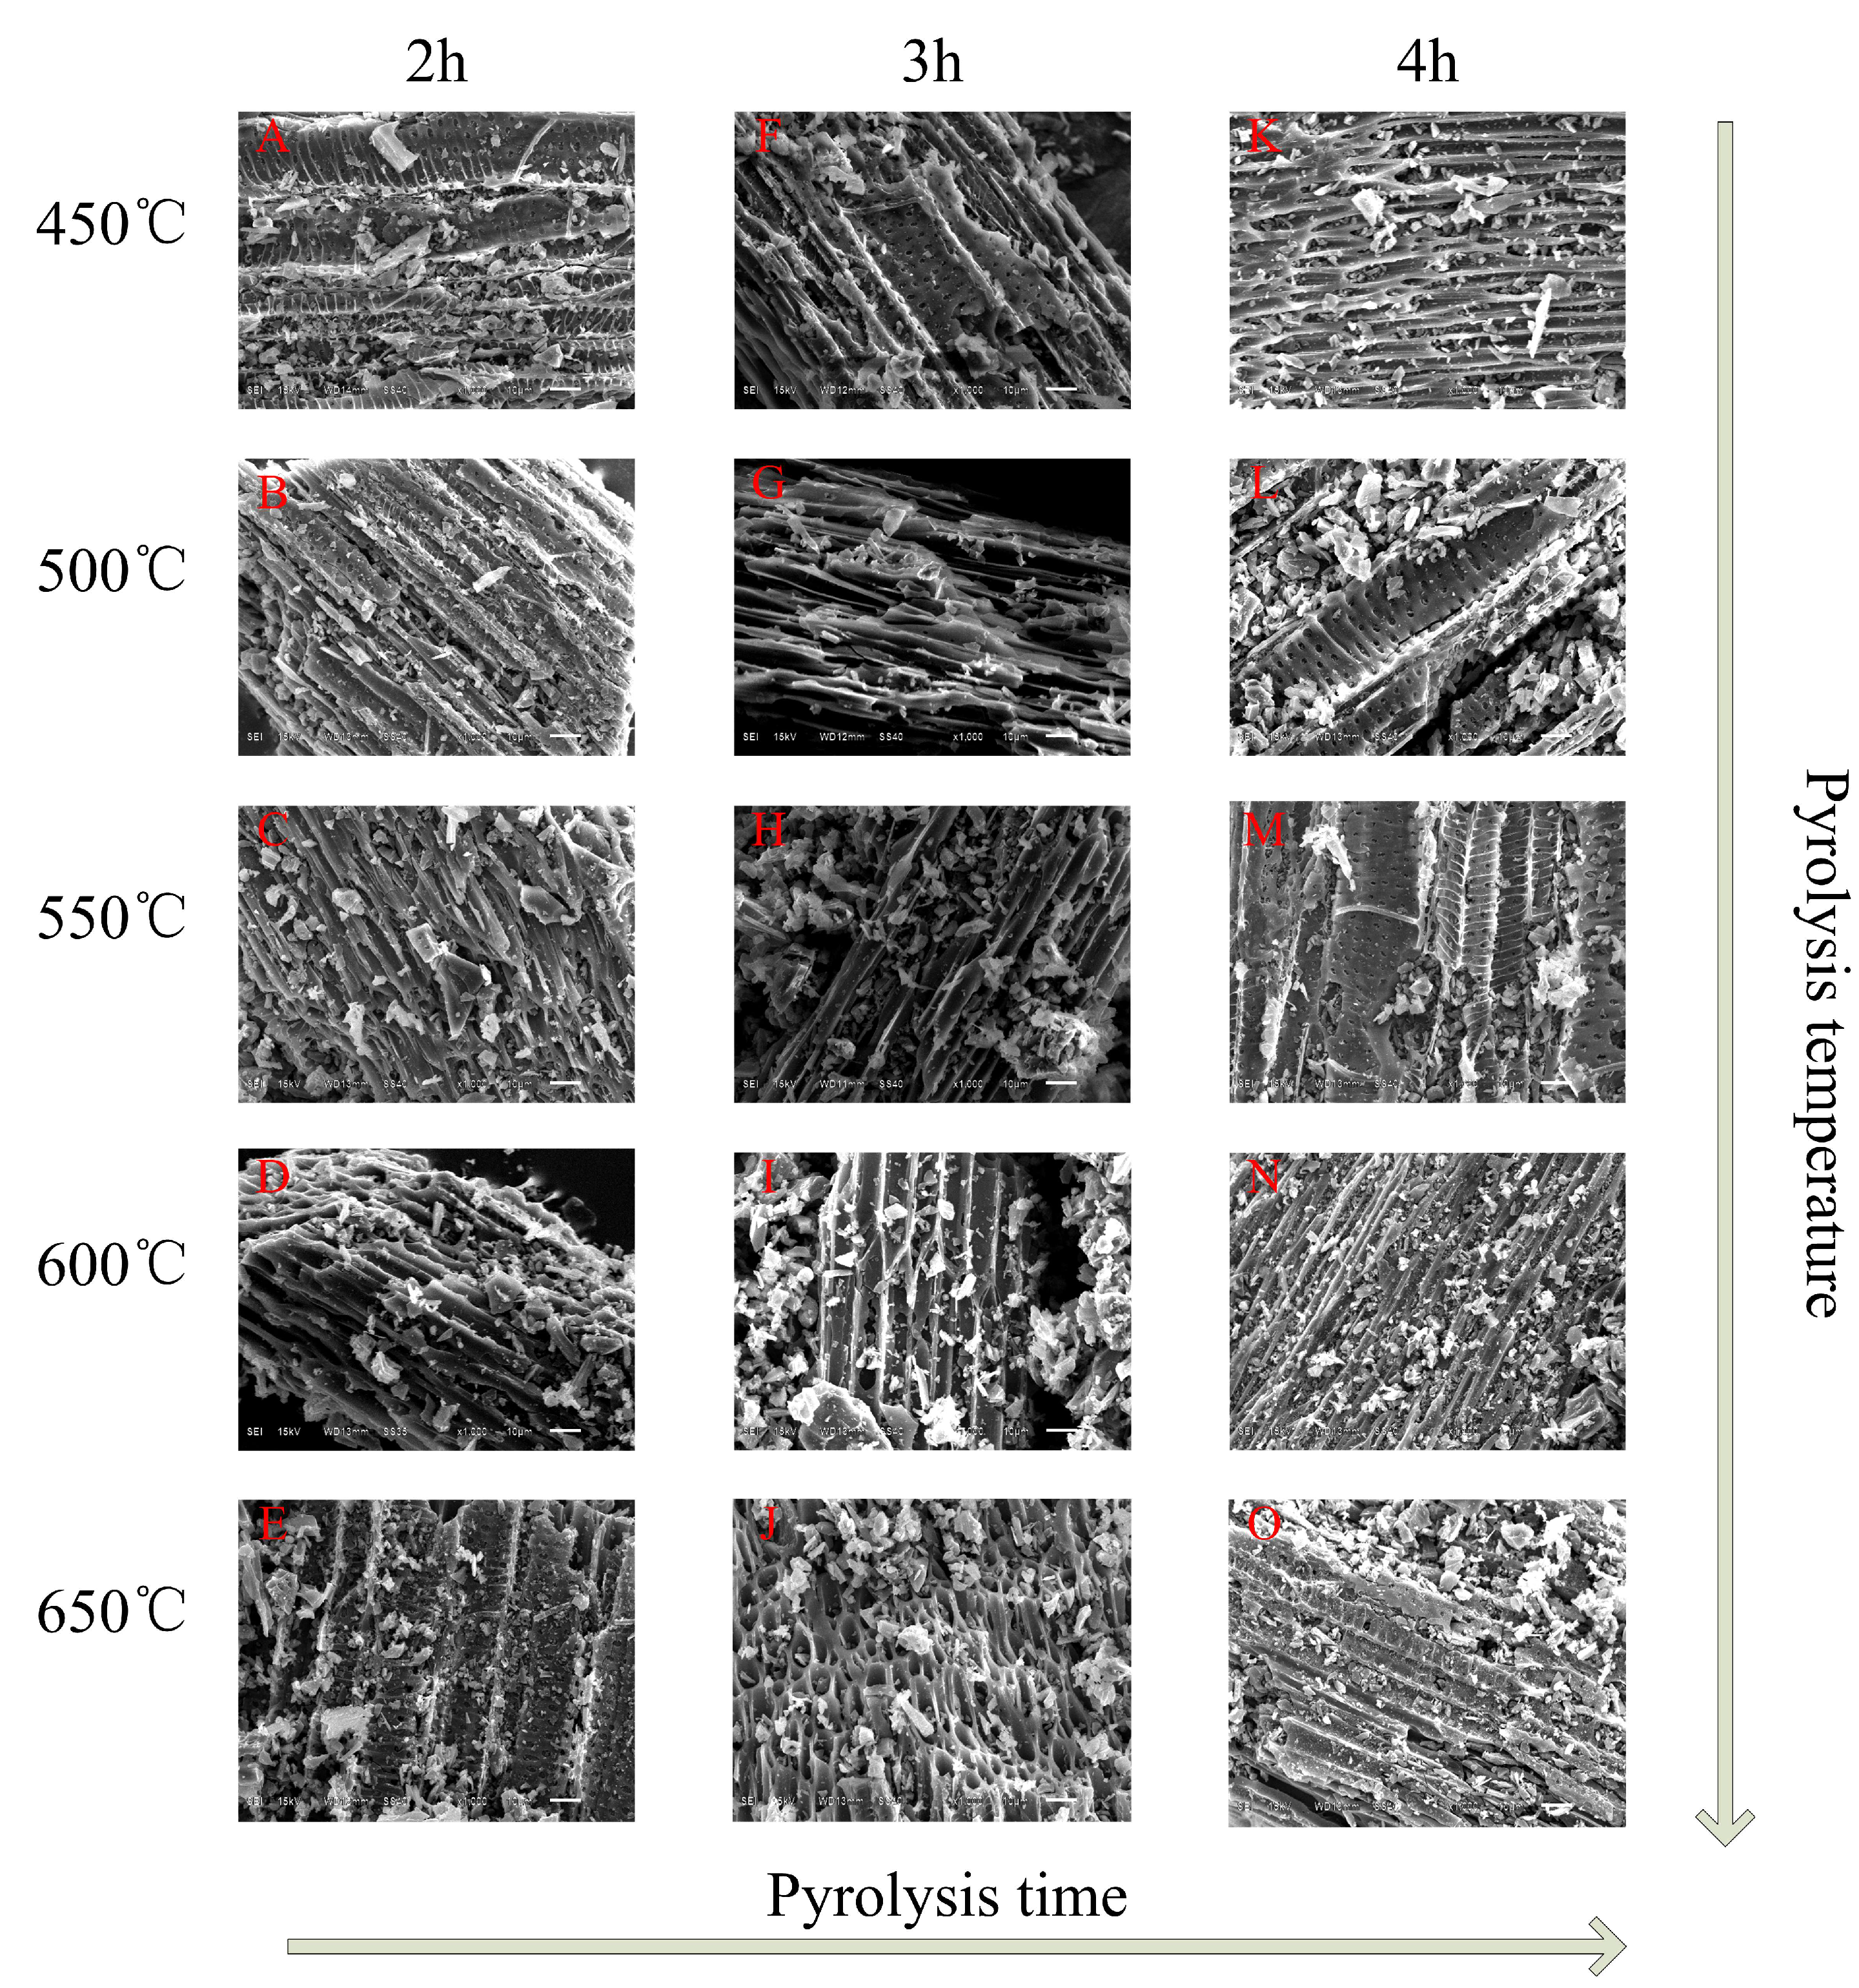
3.2.1. SEM
3.2.2. BET Specific Surface Area and Pore Size Analysis
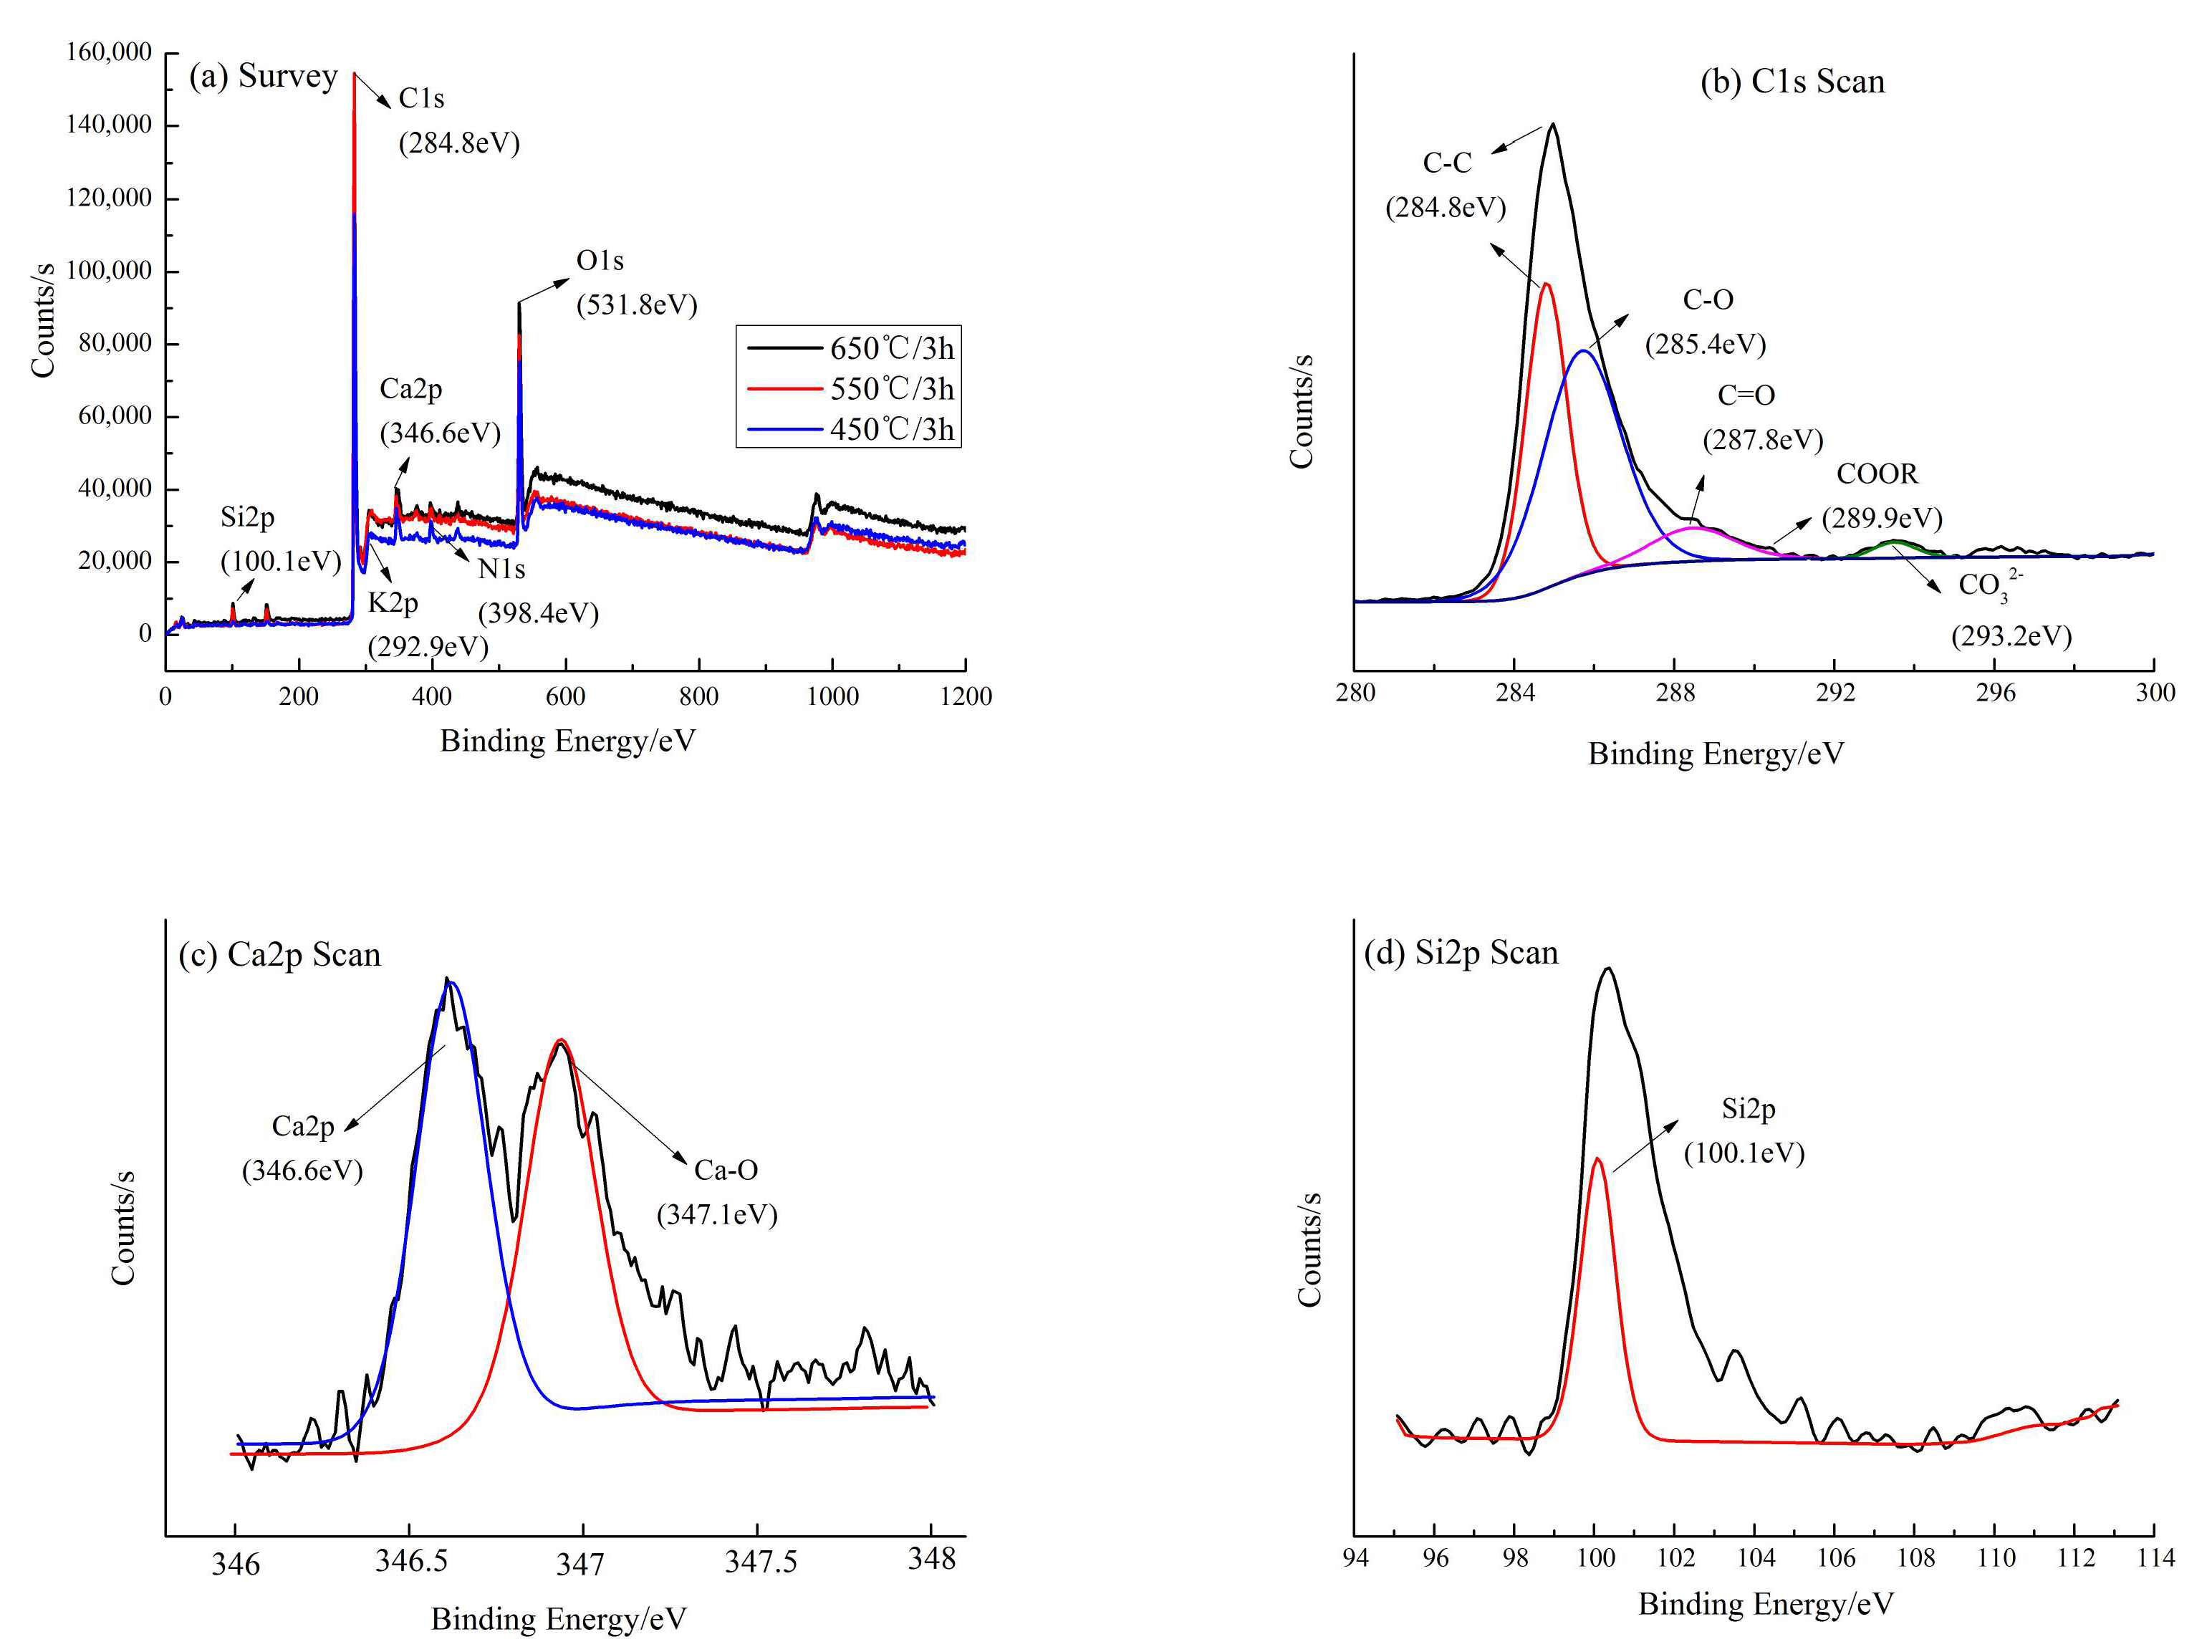
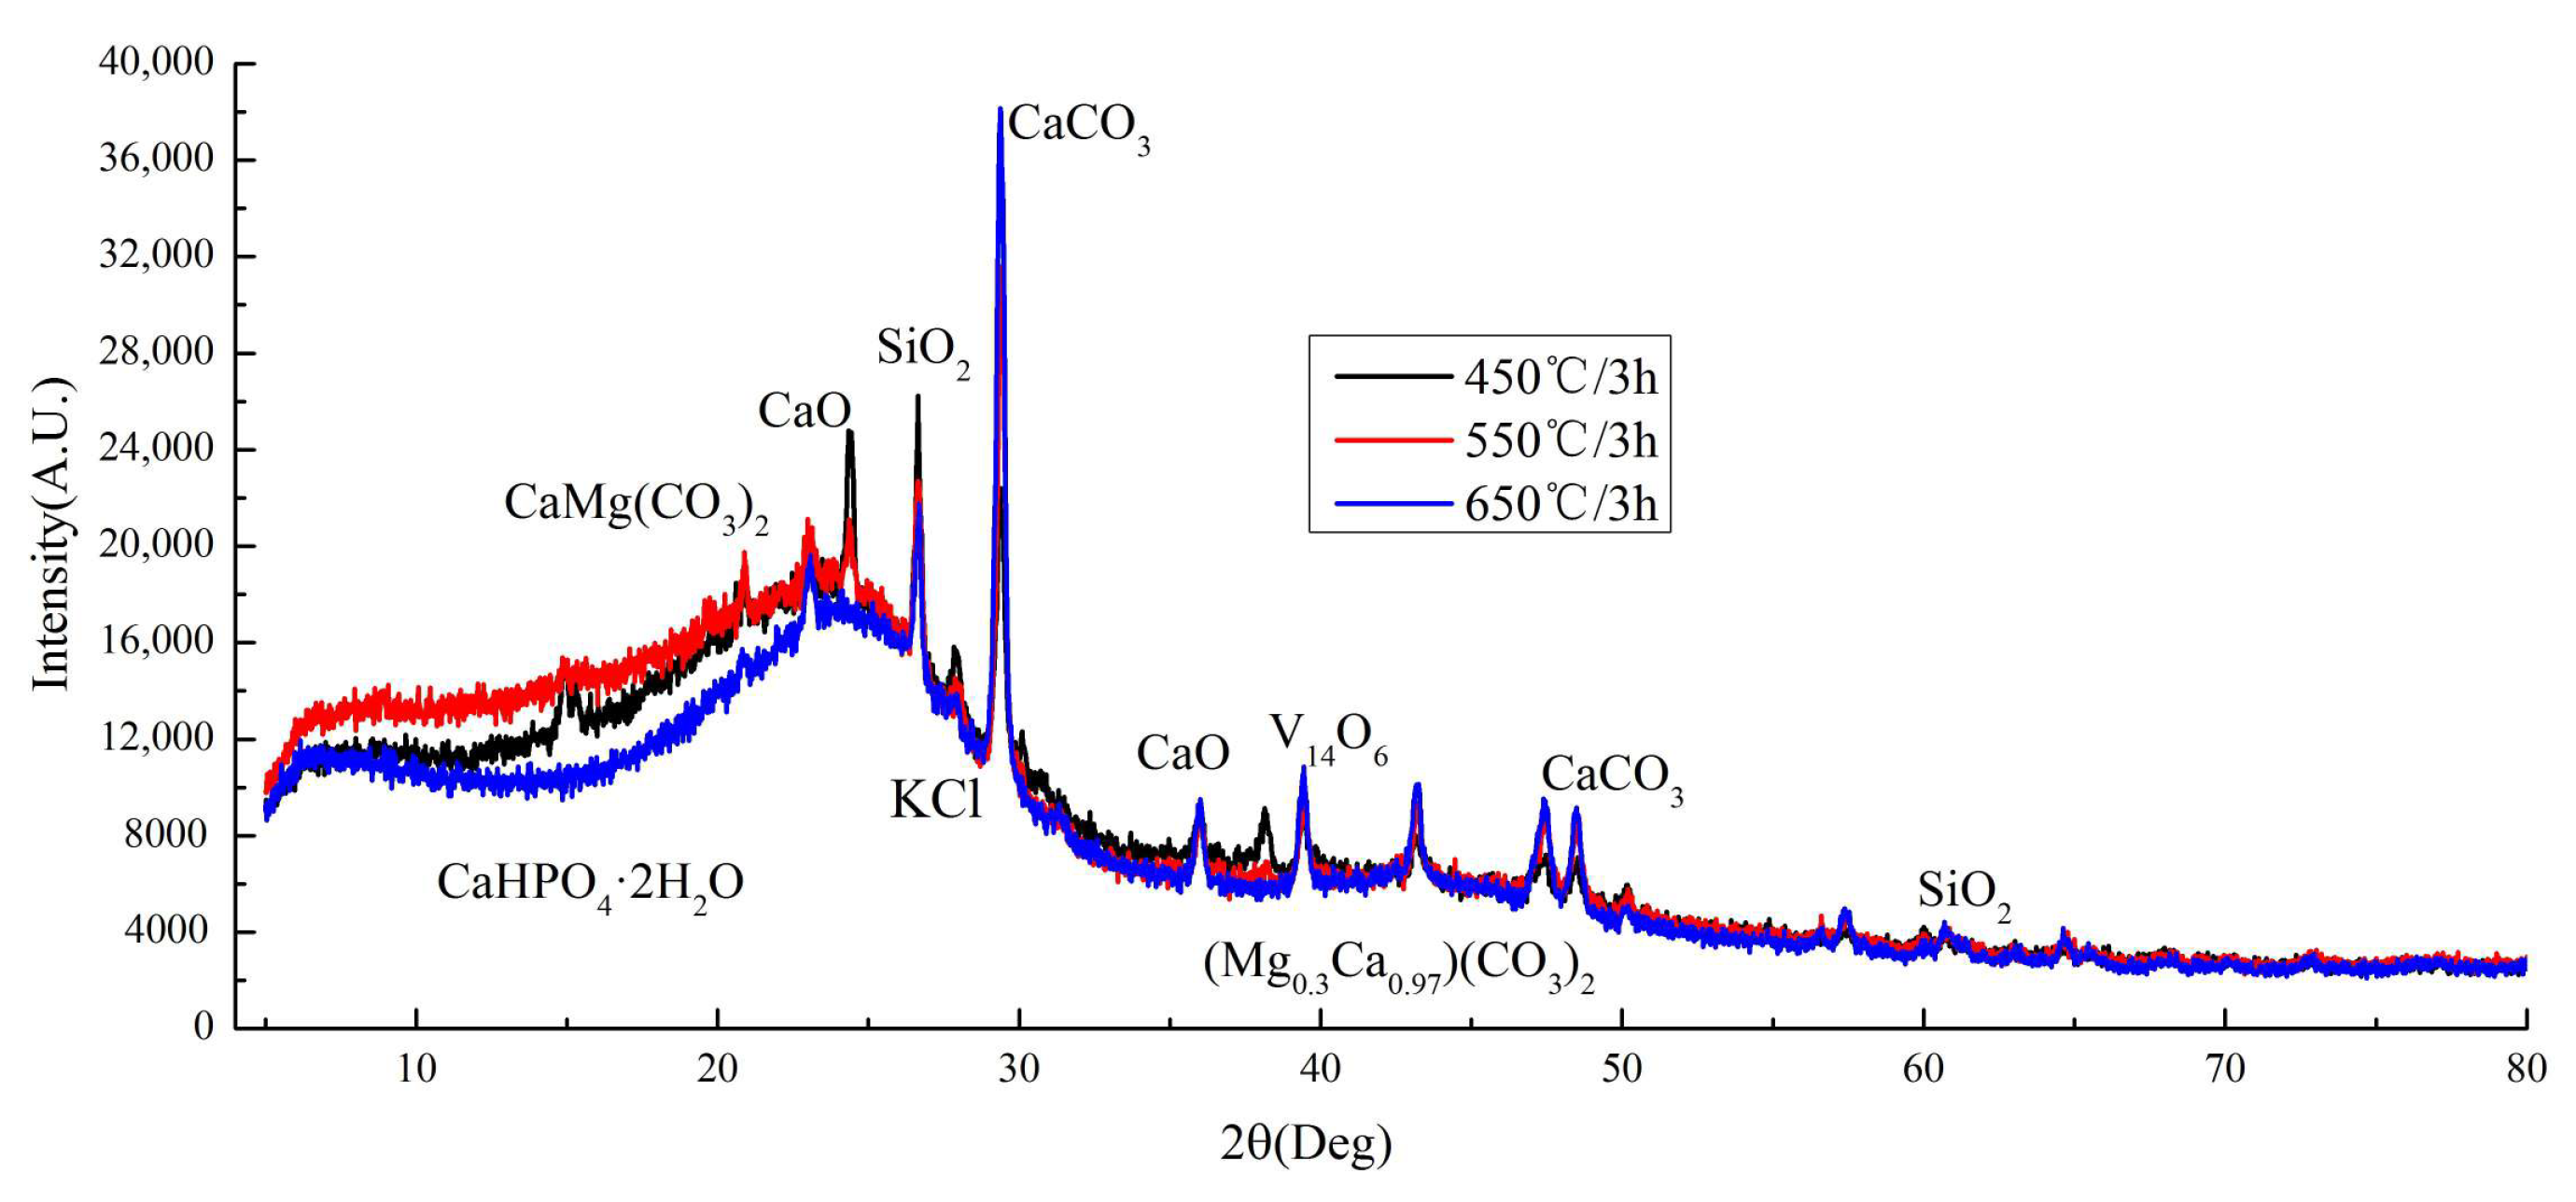
3.2.3. XPS and XRD
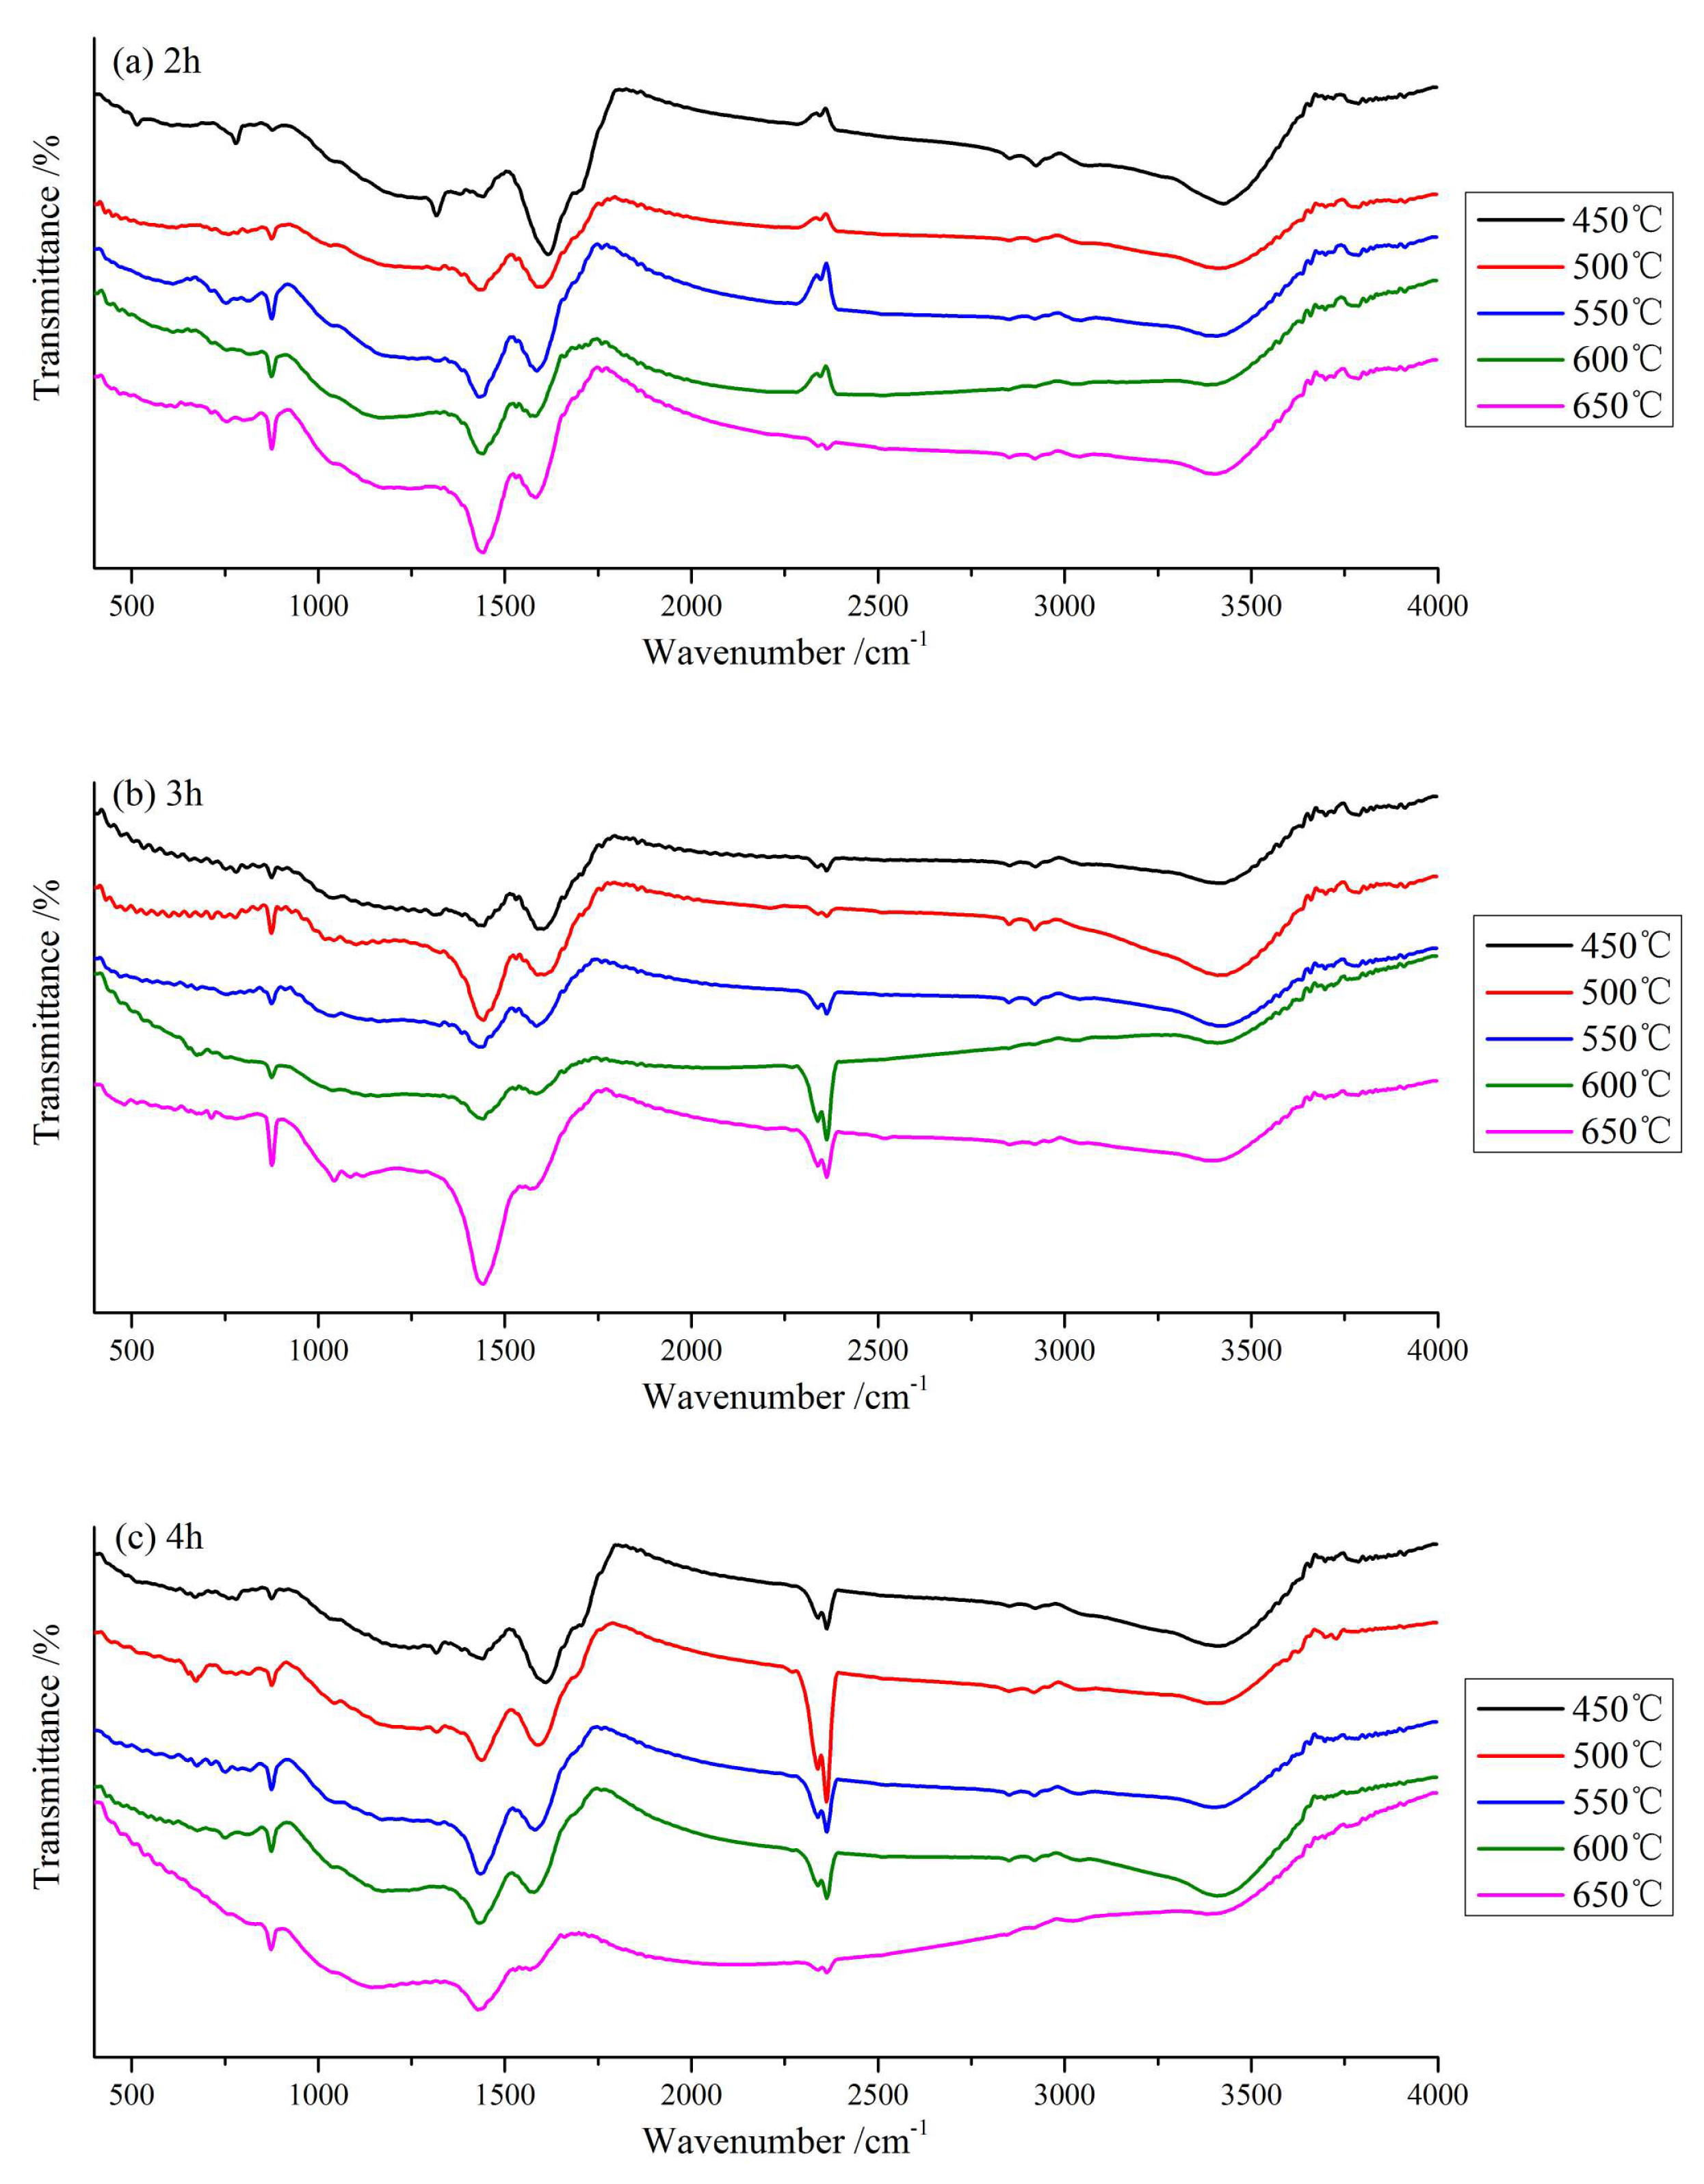
3.2.4. FTIR
3.3. Adsorption Application
3.3.1. Screening for Optimal Preparation Conditions
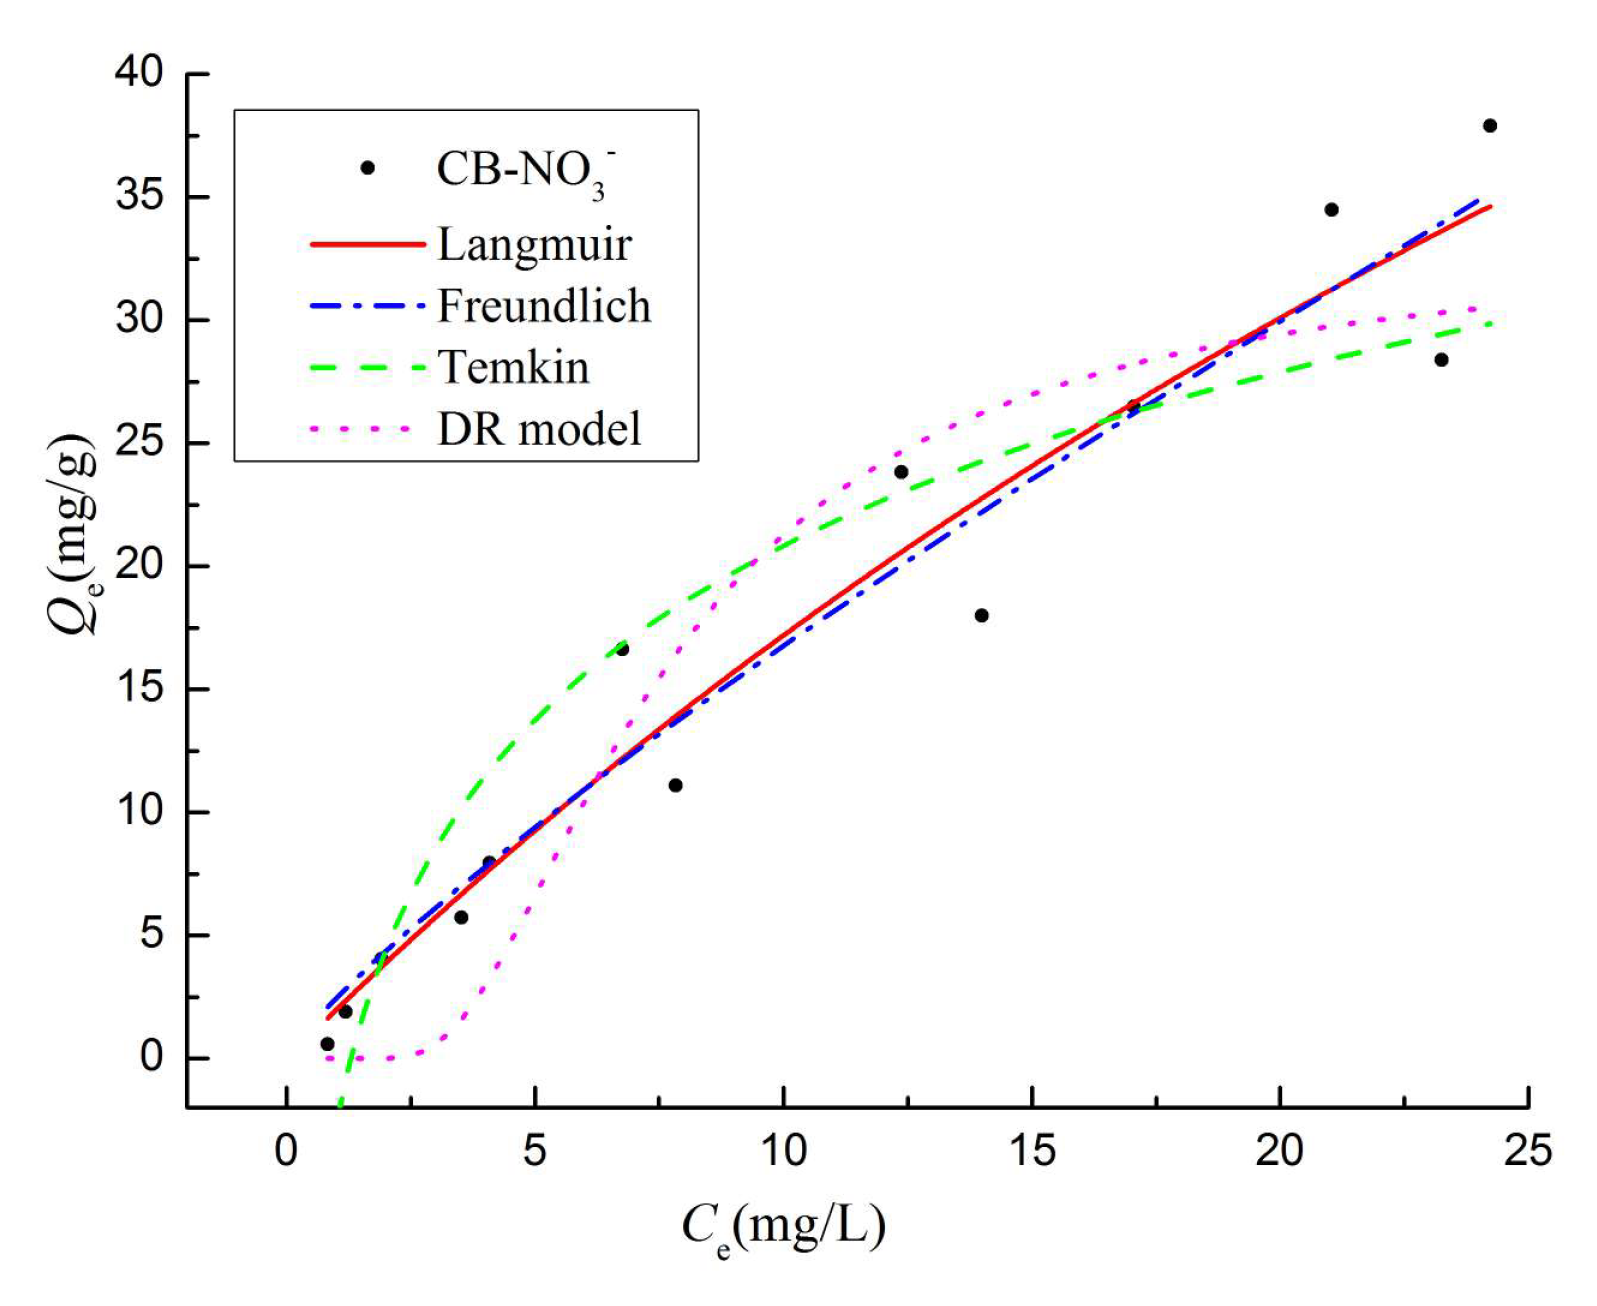
3.3.2. Isotherms Adsorption
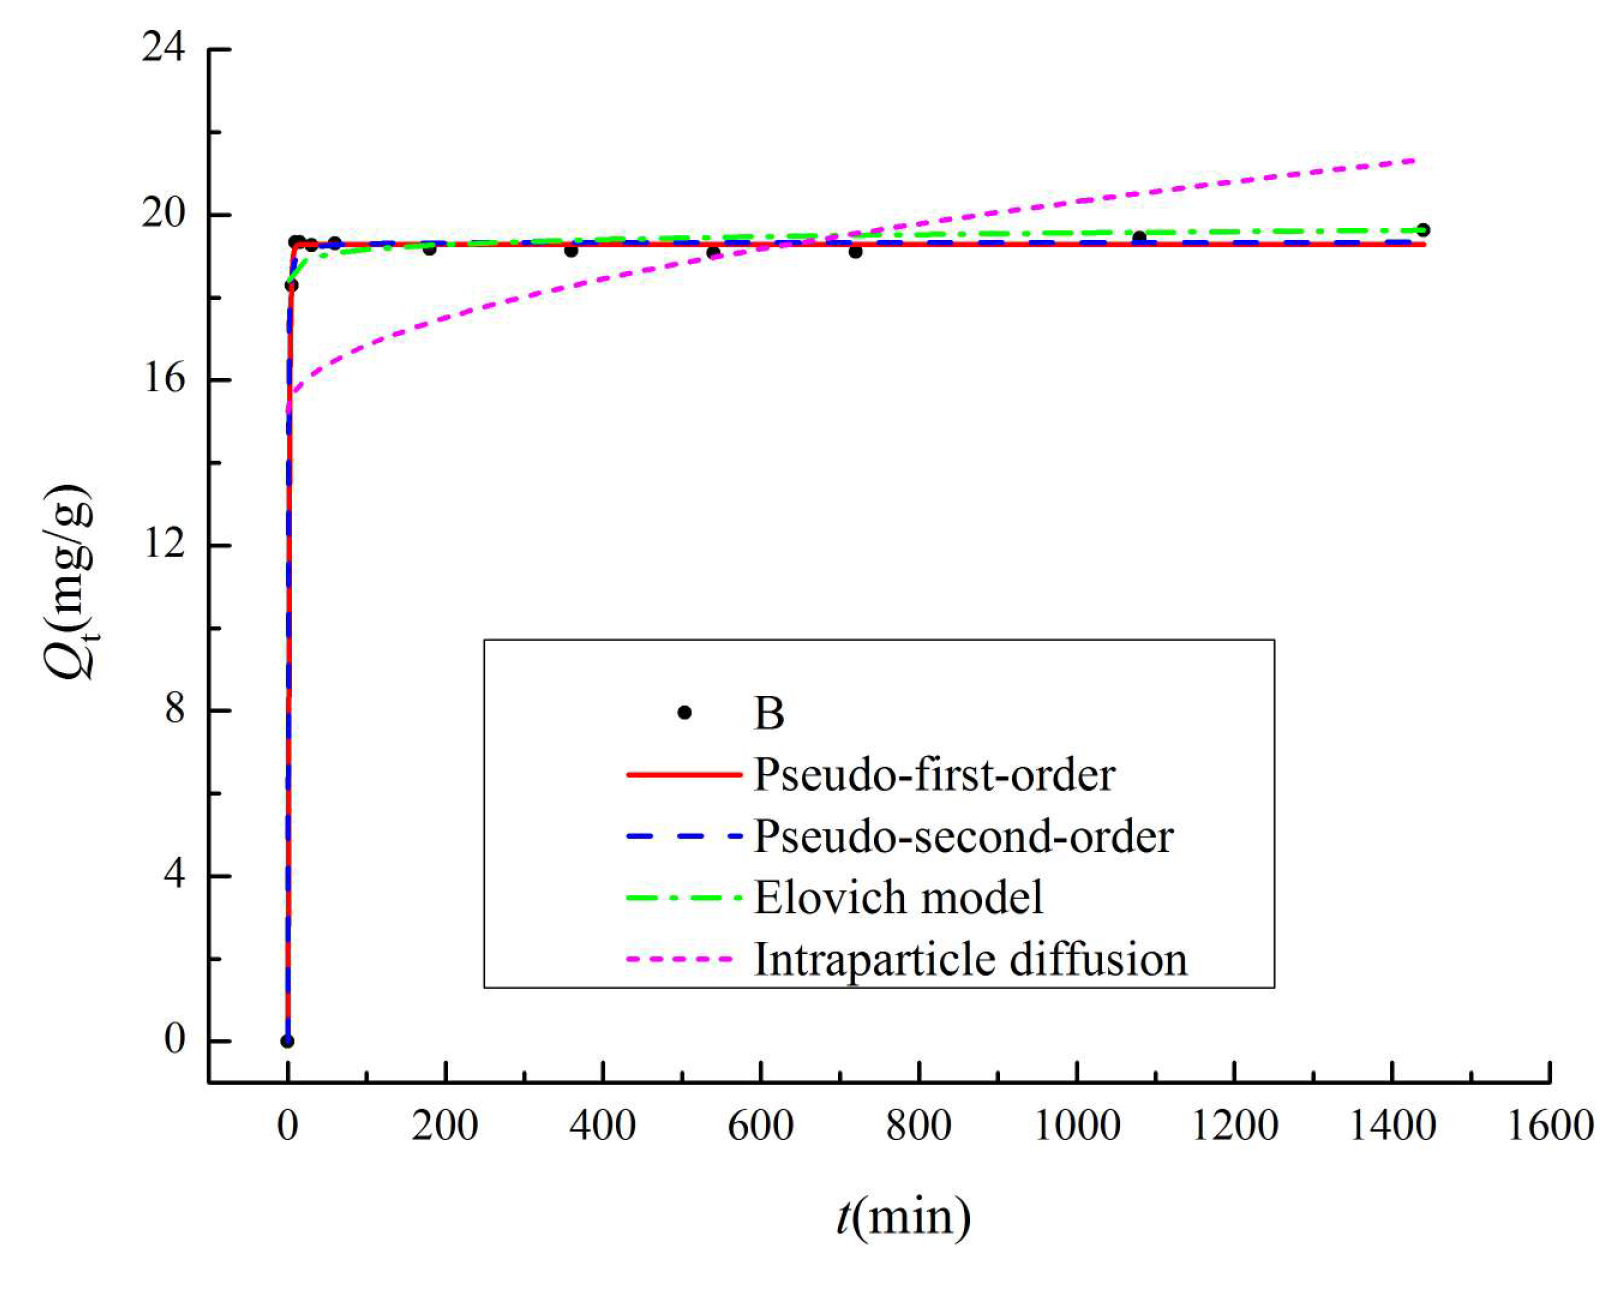
3.3.3. Adsorption Kinetics
3.4. By-Products and Process Analysis
4. Conclusions
Supplementary Materials
Author Contributions
Funding
Acknowledgments
Conflicts of Interest
References
- Liu, W.; Yu, Z.; Zhu, Q.; Zhou, X.; Peng, C. Assessment of biomass utilization potential of Caragana korshinskii and its effect on carbon sequestration on the Northern Shaanxi Loess Plateau, China. Land Degrad. Dev. 2019, 31, 53–64. [Google Scholar] [CrossRef]
- Long, Y.; Liang, F.; Zhang, J.; Xue, M.; Zhang, T.; Pei, X. Identification of drought response genes by digital gene expression (DGE) analysis in Caragana korshinskii Kom. Gene 2020, 725, 144170. [Google Scholar] [CrossRef]
- Wang, T.; Stewart, C.E.; Sun, C.; Wang, Y.; Zheng, J. Effects of biochar addition on evaporation in the five typical Loess Plateau soils. CATENA 2018, 162, 29–39. [Google Scholar] [CrossRef]
- Cui, Q.; Jiao, G.; Zheng, J.; Wang, T.; Wu, G.; Li, G. Synthesis of a novel magnetic Caragana korshinskii biochar/Mg–Al layered double hydroxide composite and its strong adsorption of phosphate in aqueous solutions. RSC Adv. 2019, 9, 18641–18651. [Google Scholar] [CrossRef] [Green Version]
- Dou, Y.; Yang, Y.; An, S. Above-Ground Biomass Models of Caragana korshinskii and Sophora viciifolia in the Loess Plateau, China. Sustainability 2019, 11, 1674. [Google Scholar] [CrossRef] [Green Version]
- Zheng, X.; Shi, T.; Song, W.; Xu, L.; Dong, J. Biochar of distillers’ grains anaerobic digestion residue: Influence of pyrolysis conditions on its characteristics and ammonium adsorptive optimization. Waste Manag. Res. 2020, 38, 86–97. [Google Scholar] [CrossRef]
- Alcantara, J.C.; Gonzalez, I.; Pareta, M.M.; Vilaseca, F. Biocomposites from Rice Straw Nanofibers: Morphology, Thermal and Mechanical Properties. Materials 2020, 13, 2138. [Google Scholar] [CrossRef]
- Zhang, Z.S.; Li, X.R.; Liu, L.C.; Jia, R.L.; Zhang, J.G.; Wang, T. Distribution, biomass, and dynamics of roots in a revegetated stand of Caragana korshinskii in the Tengger Desert, northwestern China. J. Plant Res. 2009, 122, 109–119. [Google Scholar] [CrossRef]
- Hoffmann, V.; Jung, D.; Zimmermann, J.; Correa, C.R.; Elleuch, A.; Halouani, K.; Kruse, A. Conductive Carbon Materials from the Hydrothermal Carbonization of Vineyard Residues for the Application in Electrochemical Double-Layer Capacitors (EDLCs) and Direct Carbon Fuel Cells (DCFCs). Materials 2019, 12, 1703. [Google Scholar] [CrossRef] [Green Version]
- Lehmann, J.; Rillig, M.C.; Thies, J.; Masiello, C.A.; Hockaday, W.C.; Crowley, D. Biochar effects on soil biota—A review. Soil Biol. Biochem. 2011, 43, 1812–1836. [Google Scholar] [CrossRef]
- Cui, Q.; Xu, J.; Wang, W.; Tan, L.; Cui, Y.; Wang, T.; Li, G.; She, D.; Zheng, J. Phosphorus recovery by core-shell γ-Al2O3/Fe3O4 biochar composite from aqueous phosphate solutions. Sci. Total Environ. 2020, 729, 138892. [Google Scholar] [CrossRef] [PubMed]
- Wang, T.; Stewart, C.E.; Ma, J.; Zheng, J.; Zhang, X. Applicability of five models to simulate water infiltration into soil with added biochar. J. Arid Land 2017, 9, 701–711. [Google Scholar] [CrossRef]
- Zhao, N.; Yang, X.; Zhang, J.; Zhu, L.; Lv, Y. Adsorption Mechanisms of Dodecylbenzene Sulfonic Acid by Corn Straw and Poplar Leaf Biochars. Materials 2017, 10, 1119. [Google Scholar] [CrossRef]
- Irfan, M.; Lin, Q.; Yue, Y.; Ruan, X.; Chen, Q.; Zhao, X.; Dong, X. Co-production of Biochar, Bio-oil, and Syngas from Tamarix chinensis Biomass under Three Different Pyrolysis Temperatures. Bioresources 2016, 11, 8929–8940. [Google Scholar] [CrossRef] [Green Version]
- Inyang, M.I.; Gao, B.; Yao, Y.; Xue, Y.; Zimmerman, A.; Mosa, A.; Pullammanappallil, P.; Ok, Y.S.; Cao, X. A review of biochar as a low-cost adsorbent for aqueous heavy metal removal. Crit. Rev. Environ. Sci. Technol. 2015, 46, 406–433. [Google Scholar] [CrossRef]
- Chen, Z.; Liu, T.; Tang, J.; Zheng, Z.; Wang, H.; Shao, Q.; Chen, G.; Li, Z.; Chen, Y.; Zhu, J.; et al. Characteristics and mechanisms of cadmium adsorption from aqueous solution using lotus seedpod-derived biochar at two pyrolytic temperatures. Environ. Sci. Pollut. Res. Int. 2018, 25, 11854–11866. [Google Scholar] [CrossRef] [PubMed]
- Fan, L.; Zhou, X.; Liu, Q.; Wan, Y.; Cai, J.; Chen, W.; Chen, F.; Ji, L.; Cheng, L.; Luo, H. Properties of Eupatorium adenophora Spreng (Crofton Weed) Biochar Produced at Different Pyrolysis Temperatures. Environ. Eng. Sci. 2019, 36, 937–946. [Google Scholar] [CrossRef]
- Xue, Y.; Wang, C.; Hu, Z.; Zhou, Y.; Xiao, Y.; Wang, T. Pyrolysis of sewage sludge by electromagnetic induction: Biochar properties and application in adsorption removal of Pb(II), Cd(II) from aqueous solution. Waste Manag. 2019, 89, 48–56. [Google Scholar] [CrossRef]
- Rodriguez Correa, C.; Kruse, A. Biobased Functional Carbon Materials: Production, Characterization, and Applications—A Review. Materials 2018, 11, 1568. [Google Scholar] [CrossRef] [Green Version]
- Zhang, X.; Zhu, J.; Wu, C.; Wu, Q.; Liu, K.; Jiang, K. Preparation and Properties of Wood Tar-based Rejuvenated Asphalt. Materials 2020, 13, 1123. [Google Scholar] [CrossRef] [Green Version]
- Cui, Y.; Wang, W.; Chang, J. Study on the Product Characteristics of Pyrolysis Lignin with Calcium Salt Additives. Materials 2019, 12, 1609. [Google Scholar] [CrossRef] [PubMed] [Green Version]
- Mo, H.; Qiu, J.; Yang, C.; Zang, L.; Sakai, E. Preparation and characterization of magnetic polyporous biochar for cellulase immobilization by physical adsorption. Cellulose 2020, 27, 4963–4973. [Google Scholar] [CrossRef]
- Li, S.; Yao, Y.; Zhao, T.; Wang, M.; Wu, F. Biochars preparation from waste sludge and composts under different carbonization conditions and their Pb(II) adsorption behaviors. Water Sci. Technol. 2019, 80, 1063–1075. [Google Scholar] [CrossRef]
- Wang, Z.; Li, J.; Zhang, G.; Zhi, Y.; Yang, D.; Lai, X.; Ren, T. Characterization of Acid-Aged Biochar and its Ammonium Adsorption in an Aqueous Solution. Materials 2020, 13, 2270. [Google Scholar] [CrossRef] [PubMed]
- Li, S.; Barreto, V.; Li, R.; Chen, G.; Hsieh, Y.P. Nitrogen retention of biochar derived from different feedstocks at variable pyrolysis temperatures. J. Anal. Appl. Pyrolysis 2018, 133, 136–146. [Google Scholar] [CrossRef]
- Dai, Y.; Wang, W.; Lu, L.; Yan, L.; Yu, D. Utilization of biochar for the removal of nitrogen and phosphorus. J. Clean. Prod. 2020, 257, 120573. [Google Scholar] [CrossRef]
- Luo, L.; Wang, G.; Shi, G.; Zhang, M.; Zhang, J.; He, J.; Xiao, Y.; Tian, D.; Zhang, Y.; Deng, S.; et al. The characterization of biochars derived from rice straw and swine manure, and their potential and risk in N and P removal from water. J. Environ. Manag. 2019, 245, 1–7. [Google Scholar] [CrossRef]
- Jiang, Y.H.; Li, A.Y.; Deng, H.; Ye, C.H.; Wu, Y.Q.; Linmu, Y.D.; Hang, H.L. Characteristics of nitrogen and phosphorus adsorption by Mg-loaded biochar from different feedstocks. Bioresour. Technol. 2019, 276, 183–189. [Google Scholar] [CrossRef]
- Min, L.; Zhongsheng, Z.; Zhe, L.; Haitao, W. Removal of nitrogen and phosphorus pollutants from water by FeCl3- impregnated biochar. Ecol. Eng. 2020, 149, 105792. [Google Scholar] [CrossRef]
- Tümsek, F.; Avcı, Ö. Investigation of Kinetics and Isotherm Models for the Acid Orange 95 Adsorption from Aqueous Solution onto Natural Minerals. J. Chem. Eng. Data 2013, 58, 551–559. [Google Scholar] [CrossRef]
- Tan, X.F.; Liu, Y.G.; Gu, Y.L.; Xu, Y.; Zeng, G.M.; Hu, X.J.; Liu, S.B.; Wang, X.; Liu, S.M.; Li, J. Biochar-based nano-composites for the decontamination of wastewater: A review. Bioresour. Technol. 2016, 212, 318–333. [Google Scholar] [CrossRef]
- Tsai, W.-T.; Huang, C.-N.; Chen, H.-R.; Cheng, H.-Y. Pyrolytic Conversion of Horse Manure into Biochar and Its Thermochemical and Physical Properties. Waste Biomass Valorization 2015, 6, 975–981. [Google Scholar] [CrossRef]
- Shen, Z.; Jin, F.; Wang, F.; McMillan, O.; Al-Tabbaa, A. Sorption of lead by Salisbury biochar produced from British broadleaf hardwood. Bioresour. Technol. 2015, 193, 553–556. [Google Scholar] [CrossRef] [PubMed] [Green Version]
- Shaaban, A.; Se, S.-M.; Dimin, M.F.; Juoi, J.M.; Husin, M.H.M.; Mitan, N.M.M. Influence of heating temperature and holding time on biochars derived from rubber wood sawdust via slow pyrolysis. J. Anal. Appl. Pyrolysis 2014, 107, 31–39. [Google Scholar] [CrossRef]
- Yao, Y.; Gao, B.; Zhang, M.; Inyang, M.; Zimmerman, A.R. Effect of biochar amendment on sorption and leaching of nitrate, ammonium, and phosphate in a sandy soil. Chemosphere 2012, 89, 1467–1471. [Google Scholar] [CrossRef]
- Singh, B.; Singh, B.P.; Cowie, A.L. Characterisation and evaluation of biochars for their application as a soil amendment. Aust. J. Soil Res. 2010, 48, 516–525. [Google Scholar] [CrossRef]
- Ahmad, Z.; Gao, B.; Mosa, A.; Yu, H.; Yin, X.; Bashir, A.; Ghoveisi, H.; Wang, S. Removal of Cu(II), Cd(II) and Pb(II) ions from aqueous solutions by biochars derived from potassium-rich biomass. J. Clean. Prod. 2018, 180, 437–449. [Google Scholar] [CrossRef]
- Cantrell, K.B.; Hunt, P.G.; Uchimiya, M.; Novak, J.M.; Ro, K.S. Impact of pyrolysis temperature and manure source on physicochemical characteristics of biochar. Bioresour. Technol. 2012, 107, 419–428. [Google Scholar] [CrossRef]
- Guo, Y.; Rockstraw, D.A. Activated carbons prepared from rice hull by one-step phosphoric acid activation. Microporous Mesoporous Mater. 2007, 100, 12–19. [Google Scholar] [CrossRef]
- Liang, B.; Lehmann, J.; Solomon, D.; Kinyangi, J.; Grossman, J.; O’Neill, B.; Skjemstad, J.O.; Thies, J.; Luizao, F.J.; Petersen, J.; et al. Black Carbon increases cation exchange capacity in soils. Soil Sci. Soc. Am. J. 2006, 70, 1719–1730. [Google Scholar] [CrossRef] [Green Version]
- Chen, T.; Zhang, Y.; Wang, H.; Lu, W.; Zhou, Z.; Zhang, Y.; Ren, L. Influence of pyrolysis temperature on characteristics and heavy metal adsorptive performance of biochar derived from municipal sewage sludge. Bioresour. Technol. 2014, 164, 47–54. [Google Scholar] [CrossRef]
- Goliszek, M.; Podkoscielna, B.; Sevastyanova, O.; Gawdzik, B.; Chabros, A. The Influence of Lignin Diversity on the Structural and Thermal Properties of Polymeric Microspheres Derived from Lignin, Styrene, and/or Divinylbenzene. Materials 2019, 12, 2847. [Google Scholar] [CrossRef] [Green Version]
- Tong, Y.; McNamara, P.J.; Mayer, B.K. Adsorption of organic micropollutants onto biochar: A review of relevant kinetics, mechanisms and equilibrium. Environ. Sci. -Water Res. Technol. 2019, 5, 821–838. [Google Scholar] [CrossRef]
- Butt, M.T.Z.; Preuss, K.; Titirici, M.-M.; Rehman, H.U.; Briscoe, J. Biomass-Derived Nitrogen-Doped Carbon Aerogel Counter Electrodes for Dye Sensitized Solar Cells. Materials 2018, 11, 1171. [Google Scholar] [CrossRef] [PubMed] [Green Version]
- Hverett, D.H. IUPAC manual of symbols and terminology for physicochemical quantities and units. Pure Appl. Chem. 1972, 31, 579–638. [Google Scholar]
- Tan, L.; Ma, Z.; Yang, K.; Cui, Q.; Wang, K.; Wang, T.; Wu, G.L.; Zheng, J. Effect of three artificial aging techniques on physicochemical properties and Pb adsorption capacities of different biochars. Sci. Total Environ. 2019, 699, 134223. [Google Scholar] [CrossRef] [PubMed]
- Angin, D. Effect of pyrolysis temperature and heating rate on biochar obtained from pyrolysis of safflower seed press cake. Bioresour. Technol. 2013, 128, 593–597. [Google Scholar] [CrossRef]
- Cimo, G.; Kucerik, J.; Berns, A.E.; Schaumann, G.E.; Alonzo, G.; Conte, P. Effect of Heating Time and Temperature on the Chemical Characteristics of Biochar from Poultry Manure. J. Agric. Food Chem. 2014, 62, 1912–1918. [Google Scholar] [CrossRef] [Green Version]
- Kalinke, C.; Mangrich, A.S.; Marcolino-Junior, L.H.; Bergamini, M.F. Biochar prepared from castor oil cake at different temperatures: A voltammetric study applied for Pb(2+), Cd(2+) and Cu(2+) ions preconcentration. J. Hazard. Mater. 2016, 318, 526–532. [Google Scholar] [CrossRef]
- Mishra, P.C.; Patel, R.K. Use of agricultural waste for the removal of nitrate-nitrogen from aqueous medium. J. Environ. Manag. 2009, 90, 519–522. [Google Scholar] [CrossRef]
- Chintala, R.; Mollinedo, J.; Schumacher, T.E.; Papiernik, S.K.; Malo, D.D.; Clay, D.E.; Kumar, S.; Gulbrandson, D.W. Nitrate sorption and desorption in biochars from fast pyrolysis. Microporous Mesoporous Mater. 2013, 179, 250–257. [Google Scholar] [CrossRef]
- Demiral, H.; Gunduzoglu, G. Removal of nitrate from aqueous solutions by activated carbon prepared from sugar beet bagasse. Bioresour. Technol. 2010, 101, 1675–1680. [Google Scholar] [CrossRef] [PubMed]
- Pratiwi, E.P.A.; Hillary, A.K.; Fukuda, T.; Shinogi, Y. The effects of rice husk char on ammonium, nitrate and phosphate retention and leaching in loamy soil. Geoderma 2016, 277, 61–68. [Google Scholar] [CrossRef]
- Alsewaileh, A.S.; Usman, A.R.; Al-Wabel, M.I. Effects of pyrolysis temperature on nitrate-nitrogen (NO3−-N) and bromate (BrO3−) adsorption onto date palm biochar. J. Environ. Manag. 2019, 237, 289–296. [Google Scholar] [CrossRef]
- Kalaruban, M.; Loganathan, P.; Shim, W.G.; Kandasamy, J.; Ngo, H.H.; Vigneswaran, S. Enhanced removal of nitrate from water using amine-grafted agricultural wastes. Sci. Total Environ. 2016, 565, 503–510. [Google Scholar] [CrossRef]
- Cui, Y.; Hou, X.; Wang, W.; Chang, J. Synthesis and Characterization of Bio-Oil Phenol Formaldehyde Resin Used to Fabricate Phenolic Based Materials. Materials 2017, 10, 668. [Google Scholar] [CrossRef] [Green Version]
- Khuenkaeo, N.; Tippayawong, N. Production and characterization of bio-oil and biochar from ablative pyrolysis of lignocellulosic biomass residues. Chem. Eng. Commun. 2020, 207, 153–160. [Google Scholar] [CrossRef]
- Lu, H.R.; El Hanandeh, A. Life cycle perspective of bio-oil and biochar production from hardwood biomass; what is the optimum mix and what to do with it? J. Clean. Prod. 2019, 212, 173–189. [Google Scholar] [CrossRef]
- Zhixia, Z.; Jing, W.; Jun, M.; Wenfu, C. Study of Biochar Pyrolysis Mechanism and Production Technology. Appl. Mech. Mater. 2015, 709, 364–369. [Google Scholar]
- Fakayode, O.A.; Aboagarib, E.A.A.; Zhou, C.; Ma, H. Co-pyrolysis of lignocellulosic and macroalgae biomasses for the production of biochar—A review. Bioresour. Technol. 2020, 297, 122408. [Google Scholar] [CrossRef]


| Models | Expression | Parameters |
|---|---|---|
| Langmuir | , | Qm, a |
| Freundlich | Qe = KFCe1/n | KF, 1/n |
| Temkin | Qe = BlnA + BlnCe | A, B |
| Dubinin-Radushkevich (D-R) model | , | Q0, β, ε,E |
| Pseudo-first-order | Qe, k1 | |
| Pseudo-second-order | , | Qe, k2, h |
| Elovich model | a′, b | |
| Intraparticle diffusion | C, ki |
| biochar | C (%) | O (%) | N (%) | O/C | N/C | (O + N)/C | pH | CEC (cmol·kg−1) | Yield (%) |
|---|---|---|---|---|---|---|---|---|---|
| CB450(2h) | 77.99 | 16.18 | 3.10 | 0.21 | 0.04 | 0.25 | 6.65 | 62.51 | 33.12 |
| CB500(2h) | 78.25 | 15.6 | 2.05 | 0.2 | 0.03 | 0.23 | 8.55 | 66.12 | 33.00 |
| CB550(2h) | 77.9 | 13.52 | 1.26 | 0.17 | 0.02 | 0.19 | 8.80 | 35.00 | 28.93 |
| CB600(2h) | 82.17 | 12.52 | 1.10 | 0.15 | 0.01 | 0.17 | 8.96 | 16.64 | 25.94 |
| CB650(2h) | 85.1 | 10.04 | 0.84 | 0.12 | 0.01 | 0.13 | 8.93 | 46.44 | 27.24 |
| CB450(3h) | 65.73 | 22.9 | 2.79 | 0.35 | 0.04 | 0.39 | 8.04 | 55.72 | 33.23 |
| CB500(3h) | 74.55 | 18.73 | 2.41 | 0.25 | 0.03 | 0.28 | 7.72 | 74.42 | 31.80 |
| CB550(3h) | 77.02 | 16.84 | 2.13 | 0.22 | 0.03 | 0.25 | 8.84 | 31.97 | 31.43 |
| CB600(3h) | 79.12 | 13.19 | 1.47 | 0.17 | 0.02 | 0.19 | 8.97 | 20.48 | 28.20 |
| CB650(3h) | 85.31 | 10.59 | 0.72 | 0.12 | 0.01 | 0.13 | 8.99 | 38.93 | 23.08 |
| CB450(4h) | 74.35 | 18.17 | 3.28 | 0.24 | 0.04 | 0.29 | 7.51 | 81.40 | 30.31 |
| CB500(4h) | 72.13 | 18.83 | 2.95 | 0.26 | 0.04 | 0.30 | 8.74 | 44.62 | 29.78 |
| CB550(4h) | 81.42 | 11.52 | 2.14 | 0.14 | 0.03 | 0.17 | 8.99 | 32.91 | 28.65 |
| CB600(4h) | 79.79 | 12.92 | 1.5 | 0.16 | 0.02 | 0.18 | 8.68 | 30.66 | 27.56 |
| CB650(4h) | 81.04 | 10.86 | 0.62 | 0.13 | 0.01 | 0.14 | 8.97 | 17.75 | 27.38 |
| Models | Langmuir | Freundlich | Temkin | D-R Model | |||||||||
|---|---|---|---|---|---|---|---|---|---|---|---|---|---|
| a | Qm (mg·g−1) | RL | R2 | KF | n | R2 | A | B | R2 | Q0 (mmol·g−1) | E (kJ·mol−1) | R2 | |
| CB (650 °C/3 h) | 0.02 | 120.65 | 0.0008-0.97 | 0.9364 | 2.45 | 1.20 | 0.9355 | 0.77 | 10.21 | 0.8506 | 33.04 | 2.52 | 0.8568 |
| Models | Pseudo-First-Order | Pseudo-Second-Order | Elovich | Intraparticle Diffusion | |||||||||
|---|---|---|---|---|---|---|---|---|---|---|---|---|---|
| Qe (mg·g−1) | k1 | R2 | Qe (mg·g−1) | k2 | H (mg·g−1·min−1) | R2 | a′ | b | R2 | ki | C | R2 | |
| CB(650 °C/3 h) | 19.28 | 1.37 | 0.9991 | 19.45 | 0.001 | 0.38 | 0.9998 | 4.68 | 5.70 | 0.9959 | 0.16 | 15.23 | 0.06 |
| Raw Materials | Temperature (°C) 1 | Time (h) 1 | Maximum Adsorption Capacity (mg·g−1) 2 | Literature |
|---|---|---|---|---|
| Wheat straw | 300 | 1 | 1.10 | [50] |
| Mustard straw | 300 | 1 | 1.30 | [50] |
| Ponderosa pine wood | 650 | 0.3 | 6.20 | [51] |
| Switchgrass | 650 | 0.3 | 1.84 | [51] |
| Corn stover | 650 | 0.3 | 6.25 | [51] |
| Sugar beet bagasse | 700 | 1.5 | 9.14 | [52] |
| Rice husk | 600 | - | 2.1 | [53] |
| Date palm | 700 | 4 | 8.37 | [54] |
| Fe-impregnated corn stalk | 550 | 0.5 | 15.41 | [29] |
| ZnCl2 activated Sugar beet bagasse | 700 | 1.5 | 27.55 | [52] |
| Amine-grafted corn cob | 100 | 24 | 49.9 | [55] |
| Amine-grafted coconut copra | 100 | 48 | 59.2 | [55] |
| Caragana korshinskii | 650 | 3 | 120.65 | This work |
| Number | Library (ID) | CAS | Quality (%) | Peak Area (%) |
|---|---|---|---|---|
| 1 | 2-Furanmethanol | 000098-00-0 | 90 | 2.40 |
| 2 | Pyridine, 3-methyl- | 000108-99-6 | 92 | 1.22 |
| 3 | 2,6-Lutidine | 000108-48-5 | 70 | 0.39 |
| 4 | 2-Cyclopenten-1-one, 2-methyl- | 001120-73-6 | 80 | 1.73 |
| 5 | Pyridine, 3,5-dimethyl- | 000591-22-0 | 90 | 0.80 |
| 6 | Pyridine, 2,3-dimethyl- | 000583-61-9 | 94 | 0.50 |
| 7 | 2-Cyclopenten-1-one, 3-methyl- | 002758-18-1 | 91 | 2.49 |
| 8 | Phenol | 000108-95-2 | 91 | 4.24 |
| 9 | 3-Methylpyridazine | 001632-76-4 | 64 | 0.22 |
| 10 | Pyridine, 3-methoxy- | 007295-76-3 | 80 | 0.54 |
| 11 | 1,2-Cyclopentanedione, 3-methyl- | 000765-70-8 | 95 | 6.70 |
| 12 | 2-Cyclopenten-1-one, 2,3-dimethyl- | 001121-05-7 | 90 | 1.18 |
| 13 | Phenol, 2-methyl- | 000095-48-7 | 97 | 2.12 |
| 14 | p-Cresol | 000106-44-5 | 95 | 5.51 |
| 15 | Phenol, 2-methoxy- | 000090-05-1 | 94 | 5.08 |
| 16 | Phenol, 2,6-dimethyl- | 000576-26-1 | 76 | 0.12 |
| 17 | Maltol | 000118-71-8 | 62 | 0.17 |
| 18 | 2-Cyclopenten-1-one, 3-ethyl-2-hydroxy- | 021835-01-8 | 97 | 1.67 |
| 19 | Phenol, 2,4-dimethyl- | 000105-67-9 | 95 | 2.92 |
| 20 | Phenol, 4-ethyl- | 000123-07-9 | 93 | 0.78 |
| 21 | Naphthalene | 000091-20-3 | 87 | 1.39 |
| 22 | Creosol | 000093-51-6 | 97 | 3.37 |
| 23 | 1,4:3,6-Dianhydro-.alpha.-d-glucopyranose | 1000098-14-8 | 95 | 2.63 |
| 24 | Phenol, 4-ethyl-3-methyl- | 001123-94-0 | 64 | 0.75 |
| 25 | 1,2-Benzenediol, 3-methoxy- | 000934-00-9 | 94 | 2.33 |
| 26 | 4-Methoxybenzene-1,2-diol | 003934-97-2 | 62 | 1.27 |
| 27 | Phenol, 4-ethyl-2-methoxy- | 002785-89-9 | 90 | 2.70 |
| 28 | Naphthalene, 2-methyl- | 000091-57-6 | 97 | 2.33 |
| 29 | Phenol, 2,6-dimethoxy- | 000091-10-1 | 96 | 6.54 |
| 30 | Naphthalene, 1,3-dimethyl- | 000575-41-7 | 94 | 0.69 |
| 31 | Naphthalene, 1,5-dimethyl- | 000571-61-9 | 95 | 0.61 |
| 32 | 3,5-Dimethoxy-4-hydroxytoluene | 006638-05-7 | 96 | 3.51 |
© 2020 by the authors. Licensee MDPI, Basel, Switzerland. This article is an open access article distributed under the terms and conditions of the Creative Commons Attribution (CC BY) license (http://creativecommons.org/licenses/by/4.0/).
Share and Cite
Wang, T.; Liu, H.; Duan, C.; Xu, R.; Zhang, Z.; She, D.; Zheng, J. The Eco-Friendly Biochar and Valuable Bio-Oil from Caragana korshinskii: Pyrolysis Preparation, Characterization, and Adsorption Applications. Materials 2020, 13, 3391. https://doi.org/10.3390/ma13153391
Wang T, Liu H, Duan C, Xu R, Zhang Z, She D, Zheng J. The Eco-Friendly Biochar and Valuable Bio-Oil from Caragana korshinskii: Pyrolysis Preparation, Characterization, and Adsorption Applications. Materials. 2020; 13(15):3391. https://doi.org/10.3390/ma13153391
Chicago/Turabian StyleWang, Tongtong, Hongtao Liu, Cuihua Duan, Rui Xu, Zhiqin Zhang, Diao She, and Jiyong Zheng. 2020. "The Eco-Friendly Biochar and Valuable Bio-Oil from Caragana korshinskii: Pyrolysis Preparation, Characterization, and Adsorption Applications" Materials 13, no. 15: 3391. https://doi.org/10.3390/ma13153391