Influence of Pd Doping on Electrical and Thermal Properties of n-Type Cu0.008Bi2Te2.7Se0.3 Alloys

 ,
,  , and
, and 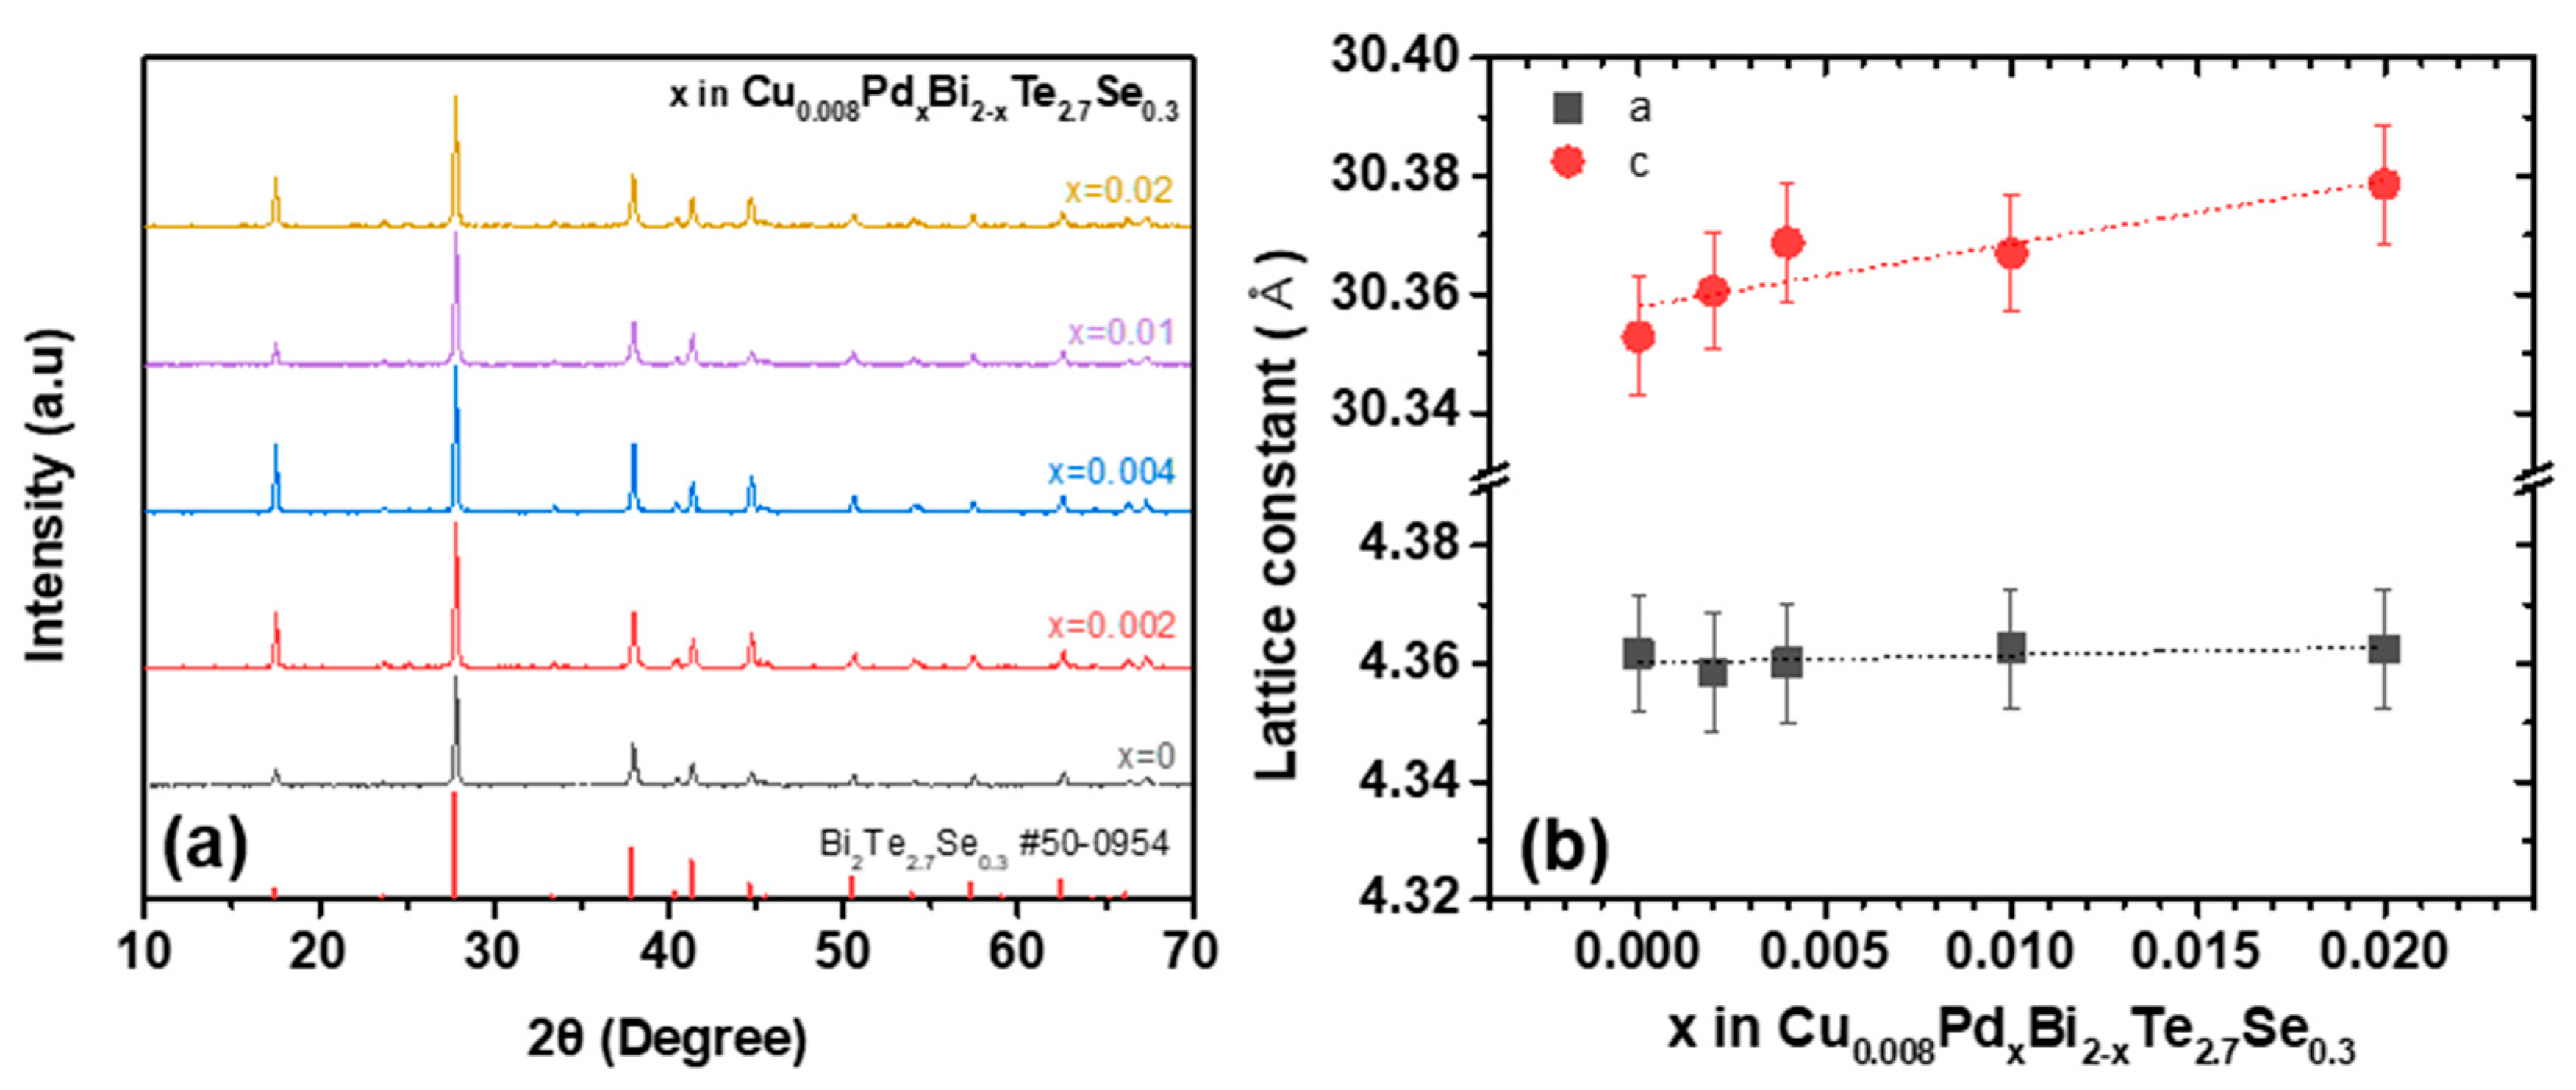
Abstract
:1. Introduction
2. Materials and Methods
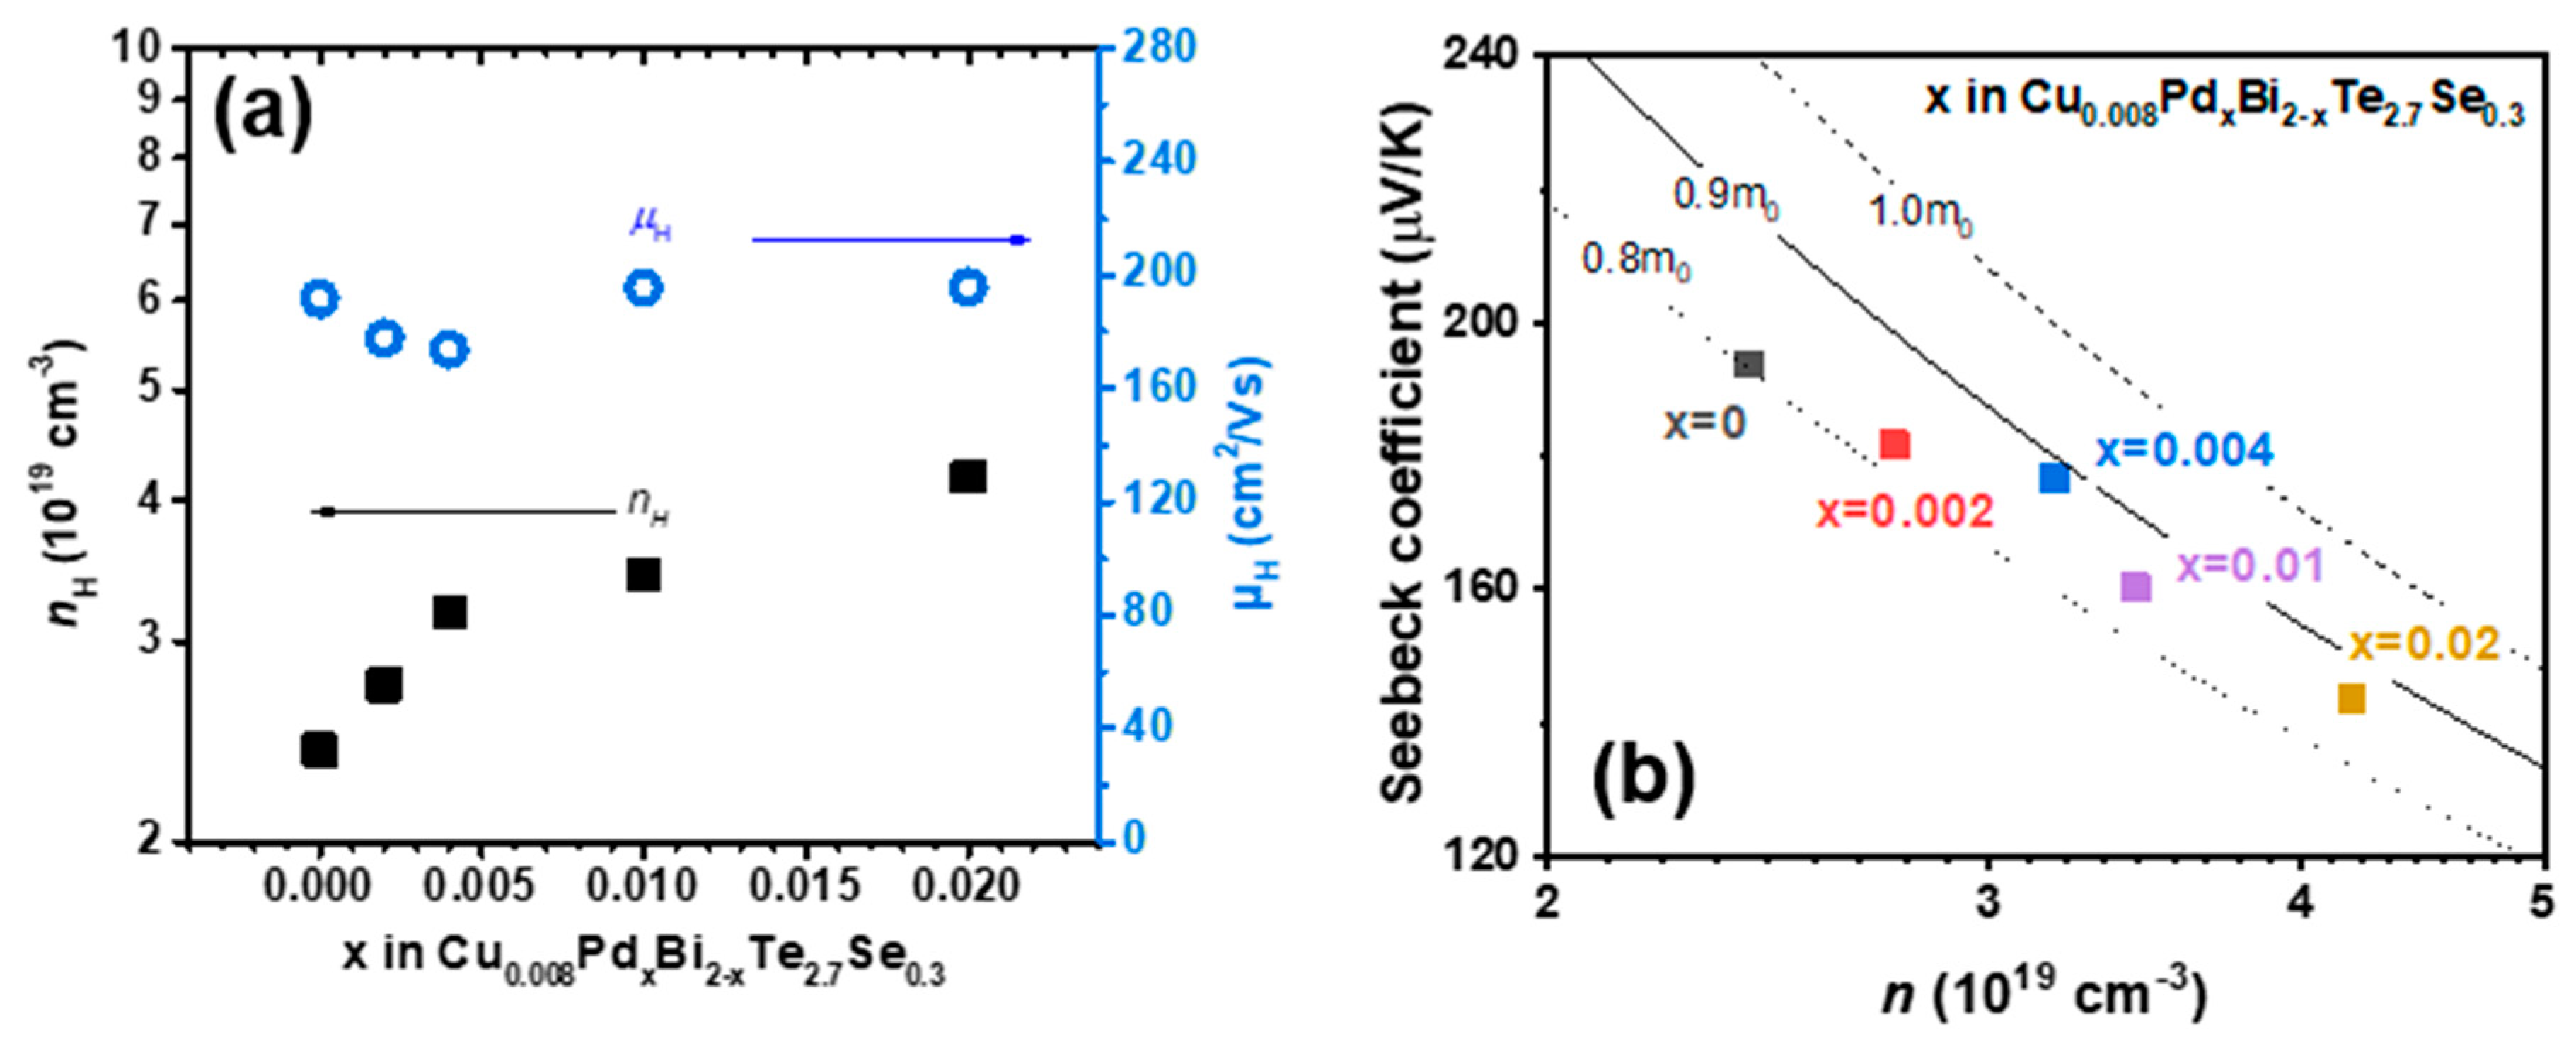
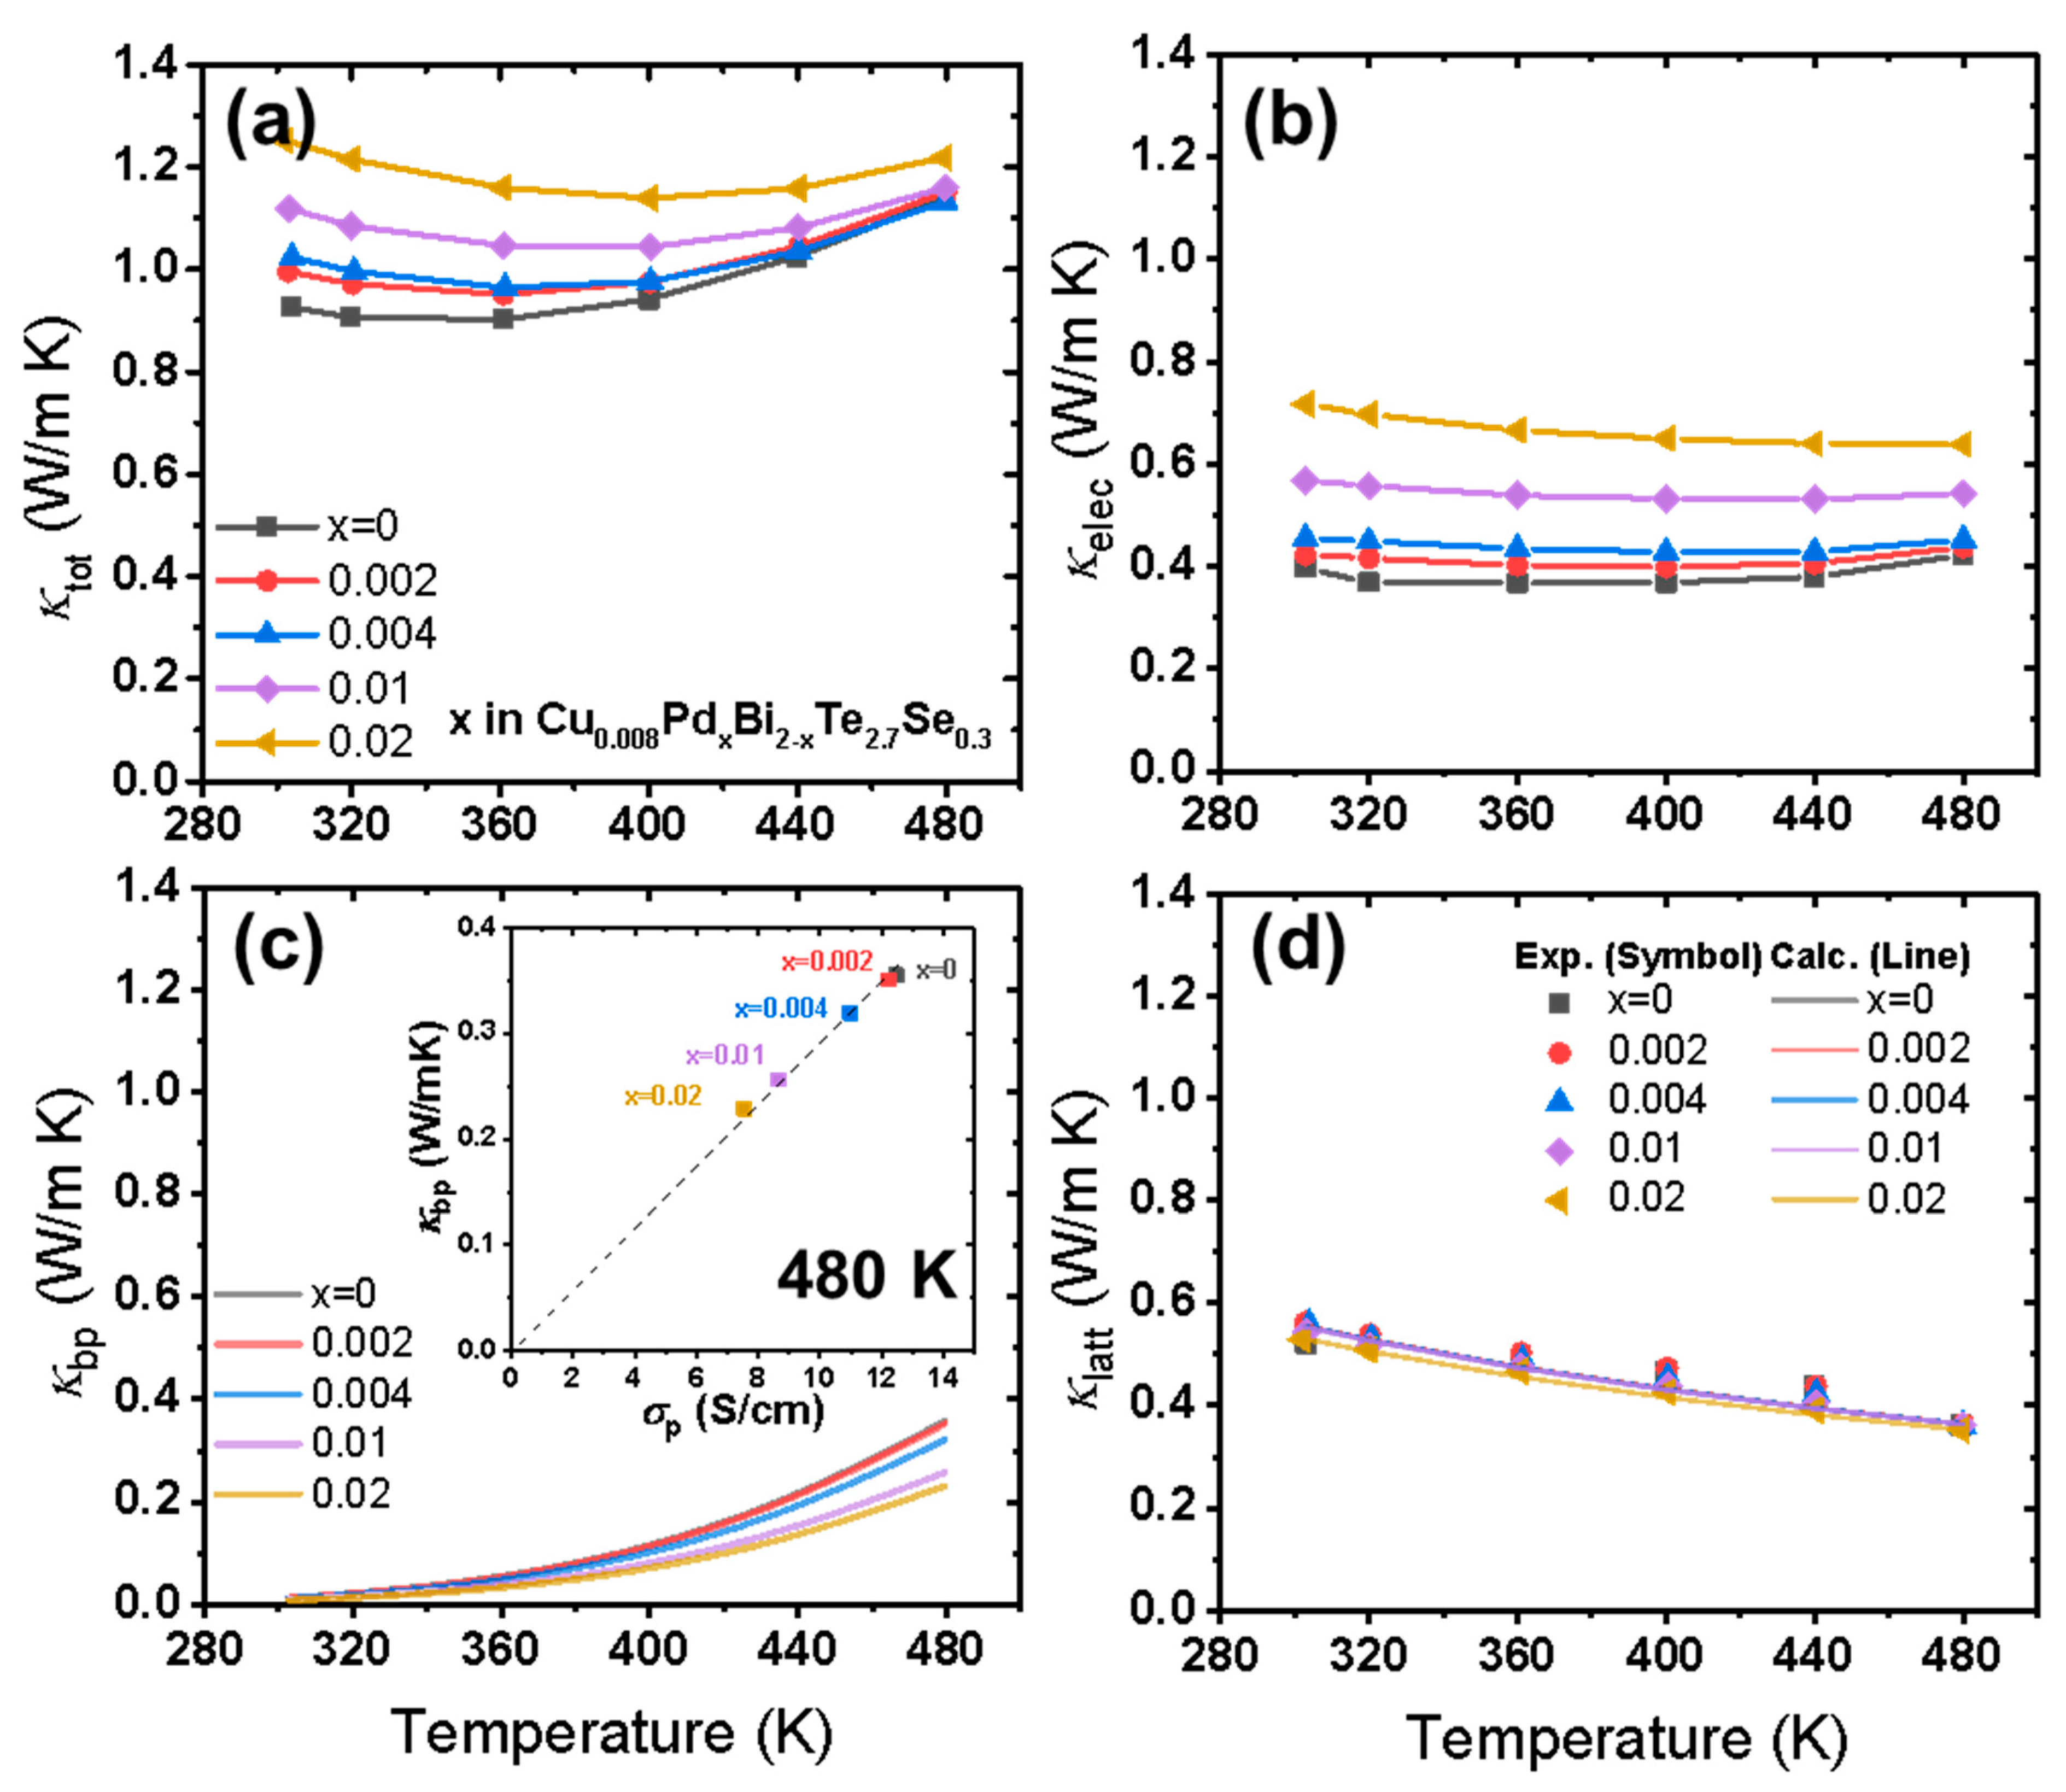
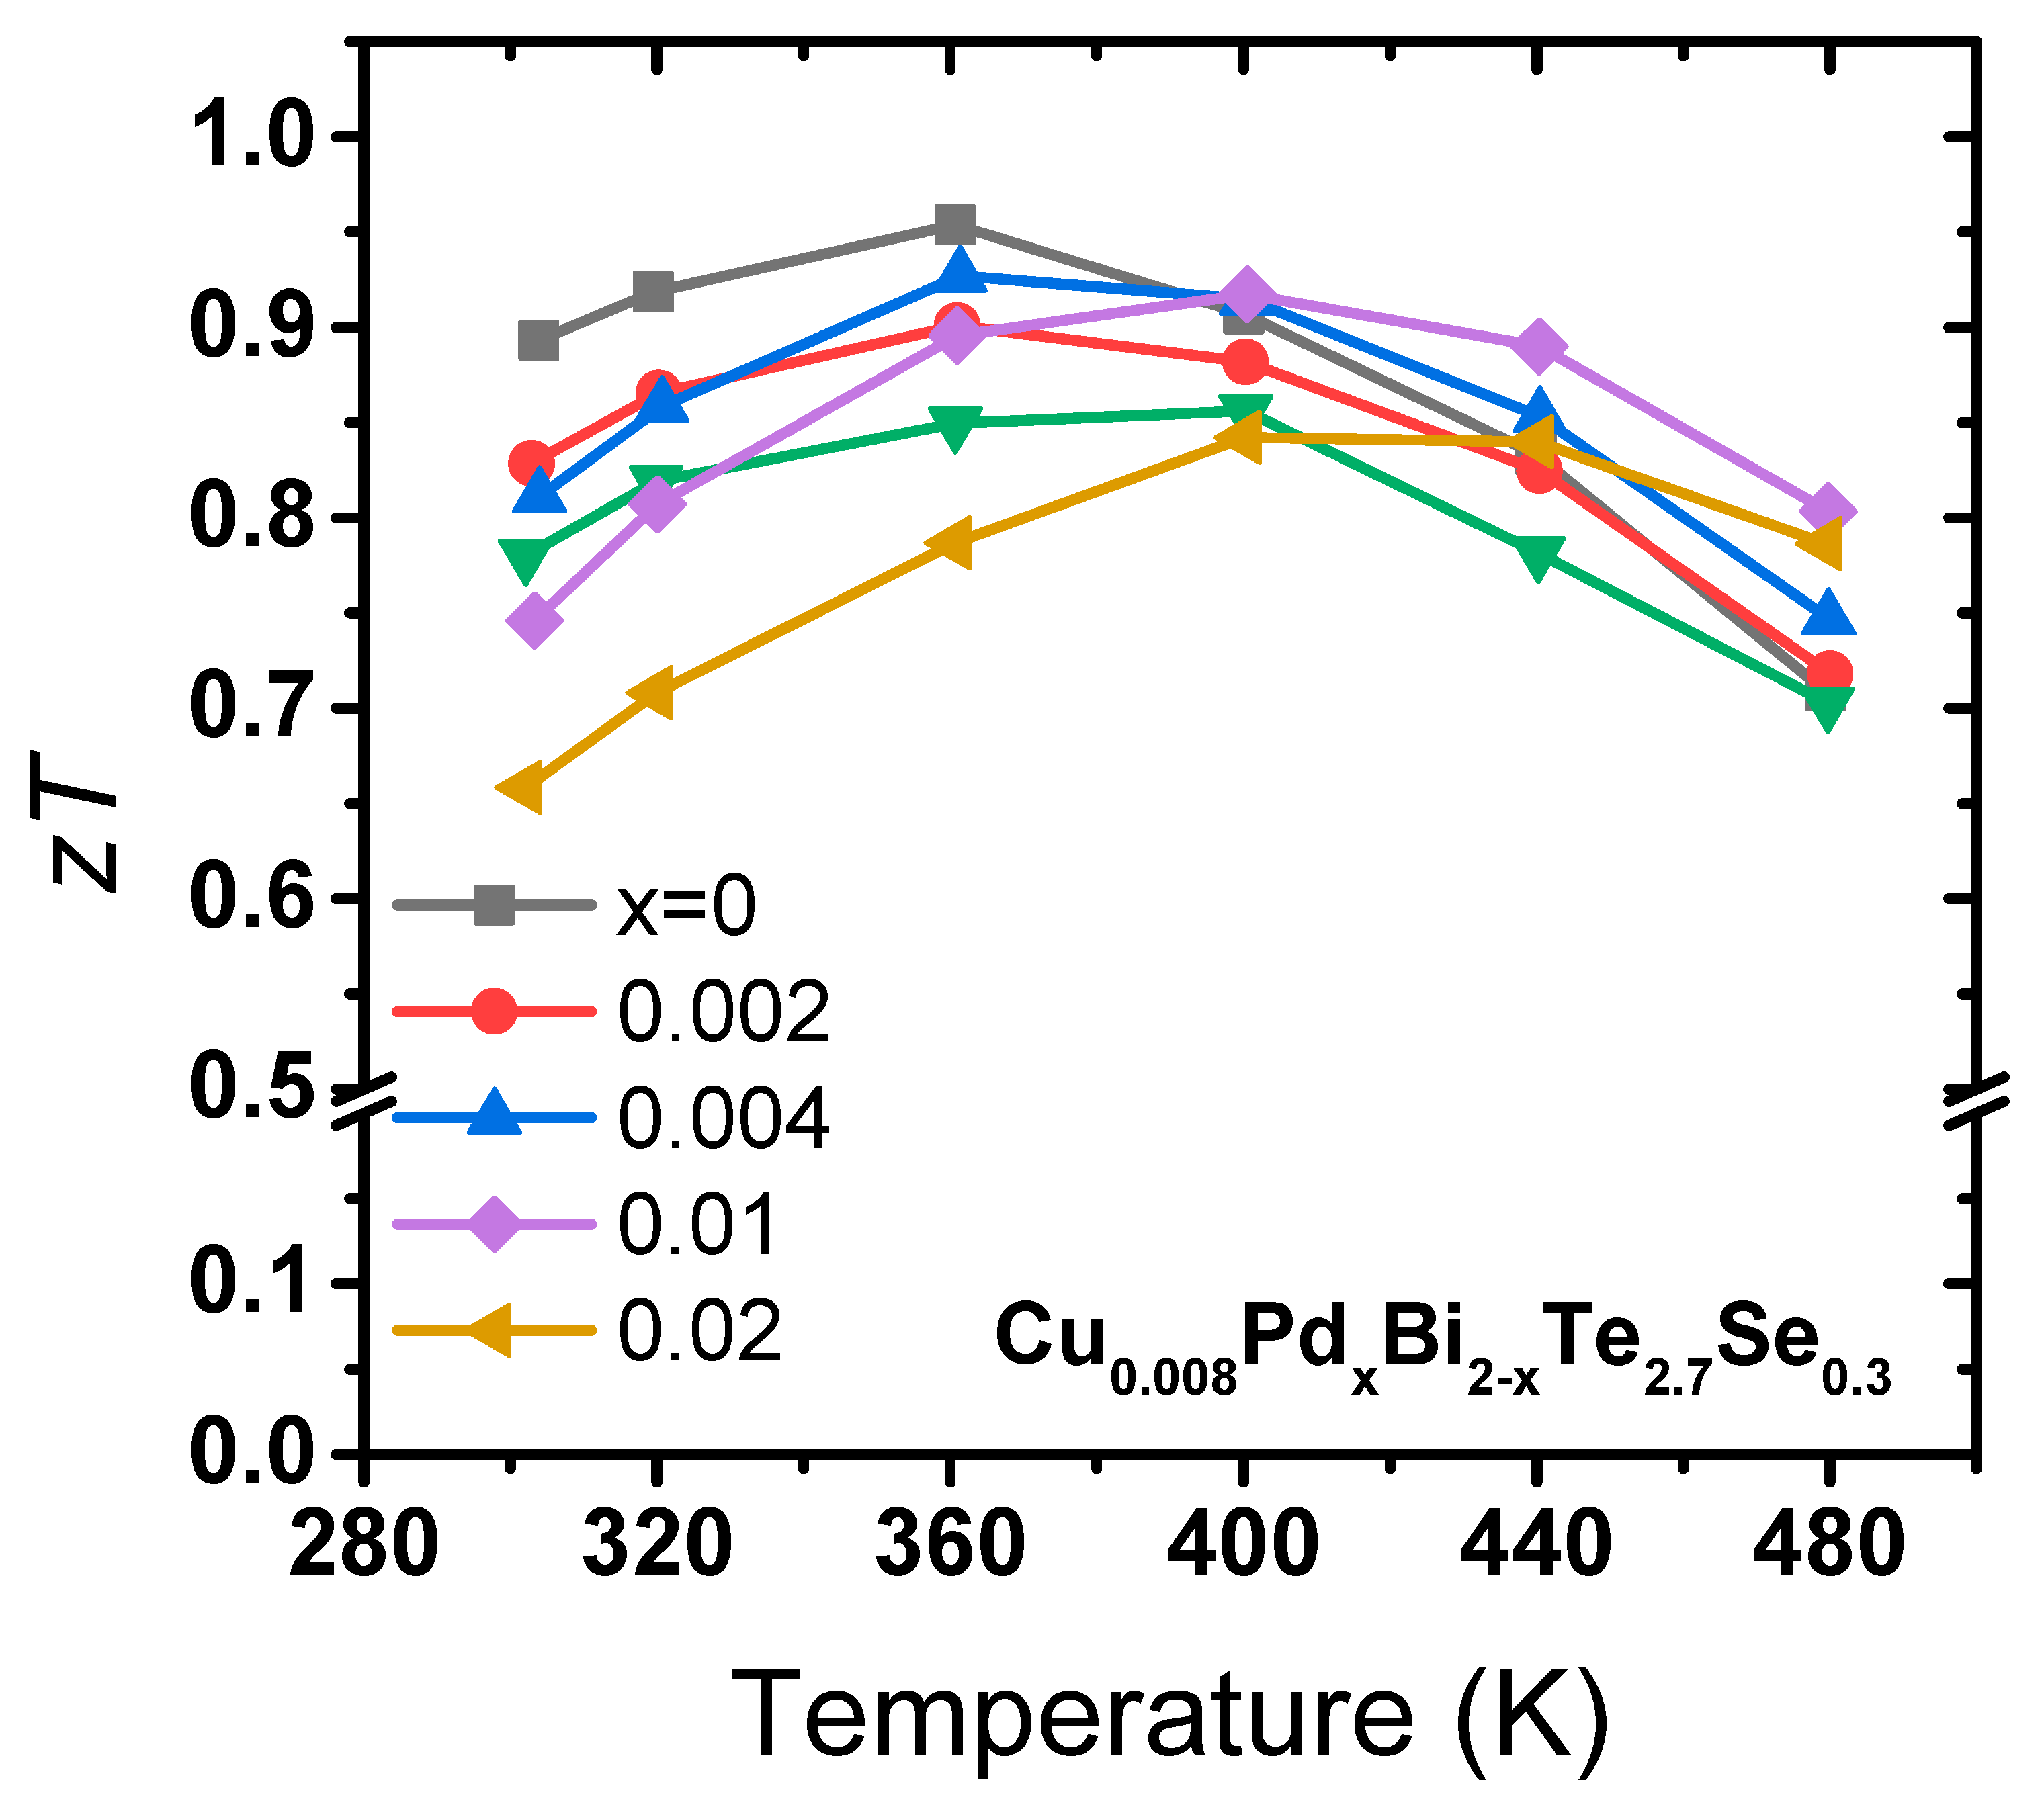
3. Results and Discussion
4. Conclusions
Supplementary Materials
Author Contributions
Funding
Conflicts of Interest
References
- Bell, L.E. Cooling, heating, generating power, and recovering waste heat with thermoelectric systems. Science 2008, 321, 1457–1461. [Google Scholar] [CrossRef] [PubMed] [Green Version]
- Scherrer, H.; Scherrer, S. Thermoelectrics Handbook: Macro to Nano, 1st ed.; Rowe, D.M., Ed.; CRC Press: Boca Raton, FL, USA, 2006; pp. 1–27. [Google Scholar]
- Cui, J.; Xiu, W.; Xue, H. High thermoelectric properties of p-type pseudobinary (Cu4Te3)x–(Bi0.5Sb1.5Te3)1−x alloys prepared by spark plasma sintering. J. Appl. Phys. 2007, 101, 123713. [Google Scholar] [CrossRef]
- Mun, H.; Lee, K.H.; Kim, S.J.; Kim, J.Y.; Lee, J.H.; Lim, J.H.; Park, H.J.; Roh, J.W.; Kim, S.W. Fe-Doping Effect on Thermoelectric Properties of p-Type Bi0.48Sb1.52Te3. Materials 2015, 8, 959–965. [Google Scholar] [CrossRef] [PubMed] [Green Version]
- Kim, H.S.; Lee, K.H.; Yoo, J.Y.; Shin, W.H.; Roh, J.W.; Hwang, J.Y.; Kim, S.W.; Kim, S.I. Suppression of bipolar conduction via bandgap engineering for enhanced thermoelectric performance of p-type Bi0.4Sb1.6Te3 alloys. J. Alloy. Compd. 2018, 741, 869–874. [Google Scholar] [CrossRef]
- Lee, K.H.; Hwang, S.W.; Ryu, B.K.; Ahn, K.H.; Roh, J.W.; Yang, D.J.; Lee, S.M.; Kim, H.S.; Kim, S.I. Enhancement of the Thermoelectric Performance of Bi0.4Sb1.6Te3 Alloys by In and Ga Doping. J. Electron. Mater. 2013, 42, 1617–1621. [Google Scholar] [CrossRef]
- Lee, K.H.; Choi, S.M.; Roh, J.W.; Hwang, S.W.; Kim, S.I.; Shin, W.H.; Park, H.J.; Lee, J.H.; Kim, S.W.; Yang, D.J. Enhanced Thermoelectric Performance of p-Type Bi-Sb-Te Alloys by Codoping with Ga and Ag. J. Electron. Mater. 2015, 44, 1531–1535. [Google Scholar] [CrossRef]
- Zhai, R.S.; Wu, Y.H.; Zhu, T.J.; Zhao, X.B. Thermoelectric performance of p-type zone-melted Se-doped Bi0.5Sb1.5Te3 alloys. Rare Met. 2018, 37, 308–315. [Google Scholar] [CrossRef]
- Kim, H.; Lee, J.K.; Park, S.D.; Ryu, B.K.; Lee, J.E.; Kim, B.S.; Min, B.K.; Joo, S.J.; Lee, H.W.; Cho, Y.R. Enhanced thermoelectric properties and development of nanotwins in Na-doped Bi0.5Sb1.5Te3 alloy. Electron. Mater. Lett. 2016, 12, 290–295. [Google Scholar] [CrossRef]
- Kim, I.H.; Choi, S.M.; Seo, W.S.; Cheong, D.I. Thermoelectric properties of Cu-dispersed Bi0.5Sb1.5Te3. Nanoscale Res. Lett. 2012, 7, 2. [Google Scholar] [CrossRef] [PubMed] [Green Version]
- Kim, H.S.; Lee, K.H.; Yoo, J.Y.; Youn, J.H.; Roh, J.W.; Kim, S.I.; Kim, S.W. Effect of substitutional Pb doping on bipolar and lattice thermal conductivity in p-type Bi0.48Sb1.52Te3. Materials 2017, 10, 763. [Google Scholar] [CrossRef] [PubMed] [Green Version]
- Cho, H.J.; Shin, W.H.; Choo, S.S.; Kim, J.I.; Yoo, J.Y.; Kim, S.I. Synergistic Influence of Cu Intercalation on Electronic and Thermal Properties of n-Type CuxBi2Te2.7Se0.3 Polycrystalline Alloys. J. Electron. Mater. 2019, 48, 1951–1957. [Google Scholar] [CrossRef]
- Tan, X.; Liu, G.; Xu, J.; Tan, X.; Shao, H.; Hu, H.; Jiang, H.; Lu, Y.; Jiang, J. Thermoelectric properties of In-Hg co-doping in SnTe: Energy band engineering. J. Mater. 2018, 4, 62–67. [Google Scholar] [CrossRef]
- Roychowdhury, S.; Biswas, K. Effect of In and Cd co-doping on the thermoelectric properties of Sn1−xPbxTe. Mater. Res. Express 2019, 6, 104010. [Google Scholar] [CrossRef] [Green Version]
- Cohen, I.; Kaller, M.; Komisarchik, G.; Fuks, D.; Gelbstein, Y. Enhancement of the thermoelectric properties of n-type PbTe by Na and Cl co-doping. J. Mater. Chem. C 2015, 3, 9559–9564. [Google Scholar] [CrossRef]
- Kihoi, S.K.; Kim, H.; Jeong, H.; Kim, H.; Ryu, J.; Yi, S.; Lee, H.S. Thermoelectric properties of Mn, Bi, and Sb co-doped SnTe with a low lattice thermal conductivity. Alloys Compd. 2019, 806, 361–369. [Google Scholar] [CrossRef]
- Kim, H.-S.; Choo, S.-S.; Cho, H.-J.; Kim, S.-I. Beneficial Influence of Co-Doping on Thermoelectric Efficiency with Respect to Electronic and Thermal Transport Properties. Phys. Status Sol. A 2019, 216, 1900039. [Google Scholar] [CrossRef]
- May, A.F.; Snyder, G.J. Materials, Preparation, and Characterization in Thermoelectric; Rowe, D.M., Ed.; CRC Press: Boca Raton, FL, USA, 2012; pp. 1–11. [Google Scholar]
- Callaway, J. Model for Lattice Thermal Conductivity at Low Temperatures. Phys. Rev. 1959, 113, 1046. [Google Scholar] [CrossRef]
- Kim, H.S.; Gibbs, Z.M.; Tang, Y.; Wang, H.; Snyder, G.J. Characterization of Lorenz number with Seebeck coefficient measurement. APL Mater. 2015, 3, 041406. [Google Scholar] [CrossRef] [Green Version]
- Wang, S.; Yang, J.; Toll, T.; Yang, J.; Zhang, W.; Tang, X. Conductivity-limiting bipolar thermal conductivity in semiconductors. Sci. Rep. 2015, 5, 10136. [Google Scholar] [CrossRef] [PubMed] [Green Version]


© 2019 by the authors. Licensee MDPI, Basel, Switzerland. This article is an open access article distributed under the terms and conditions of the Creative Commons Attribution (CC BY) license (http://creativecommons.org/licenses/by/4.0/).
Share and Cite
Kim, S.Y.; Kim, H.-S.; Lee, K.H.; Cho, H.-j.; Choo, S.-s.; Hong, S.-w.; Oh, Y.; Yang, Y.; Lee, K.; Lim, J.-H.; et al. Influence of Pd Doping on Electrical and Thermal Properties of n-Type Cu0.008Bi2Te2.7Se0.3 Alloys. Materials 2019, 12, 4080. https://doi.org/10.3390/ma12244080
Kim SY, Kim H-S, Lee KH, Cho H-j, Choo S-s, Hong S-w, Oh Y, Yang Y, Lee K, Lim J-H, et al. Influence of Pd Doping on Electrical and Thermal Properties of n-Type Cu0.008Bi2Te2.7Se0.3 Alloys. Materials. 2019; 12(24):4080. https://doi.org/10.3390/ma12244080
Chicago/Turabian StyleKim, Se Yun, Hyun-Sik Kim, Kyu Hyoung Lee, Hyun-jun Cho, Sung-sil Choo, Seok-won Hong, Yeseong Oh, Yerim Yang, Kimoon Lee, Jae-Hong Lim, and et al. 2019. "Influence of Pd Doping on Electrical and Thermal Properties of n-Type Cu0.008Bi2Te2.7Se0.3 Alloys" Materials 12, no. 24: 4080. https://doi.org/10.3390/ma12244080