Review

Fructose Consumption and Hepatocellular Carcinoma Promotion

by
Lisette Chávez-Rodríguez
1,2,
Alejandro Escobedo-Calvario
1,2,
Soraya Salas-Silva
1,
Roxana U. Miranda-Labra
1,
Leticia Bucio
1,
Verónica Souza
1,
María Concepción Gutiérrez-Ruiz
1 and
Luis E. Gomez-Quiroz
1,*
1
Experimental and Translational Medicine Section, Department of Health Sciences, Universidad Autonoma Metropolitana Iztapalapa, Ave. San Rafael Atlixco 186, Iztapalapa, Mexico City 09340, Mexico
2
Posgrado en Biología Experimental, Universidad Autonoma Metropolitana Iztapalapa, Ave. San Rafael Atlixco 186, Iztapalapa, Mexico City 09340, Mexico
*
Author to whom correspondence should be addressed.
Livers 2021, 1(4), 250-262; https://doi.org/10.3390/livers1040020
Submission received: 11 September 2021 / Revised: 28 October 2021 / Accepted: 3 November 2021 / Published: 8 November 2021

Abstract

:
Hepatocellular carcinoma (HCC) accounts for 85% of primary liver cancer, the third most common cause of cancer-related deaths worldwide. Its incidence has been increasing in both men and women. In Western countries, high-calorie diets, mainly rich in carbohydrates such as fructose, represent a significant concern due to their repercussions on the population’s health. A high-fructose diet is related to the development of Metabolic-Associated Fatty Liver Disease (MAFLD), formerly named Non-Alcoholic Fatty Liver Disease (NAFLD), and the progression of HCC as it potentiates the lipogenic pathway and the accumulation of lipids. However, fructose metabolism seems to be different between the stages of the disease, carrying out a metabolic reprogramming to favor the proliferation, inflammation, and metastatic properties of cancer cells in HCC. This review focuses on a better understanding of fructose metabolism in both scenarios: MAFLD and HCC.

1. Introduction

Primary liver cancer is among the most prevalent malignant diseases worldwide. It is the sixth most diagnosed cancer and the third leading cause of death worldwide in 2020 (Figure 1). It is estimated 906,000 new cases and 83,000 deaths due to this malignancy, particularly hepatocellular carcinoma (HCC) [1].
HCC accounts for 75–85% of primary liver cancer. Its incidence has been increasing in both men and women. The high mortality rate is due to inefficient HCC diagnosis in the early stages of the disease, non-optimized treatments, and high aggressivity in these kinds of tumors [2].
One of the most critical risk factors for the development of HCC is the Metabolic-Associated Fatty Liver Disease (MAFLD), formerly named Non-Alcoholic Fatty Liver Disease (NAFLD) [3]. MAFLD represents the hepatic manifestation of a multisystem disorder, and the main difference between MAFLD and NAFLD is the presence of metabolic dysfunction, necessary for MAFLD diagnosis. It does not require excluding patients with alcohol consumption or another chronic liver disease [4]. MAFLD definition is considered more practical for identifying patients with fatty liver disease with a high risk of disease progression. Currently, it has been classified as the most common chronic liver disease in the last years, being one of the leading causes of liver transplantation [5].
The proposed criteria for a positive diagnosis of MAFLD is the evidence of hepatic steatosis in addition to one of the following three criteria: overweight/obesity, Type 2 Diabetes Mellitus (T2DM), or evidence of metabolic dysregulation [3]. The increment of these diseases is closely related to the diet. Indeed, the consumption of high-calorie foods, mainly lipids, and carbohydrates, has increased over the years.
This review focuses on how fructose metabolism differs in MAFLD and HCC and the association with the primary cancer hallmarks.

2. Fructose Consumption

Fructose and glucose are both monosaccharides: fructose is a ketohexose and glucose an aldohexose. Both are present in fruits and honey, and they constitute the most used sweeteners in the food industry. Sucrose (table sugar) and HFCS are both composed of fructose (Fru) and glucose (Glc). The first one has a composition of 50:50 (Fru:Glc), while the HFCS is composed of 55:42 (Fru:Glc). However, the main difference between them is that the two monosaccharides are disaccharide forms in the sucrose, and in the HFCS, there is a mix of the free forms [6]. The use of HFCS as a sweetener began in the United States in the 1960s, and then spread to the rest of the world [6,7]. Low fructose intake from fruits is associated with weight loss [8]; however, high consumption in industrialized foods has been linked with obesity and MAFLD [3,9,10,11,12].
In comparison with glucose, fructose is a highly lipogenic monosaccharide. Some authors argue that this is related to rapid fructose metabolism in hepatocytes as it avoids the main points of regulation of glycolysis, functioning as an unregulated source of intermediate metabolites for de novo lipogenesis and the accumulation of lipids in hepatocytes [13,14].
The small intestine absorbs fructose through specific transporter GLUT-5, but the maximal absorption is linked to the presence of glucose. Some reports point that the brush-border disaccharidase-related transport system is implicated in this process [15]. Once in the enterocyte, fructose induces the expression of GLUT-5 [16], and its degradation begins through the enzymatic activity of ketohexokinase or fructokinase (KHK), the main enzyme of the pathway [13,17,18]. Studies carried out in mice by deleting KHK show that the transapical fructose transport from the intestinal lumen is reduced, suggesting that this enzyme supports maintaining the gradient in the cellular cytosol that allows fructose input [19,20]. The intermediate metabolites Fructose-1-phosphate (Fru-1-P), Dihydroxyacetone phosphate (DHAP), and Glyceraldehyde-3-phosphate (G-3-P) are capable of activating the Liver X Receptor (LXR) transcription factor, which increases expression of GLUT-5 and plasma membrane location. The promoter of the gene encoding GLUT-5 has LXR response elements (LXRE), allowing the increment of this transporter in the cell membrane [16]. Likewise, it has been observed that the carbohydrate response element-binding protein (ChREBP) can increase the expression of GLUT-5 because carbohydrate response elements (ChoRE) have been identified in its promoter. ChREBP activation is regulated by post-translational modifications induced by fructose. Xylulose-5-phosphate (Xu-5-P) is an intermediate metabolite of Pentose Phosphate Pathway (PPP) and can also be obtained from fructose. This metabolite activates protein phosphatase 2A (PP2A), which dephosphorylates the P1 (Ser196) and P3 (Thr666) sites of the transcription factor ChREBP, allowing its translocation to the nucleus and binding to the ChoRE sites in the promoter of genes related to fructose metabolism and lipogenesis, including glut-5 [21] (Figure 2). It is also reported that, in the liver, fructose induces nuclear translocation of ChREBP by the same mechanism [22] (Figure 3).
The enterocyte is the first regulatory point for fructose concentration in portal blood [18]. In mice, under regular fructose consumption (<0.5 g/kg), the intestine converts fructose into glucose, eventually reaching the liver. However, following a high-fructose diet (>1 g/kg), the fructose not metabolized in the enterocyte exits to the portal blood through the basolateral GLUT-2 transporter [23]. Once there, it enters the hepatocyte through the same transporter [14], which has greater expression in the liver, pancreas, intestine, kidney, and brain [18]. A second checkpoint for the blood concentration of fructose is the liver since this organ can take approximately 70% of the monosaccharide from the portal circulation in a single step [18].
In the liver, fructose is also metabolized by KHK [17]. This enzyme has two isoforms. Isoform A (KHK-A) is expressed in all tissues and has a lower affinity, while KHK-C is expressed mainly in the intestine, the liver, and the kidney and has a high affinity for fructose. KHK-C phosphorylates fructose (Fru-1-P), subsequently cleaved by Aldolase B (ALDO-B) into DHAP and G-3-P. ALDO-B, also known as fructose bisphosphate aldolase B, has a significant expression in the liver and the kidney, and it is implicated in fructose rather than glucose metabolism [24]. These intermediary metabolites can be incorporated into the glycolytic pathway, passing the two main regulatory steps: Hexokinase (HK) and Phosphofructokinase (PFK-1). Subsequently, these metabolites constitute the carbon skeleton for de novo lipid synthesis [17,25] (Figure 3).

2.1. Fructose Consumption and MAFLD

Due to the current lifestyle, eating habits have changed, increasing the consumption of fat and sweets related to the increasing incidence of MAFLD, positioning it as the most common chronic liver disease in the last 30 years [5]. The consumption of fructose has also been highly related to the obesity pandemic, T2DM, and risk of cardiometabolic diseases. Mice fed with high fat and fructose diets present insulin resistance, obesity, hypertriglyceridemia, liver steatosis, fibrosis, and HCC development [26,27].

2.1.1. Steatotic Stage

High-fructose diets promote NAFLD and obesity [9,10,11,26,28,29]. C57BL/6J mice, under fructose-enriched drinking water, increase the accumulation of adipose tissue and liver steatosis [28]; even in mice with only glucose in drinking water, fructose is responsible for generating the metabolic syndrome by the endogenous conversion of glucose to fructose through the polyol pathway [30]. On the other hand, fructose has been linked with insulin and leptin resistance and a reduction in postprandial ghrelin suppression, augmenting food ingestion, obesity, and MAFLD [10]. The unique metabolic characteristics of fructose compared to glucose metabolism are responsible for the differential effects observed.
On the initial progression of the disease, the KHK-C is more relevant; thus, fructose metabolism is exacerbated in enterocytes and hepatocytes. In the small intestine, fructose-enriched diets induce the rupture of tight junctions between enterocytes allowing the translocation of LPS to the portal blood. Endotoxemia promotes inflammation and lipogenesis in the liver [28].
In the hepatocyte, fructose is rapidly phosphorylated by the high affinity of KHK-C, inducing a decrease in ATP levels [31,32]. This energetic unbalance enhances the glycolytic pathway through the enzymes implicated in this process (HK, PFK-1). Furthermore, it generates an increment in oxidative phosphorylation in the mitochondria for ATP generation. However, KHK does not have negative regulation; that is why once ATP levels have risen, intermediate metabolites of the tricarboxylic acid cycle (TCA) begin to accumulate and divert to other pathways such as de novo lipogenesis (DNL) and nucleic acid synthesis [17] (Figure 2). Moreover, a decrease in ATP levels could activate the purine deamination pathway, generating an excess of uric acid content in the hepatocyte, leading to oxidative stress in a process mediated by crosstalk between the mitochondria and the NADPH oxidase 4 (NOX4) [31]. In HepG2 cells, uric acid decreases the mitochondrial membrane potential, affecting the membrane’s electrochemical potential and favoring reactive oxygen species (ROS) generation and mitochondrial dysfunction [31].
Aconitase, which is involved in the isomerization of citrate to isocitrate, is susceptible to ROS generated in the mitochondria; therefore, it decreases its activity leading to the accumulation of citrate in the mitochondrial matrix. The citrate excess is transported to the cytosol through the Citrate shuttle and converted to acetyl-CoA and oxalacetate through ATP citrate lyase (ACLY). Then, acetyl-CoA is activated by acetyl CoA carboxylase (ACAC) to obtain malonyl-CoA, the precursor of the free fatty acids synthesis by the fatty acid synthase (FASN). Incorporating citrate into the lipogenic pathway increases lipid content [31] (Figure 3). It has been reported that ACLY and ACAC overexpression in human HCC tumors is related to high aggressivity and poor survival [33].

2.1.2. Inflammatory Stage

As said above, fructose consumption is related to ROS overproduction and liver inflammation leading to fibrogenesis [34] by a mechanism dependent on the inflammasome (NLRP3) and hepatic stellate cells activation [35,36].
Advanced glycation end products (AGEs) have been cataloged as toxic compounds that utilize a non-enzymatic reaction with the amino groups of the proteins, DNA, and lipids, leading to adduct formation. They are generated by a non-enzymatic reaction in which the keto or aldehyde group of a reductive sugar and the amino group of a protein, nucleotide, or lipid react. This reaction is known as the Maillard reaction, and the specific reaction carried out by fructose is called “fructation” [34,37].
First, the reducing sugar reacts with the amino group releasing a water molecule and producing an early glycation product (Schiff base). Then, the product rearranges into a more stable molecule known as the “Amadori” product. When the reaction is carried out with fructose, the process is similar but renders the “Heyns” product because the reaction undergoes with the sugar’s carbon 2 (C2). In the end, the Amadori or Heyns products continue with a series of dehydration and rearrangement reactions to produce irreversible AGE [34,37]. Both glucose and fructose can lead to the glycation reaction; fructose has been shown to react 8- to 10-fold faster than glucose and produce 100 times more ROS [17,34,38,39,40,41]. The ROS generation could be mediated by the intracellular accumulation of AGEs or by the interaction with its receptor (RAGE).
The intracellular accumulation of AGEs can induce the modification of proteins and keep its effect for longer. In the liver, fructation can modify the SREBP1 cleavage-activating protein SCAP and causes an increment in lipid accumulation [42]. Furthermore, it has been reported that fructation induces ROS production in the HepG2 cell line through mitochondrial membrane dysfunction [43]. Glyceraldehyde generated from fructose metabolism can be metabolized by aldehyde dehydrogenase, lactate dehydrogenase, and decarboxylase to produce CO2 and glycolaldehyde (a DNA intercalator). Further oxidation of glycolaldehyde by superoxide radicals results in glyoxal (early glycation product), inhibiting mitochondrial respiration [17].
The AGEs-RAGE pathway has been implicated in activating pro-inflammatory pathways in the liver. The presence of this receptor has been reported in Kupffer and stellate cells [34]. The binding of the ligand to its receptor produces the activation of the Nuclear Factor-Kappa B (NF-kB) and the expression of genes related to inflammation such as TNF-α, IL-1β, and IL-6 [28,34].
Similarly, endotoxemia induces the activation of pro-inflammatory pathways in the liver through the Toll-Like Receptor 4 (TLR-4) in Kupffer cells. The TLR-4 activation triggers the expression and secretion of proinflammatory cytokines increasing lipogenesis through SREBP1c activation [28].
At this point, fructose metabolism is implicated in the MAFLD generation and progression to inflammatory and pro-fibrogenic status. Some studies in mice and humans demonstrate that fructose metabolism intervention through KHK inhibition improves NASH and reduces steatosis in the liver [44]. This strategy could be promising as the non-absorption of fructose causing fructosuria is not a detrimental disorder in humans [45].

2.2. Fructose Consumption and HCC. Cancer Hallmarks

Cancer is characterized by several acquired capabilities that serve distinct functions to support tumors’ development, progression, and persistence [46]. Fructose metabolism participates in some of these characteristics that render advantages to transformed cells to survive, proliferate and spread to other organs, and consuming a fructose-enriched diet enhances the tumor formation in the liver of mice [28] and increases the risk of HCC in humans [47]. However, it seems that fructose has a dual role in MAFLD and cancer metabolism (Figure 3 and Figure 4).

2.2.1. Reprogramming Energy Metabolism

Reprogramming energy metabolism is a remarkable hallmark in the transformed cell. It confers advantages for building blocks acquisition and energy supply for the highly proliferative system. Fructose is involved in the metabolic reprogramming of cancer cells. High fructose consumption is associated with the expression of genes related to de novo lipogenesis (Figure 4). Aberrant lipogenesis is a well-recognized transformed cell phenotype linked to aggressiveness and tumor promotion [33]. Studies carried out in cell lines (HepG2 and Huh-7) confirm the same lipogenic effect of fructose [7,13,31].
As mentioned before, fructose induces the expression and activation of ChREBP. Some of the genes implicated in the fructose and lipid metabolism have ChoRE in the promoter (glut-5, glut-2, khk, acly, acaca, fasn, and chrebp) [21] (Figure 3). Likewise, fructose consumption is involved in the repression of genes related to lipid oxidation (cpt1a and fgf21) [25].
Another remarkable participant in lipogenesis is mTOR [48,49]. Studies carried out with an mTOR-dependent model of HCC in mice reported that mTOR complex 2 (mTORC2) promotes liver steatosis, damage, and tumor development with an increase in fatty acid synthesis similar to the one observed in patients with NAFLD who progress to HCC [48]. Correspondingly, mTORC2 can be activated by FASN and, at the same time to activate AKT/mTOR pathway, classified as a tumor promoter pathway. Furthermore, it has been reported that DHAP can activate the mTOR signaling pathway [33]. In this case, both fasn expression and DHAP increase with fructose metabolism, and fasn expression has been associated with carcinogenic processes, metastasis, proliferation, aberrant lipogenesis, and a poor prognosis in HCC patients [33,50,51]. Furthermore, it is reported that histidine phosphatase (LHPP) is a tumor suppressor that is regulated by the mTOR; thus, once mTOR is active, LHPP is silenced. Among the targets that have been proposed for this phosphatase is ACLY, another reported remarkable target of fructose metabolism [49].
Some studies have reported that in cancer cells, fructose metabolism is decreased compared to normal cells. Furthermore, some enzymes related to fructose catabolism have lower activity in HCC compared to normal liver tissue [13,52,53]. As a result of this metabolism, reprogramming that favors the Warburg effect has been reported [54]. The canonical Warburg effect is based on reducing mitochondrial oxidation of Pyruvate and the enhancement of glycolysis to obtain higher levels of Lactate and ATP. Lactate is involved in microenvironment reprogramming, angiogenesis, and invasion [55]. However, because the fructose metabolism generates higher ROS levels, it has been proposed that cancer cells under high fructose levels change their metabolism to a reverse Warburg effect [56].
The reverse Warburg effect drives an influx of lactate to the cancerous cell from the stromal cancer-associated fibroblast (CAFs). CAFs increase the glycolytic rate and produce the highest lactate levels that exit the cell through monocarboxylate transporter 4 (MCT-4) and enter the transformed hepatocyte through the MCT-1. Cancer cells take advantage of this effect to obtain reducing power to counteract the high ROS levels and building blocks to cellular division through the (PPP) and increment the gluconeogenesis pathway (Figure 3) [55,56].
Moreover, in transformed cells, KHK changes to produce lower Fru-1-P (Figure 4). As mentioned before, KHK has two isoforms produced by an alternative splicing process with the incorporation of Exon 3A or 3C, giving rise to KHK-A and KHK-C, respectively. In cancer cells, KHK-A has higher activity, and due to the isoform change, there are lower Fru-1-P, uric acid, and ROS levels. Instead, KHK-A facilitates nucleic acid synthesis through the direct phosphorylation of phosphoribosyl pyrophosphate synthetase 1 (PRPS1) and antioxidant response through p62 phosphorylation and Nrf2 activation and with that HCC progression [13,57]. Coupled with this ALDO-B enzyme implicated in fructose metabolism compared to glucose metabolism, it also diminishes its activity, favoring metabolites accumulation and deviation to PPP [52] (Figure 3).
Another metabolic rewiring under fructose consumption is the activation of the transketolase (TKT) enzyme. This protein is implicated in the non-oxidative branch of PPP and allows obtaining Xu-5-P and E-4-P from Fru-6-P and G-3-P, enhancing the building blocks to cellular division. In pancreatic cancer cells, the activation of the enzyme was higher under fructose treatment than glucose treatment [58].

2.2.2. Fructose Metabolism Promotes Invasion, Metastasis, and Sustaining Proliferative Signaling

Due to the fructose metabolism, metabolic rewiring is also related to enhancing invasion and metastasis in cancer cells. There is evidence that a change to a lower fructose metabolism favors the invasion and metastatic progression in some types of cancer as breast cancer [59].
Specifically, fructose metabolism decreases to favor the metastatic process in HCC. Transformed cells have a lower ALDO-B activity compared to the surrounding tissue [52]. ALDO-B acts as a negative regulator of AKT due to it promotes the recruitment of PP2A to dephosphorylate p-AKT. In tumor cells, ALDO-B is downregulated and increases migration and invasion in HCC cell lines, and there is an inverse correlation between ALDO-B and AKT expression in patients [53]. A strong relationship has also been demonstrated between the AKT/mTOR pathway and FASN activation, and fructose diet activates the expression of this enzyme. FASN can induce the activity of mTORC2 and increase the sustained activation of AKT, leading to the promotion to HCC in a murine genetic model where FASN and its regulator Rictor were knockout [50]. Furthermore, it has been shown that there is a subtype of HCC patients with a high content of FASN in the tumor tissue, which correlates with a high content of AKT, classifying FASN as a tumor promoter in this murine model and subtype of HCC patients [33,50,51].
Moreover, fructose metabolism exacerbates cancer cell proliferation and survival as a consequence of metabolic reprogramming. ALDO-B downregulation favors cancer cells expansion through an increment in AKT/mTOR pathway activation [53]. On the other hand, HCC cell lines change to the expression KHK-A, which provokes a decrement in ROS production and protects the cells from oxidative stress. KHK-A has a significant kinase activity that led to an increment of nucleic acid synthesis and an enhancement of cell proliferation, as previously stated [13].

2.2.3. Tumor-Promoting Inflammation

Dietary fructose has been related to inflammation [28,34]. It could result from AGEs formation, ROS production, lipid peroxidation, and cytokine action [34,38]. Fructose catabolism produces toxic intermediate metabolites and induces ROS production. In the intestine, ROS production from fructose metabolism can disrupt the tight junctions in the intestinal epithelium, generating endotoxemia, which contributes to inflammation and the increment in lipogenesis [28]. Furthermore, the increment of DNL induces the decrement of NADPH levels in the cell. As a result, cellular antioxidant defense mechanisms are compromised, favoring oxidative stress leading to lipid peroxidation, protein misfolding, DNA damage, lipid synthesis, and activation of proinflammatory and pro-fibrotic pathways enhancing the HCC progression [17,31,34,41,60].
At this point, it is essential to note that fructose metabolism in transformed cells changes from a higher to lower metabolism. Cancer cells need to counteract the elevated ROS levels generated from an exacerbated activity in the cell. That is why it could be observed a metabolic switch in the cell.
At present, it is unknown if KHK inhibition could be beneficial for patients with HCC. It is necessary to address the particular gene signature in patients with this specific metabolism, allowing for a better diagnose, subclassification of HCC, and prognosis. Another strategy could be to detect a particular serum lipid profile for these patients. Even nuclear medicine could be an excellent ally to notice this metabolic change in tumors, characteristic of a more aggressive HCC.

3. Conclusions

The present review relates the consumption of a high fructose diet with MAFLD through the lipid accumulation in the liver and its relationship with obesity, T2DM, and metabolic dysfunctions in patients and the hallmarks of cancer. On the other hand, it is essential to note that fructose metabolism exhibits differences related to the state of development of the disease. In the initial steps, there is a high fructose-related enzymes activity that promotes hepatic steatosis. Still, once the cancer is established, a fructose metabolic reprogramming is carried out in transformed cells to favor proliferation, inflammation, and metastatic properties of the cancer cells. In this scenario, the inhibition of KHK seems to be a promising strategy in the initial steps of the disease. Still, once HCC is established, more studies need to be done to figure out if the treatment has consistent therapeutic effects. Furthermore, the activities of some enzymes serve as surrogate markers for poor prognoses, such as FASN upregulation, KHK-A isoform change, and ALDO-B downregulation. A better understanding of the role of fructose metabolism in both scenarios is necessary to diagnose and treat patients and find new strategies for possible druggable metabolic points in fructose metabolism.

Funding

This research was funded by “Universidad Autonoma Metropolitana” and “Conacyt-Fronteras de la Ciencia-1320”.

Institutional Review Board Statement

Not applicable.

Informed Consent Statement

Not applicable.

Data Availability Statement

Not applicable.

Conflicts of Interest

The authors declare no conflict of interest.

References

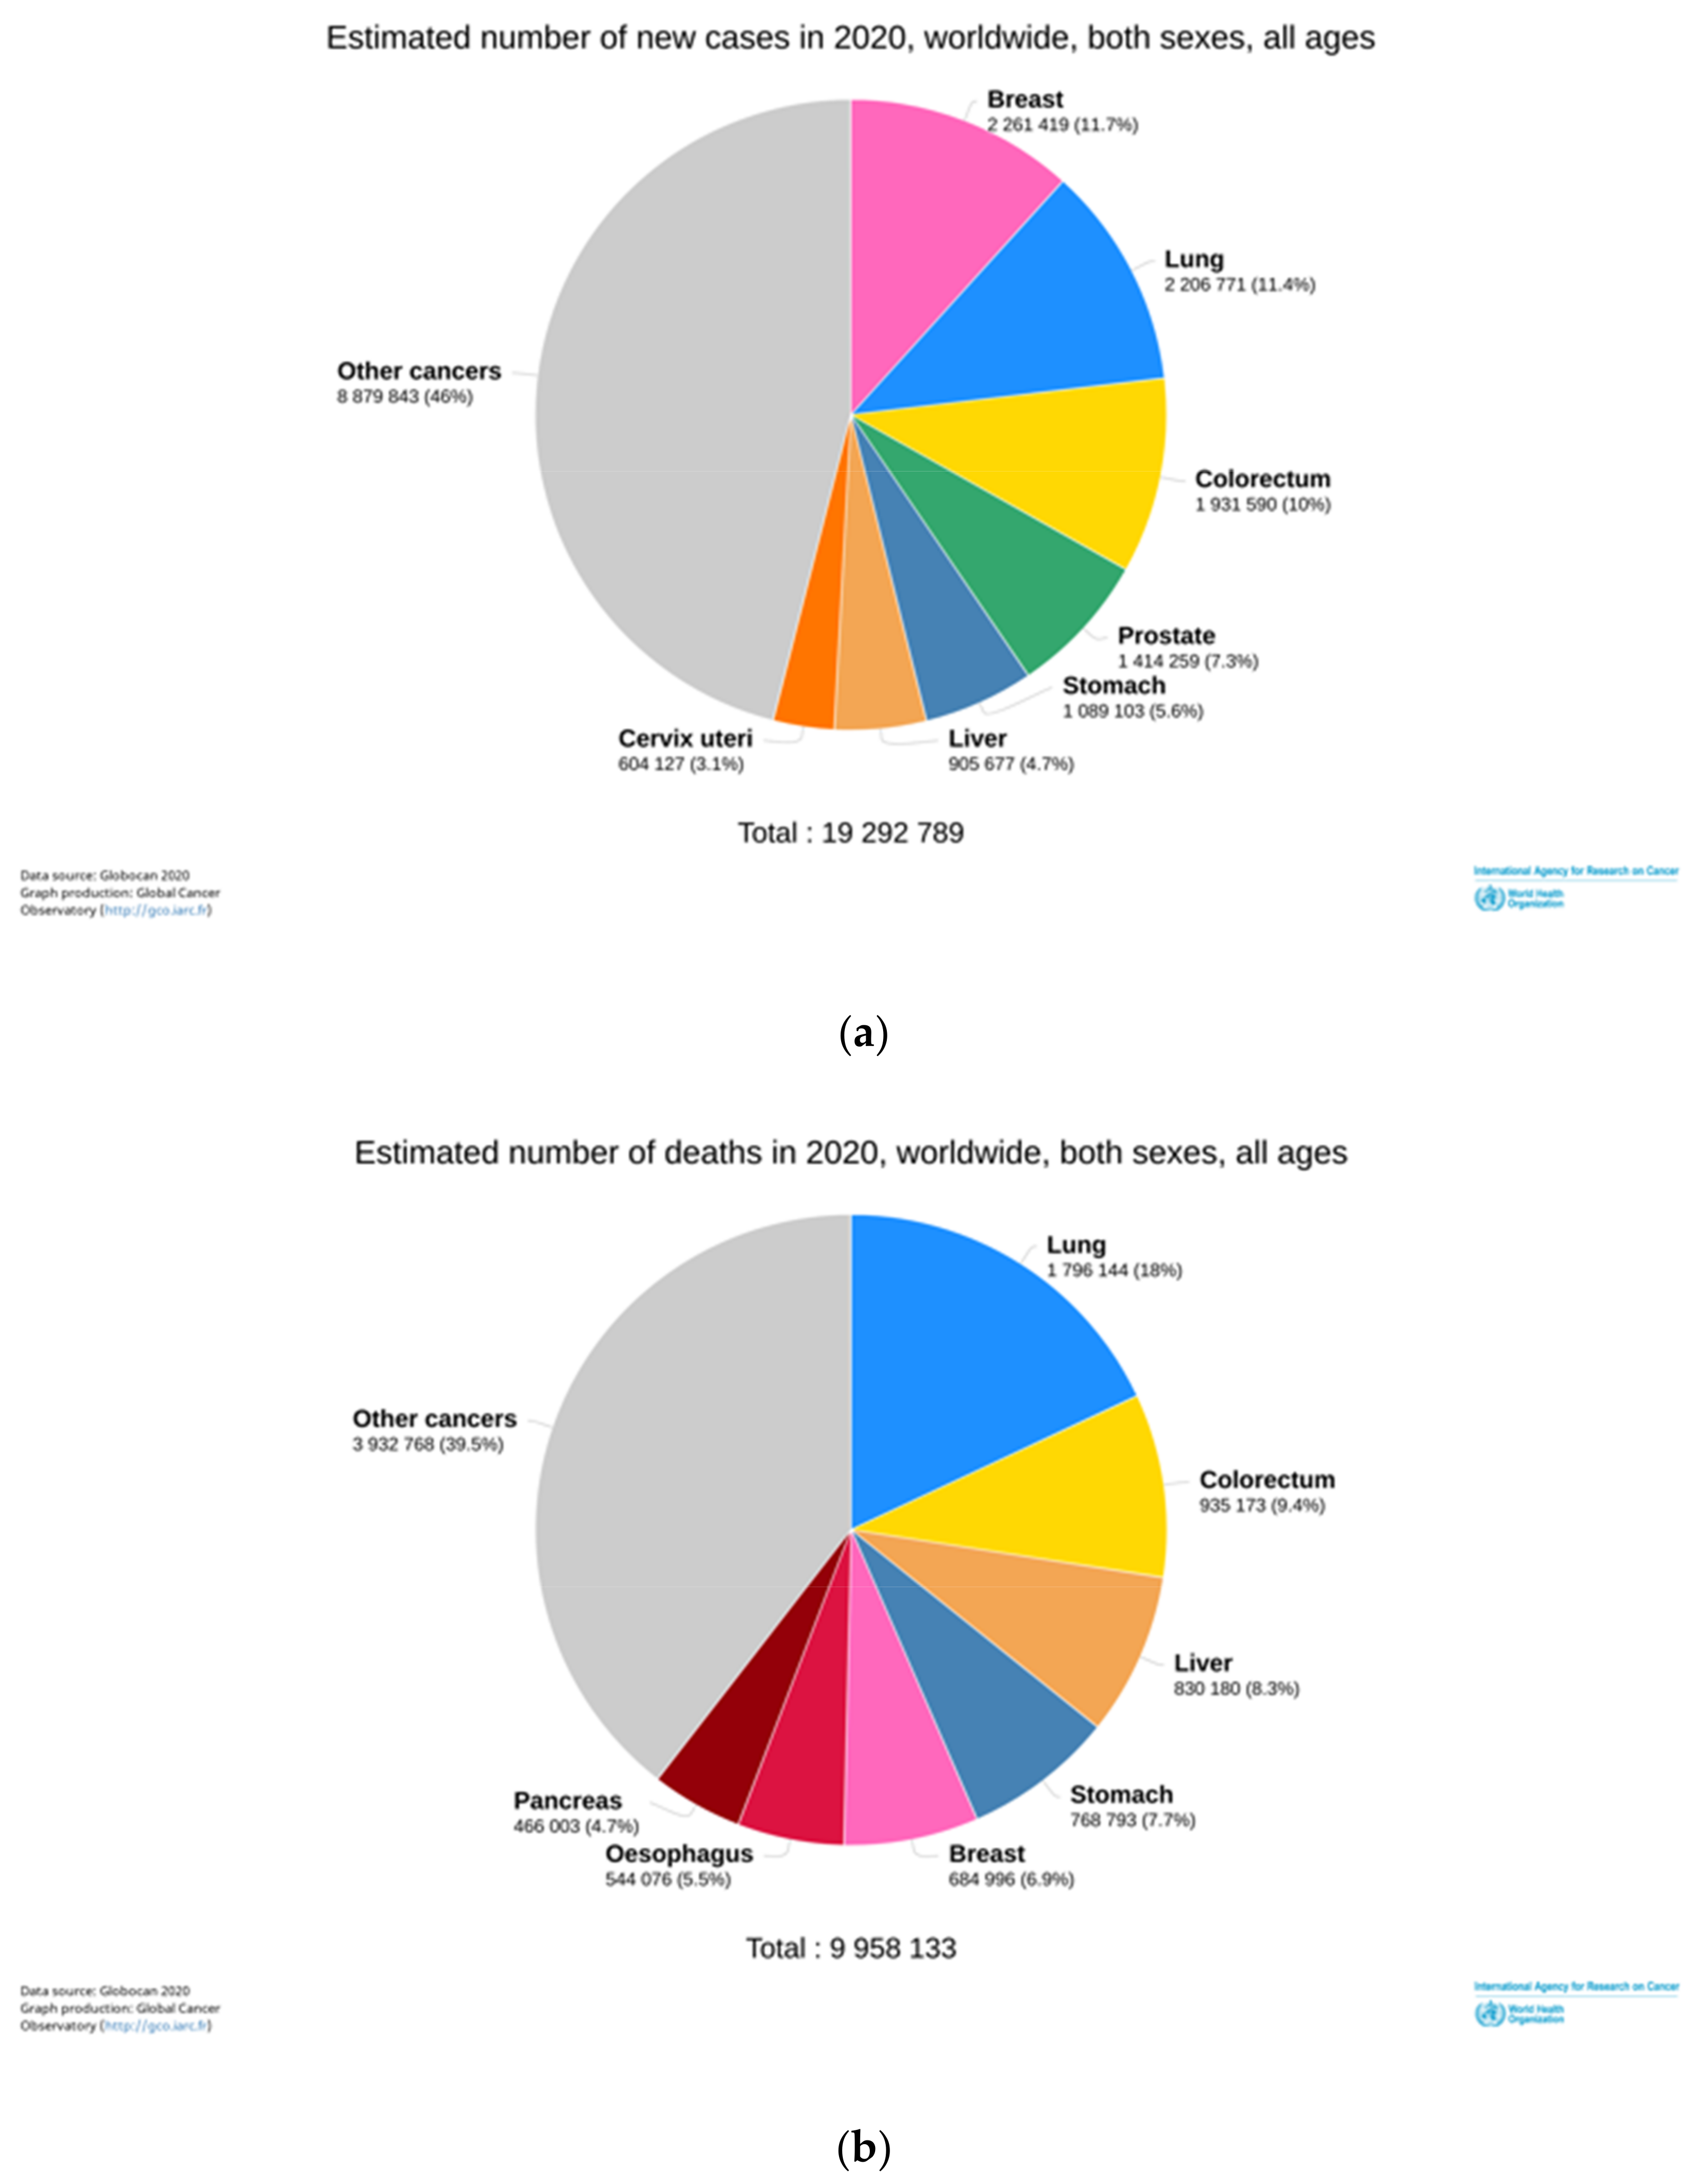
  1. Sung, H.; Ferlay, J.; Siegel, R.L.; Laversanne, M.; Soerjomataram, I.; Jemal, A.; Bray, F. Global Cancer Statistics 2020: GLOBOCAN Estimates of Incidence and Mortality Worldwide for 36 Cancers in 185 Countries. CA Cancer J. Clin. 2021, 71, 209–249. [Google Scholar] [CrossRef]
  2. Bray, F.; Ferlay, J.; Soerjomataram, I.; Siegel, R.L.; Torre, L.A.; Jemal, A. Global cancer statistics 2018: GLOBOCAN estimates of incidence and mortality worldwide for 36 cancers in 185 countries. CA Cancer J. Clin. 2018, 68, 394–424. [Google Scholar] [CrossRef] [Green Version]
  3. Eslam, M.; Newsome, P.N.; Sarin, S.K.; Anstee, Q.M.; Targher, G.; Romero-Gomez, M.; Zelber-Sagi, S.; Wai-Sun Wong, V.; Dufour, J.F.; Schattenberg, J.M.; et al. A new definition for metabolic dysfunction-associated fatty liver disease: An international expert consensus statement. J. Hepatol. 2020, 73, 202–209. [Google Scholar] [CrossRef]
  4. Lin, S.; Huang, J.; Wang, M.; Kumar, R.; Liu, Y.; Liu, S.; Wu, Y.; Wang, X.; Zhu, Y. Comparison of MAFLD and NAFLD diagnostic criteria in real world. Liver Int. 2020, 40, 2082–2089. [Google Scholar] [CrossRef] [PubMed]
  5. Mikolasevic, I.; Filipec-Kanizaj, T.; Mijic, M.; Jakopcic, I.; Milic, S.; Hrstic, I.; Sobocan, N.; Stimac, D.; Burra, P. Nonalcoholic fatty liver disease and liver transplantation—Where do we stand? World J. Gastroenterol. 2018, 24, 1491–1506. [Google Scholar] [CrossRef] [PubMed]
  6. Kroemer, G.; López-Otín, C.; Madeo, F.; de Cabo, R. Carbotoxicity-Noxious Effects of Carbohydrates. Cell 2018, 175, 605–614. [Google Scholar] [CrossRef] [PubMed] [Green Version]
  7. Windemuller, F.; Xu, J.; Rabinowitz, S.S.; Hussain, M.M.; Schwarz, S.M. Lipogenesis in Huh7 cells is promoted by increasing the fructose: Glucose mo.olar ratio. World J. Hepatol. 2016, 8, 838–843. [Google Scholar] [CrossRef]
  8. Sharma, S.P.; Chung, H.J.; Kim, H.J.; Hong, S.T. Paradoxical Effects of Fruit on Obesity. Nutrients 2016, 8, 633. [Google Scholar] [CrossRef] [PubMed]
  9. Ouyang, X.; Cirillo, P.; Sautin, Y.; McCall, S.; Bruchette, J.L.; Diehl, A.M.; Johnson, R.J.; Abdelmalek, M.F. Fructose consumption as a risk factor for non-alcoholic fatty liver disease. J. Hepatol. 2008, 48, 993–999. [Google Scholar] [CrossRef] [Green Version]
  10. Alwahsh, S.M.; Gebhardt, R. Dietary fructose as a risk factor for non-alcoholic fatty liver disease (NAFLD). Arch. Toxicol. 2017, 91, 1545–1563. [Google Scholar] [CrossRef]
  11. Ter Horst, K.W.; Serlie, M.J. Fructose Consumption, Lipogenesis, and Non-Alcoholic Fatty Liver Disease. Nutrients 2017, 9, 981. [Google Scholar] [CrossRef] [Green Version]
  12. Basaranoglu, M.; Basaranoglu, G.; Sabuncu, T.; Sentürk, H. Fructose as a key player in the development of fatty liver disease. World J. Gastroenterol. 2013, 19, 1166–1172. [Google Scholar] [CrossRef]
  13. Li, X.; Qian, X.; Peng, L.X.; Jiang, Y.; Hawke, D.H.; Zheng, Y.; Xia, Y.; Lee, J.H.; Cote, G.; Wang, H.; et al. A splicing switch from ketohexokinase-C to ketohexokinase-A drives hepatocellular carcinoma formation. Nat. Cell Biol. 2016, 18, 561–571. [Google Scholar] [CrossRef] [Green Version]
  14. Riveros, M.J.; Parada, A.; Pettinelli, P. Fructose consumption and its health implications; fructose malabsorption and nonalcoholic fatty liver disease. Nutr. Hosp. 2014, 29, 491–499. [Google Scholar] [CrossRef]
  15. Laughlin, M.R. Normal roles for dietary fructose in carbohydrate metabolism. Nutrients 2014, 6, 3117–3129. [Google Scholar] [CrossRef] [PubMed] [Green Version]
  16. Zwarts, I.; van Zutphen, T.; Kruit, J.K.; Liu, W.; Oosterveer, M.H.; Verkade, H.J.; Uhlenhaut, N.H.; Jonker, J.W. Identification of the fructose transporter GLUT5 (SLC2A5) as a novel target of nuclear receptor LXR. Sci. Rep. 2019, 9, 9299. [Google Scholar] [CrossRef] [PubMed]
  17. Charrez, B.; Qiao, L.; Hebbard, L. The role of fructose in metabolism and cancer. Horm. Mol. Biol. Clin. Investig. 2015, 22, 79–89. [Google Scholar] [CrossRef] [PubMed]
  18. Ferraris, R.P.; Choe, J.Y.; Patel, C.R. Intestinal Absorption of Fructose. Annu. Rev. Nutr. 2018, 38, 41–67. [Google Scholar] [CrossRef]
  19. Patel, C.; Douard, V.; Yu, S.; Gao, N.; Ferraris, R.P. Transport, metabolism, and endosomal trafficking-dependent regulation of intestinal fructose absorption. FASEB J. 2015, 29, 4046–4058. [Google Scholar] [CrossRef] [PubMed] [Green Version]
  20. Andres-Hernando, A.; Orlicky, D.J.; Kuwabara, M.; Ishimoto, T.; Nakagawa, T.; Johnson, R.J.; Lanaspa, M.A. Deletion of Fructokinase in the Liver or in the Intestine Reveals Differential Effects on Sugar-Induced Metabolic Dysfunction. Cell Metab. 2020, 32, 117–127.e113. [Google Scholar] [CrossRef]
  21. Lee, H.J.; Cha, J.Y. Recent insights into the role of ChREBP in intestinal fructose absorption and metabolism. BMB Rep. 2018, 51, 429–436. [Google Scholar] [CrossRef] [PubMed] [Green Version]
  22. Gutierrez, J.A.; Liu, W.; Perez, S.; Xing, G.; Sonnenberg, G.; Kou, K.; Blatnik, M.; Allen, R.; Weng, Y.; Vera, N.B.; et al. Pharmacologic inhibition of ketohexokinase prevents fructose-induced metabolic dysfunction. Mol. Metab. 2021, 48, 101196. [Google Scholar] [CrossRef] [PubMed]
  23. Merino, B.; Fernández-Díaz, C.M.; Cózar-Castellano, I.; Perdomo, G. Intestinal Fructose and Glucose Metabolism in Health and Disease. Nutrients 2019, 12, 94. [Google Scholar] [CrossRef] [PubMed] [Green Version]
  24. Chang, Y.C.; Yang, Y.C.; Tien, C.P.; Yang, C.J.; Hsiao, M. Roles of Aldolase Family Genes in Human Cancers and Diseases. Trends Endocrinol. Metab. 2018, 29, 549–559. [Google Scholar] [CrossRef]
  25. DiStefano, J.K. Fructose-mediated effects on gene expression and epigenetic mechanisms associated with NAFLD pathogenesis. Cell Mol. Life Sci. 2020, 77, 2079–2090. [Google Scholar] [CrossRef]
  26. Dowman, J.K.; Hopkins, L.J.; Reynolds, G.M.; Nikolaou, N.; Armstrong, M.J.; Shaw, J.C.; Houlihan, D.D.; Lalor, P.F.; Tomlinson, J.W.; Hübscher, S.G.; et al. Development of hepatocellular carcinoma in a murine model of nonalcoholic steatohepatitis induced by use of a high-fat/fructose diet and sedentary lifestyle. Am. J. Pathol. 2014, 184, 1550–1561. [Google Scholar] [CrossRef] [PubMed] [Green Version]
  27. Asgharpour, A.; Cazanave, S.C.; Pacana, T.; Seneshaw, M.; Vincent, R.; Banini, B.A.; Kumar, D.P.; Daita, K.; Min, H.K.; Mirshahi, F.; et al. A diet-induced animal model of non-alcoholic fatty liver disease and hepatocellular cancer. J. Hepatol. 2016, 65, 579–588. [Google Scholar] [CrossRef] [PubMed] [Green Version]
  28. Todoric, J.; Di Caro, G.; Reibe, S.; Henstridge, D.C.; Green, C.R.; Vrbanac, A.; Ceteci, F.; Conche, C.; McNulty, R.; Shalapour, S.; et al. Fructose stimulated de novo lipogenesis is promoted by inflammation. Nat. Metab. 2020, 2, 1034–1045. [Google Scholar] [CrossRef]
  29. Jegatheesan, P.; De Bandt, J.P. Fructose and NAFLD: The Multifaceted Aspects of Fructose Metabolism. Nutrients 2017, 9, 230. [Google Scholar] [CrossRef] [Green Version]
  30. Lanaspa, M.A.; Ishimoto, T.; Li, N.; Cicerchi, C.; Orlicky, D.J.; Ruzycki, P.; Rivard, C.; Inaba, S.; Roncal-Jimenez, C.A.; Bales, E.S.; et al. Endogenous fructose production and metabolism in the liver contributes to the development of metabolic syndrome. Nat. Commun. 2013, 4, 2434. [Google Scholar] [CrossRef]
  31. Lanaspa, M.A.; Sanchez-Lozada, L.G.; Choi, Y.J.; Cicerchi, C.; Kanbay, M.; Roncal-Jimenez, C.A.; Ishimoto, T.; Li, N.; Marek, G.; Duranay, M.; et al. Uric acid induces hepatic steatosis by generation of mitochondrial oxidative stress: Potential role in fructose-dependent and -independent fatty liver. J. Biol. Chem. 2012, 287, 40732–40744. [Google Scholar] [CrossRef] [PubMed] [Green Version]
  32. Jensen, T.; Abdelmalek, M.F.; Sullivan, S.; Nadeau, K.J.; Green, M.; Roncal, C.; Nakagawa, T.; Kuwabara, M.; Sato, Y.; Kang, D.H.; et al. Fructose and sugar: A major mediator of non-alcoholic fatty liver disease. J. Hepatol. 2018, 68, 1063–1075. [Google Scholar] [CrossRef] [Green Version]
  33. Calvisi, D.F.; Wang, C.; Ho, C.; Ladu, S.; Lee, S.A.; Mattu, S.; Destefanis, G.; Delogu, S.; Zimmermann, A.; Ericsson, J.; et al. Increased lipogenesis, induced by AKT-mTORC1-RPS6 signaling, promotes development of human hepatocellular carcinoma. Gastroenterology 2011, 140, 1071–1083. [Google Scholar] [CrossRef] [Green Version]
  34. Fernando, D.H.; Forbes, J.M.; Angus, P.W.; Herath, C.B. Development and Progression of Non-Alcoholic Fatty Liver Disease: The Role of Advanced Glycation End Products. Int. J. Mol. Sci. 2019, 20, 5037. [Google Scholar] [CrossRef] [PubMed] [Green Version]
  35. Ramos-Tovar, E.; Muriel, P. Molecular Mechanisms That Link Oxidative Stress, Inflammation, and Fibrosis in the Liver. Antioxidants 2020, 9, 1279. [Google Scholar] [CrossRef]
  36. Zhang, X.; Zhang, J.H.; Chen, X.Y.; Hu, Q.H.; Wang, M.X.; Jin, R.; Zhang, Q.Y.; Wang, W.; Wang, R.; Kang, L.L.; et al. Reactive oxygen species-induced TXNIP drives fructose-mediated hepatic inflammation and lipid accumulation through NLRP3 inflammasome activation. Antioxid Redox Signal. 2015, 22, 848–870. [Google Scholar] [CrossRef] [Green Version]
  37. Gugliucci, A. Formation of Fructose-Mediated Advanced Glycation End Products and Their Roles in Metabolic and Inflammatory Diseases. Adv. Nutr. 2017, 8, 54–62. [Google Scholar] [CrossRef] [Green Version]
  38. Lim, J.S.; Mietus-Snyder, M.; Valente, A.; Schwarz, J.M.; Lustig, R.H. The role of fructose in the pathogenesis of NAFLD and the metabolic syndrome. Nat. Rev. Gastroenterol. Hepatol. 2010, 7, 251–264. [Google Scholar] [CrossRef]
  39. Sil, R.; Chakraborti, A.S. Oxidative Inactivation of Liver Mitochondria in High Fructose Diet-Induced Metabolic Syndrome in Rats: Effect of Glycyrrhizin Treatment. Phytother. Res. 2016, 30, 1503–1512. [Google Scholar] [CrossRef]
  40. Cioffi, F.; Senese, R.; Lasala, P.; Ziello, A.; Mazzoli, A.; Crescenzo, R.; Liverini, G.; Lanni, A.; Goglia, F.; Iossa, S. Fructose-Rich Diet Affects Mitochondrial DNA Damage and Repair in Rats. Nutrients 2017, 9, 323. [Google Scholar] [CrossRef] [PubMed] [Green Version]
  41. García-Berumen, C.I.; Ortiz-Avila, O.; Vargas-Vargas, M.A.; Del Rosario-Tamayo, B.A.; Guajardo-López, C.; Saavedra-Molina, A.; Rodríguez-Orozco, A.R.; Cortés-Rojo, C. The severity of rat liver injury by fructose and high fat depends on the degree of respiratory dysfunction and oxidative stress induced in mitochondria. Lipids Health Dis. 2019, 18, 78. [Google Scholar] [CrossRef] [Green Version]
  42. Mastrocola, R.; Collino, M.; Rogazzo, M.; Medana, C.; Nigro, D.; Boccuzzi, G.; Aragno, M. Advanced glycation end products promote hepatosteatosis by interfering with SCAP-SREBP pathway in fructose-drinking mice. Am. J. Physiol. Gastrointest. Liver Physiol. 2013, 305, G398–G407. [Google Scholar] [CrossRef] [PubMed] [Green Version]
  43. Sakasai-Sakai, A.; Takata, T.; Takeuchi, M. Intracellular Toxic Advanced Glycation End-Products Promote the Production of Reactive Oxygen Species in HepG2 Cells. Int. J. Mol. Sci. 2020, 21, 4861. [Google Scholar] [CrossRef]
  44. Shepherd, E.L.; Saborano, R.; Northall, E.; Matsuda, K.; Ogino, H.; Yashiro, H.; Pickens, J.; Feaver, R.E.; Cole, B.K.; Hoang, S.A.; et al. Ketohexokinase inhibition improves NASH by reducing fructose-induced steatosis and fibrogenesis. JHEP Rep. 2021, 3, 100217. [Google Scholar] [CrossRef]
  45. Tran, C. Inborn Errors of Fructose Metabolism. What Can We Learn from Them? Nutrients 2017, 9, 356. [Google Scholar] [CrossRef]
  46. Hanahan, D.; Weinberg, R.A. Hallmarks of cancer: The next generation. Cell 2011, 144, 646–674. [Google Scholar] [CrossRef] [PubMed] [Green Version]
  47. Fiolet, T.; Srour, B.; Sellem, L.; Kesse-Guyot, E.; Allès, B.; Méjean, C.; Deschasaux, M.; Fassier, P.; Latino-Martel, P.; Beslay, M.; et al. Consumption of ultra-processed foods and cancer risk: Results from NutriNet-Santé prospective cohort. BMJ 2018, 360, k322. [Google Scholar] [CrossRef] [Green Version]
  48. Guri, Y.; Colombi, M.; Dazert, E.; Hindupur, S.K.; Roszik, J.; Moes, S.; Jenoe, P.; Heim, M.H.; Riezman, I.; Riezman, H.; et al. mTORC2 Promotes Tumorigenesis via Lipid Synthesis. Cancer Cell 2017, 32, 807–823. [Google Scholar] [CrossRef] [Green Version]
  49. Hindupur, S.K.; Colombi, M.; Fuhs, S.R.; Matter, M.S.; Guri, Y.; Adam, K.; Cornu, M.; Piscuoglio, S.; Ng, C.K.Y.; Betz, C.; et al. The protein histidine phosphatase LHPP is a tumour suppressor. Nature 2018, 555, 678–682. [Google Scholar] [CrossRef]
  50. Li, L.; Pilo, G.M.; Li, X.; Cigliano, A.; Latte, G.; Che, L.; Joseph, C.; Mela, M.; Wang, C.; Jiang, L.; et al. Inactivation of fatty acid synthase impairs hepatocarcinogenesis driven by AKT in mice and humans. J. Hepatol. 2016, 64, 333–341. [Google Scholar] [CrossRef] [PubMed] [Green Version]
  51. Che, L.; Paliogiannis, P.; Cigliano, A.; Pilo, M.G.; Chen, X.; Calvisi, D.F. Pathogenetic, Prognostic, and Therapeutic Role of Fatty Acid Synthase in Human Hepatocellular Carcinoma. Front. Oncol. 2019, 9, 1412. [Google Scholar] [CrossRef] [PubMed]
  52. Tao, Q.F.; Yuan, S.X.; Yang, F.; Yang, S.; Yang, Y.; Yuan, J.H.; Wang, Z.G.; Xu, Q.G.; Lin, K.Y.; Cai, J.; et al. Aldolase B inhibits metastasis through Ten-Eleven Translocation 1 and serves as a prognostic biomarker in hepatocellular carcinoma. Mol. Cancer 2015, 14, 170. [Google Scholar] [CrossRef] [Green Version]
  53. He, X.; Li, M.; Yu, H.; Liu, G.; Wang, N.; Yin, C.; Tu, Q.; Narla, G.; Tao, Y.; Cheng, S.; et al. Loss of hepatic aldolase B activates Akt and promotes hepatocellular carcinogenesis by destabilizing the Aldob/Akt/PP2A protein complex. PLoS Biol. 2020, 18, e3000803. [Google Scholar] [CrossRef] [PubMed]
  54. Nakagawa, T.; Lanaspa, M.A.; Millan, I.S.; Fini, M.; Rivard, C.J.; Sanchez-Lozada, L.G.; Andres-Hernando, A.; Tolan, D.R.; Johnson, R.J. Fructose contributes to the Warburg effect for cancer growth. Cancer Metab. 2020, 8, 16. [Google Scholar] [CrossRef] [PubMed]
  55. Fu, Y.; Liu, S.; Yin, S.; Niu, W.; Xiong, W.; Tan, M.; Li, G.; Zhou, M. The reverse Warburg effect is likely to be an Achilles’ heel of cancer that can be exploited for cancer therapy. Oncotarget 2017, 8, 57813–57825. [Google Scholar] [CrossRef] [Green Version]
  56. Dewdney, B.; Roberts, A.; Qiao, L.; George, J.; Hebbard, L. A Sweet Connection? Fructose’s Role in Hepatocellular Carcinoma. Biomolecules 2020, 10, 496. [Google Scholar] [CrossRef] [Green Version]
  57. Xu, D.; Li, X.; Shao, F.; Lv, G.; Lv, H.; Lee, J.-H.; Qian, X.; Wang, Z.; Xia, Y.; Du, L.; et al. The protein kinase activity of fructokinase A specifies the antioxidant responses of tumor cells by phosphorylating p62. Sci. Adv. 2019, 5, eaav4570. [Google Scholar] [CrossRef] [Green Version]
  58. Liu, H.; Huang, D.; McArthur, D.L.; Boros, L.G.; Nissen, N.; Heaney, A.P. Fructose induces transketolase flux to promote pancreatic cancer growth. Cancer Res. 2010, 70, 6368–6376. [Google Scholar] [CrossRef] [Green Version]
  59. Kim, J.; Kang, J.; Kang, Y.L.; Woo, J.; Kim, Y.; Huh, J.; Park, J.W. Ketohexokinase-A acts as a nuclear protein kinase that mediates fructose-induced metastasis in breast cancer. Nat. Commun. 2020, 11, 5436. [Google Scholar] [CrossRef] [PubMed]
  60. García-Ruiz, C.; Fernández-Checa, J.C. Mitochondrial Oxidative Stress and Antioxidants Balance in Fatty Liver Disease. Hepatol. Commun. 2018, 2, 1425–1439. [Google Scholar] [CrossRef] [Green Version]
Figure 1. New cases and deaths estimated worldwide in both sexes and all ages related to cancer [1]. (a) Estimate number of new cases. (b) Estimate number of deaths. Data Source: GLOBOCAN 2020. Graph Production: International Agency for Research on Cancer (IARC) (https://gco.iarc.fr/today/home), World Health Organization. It was accessed on 19 June 2021.
Livers 01 00020 g001
Figure 2. Fructose and glucose metabolism in the enterocyte. Fructose and glucose enter the enterocyte through GLUT-5 and GLUT-2, respectively; the metabolism is different for each molecule. KHK-C first phosphorylates fructose in position 1 to be further cleaved by ALDO-B into intermediary metabolites (DHAP and G-3-P) that render the carbon skeleton to de novo lipid synthesis and PPP. Fru-1-P, G-3-P, and DHAP are intermediaries of fructolysis and can activate LXR translocation to the nucleus related with the increase of the expression of GLUT-5 and KHK-C. Xy-5-P is an intermediary of PPP that triggers ChREBP translocation to the nucleus. ChREBP upregulates the expression of fructose and lipogenesis-related genes. On the other hand, the rapid phosphorylation of fructose by KHK-C induces a decrement of ATP levels and favors the purine deamination pathway to obtain uric acid. In glucose, fructose metabolism improves the glycolytic pathway by decreasing ATP levels which generates positive pathway feedback. Furthermore, glucose can be converted into fructose through the polyol pathway to exacerbate the fructose effects in the liver. Green lines indicate activation of the enzymes. KHK, Ketohexokinase; ALDO-B, Aldolase B; ALDO-A, Aldolase A; TPI, Triosephosphate isomerase; PFK1, Phosphofructokinase; GPI, Glucose 6 phosphate isomerase; HK, Hexokinase; ACLY, ATP citrate lyase; ACAC, Acetyl-CoA carboxylase; FASN, Fatty acid synthase; PP2A, protein phosphatase 2A; ChREBP, carbohydrate response element-binding protein; LXR, Liver X receptor; GLUT-5, Glucose transporter-5; GLUT-2, Glucose transporter-2; SGLT-1, Sodium Glucose Cotransporter 1. Created with BioRender.com.
Livers 01 00020 g002
Figure 3. Fructose and glucose metabolism in hepatocytes and steatosis. Fructose and glucose enter the hepatocyte through GLUT-2; the metabolism is different for each molecule. KHK-C first phosphorylates fructose in position 1 to be further cleaved by ALDO-B into intermediary metabolites (DHAP and G-3-P) that render the carbon skeleton to de novo lipid synthesis and PPP. Xy-5-P is an intermediary of PPP that activates ChREBP translocation to the nucleus. ChREBP upregulates the expression of fructose and lipogenesis-related genes. On the other hand, the rapid phosphorylation of fructose by KHK-C induces a decrement of ATP levels and favors the purine deamination pathway to obtain uric acid. Uric acid enhances ROS production in the mitochondrion and affects aconitase activity, incrementing citrate levels incorporated into the de novo synthesis pathway. Furthermore, higher amounts of Citrate can lead to insulin resistance in the liver through the inhibition of IRS-2. In glucose, fructose metabolism improves the glycolytic pathway by decreasing ATP levels which generates positive pathway feedback. Moreover, glucose can be converted into fructose through the polyol pathway to exacerbate the fructose effects in the liver. Green lines indicate activation of the enzymes. GLUT-2, Glucose transporter-2; KHK, Ketohexokinase; ALDO-B, Aldolase B; ALDO-A, Aldolase A; TPI, Triosephosphate isomerase; PFK1, Phosphofructokinase; GPI, Glucose 6 phosphate isomerase; HK, Hexokinase; ACLY, ATP citrate lyase; ACAC, Acetyl-CoA carboxylase; FASN, Fatty acid synthase; PP2A, protein phosphatase 2A; ChREBP, carbohydrate response element-binding protein; ChoRE, carbohydrate response elements; IRS-2, insulin receptor substrate 2; DAG, Diacylglycerol; PKC-ε, Protein kinase C isoform ε; JNK-1, Jun N-terminal kinase 1. Created with BioRender.com.
Livers 01 00020 g003
Figure 4. Fructose metabolism reprogramming in cancer cells. Fructose metabolism changes into lower levels of expression and activity of the enzymes implicated in the pathway. First, there is a change in the KHK isoform (KHK-A) to favor the enzyme’s lower fructose metabolism and kinase activity. Furthermore, ALDO-B decreases its activity. The intermediary metabolites are diverted into the PPP to obtain reduction power and Xy-5-P, enhancing ChREBP translocation into the nucleus and nucleic acid synthesis. Due to the lower KHK activity, ROS levels diminish compared to the earlier scenario but can activate CAFs. On the other hand, the reverse Warburg effect is representative of this metabolism, and CAFs render metabolic intermediaries to a cancer cell to enhance de novo lipid synthesis and reduction power. Metabolic reprogramming is implicated in improving the survival, proliferation, and metastasis of cancer cells. Red lines indicate inhibition. GLUT-2, Glucose transporter-2; KHK, Ketohexokinase; ALDO-B, Aldolase B; ALDO-A, Aldolase A; TPI, Triosephosphate isomerase; PFK1, Phosphofructokinase; GPI, Glucose 6 phosphate isomerase; HK, Hexokinase; ACLY, ATP citrate lyase; ACAC, Acetyl-CoA carboxylase; FASN, Fatty acid synthase; PP2A, protein phosphatase 2A; ChREBP, carbohydrate response element-binding protein; ChoRE, carbohydrate response elements. Created with BioRender.com.
Livers 01 00020 g004
Publisher’s Note: MDPI stays neutral with regard to jurisdictional claims in published maps and institutional affiliations.

