
Feasibility of Novel Software-Based Perfusion Indicators for the Ileal J-Pouch—On the Path towards Objective and Quantifiable Intraoperative Perfusion Assessment with Indocyanine Green Near-Infrared Fluorescence

 , , , , and
Abstract
:1. Introduction
2. Materials and Methods
2.1. Surgical Technique
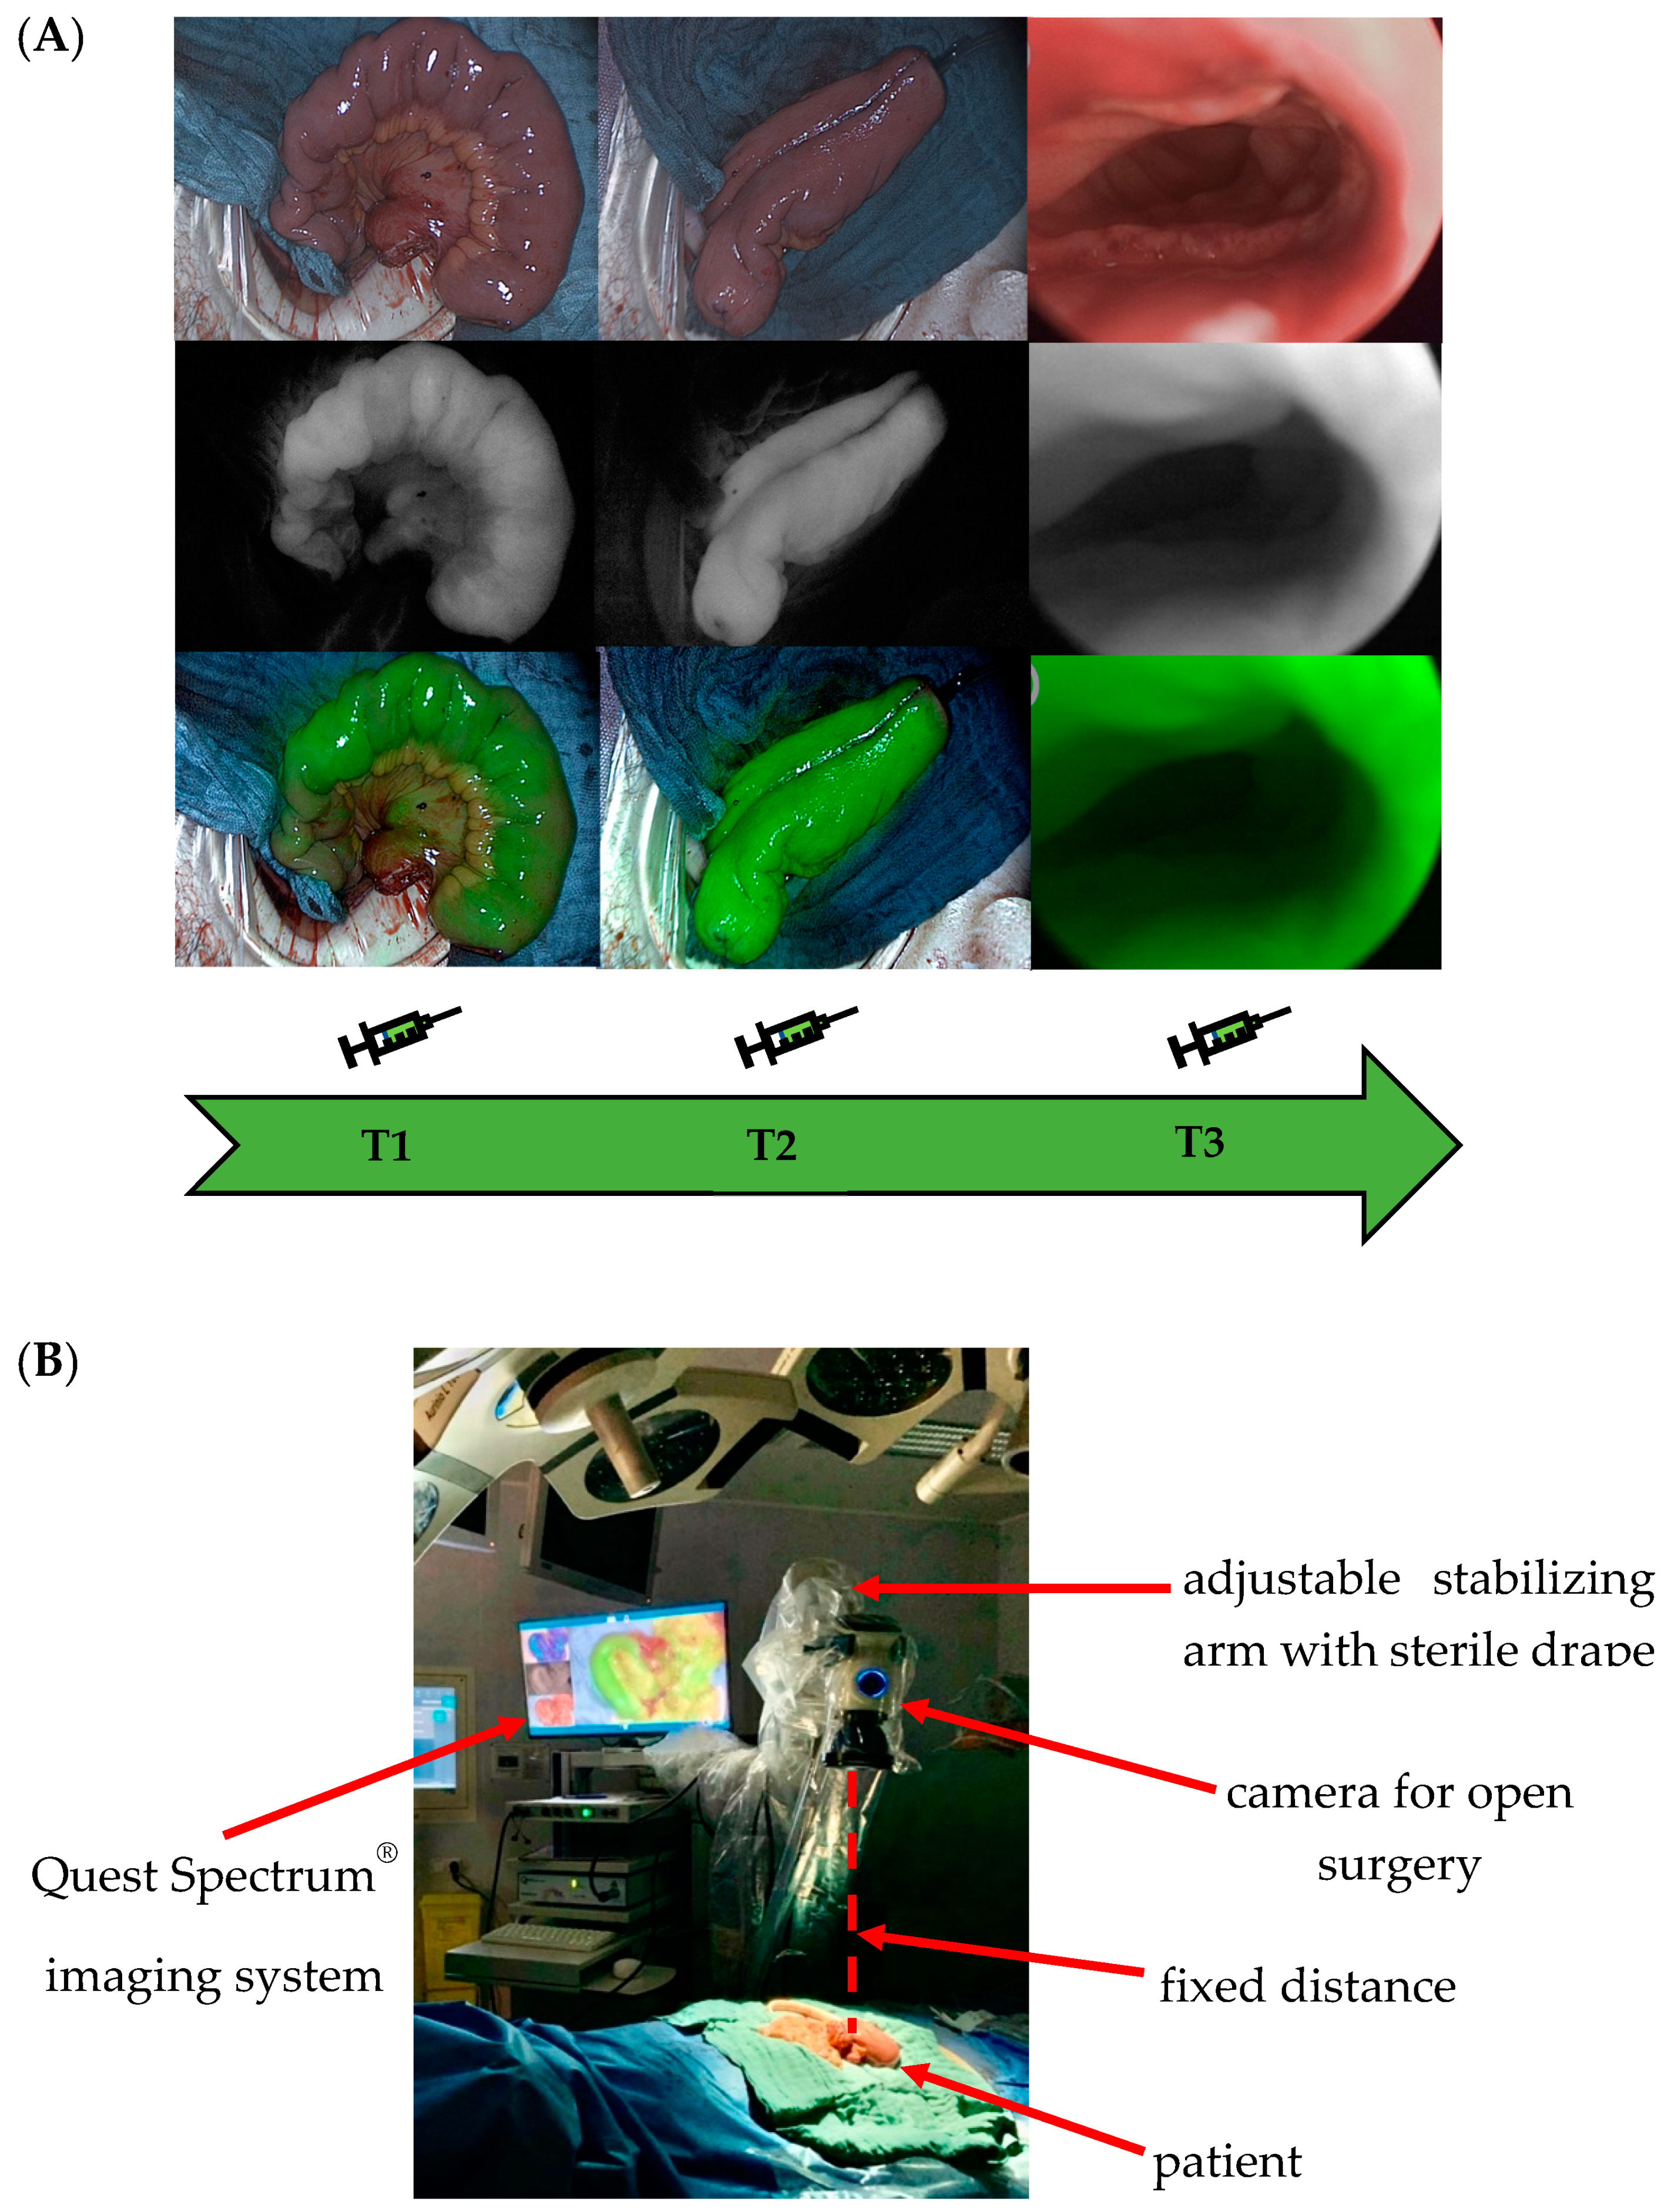
2.2. Intraoperative ICG-NIRF Perfusion Visualization
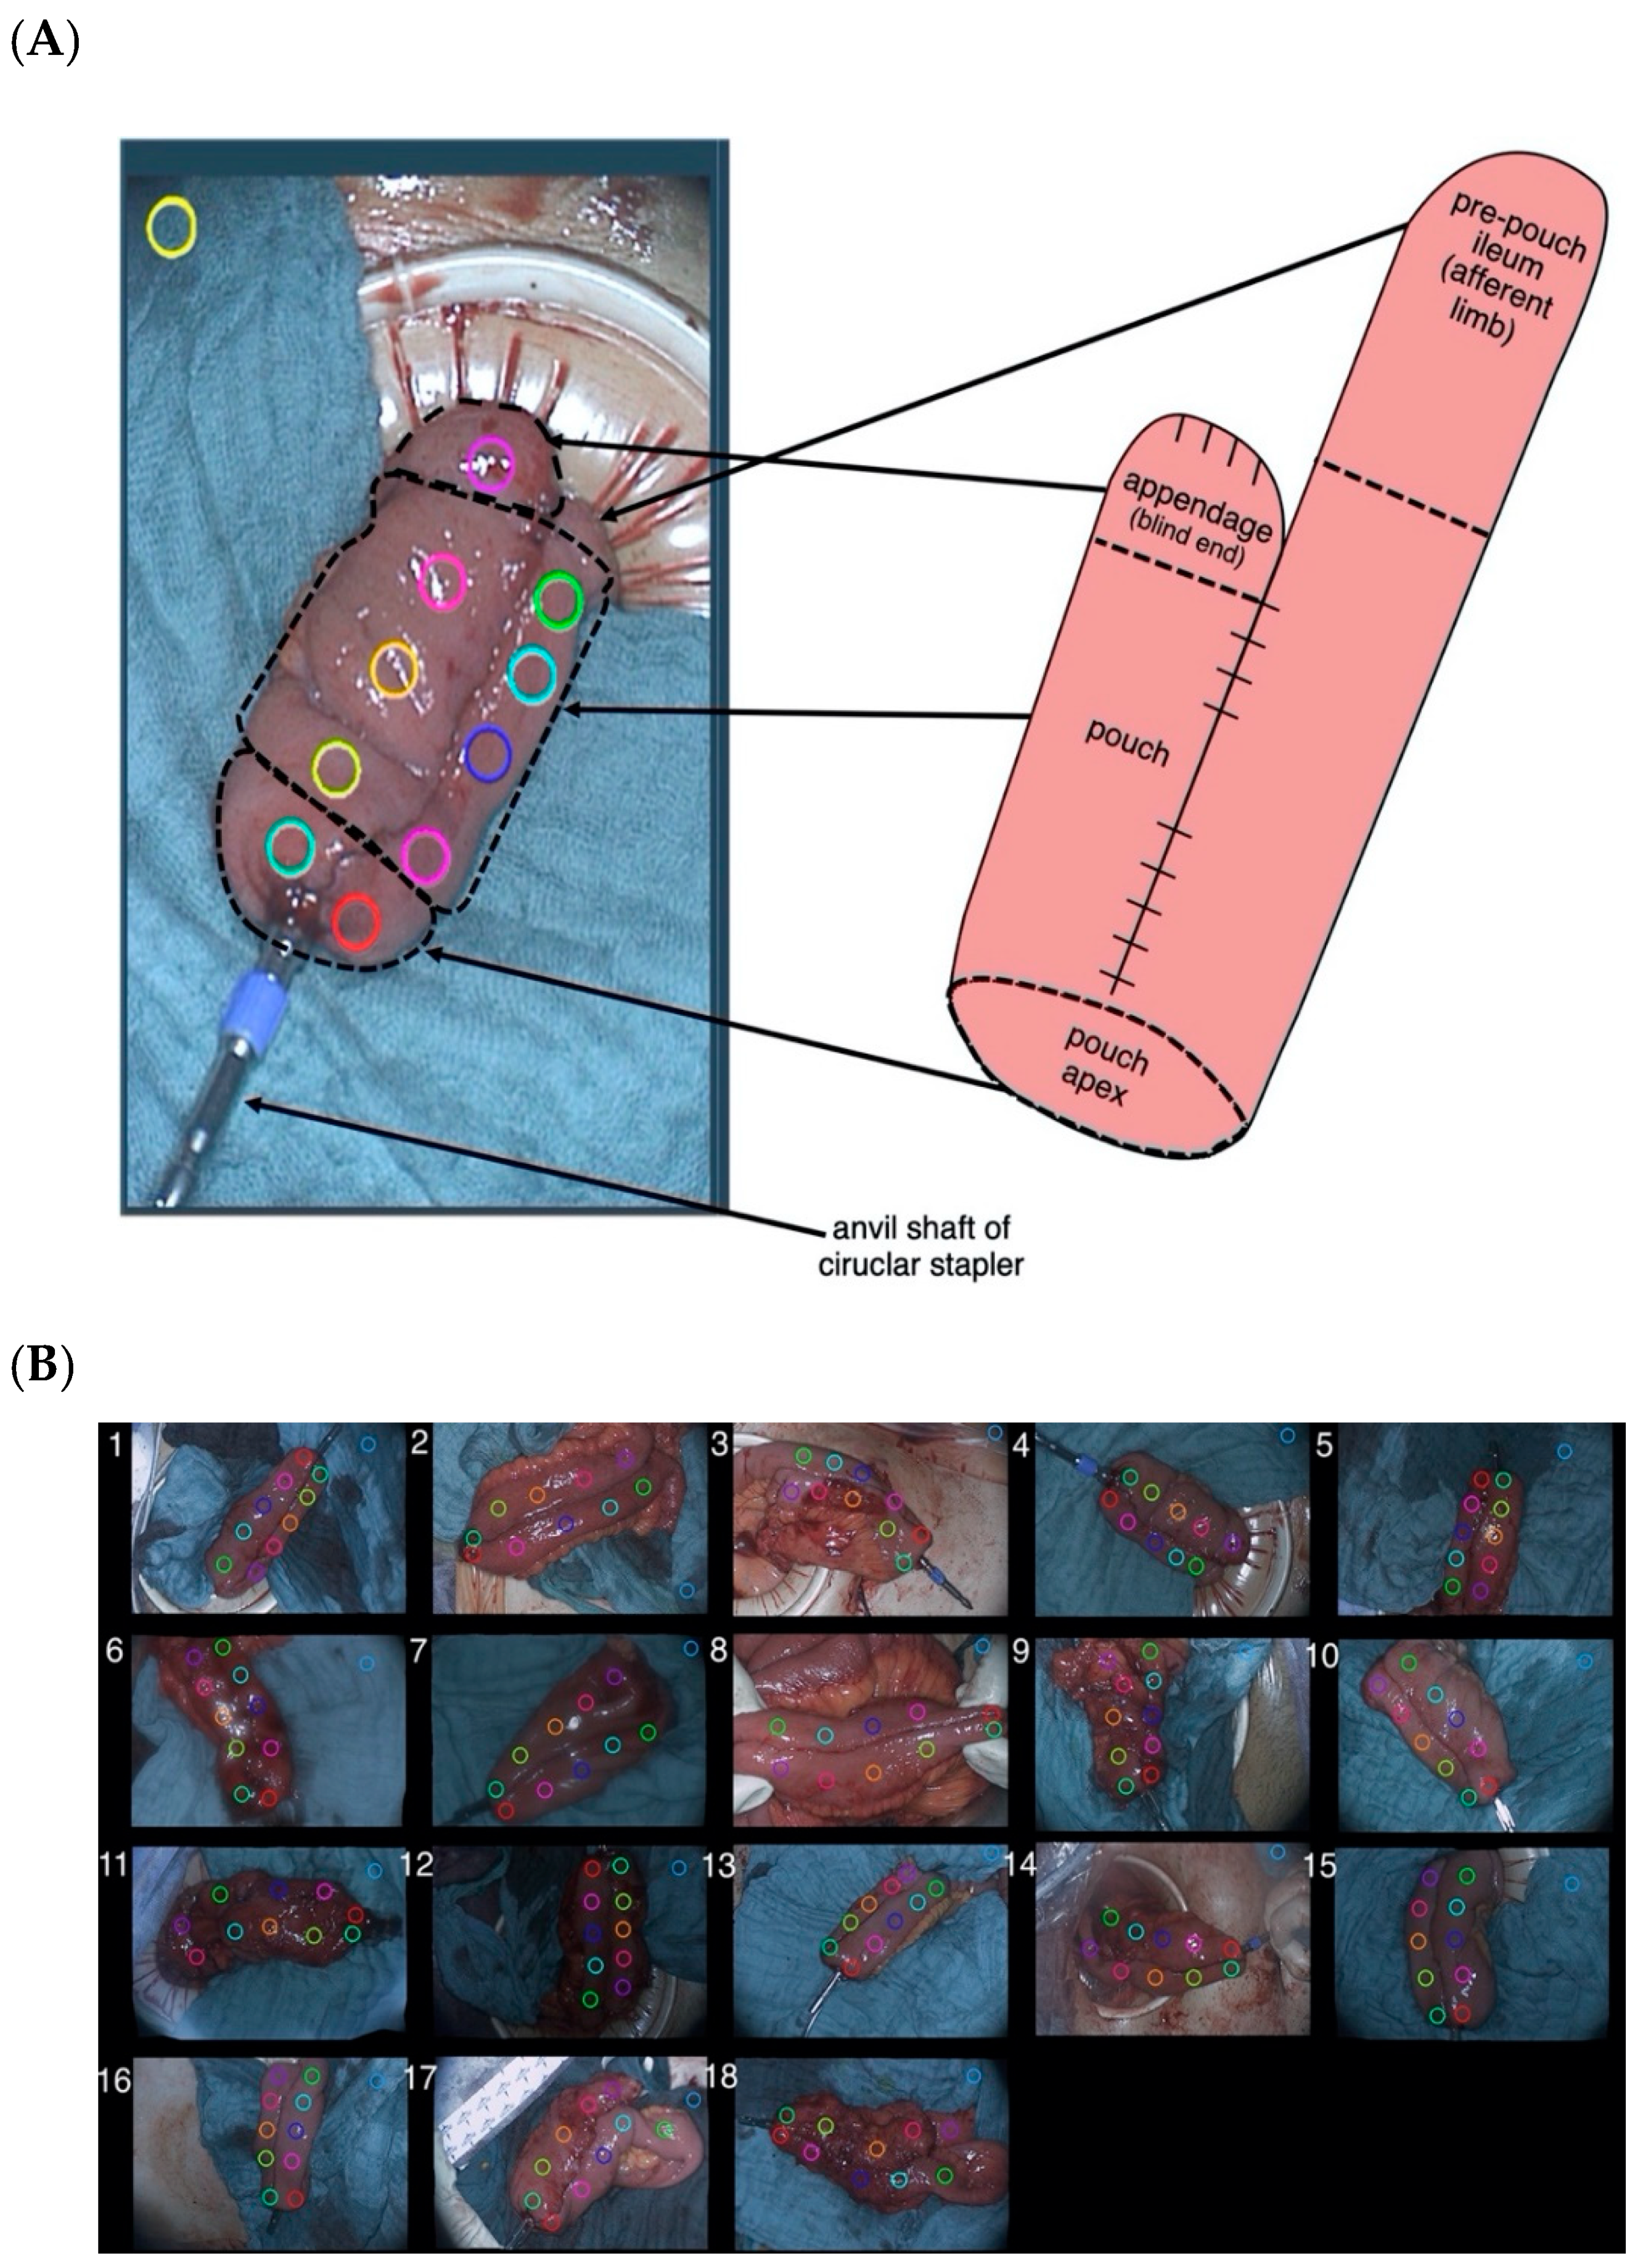
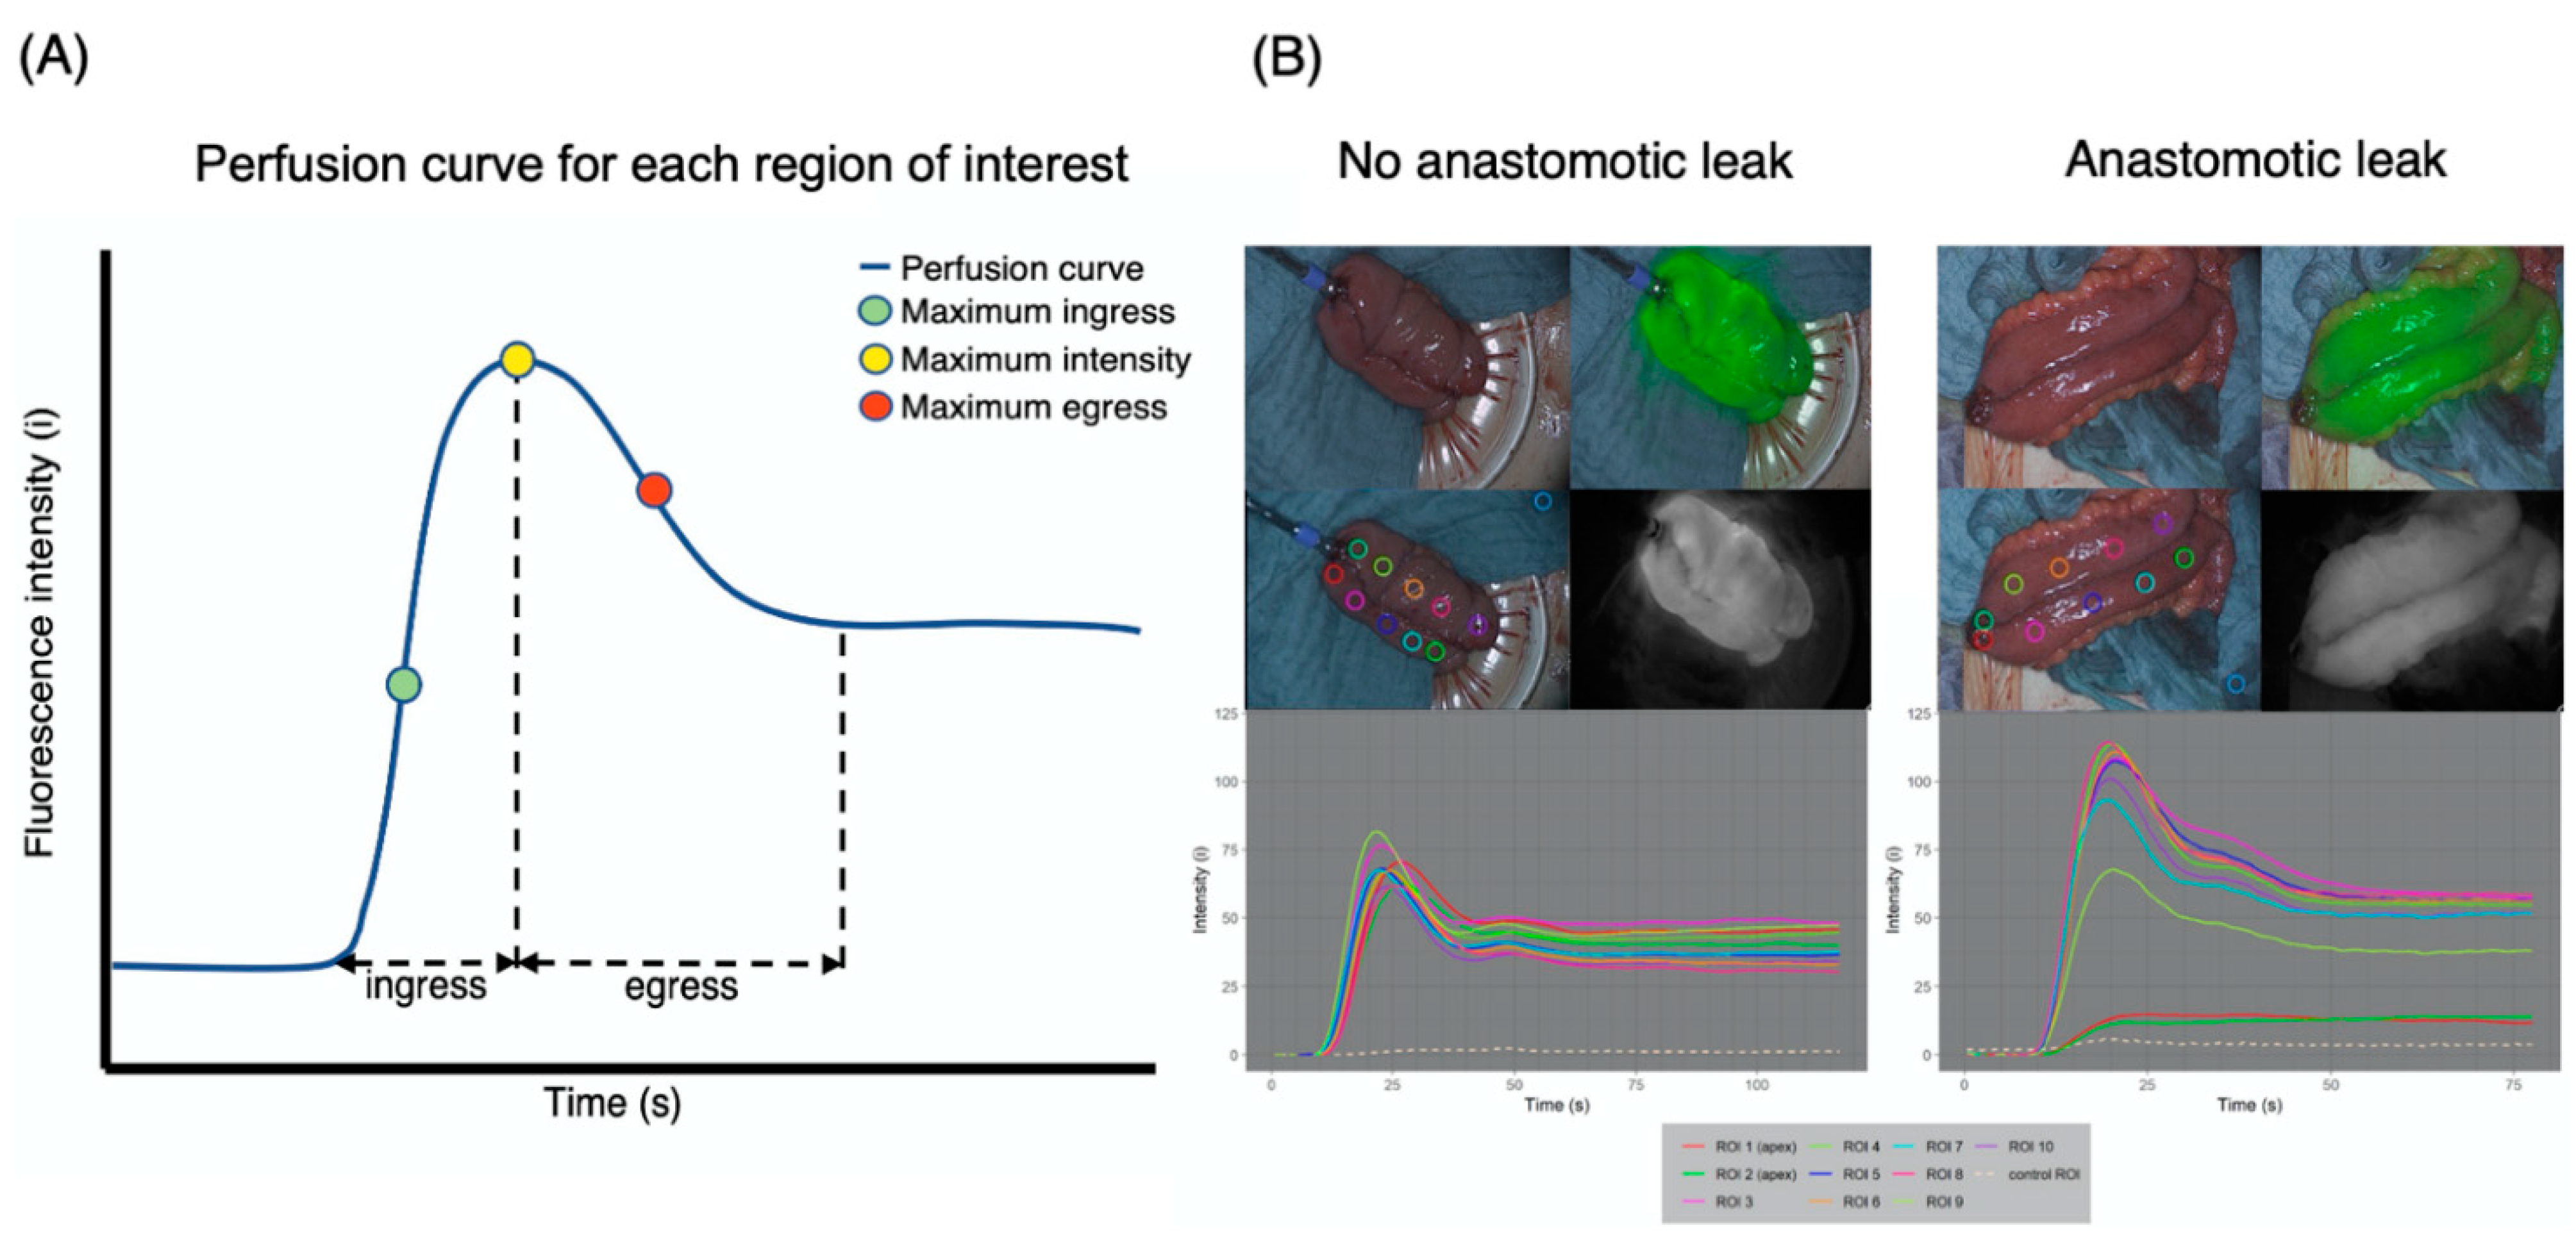
2.3. Postoperative ICG-NIRF Perfusion Rate Assessment
2.4. Definition of Anastomotic Leak
2.5. Clinical Data and Follow-Up
2.6. Primary and Secondary End Points
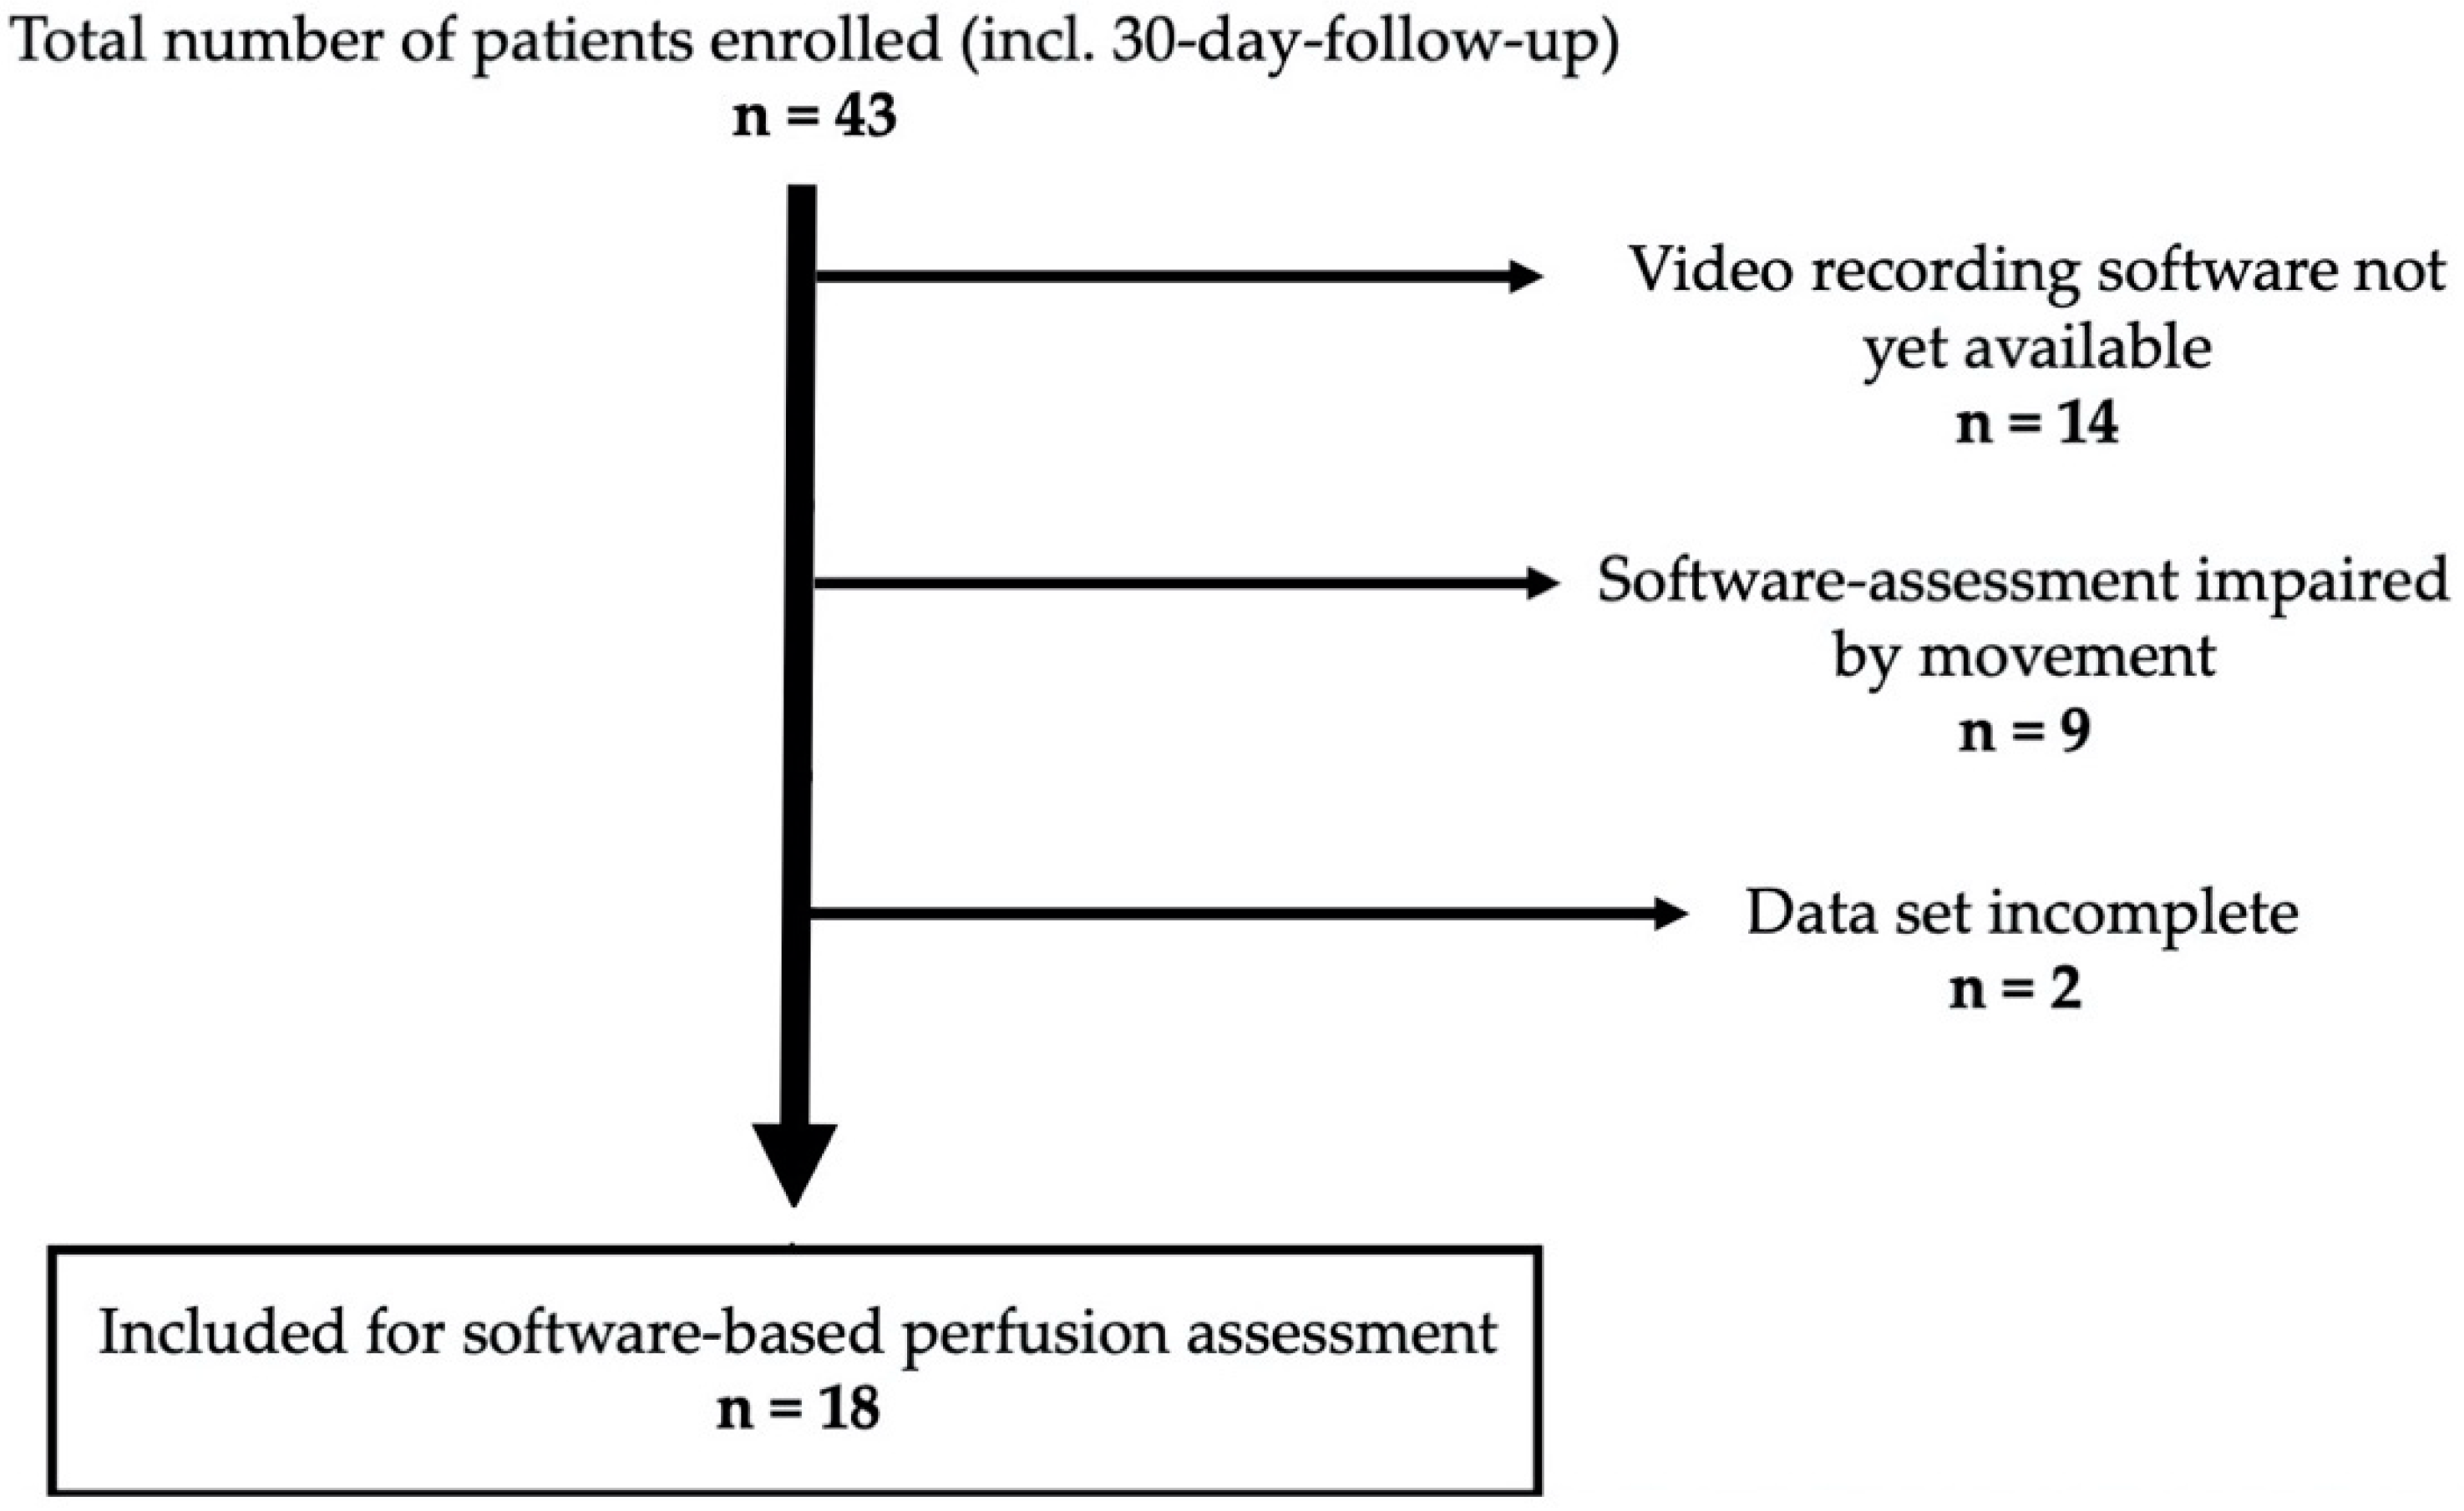
2.7. Sample Size
3. Results
4. Discussion
5. Conclusions
Author Contributions
Funding
Institutional Review Board Statement
Informed Consent Statement
Data Availability Statement
Acknowledgments
Conflicts of Interest
References
- Ng, K.-S.; Gonsalves, S.J.; Sagar, P.M. Ileal-anal pouches: A review of its history, indications, and complications. World J. Gastroenterol. 2019, 25, 4320–4342. [Google Scholar] [CrossRef] [PubMed]
- Jansen-Winkeln, B.; Lyros, O.; Lachky, A.; Teich, N.; Gockel, I. How does the ileoanal pouch keep its promises? Functioning of the ileoanal pouch after restorative proctocolectomy. Chir. Z. Alle Geb. Oper. Medizen 2017, 88, 1033–1039. [Google Scholar] [CrossRef] [PubMed]
- Maggiori, L.; Michelassi, F. Ileal J-pouch construction. J. Gastrointest. Surg. Off. J. Soc. Surg. Aliment. Tract 2013, 17, 408–415. [Google Scholar] [CrossRef] [PubMed]
- Ikeuchi, H.; Uchino, M.; Matsuoka, H.; Bando, T.; Matsumoto, T.; Tomita, N.; Syoji, Y.; Kusunoki, M.; Yamamura, T.; Utsunomiya, J. Surgery for ulcerative colitis in 1000 patients. Int. J. Colorectal Dis. 2010, 25, 959–965. [Google Scholar] [CrossRef]
- Travis, S.P.; Stange, E.F.; Lémann, M.; Oresland, T.; Bemelman, W.A.; Chowers, Y.; Colombel, J.F.; D’Haens, G.; Ghosh, S.; Marteau, P.; et al. European evidence-based Consensus on the management of ulcerative colitis: Current management. J. Crohns Colitis 2008, 2, 24–62. [Google Scholar] [CrossRef] [Green Version]
- Sheedy, S.P.; Bartlett, D.J.; Lightner, A.L.; Trenkner, S.W.; Bruining, D.H.; Fidler, J.L.; VanBuren, W.M.; Menias, C.O.; Reber, J.D.; Fletcher, J.G. Judging the J pouch: A pictorial review. Abdom. Radiol. 2019, 44, 845–866. [Google Scholar] [CrossRef]
- Murphy, P.B.; Khot, Z.; Vogt, K.N.; Ott, M.; Dubois, L. Quality of Life after Total Proctocolectomy with Ileostomy or IPAA: A Systematic Review. Dis. Colon Rectum 2015, 58, 899–908. [Google Scholar] [CrossRef]
- Heikens, J.T.; de Vries, J.; Goos, M.R.; Oostvogel, H.J.; Gooszen, H.G.; van Laarhoven, C.J. Quality of life and health status before and after ileal pouch-anal anastomosis for ulcerative colitis. Br. J. Surg. 2012, 99, 263–269. [Google Scholar] [CrossRef]
- Heuschen, U.; Schmidt, J.; Allemeyer, E.; Stern, J.; Heuschen, G. The ileo-anal pouch procedure: Complications, quality of life, and long-term results. Zent. Chir. 2001, 126 (Suppl. S1), 36–42. [Google Scholar] [CrossRef]
- Gorgun, E.; Remzi, F.H. Complications of ileoanal pouches. Clin. Colon Rectal Surg. 2004, 17, 43–55. [Google Scholar] [CrossRef] [Green Version]
- Worley, G.H.T.; Segal, J.P.; Warusavitarne, J.; Clark, S.K.; Faiz, O.D. Management of early pouch-related septic complications in ulcerative colitis: A systematic review. Colorectal Dis. Off. J. Assoc. Coloproctol. Great Br. Irel. 2018, 20, O181–O189. [Google Scholar] [CrossRef]
- Shen, B. Problems after restorative proctocolectomy: Assessment and therapy. Curr. Opin. Gastroenterol. 2016, 32, 49–54. [Google Scholar] [CrossRef]
- Leinicke, J.A. Ileal Pouch Complications. Surg. Clin. N. Am. 2019, 99, 1185–1196. [Google Scholar] [CrossRef]
- Lovegrove, R.E.; Heriot, A.G.; Constantinides, V.; Tilney, H.S.; Darzi, A.W.; Fazio, V.W.; Nicholls, R.J.; Tekkis, P.P. Meta-analysis of short-term and long-term outcomes of J, W and S ileal reservoirs for restorative proctocolectomy. Colorectal Dis. Off. J. Assoc. Coloproctol. Great Br. Irel. 2007, 9, 310–320. [Google Scholar] [CrossRef]
- Lovegrove, R.E.; Constantinides, V.A.; Heriot, A.G.; Athanasiou, T.; Darzi, A.; Remzi, F.H.; Nicholls, R.J.; Fazio, V.W.; Tekkis, P.P. A comparison of hand-sewn versus stapled ileal pouch anal anastomosis (IPAA) following proctocolectomy: A meta-analysis of 4183 patients. Ann. Surg. 2006, 244, 18–26. [Google Scholar] [CrossRef]
- Shen, B.; Remzi, F.H.; Lavery, I.C.; Lashner, B.A.; Fazio, V.W. A proposed classification of ileal pouch disorders and associated complications after restorative proctocolectomy. Clin. Gastroenterol. Hepatol. Off. Clin. Pract. J. Am. Gastroenterol. Assoc. 2008, 6, 145–158; quiz 124. [Google Scholar] [CrossRef]
- Fazio, V.W.; Kiran, R.P.; Remzi, F.H.; Coffey, J.C.; Heneghan, H.M.; Kirat, H.T.; Manilich, E.; Shen, B.; Martin, S.T. Ileal pouch anal anastomosis: Analysis of outcome and quality of life in 3707 patients. Ann. Surg. 2013, 257, 679–685. [Google Scholar] [CrossRef]
- Kienle, P.; Weitz, J.; Reinshagen, S.; Magener, A.; Autschbach, F.; Benner, A.; Stern, J.; Herfarth, C. Association of decreased perfusion of the ileoanal pouch mucosa with early postoperative pouchitis and local septic complications. Arch. Surg. 2001, 136, 1124–1130. [Google Scholar] [CrossRef] [Green Version]
- Manilich, E.; Remzi, F.H.; Fazio, V.W.; Church, J.M.; Kiran, R.P. Prognostic modeling of preoperative risk factors of pouch failure. Dis. Colon Rectum 2012, 55, 393–399. [Google Scholar] [CrossRef]
- Karliczek, A.; Harlaar, N.J.; Zeebregts, C.J.; Wiggers, T.; Baas, P.C.; van Dam, G.M. Surgeons lack predictive accuracy for anastomotic leakage in gastrointestinal surgery. Int. J. Colorectal Dis. 2009, 24, 569–576. [Google Scholar] [CrossRef] [Green Version]
- Urbanavičius, L.; Pattyn, P.; de Putte, D.V.; Venskutonis, D. How to assess intestinal viability during surgery: A review of techniques. World J. Gastrointest. Surg. 2011, 3, 59–69. [Google Scholar] [CrossRef] [PubMed]
- van den Bos, J.; Al-Taher, M.; Schols, R.M.; van Kuijk, S.; Bouvy, N.D.; Stassen, L.P.S. Near-Infrared Fluorescence Imaging for Real-Time Intraoperative Guidance in Anastomotic Colorectal Surgery: A Systematic Review of Literature. J. Laparoendosc. Adv. Surg. Tech. Part A 2018, 28, 157–167. [Google Scholar] [CrossRef] [PubMed]
- Lütken, C.D.; Achiam, M.P.; Osterkamp, J.; Svendsen, M.B.; Nerup, N. Quantification of fluorescence angiography: Toward a reliable intraoperative assessment of tissue perfusion—A narrative review. Langenbeck’s Arch. Surg. 2021, 406, 251–259. [Google Scholar] [CrossRef] [PubMed]
- Zhang, W.; Che, X. Effect of indocyanine green fluorescence angiography on preventing anastomotic leakage after colorectal surgery: A meta-analysis. Surg. Today 2021, 51, 1415–1428. [Google Scholar] [CrossRef]
- Blanco-Colino, R.; Espin-Basany, E. Intraoperative use of ICG fluorescence imaging to reduce the risk of anastomotic leakage in colorectal surgery: A systematic review and meta-analysis. Tech. Coloproctol. 2018, 22, 15–23. [Google Scholar] [CrossRef]
- Jafari, M.D.; Pigazzi, A.; McLemore, E.C.; Mutch, M.G.; Haas, E.; Rasheid, S.H.; Wait, A.D.; Paquette, I.M.; Bardakcioglu, O.; Safar, B.; et al. Perfusion Assessment in Left-Sided/Low Anterior Resection (PILLAR III): A Randomized, Controlled, Parallel, Multicenter Study Assessing Perfusion Outcomes with PINPOINT Near-Infrared Fluorescence Imaging in Low Anterior Resection. Dis. Colon Rectum 2021, 64, 995–1002. [Google Scholar] [CrossRef]
- Hardy, N.P.; Dalli, J.; Khan, M.F.; Andrejevic, P.; Neary, P.M.; Cahill, R.A. Inter-user variation in the interpretation of near infrared perfusion imaging using indocyanine green in colorectal surgery. Surg. Endosc. 2021, 35, 7074–7081. [Google Scholar] [CrossRef]
- Gomez-Rosado, J.-C.; Valdes-Hernandez, J.; Cintas-Catena, J.; Cano-Matias, A.; Perez-Sanchez, A.; del Rio-Lafuente, F.-J.; Torres-Arcos, C.; Lara-Fernandez, Y.; Capitan-Morales, L.-C.; Oliva-Mompean, F. Feasibility of quantitative analysis of colonic perfusion using indocyanine green to prevent anastomotic leak in colorectal surgery. Surg. Endosc. 2022, 36, 1688–1695. [Google Scholar] [CrossRef]
- Gosvig, K.; Jensen, S.S.; Qvist, N.; Agnus, V.; Jensen, T.S.; Lindner, V.; Marescaux, J.; Diana, M.; Ellebaek, M.B. Remote computer-assisted analysis of ICG fluorescence signal for evaluation of small intestinal anastomotic perfusion: A blinded, randomized, experimental trial. Surg. Endosc. 2020, 34, 2095–2102. [Google Scholar] [CrossRef]
- Gosvig, K.; Jensen, S.S.; Qvist, N.; Nerup, N.; Agnus, V.; Diana, M.; Ellebæk, M.B. Quantification of ICG fluorescence for the evaluation of intestinal perfusion: Comparison between two software-based algorithms for quantification. Surg. Endosc. 2021, 35, 5043–5050. [Google Scholar] [CrossRef]
- von Elm, E.; Altman, D.G.; Egger, M.; Pocock, S.J.; Gøtzsche, P.C.; Vandenbroucke, J.P. The Strengthening the Reporting of Observational Studies in Epidemiology (STROBE) statement: Guidelines for reporting observational studies. J. Clin. Epidemiol. 2008, 61, 344–349. [Google Scholar] [CrossRef] [Green Version]
- Rahbari, N.N.; Weitz, J.; Hohenberger, W.; Heald, R.J.; Moran, B.; Ulrich, A.; Holm, T.; Wong, W.D.; Tiret, E.; Moriya, Y.; et al. Definition and grading of anastomotic leakage following anterior resection of the rectum: A proposal by the International Study Group of Rectal Cancer. Surgery 2010, 147, 339–351. [Google Scholar] [CrossRef]
- Liu, D.; Liang, L.; Liu, L.; Zhu, Z. Does intraoperative indocyanine green fluorescence angiography decrease the incidence of anastomotic leakage in colorectal surgery? A systematic review and meta-analysis. Int. J. Colorectal Dis. 2021, 36, 57–66. [Google Scholar] [CrossRef]
- Nishikawa, T.; Kawai, K.; Ishii, H.; Emoto, S.; Murono, K.; Kaneko, M.; Sasaki, K.; Shuno, Y.; Tanaka, T.; Hata, K.; et al. The impact of indocyanine-green fluorescence imaging on intraluminal perfusion of a J-pouch. Tech. Coloproctol. 2019, 23, 931–932. [Google Scholar] [CrossRef]
- Joosten, J.J.; Reijntjes, M.A.; Slooter, M.D.; Duijvestein, M.; Buskens, C.J.; Bemelman, W.A.; Hompes, R. Fluorescence angiography after vascular ligation to make the ileo-anal pouch reach. Tech. Coloproctol. 2021, 25, 875–878. [Google Scholar] [CrossRef]
- Freund, M.R.; Kent, I.; Agarwal, S.; Wexner, S.D. Use of indocyanine green fluorescence angiography during ileal J-pouch surgery requiring lengthening maneuvers. Tech. Coloproctol. 2022, 26, 181–186. [Google Scholar] [CrossRef]
- Spinelli, A.; Carvello, M.; Kotze, P.G.; Maroli, A.; Montroni, I.; Montorsi, M.; Buchs, N.C.; Ris, F. Ileal pouch-anal anastomosis with fluorescence angiography: A case-matched study. Colorectal Dis. Off. J. Assoc. Coloproctol. Great Br. Irel. 2019, 21, 827–832. [Google Scholar] [CrossRef]
- Lobbes, L.A.; Berns, S.; Warschkow, R.; Schmidt, L.R.; Schineis, C.; Strobel, R.M.; Lauscher, J.C.; Beyer, K.; Weixler, B. Perfusion Visualization during Ileal J-Pouch Formation—A Proposal for the Standardization of Intraoperative Imaging with Indocyanine Green Near-Infrared Fluorescence and a Postoperative Follow-Up in IBD Surgery. Life 2022, 12, 668. [Google Scholar] [CrossRef]
- Slooter, M.D.; Mansvelders, M.S.E.; Bloemen, P.R.; Gisbertz, S.S.; Bemelman, W.A.; Tanis, P.J.; Hompes, R.; van Berge Henegouwen, M.I.; de Bruin, D.M. Defining indocyanine green fluorescence to assess anastomotic perfusion during gastrointestinal surgery: Systematic review. BJS Open 2021, 5, zraa074. [Google Scholar] [CrossRef]
- Jansen, S.M.; de Bruin, D.M.; Wilk, L.S.; van Berge Henegouwen, M.I.; Strackee, S.D.; Gisbertz, S.S.; van Bavel, E.T.; van Leeuwen, T.G. Quantitative Fluorescence Imaging of Perfusion—An Algorithm to Predict Anastomotic Leakage. Life 2022, 12, 249. [Google Scholar] [CrossRef]
- Higashijima, J.; Kono, T.; Shimada, M.; Sugitani, A.; Kashihara, H.; Takasu, C.; Nishi, M.; Tokunaga, T.; Yoshikawa, K. High Ligation of the Inferior Mesenteric Artery Induces Hypoperfusion of the Sigmoid Colon Stump during Anterior Resection. Front. Surg. 2021, 8, 756873. [Google Scholar] [CrossRef] [PubMed]
- Lobbes, L.A.; Hoveling, R.J.M.; Schmidt, L.R.; Berns, S.; Weixler, B. Objective Perfusion Assessment in Gracilis Muscle Interposition-A Novel Software-Based Approach to Indocyanine Green Derived Near-Infrared Fluorescence in Reconstructive Surgery. Life 2022, 12, 278. [Google Scholar] [CrossRef] [PubMed]


| Characteristic | All Patients (n = 18) | No Anastomotic Leak (n = 14) | Anastomotic Leak | |
|---|---|---|---|---|
| Sex | male | 8 | 6 | 2 |
| female | 10 | 8 | 2 | |
| ASA physical status | I | 1 | 1 | 0 |
| II | 14 | 11 | 3 | |
| III | 3 | 2 | 1 | |
| Underlying condition | ulcerative colitis | 17 | 14 | 3 |
| Crohn’s disease | 0 | 0 | 0 | |
| indeterminate colitis | 1 | 0 | 1 | |
| Disease category | malignant | 1 | 1 | 0 |
| medically refractory | 17 | 13 | 4 | |
| Preoperative prednisolone | yes | 0 | 0 | 0 |
| no | 18 | 14 | 4 | |
| Additional immunosuppressive medication | yes | 5 | 2 | 3 |
| no | 13 | 12 | 1 | |
| Type of surgery | laparoscopic | 14 | 11 | 3 |
| open | 4 | 3 | 1 | |
| Two- or three-stage approach | Two-stage | 3 | 1 | 2 |
| Three-stage | 15 | 13 | 2 | |
| Hand-sewn IPAA | yes | 4 | 4 | 0 |
| no | 14 | 10 | 4 | |
| Intraoperative change of anastomotic site | yes | 0 | 0 | 0 |
| no | 18 | 14 | 4 | |
| Age at operation (years) | mean | 35.8 | 34.4 | 40.7 |
| median | 34.4 | 32.0 | 35.9 | |
| range | 19.9–57.0 | 19.9–57.0 | 34.8–56.0 | |
| BMI (kg/m2) | mean | 24.9 | 25.0 | 24.7 |
| median | 24.7 | 24.7 | 23.7 | |
| range | 18.2–34.6 | 18.0–34.6 | 18.2–33.1 | |
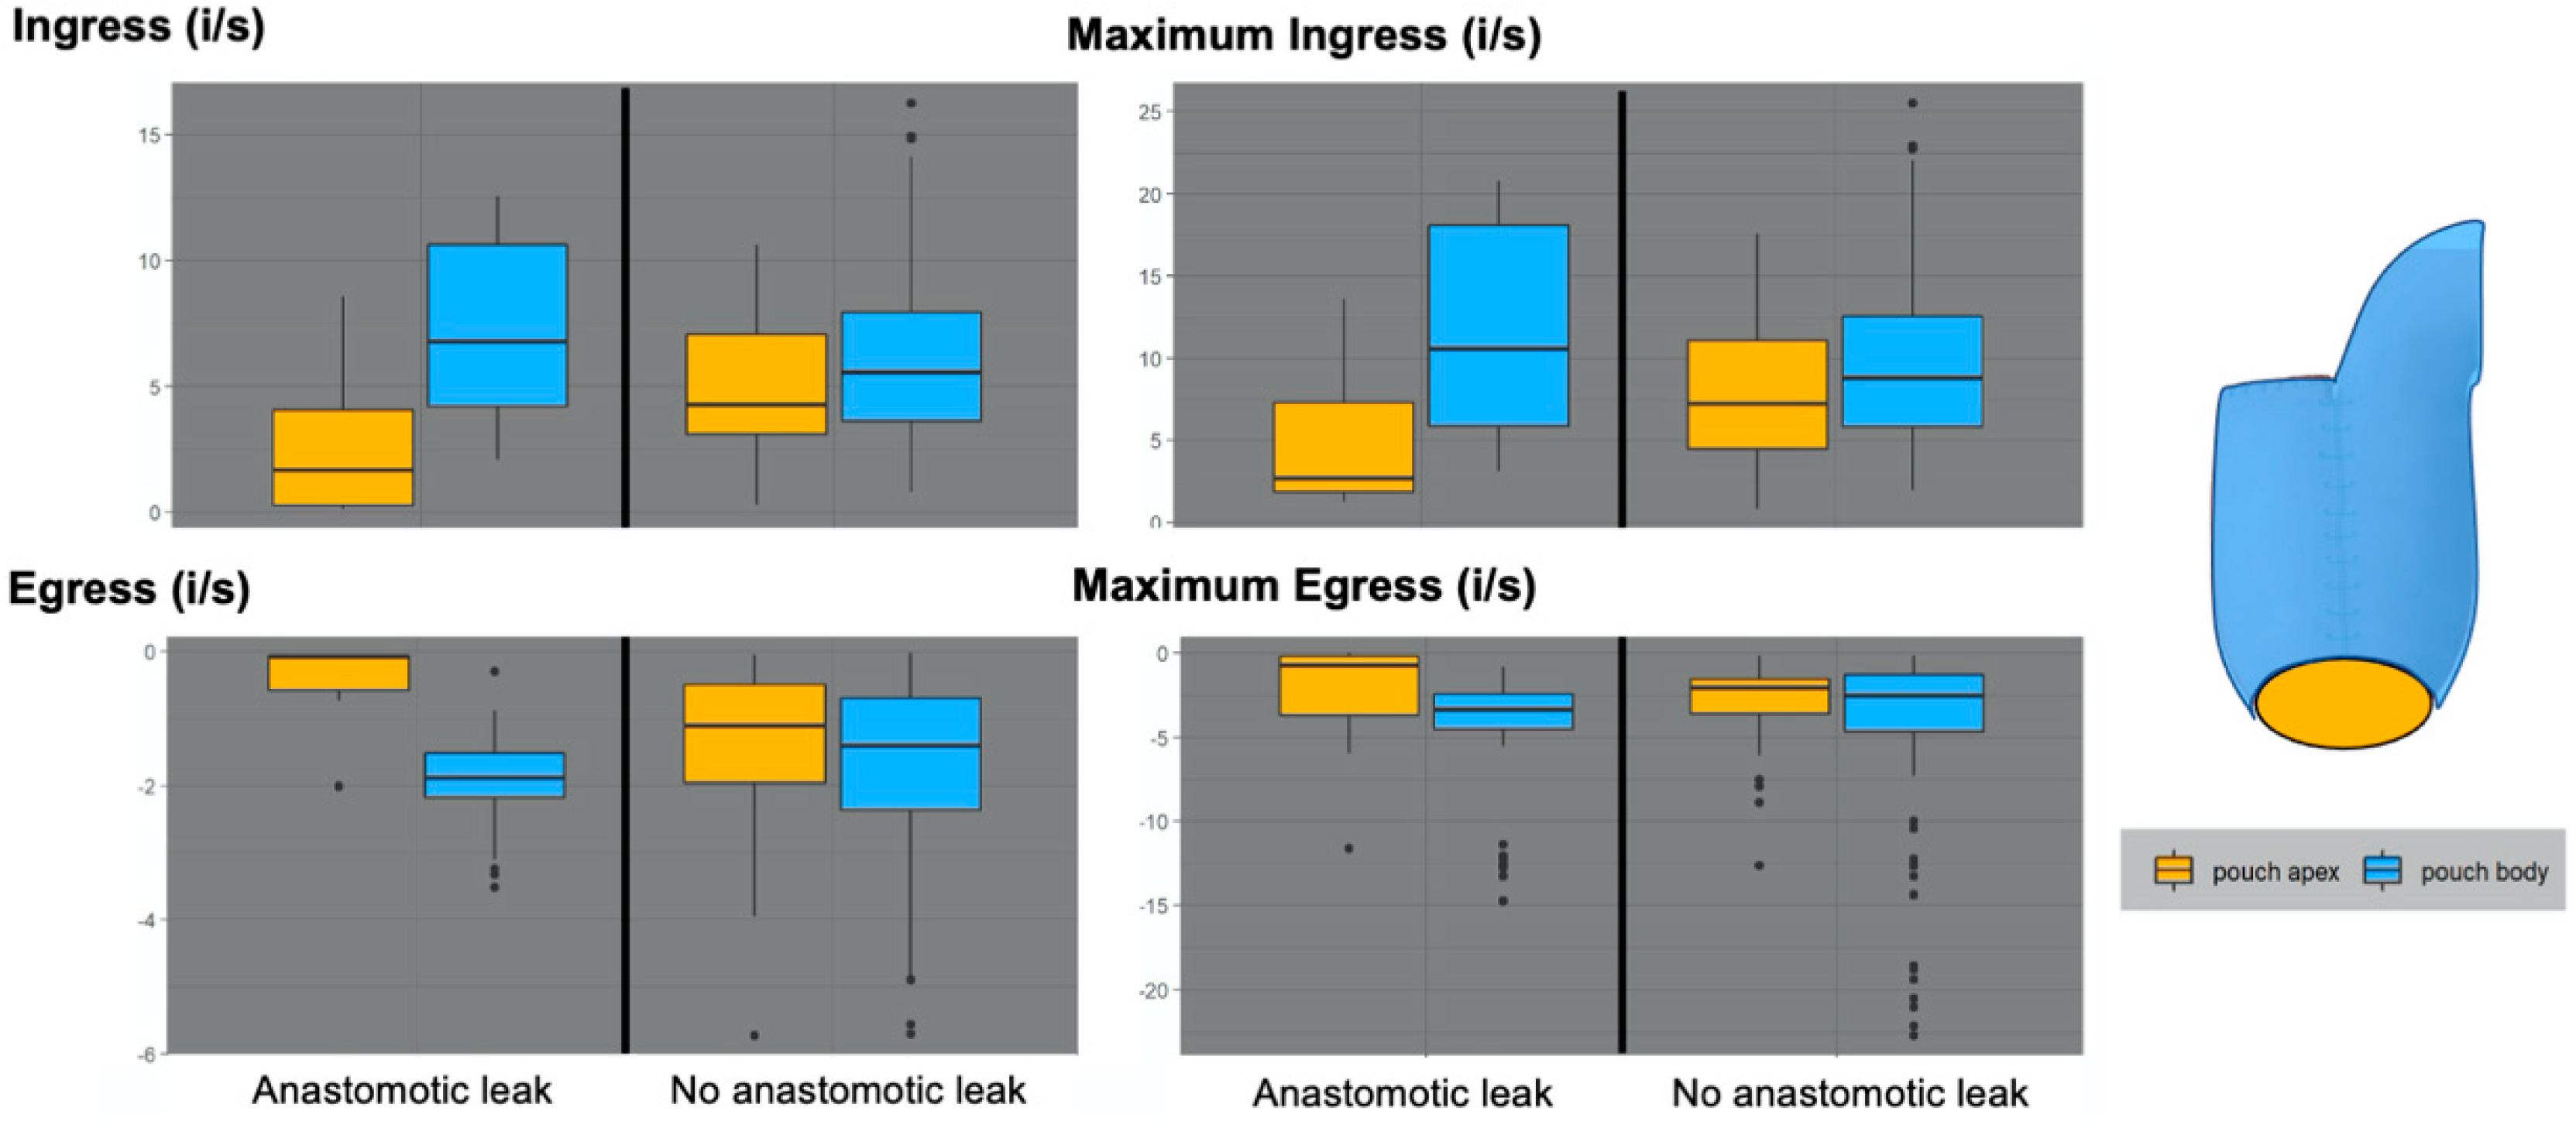
| No Anastomotic Leak (n = 14) | Anastomotic Leak (n = 4) | |||
|---|---|---|---|---|
| Pouch Body | Pouch Apex | Pouch Body | Pouch Apex | |
| Ingress (i/s) | ||||
| Median | 5.6 | 4.3 | 6.8 | 1.7 |
| Range {maximum–minimum} | 13.3 {14.1–0.8} | 10.3 {10.6–0.3} | 10.5 {12.6–2.1} | 8.5 {8.6–0.1} |
| IQR {P75%–P25%} | 4.3 {8.0–3.6} | 4.0 {7.1–3.1} | 6.4 {8.0–3.6} | 3.8 {4.1–0.3} |
| Egress (i/s) | ||||
| Median | −1.4 | −1.1 | −1.9 | −0.1 |
| Range {maximum–minimum} | 4.8 {0.0–(−4.8)} | 3.9 {0.0–(−4.0)} | 2.2 {(−0.9)–(−3.1)} | 0.7 {0.0–(−0.7)} |
| IQR {P75%–P25%} | 1.7 {(−0.7)–(−2.4)} | 1.5 {(−0.5)–(−2.0)} | 0.7 {(−1.5)–(−2.2)} | 0.5 {(−0.1)–(−0.6)} |
| Maximum ingress (i/s) | ||||
| Median | 8.8 | 7.2 | 10.6 | 2.7 |
| Range {maximum–minimum} | 20.1 {22.0–2.0} | 16.8 {17.6–0.8} | 17.7 {20.8–3.1} | 12.4 {13.6–1.3} |
| IQR {P75%–P25%} | 6.7 {12.6–5.8} | 6.6 {11.1– 4.5} | 12.2 {18.1–5.9} | 5.5 {7.3–1.8} |
| Maximum egress (i/s) | ||||
| Median | −2.5 | −2.1 | −3.4 | −0.7 |
| Range {maximum–minimum} | 7.2 {(−0.1)–(−7.3)} | 5.9 {(−0.2)–(−6.1)} | 4.7 {(−0.8)–(−5.5)} | 5.9 {0.0–(−5.9)} |
| IQR {P75%–P25%} | 3.4 {(−1.3)–(−4.6)} | 2.0 {(−1.5)–(−3.6)} | 2.1 {(−2.4)–(−4.5)} | 3.5 {(−0.2)–(−3.7)} |
Publisher’s Note: MDPI stays neutral with regard to jurisdictional claims in published maps and institutional affiliations. |
© 2022 by the authors. Licensee MDPI, Basel, Switzerland. This article is an open access article distributed under the terms and conditions of the Creative Commons Attribution (CC BY) license (https://creativecommons.org/licenses/by/4.0/).
Share and Cite
Lobbes, L.A.; Hoveling, R.J.M.; Berns, S.; Schmidt, L.R.; Strobel, R.M.; Schineis, C.; Lauscher, J.C.; Beyer, K.; Weixler, B. Feasibility of Novel Software-Based Perfusion Indicators for the Ileal J-Pouch—On the Path towards Objective and Quantifiable Intraoperative Perfusion Assessment with Indocyanine Green Near-Infrared Fluorescence. Life 2022, 12, 1144. https://doi.org/10.3390/life12081144
Lobbes LA, Hoveling RJM, Berns S, Schmidt LR, Strobel RM, Schineis C, Lauscher JC, Beyer K, Weixler B. Feasibility of Novel Software-Based Perfusion Indicators for the Ileal J-Pouch—On the Path towards Objective and Quantifiable Intraoperative Perfusion Assessment with Indocyanine Green Near-Infrared Fluorescence. Life. 2022; 12(8):1144. https://doi.org/10.3390/life12081144
Chicago/Turabian StyleLobbes, Leonard A., Richelle J. M. Hoveling, Susanne Berns, Leonard R. Schmidt, Rahel M. Strobel, Christian Schineis, Johannes C. Lauscher, Katharina Beyer, and Benjamin Weixler. 2022. "Feasibility of Novel Software-Based Perfusion Indicators for the Ileal J-Pouch—On the Path towards Objective and Quantifiable Intraoperative Perfusion Assessment with Indocyanine Green Near-Infrared Fluorescence" Life 12, no. 8: 1144. https://doi.org/10.3390/life12081144