Article

The Interplay between Pathophysiological Pathways in Early-Onset Severe Preeclampsia Unveiled by Metabolomics

by
Lina Youssef
1,
Francesca Crovetto
1,
Rui Vasco Simoes
1,2,
Jezid Miranda
1,
Cristina Paules
1,
Miquel Blasco
3,
Marta Palomo
4,5,6,
Héctor García-Calderó
7,8,
Olga Tura-Ceide
9,10,11,
Ana Paula Dantas
12,
Virginia Hernandez-Gea
7,8,
Pol Herrero
13,
Núria Canela
13,
Josep Maria Campistol
3,14,
Joan Carles Garcia-Pagan
7,8,
Maribel Diaz-Ricart
5,6,
Eduard Gratacos
1,14 and
Fatima Crispi
1,14,*
1
BCNatal|Fetal Medicine Research Center, Hospital Clínic and Hospital Sant Joan de Déu, Institut d’Investigacions Biomèdiques August Pi i Sunyer (IDIBAPS), University of Barcelona, 08036 Barcelona, Spain
2
Champalimaud Research, Champalimaud Centre for the Unknown, 1400-038 Lisbon, Portugal
3
Nephrology and Renal Transplantation Department, Hospital Clínic, Centro de Referencia en Enfermedad Glomerular Compleja del Sistema Nacional de Salud (CSUR), University of Barcelona, 08036 Barcelona, Spain
4
Josep Carreras Leukaemia Research Institute, Hospital Clinic, University of Barcelona, 08036 Barcelona, Spain
5
Hematopathology, Centre Diagnòstic Biomèdic (CDB), Hemotherapy-Hemostasis Department, Hospital Clinic, Institut d’Investigacions Biomèdiques August Pi i Sunyer (IDIBAPS), University of Barcelona, 08036 Barcelona, Spain
6
Barcelona Endothelium Team (BET), 08036 Barcelona, Spain
7
Barcelona Hepatic Hemodynamics Laboratory, Liver Unit, Hospital Clinic, Institut d’Investigacions Biomèdiques August Pi i Sunyer (IDIBAPS), University of Barcelona, 08036 Barcelona, Spain
8
Centro de Investigación Biomédica en Red de Enfermedades Hepáticas y Digestivas (CIBEREHD), Health Care Provider of the European Reference Network on Rare Liver Disorders (ERN-Liver), 08036 Barcelona, Spain
9
Department of Pulmonary Medicine, Hospital Clínic, Institut d’Investigacions Biomèdiques August Pi i Sunyer (IDIBAPS), University of Barcelona, 08036 Barcelona, Spain
10
Biomedical Research Networking Center on Respiratory Diseases (CIBERES), Instituto de Salud Carlos III, 28029 Madrid, Spain
11
Girona Biomedical Research Institute—IDIBGI, 17190 Girona, Spain
12
Cardiovascular Institute, Hospital Clinic, Institut d’Investigacions Biomèdiques August Pi i Sunyer (IDIBAPS), University of Barcelona, 08036 Barcelona, Spain
13
Eurecat, Centre Tecnològic de Catalunya, Centre for Omic Sciences (COS), Joint Unit Universitat Rovira i Virgili-EURECAT, Unique Scientific and Technical Infrastructures (ICTS), 43204 Reus, Spain
14
Centre for Biomedical Research on Rare Diseases (CIBER-ER), Instituto de Salud Carlos III, 28029 Madrid, Spain
*
Author to whom correspondence should be addressed.
Life 2022, 12(1), 86; https://doi.org/10.3390/life12010086
Submission received: 21 December 2021 / Revised: 2 January 2022 / Accepted: 4 January 2022 / Published: 7 January 2022
(This article belongs to the Topic Pathogenesis of Pregnancy-Related Complications)

Abstract

:
Introduction: Preeclampsia is a multi-system disorder unique to pregnancy responsible for a great part of maternal and perinatal morbidity and mortality. The precise pathogenesis of this complex disorder is still unrevealed. Methods: We examined the pathophysiological pathways involved in early-onset preeclampsia, a specific subgroup representing its most severe presentation, using LC-MS/MS metabolomic analysis based on multi-level extraction of lipids and small metabolites from maternal blood samples, collected at the time of diagnosis from 14 preeclamptic and six matched healthy pregnancies. Statistical analysis comprised multivariate and univariate approaches with the application of over representation analysis to identify differential pathways. Results: A clear difference between preeclamptic and control pregnancies was observed in principal component analysis. Supervised multivariate analysis using orthogonal partial least square discriminant analysis provided a robust model with goodness of fit (R2X = 0.91, p = 0.002) and predictive ability (Q2Y = 0.72, p < 0.001). Finally, univariate analysis followed by 5% false discovery rate correction indicated 82 metabolites significantly altered, corresponding to six overrepresented pathways: (1) aminoacyl-tRNA biosynthesis; (2) arginine biosynthesis; (3) alanine, aspartate and glutamate metabolism; (4) D-glutamine and D-glutamate metabolism; (5) arginine and proline metabolism; and (6) histidine metabolism. Conclusion: Metabolomic analysis focusing specifically on the early-onset severe form of preeclampsia reveals the interplay between pathophysiological pathways involved in this form. Future studies are required to explore new therapeutic approaches targeting these altered metabolic pathways in early-onset preeclampsia.

1. Introduction

Preeclampsia is a multi-system disorder unique to pregnancy characterized by new-onset elevated blood pressure associated with proteinuria occurring after 20 weeks of gestation [1]. This complex disease affects 2–5% of pregnancies and is a major cause of maternal and perinatal morbidity and mortality [2,3]. However, the precise pathogenesis of preeclampsia is still unrevealed. Although abnormal placentation is known to play a central role especially in severe cases of preeclampsia [4,5], it is assumed that preeclampsia is a spectral disorder with different underlying etiologies, all converging into a seemingly identical clinical presentation that affects maternal health [6]. This heterogeneity strongly limits our understanding of the underlying etiology and the identification of therapeutic targets. The distinct forms of this disorder are recognized as early and late-onset preeclampsia before or after 34 weeks of gestation, respectively. Early-onset preeclampsia is less common than the late-onset form. However, it is more severe and frequently associated with maternal and perinatal complications [7]. Understanding the pathophysiology of early-onset severe preeclampsia is paramount for improving its clinical management, as well as detecting potential therapeutic targets for this subtype of preeclampsia.
Metabolomic-focused studies can contribute considerably to our understanding of complex multi-organ disorders by identifying biochemical mechanisms that are involved in their pathophysiology. Indeed, investigating and quantifying single metabolites offer a quite sensitive measure of the biochemical status of the studied subjects [8]. In addition, the interaction between these metabolites might uncover metabolic signatures of a disease or disease subtype [8]. Few studies have been conducted so far to examine the metabolomic profile of preeclampsia through maternal blood samples collected near delivery [9,10,11,12,13,14,15], but their results are difficult to interpret due to the high degree of sample heterogeneity and due to a focus on individual metabolites rather than examining the whole picture of activated pathways. In a previous study, we analyzed blood metabolomic profiles of mothers and fetuses at delivery using nuclear magnetic resonance approach and demonstrated that cases of preeclampsia with fetal growth restriction exhibit the most disturbed metabolomic profiles [16]. To further explore these complex alterations and pathophysiological pathways involved, we have now studied a well-defined subgroup of early-onset severe preeclampsia, typically associated with fetal growth restriction, using liquid chromatography tandem mass spectrometry (LC-MS/MS) metabolomics–a highly sensitive technique performed with multi-level extraction of lipids and small metabolites from maternal blood samples. Thus, our aim in this study was to identify the metabolomic fingerprint of early-onset severe preeclampsia and associated pathways underlying the pathogenesis of this disorder.

2. Results

2.1. Baseline and Perinatal Characteristics

Table 1 displays baseline characteristics and perinatal outcomes of the pregnancies included in this study. Baseline characteristics of pregnant women were comparable among the study groups. Ovum donation had not been used to achieve pregnancy in any of the three preeclamptic pregnancies achieved by assisted reproductive technologies. As expected, pregnancies complicated by preeclampsia presented altered feto-placental Doppler parameters. Liver enzymes including aspartate aminotransferase (AST), alanine aminotransferase (ALT), and gamma-glutamyl transferase (GGT) were higher in preeclampsia. One preeclamptic patient presented abnormal creatinine concentration, four patients presented abnormal AST and ALT concentrations and one patient presented high bilirubin and low platelets according to the cutoffs used clinically. In preeclampsia, average gestational age at the time of delivery was 32 weeks, up to 80% of deliveries were achieved through cesarean sections and all neonates were admitted to the neonatal intensive care unit, exhibiting subsequently one case of neonatal mortality. Two cases of preeclampsia had the diagnosis of hemolysis, elevated liver enzymes and low platelets (HELLP) syndrome.

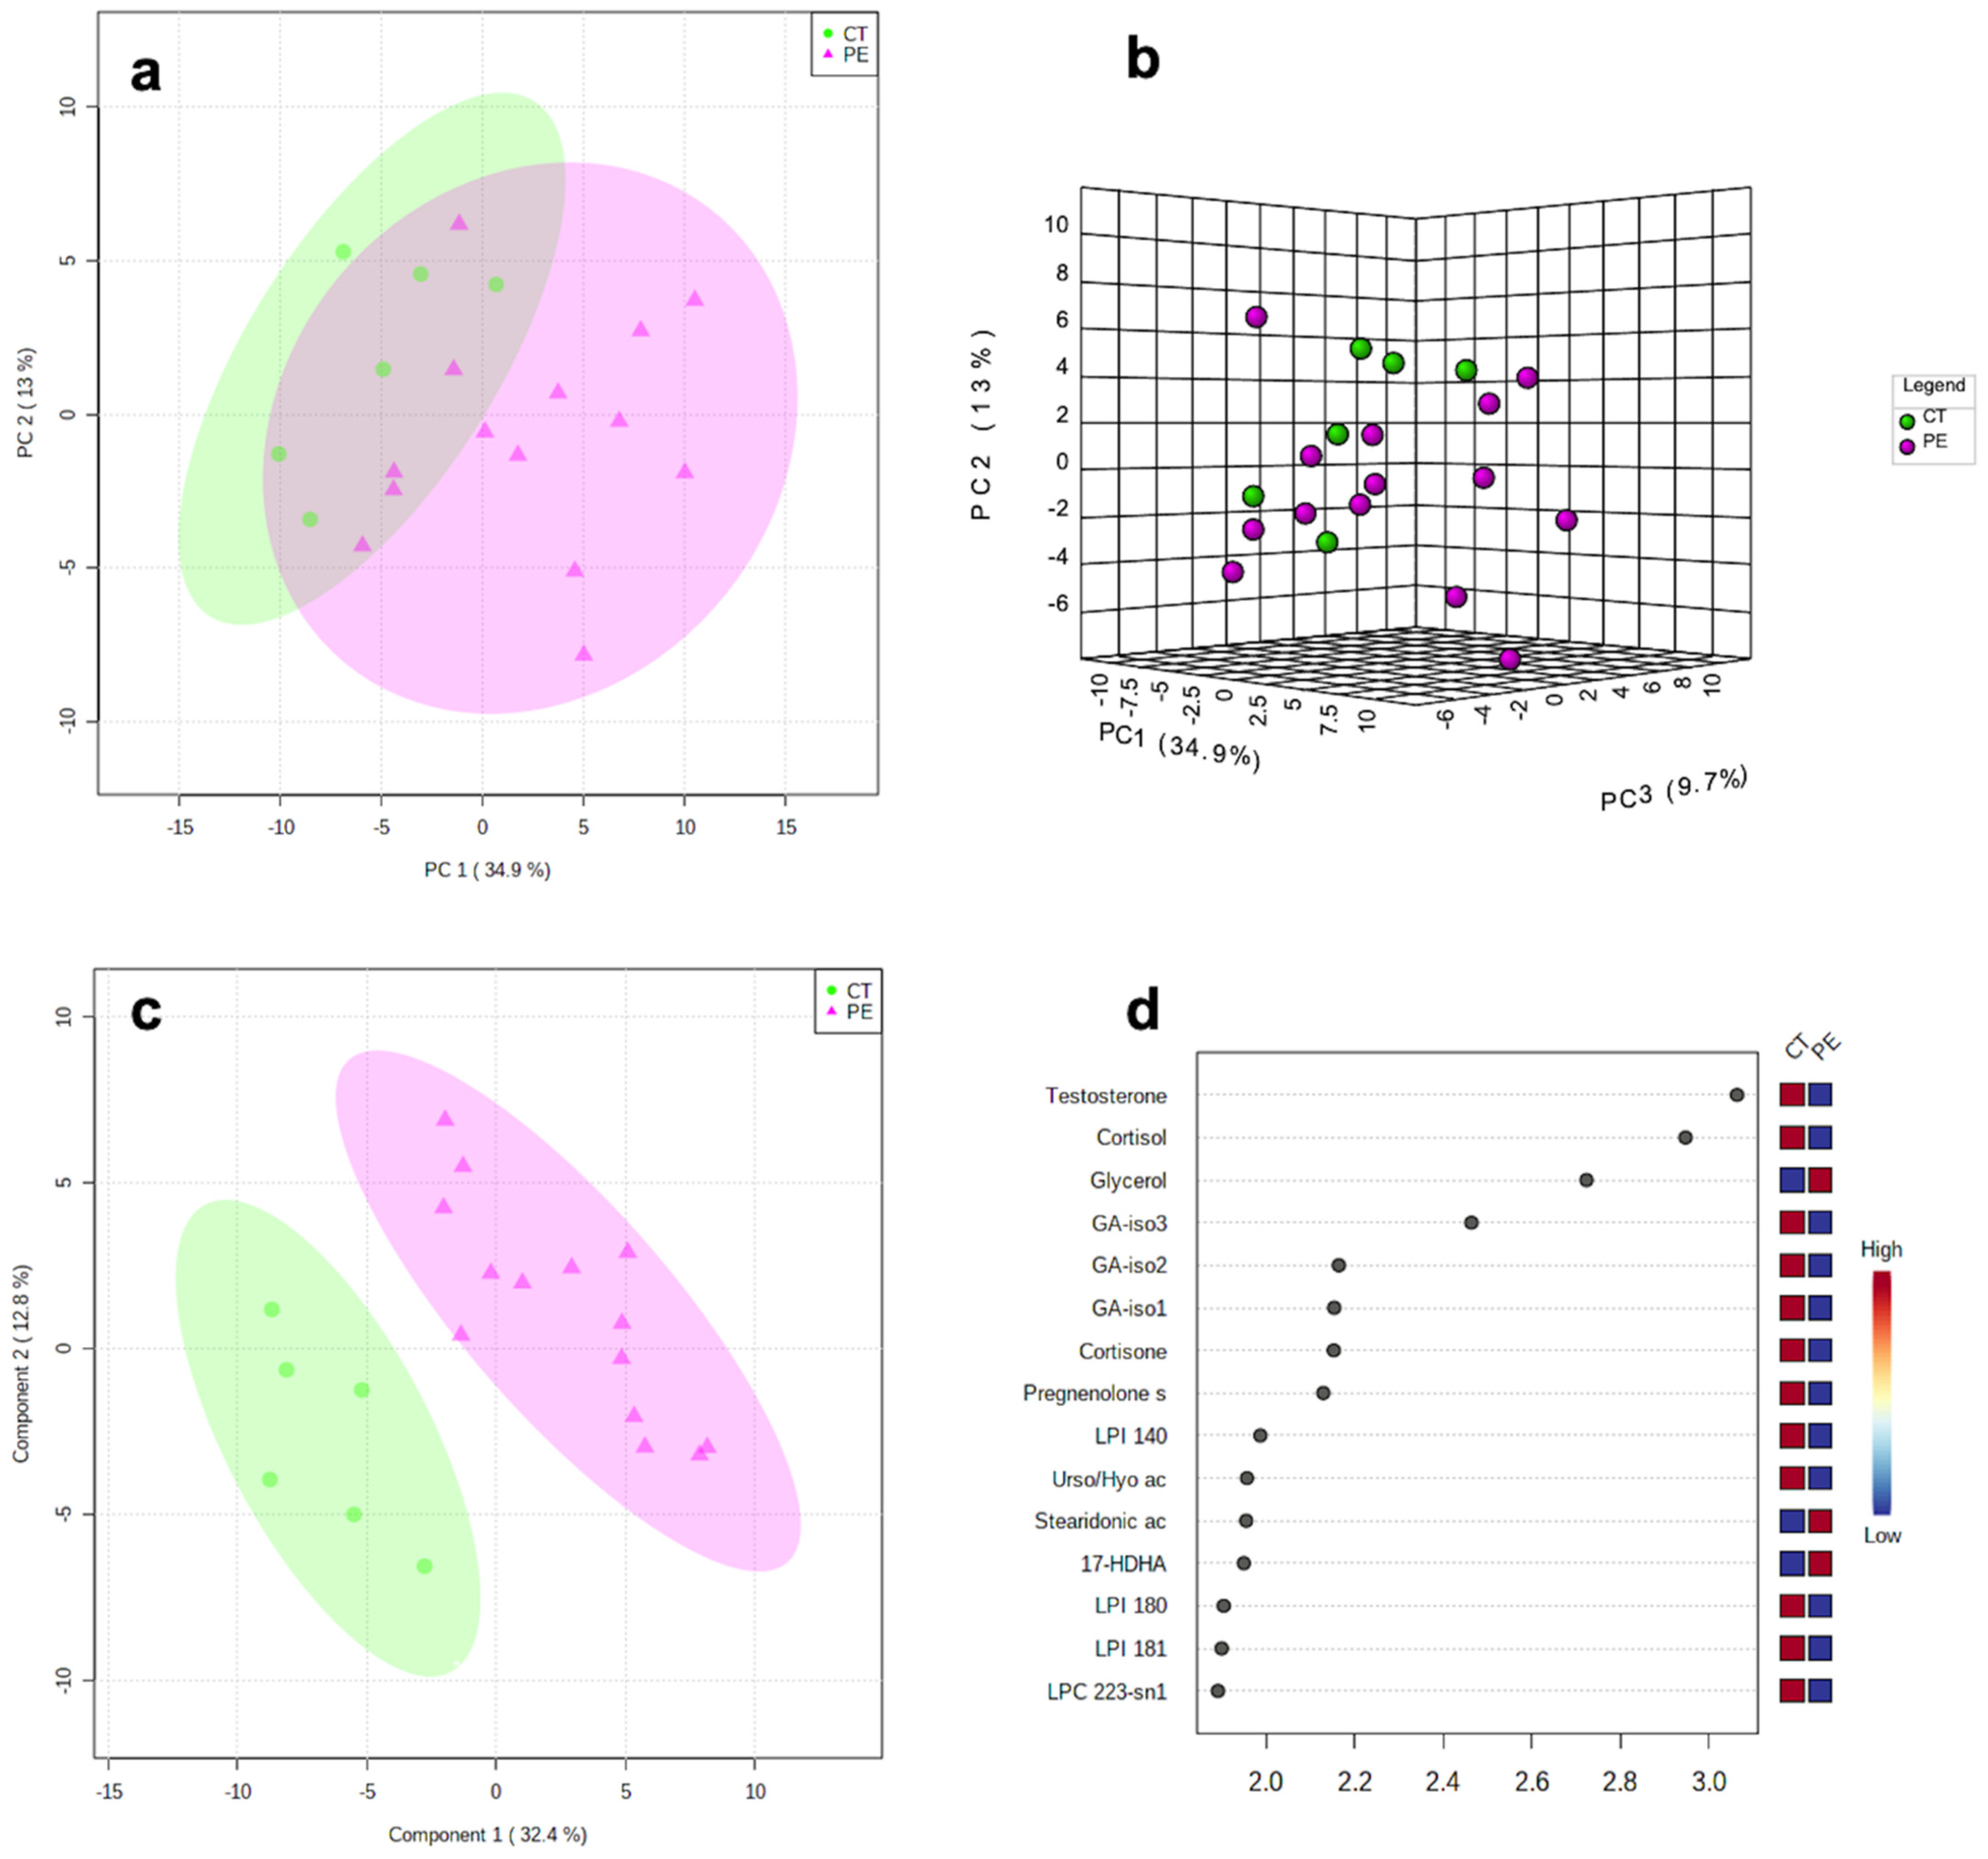
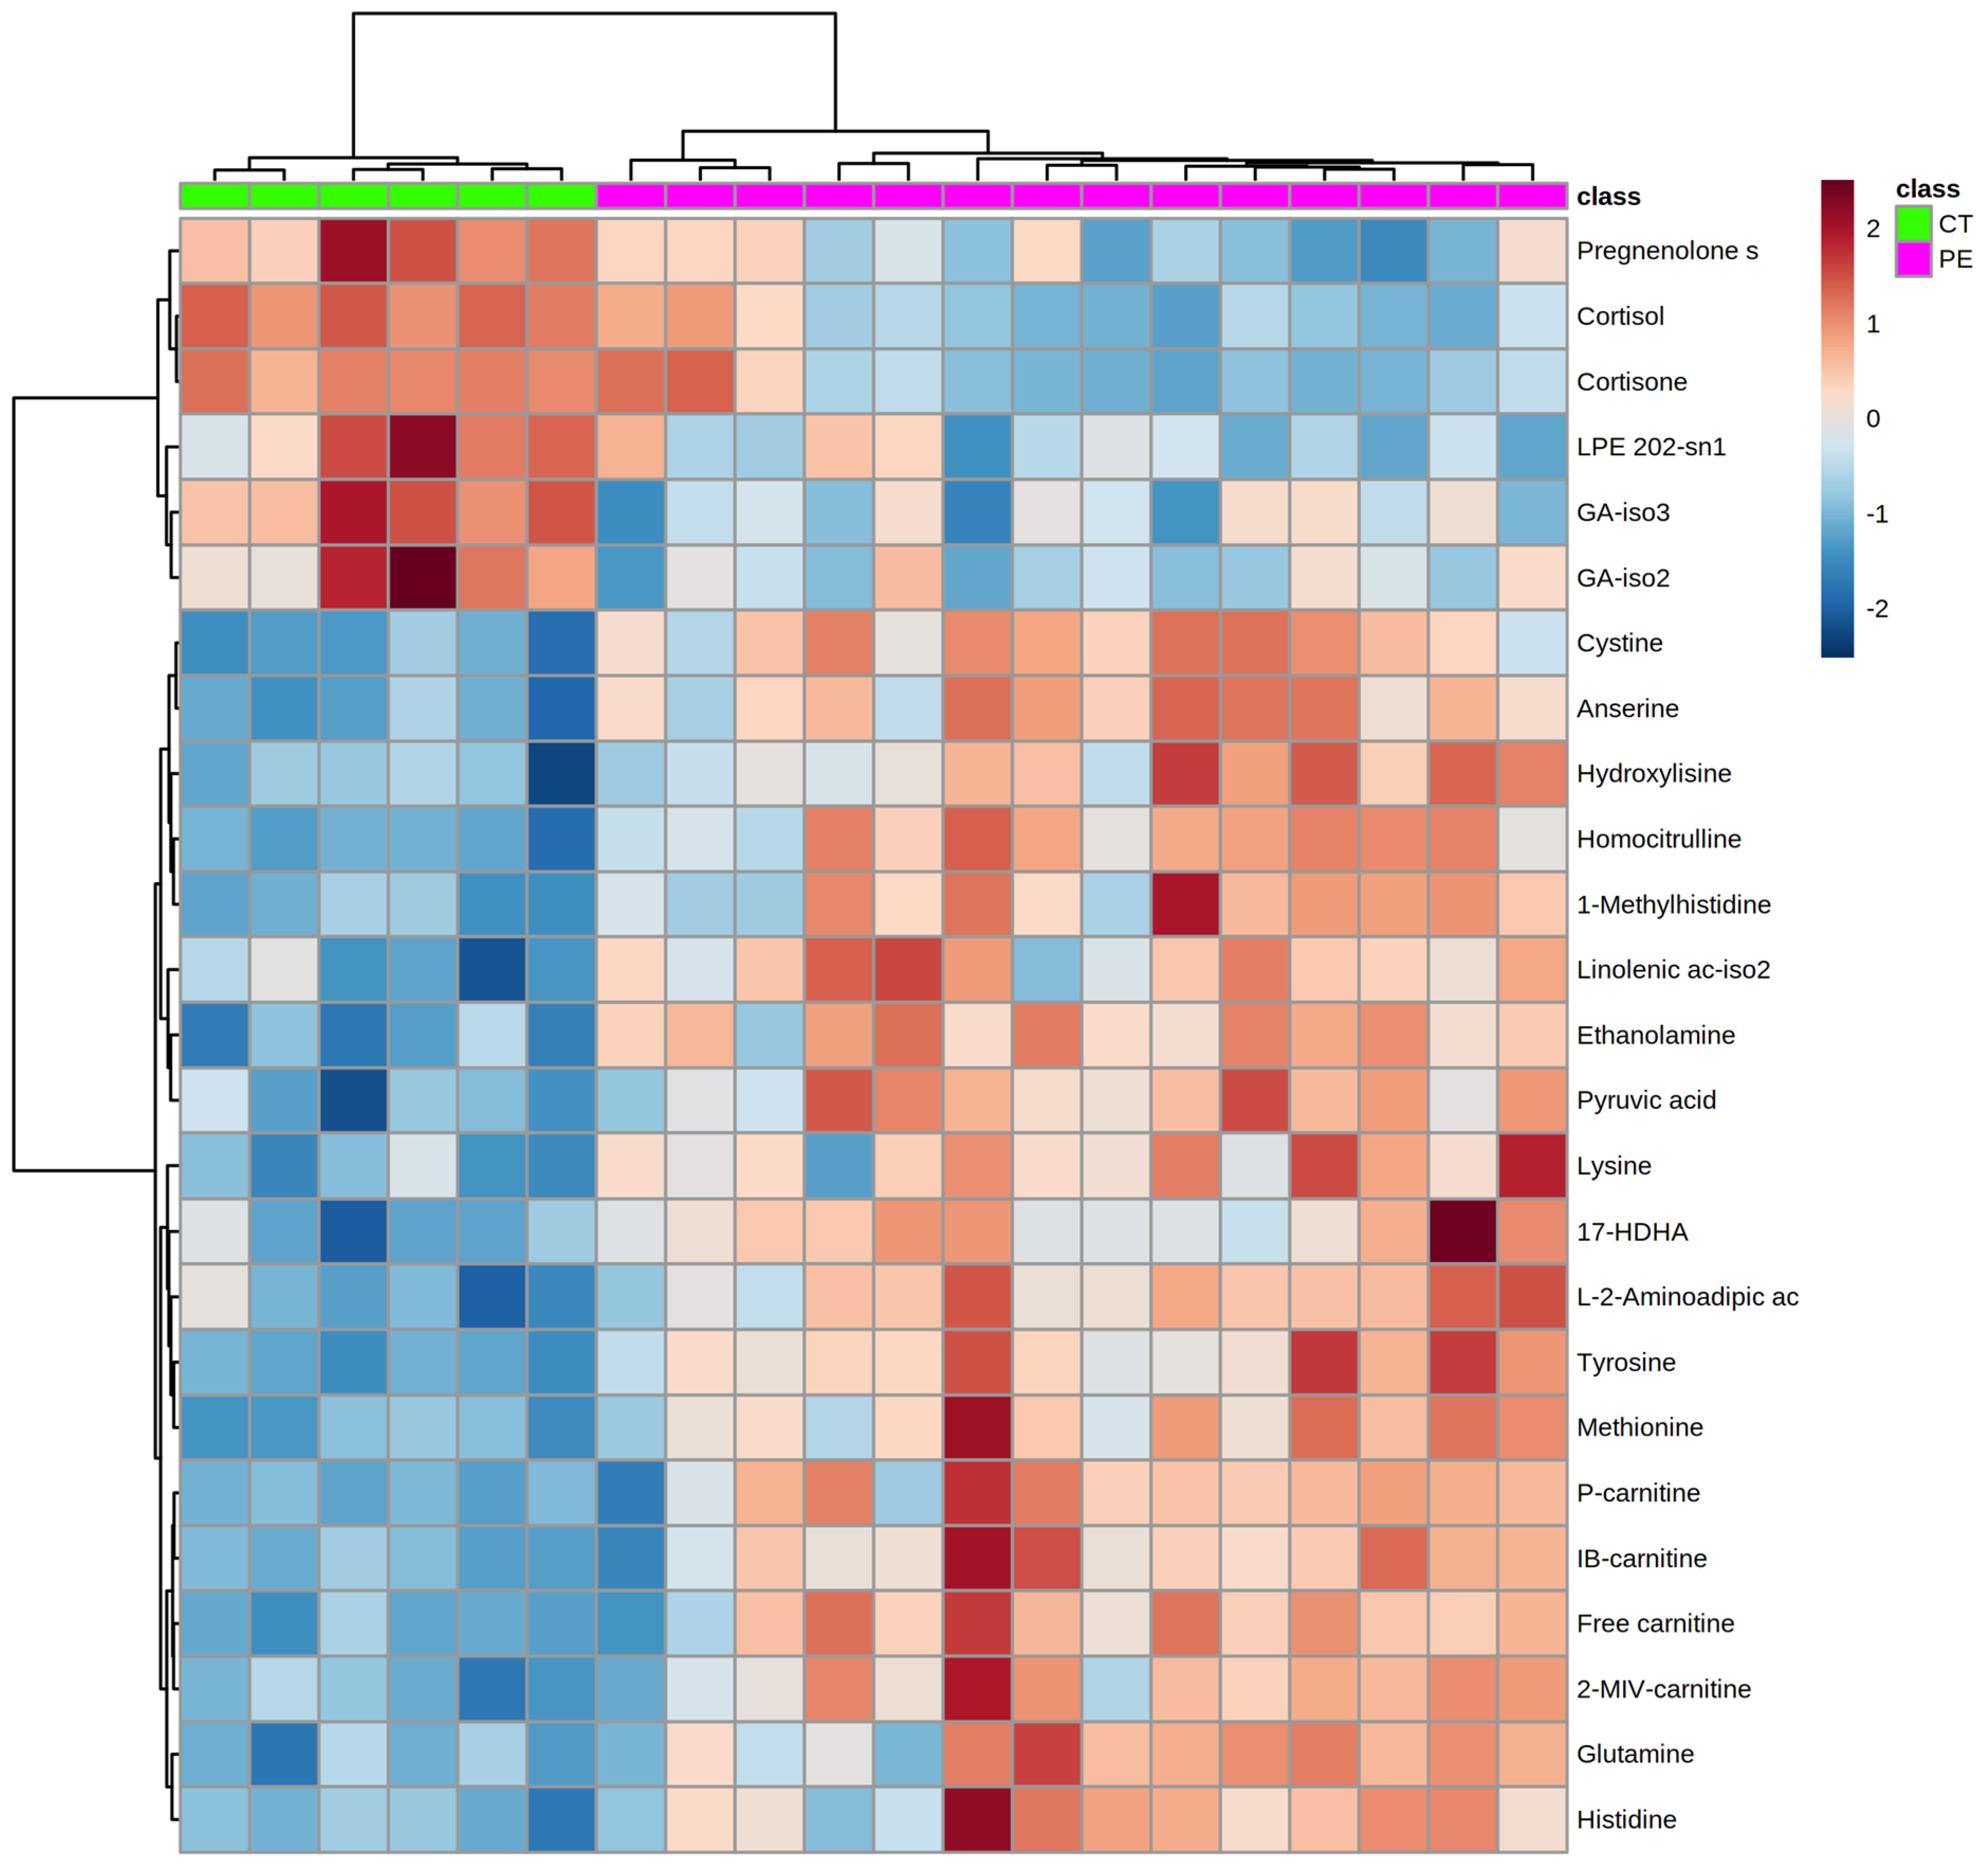
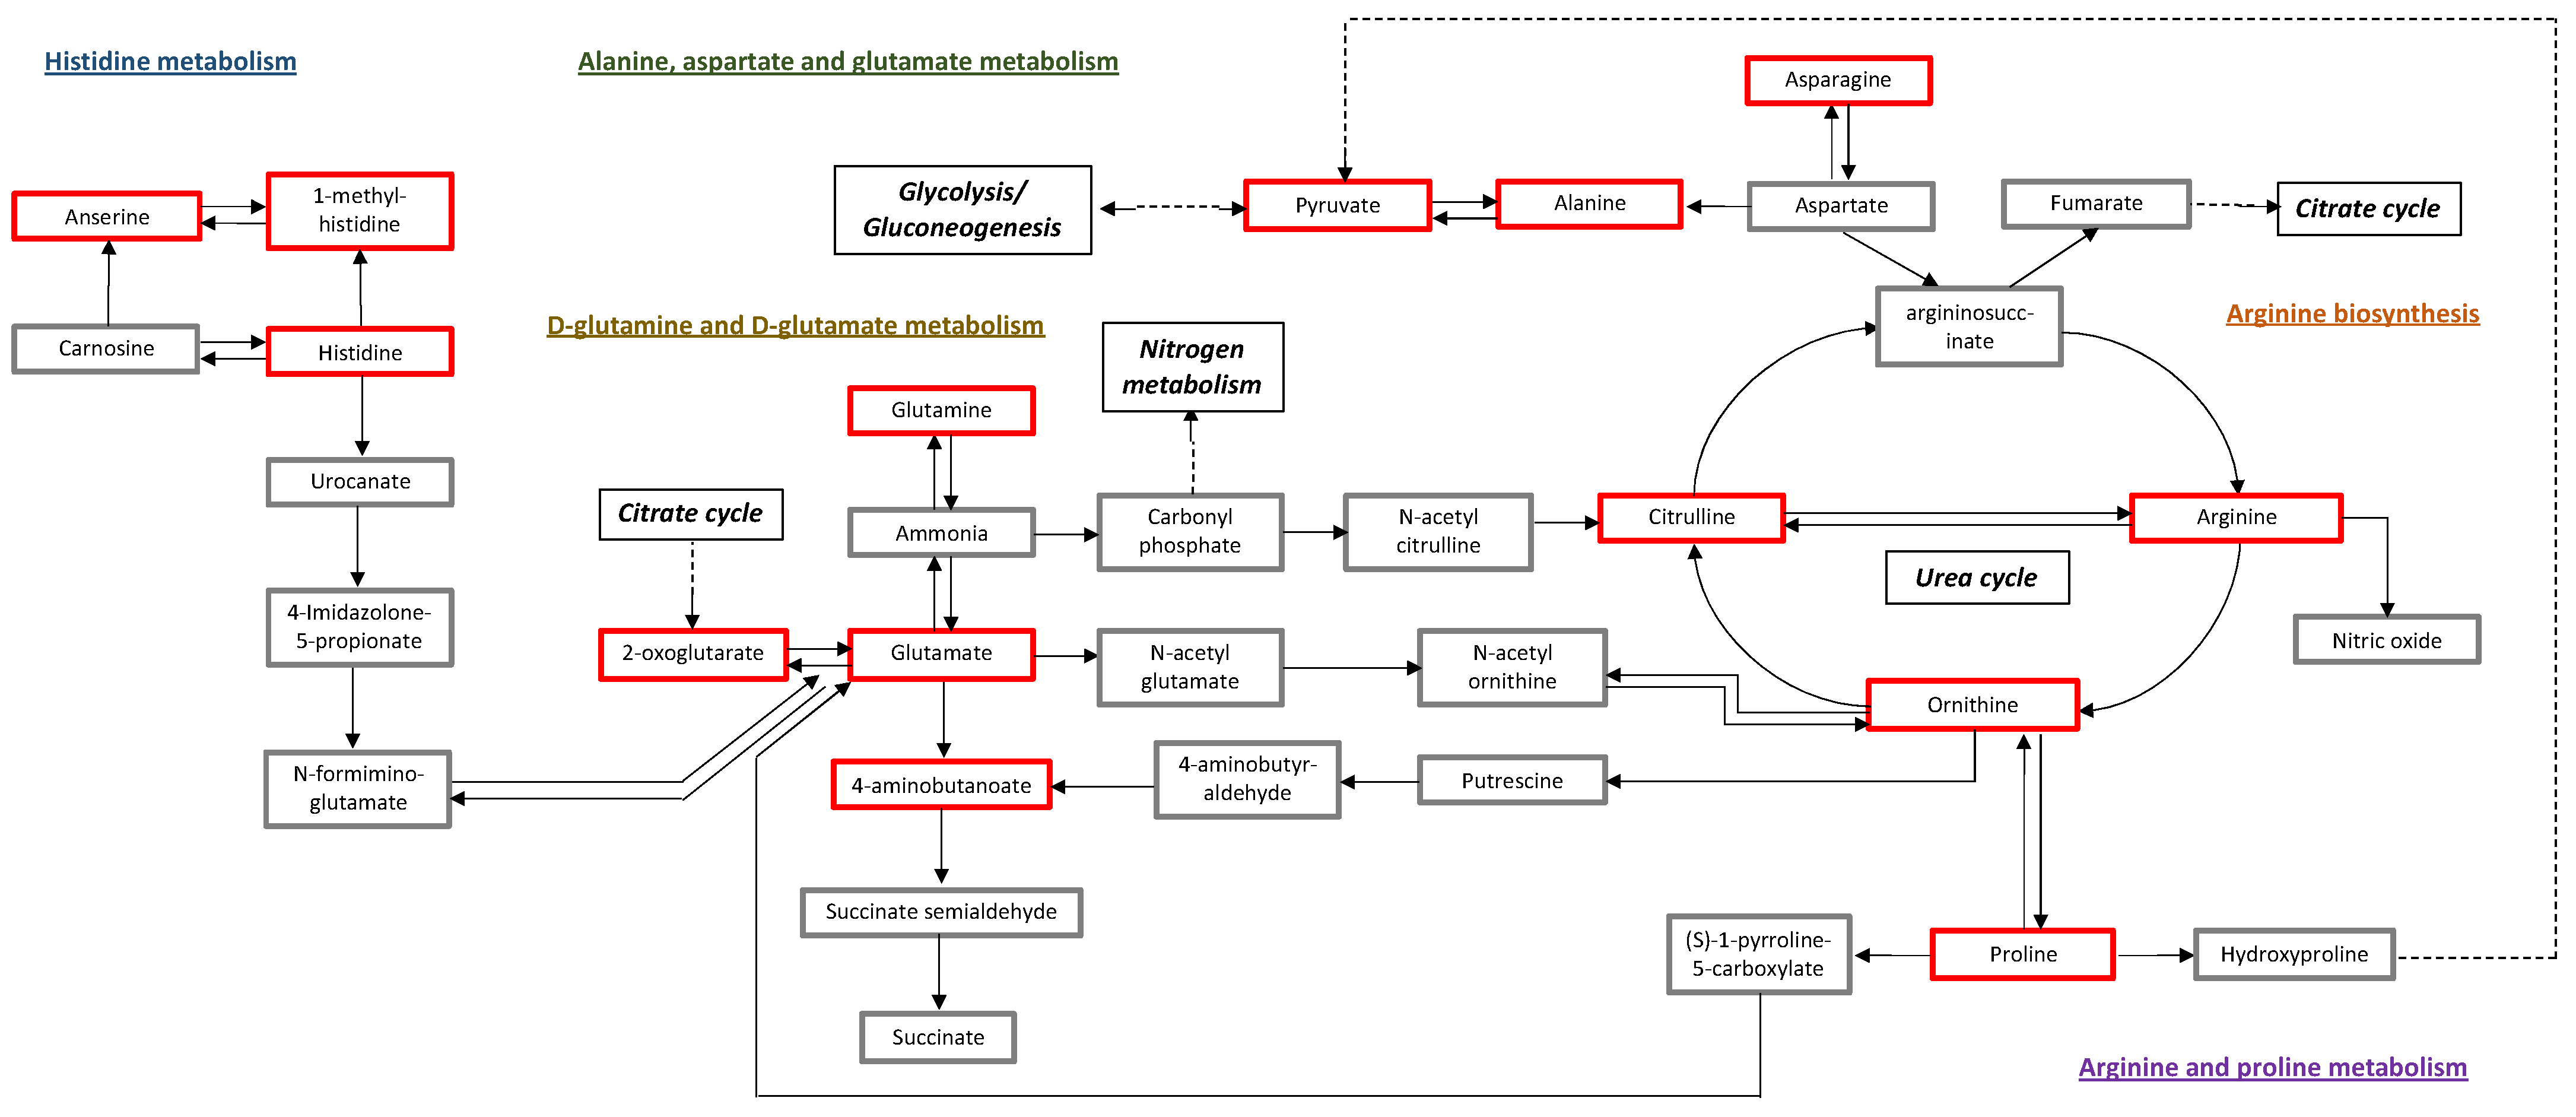
2.2. Metabolomics Results

383 metabolites (out of 400) were present in ≥70% of the samples (complete results dataset is provided in Supplementary Materials Table S1). Figure 1a,b shows a clear separation between preeclampsia and controls through the principal component analysis (PCA). The first and second components explained 34.9% and 13% of the variance between cases and controls, respectively. Figure 1c demonstrated the separation between the study groups by the partial least squares discriminant analysis (PLS-DA). Figure 1d demonstrates the top 15 most important metabolites responsible for class separation. The contribution of each metabolite is demonstrated by the distance from the Y-axis (the greater the distance, the greater the contribution). The heatmap on the right side of this plot also indicates if the concentration of this metabolite is higher or lower in preeclampsia compared to controls. The model obtained by orthogonal projection to latent structures discriminant analysis (OPLS-DA) showed a high goodness of fit (R2X = 0.915, p = 0.003) and a strong predictive ability (Q2Y = 0.718, p = 0.001, 1 predictive + 1 orthogonal components), i.e., the model explains more than 90% of the variation between the study groups with a predictive ability of 72%). The two cases of HELLP syndrome were not separated from other severe preeclamptic pregnancies.
Univariate analysis revealed 82 statistically different metabolites in preeclampsia vs. controls (Table 2), in agreement with the multivariate analysis. Hierarchical clustering analysis (HCA) considering the top 25 metabolites showed 2 clusters in correspondence with the study groups (Figure 2).
The over representation analysis based on the 82 differentially expressed metabolites resulted in the significant over representation of eight pathways out of 40 pathways identified: (1) aminoacyl-tRNA biosynthesis; (2) arginine biosynthesis; (3) alanine, aspartate and glutamate metabolism; (4) valine, leucine and isoleucine biosynthesis; (5) linoleic acid metabolism; (6) D-glutamine and D-glutamate metabolism; (7) arginine and proline metabolism; and (8) histidine metabolism (Table 3 and Figure 3). However, pathways 4 and 5 (valine, leucine and isoleucine biosynthesis and linoleic acid metabolism) correspond to essential amino and fatty acids, and therefore are not functional in humans. Thus, pathways 4 and 5 were further excluded from the results leaving six differential pathways in early-onset severe preeclampsia compared to controls. Lipid data showed higher triglycerides and reduced glyco-cholic acid, lyso-phosphatidylethanolamines, lyso-phosphatidylcholines, lyso-phosphatidylinositols, pregnenolone sulfate, dehydroepiandrosterone sulfate, testosterone, cortisol and cortisone. The cortisol:cortisone ratio was significantly lower in preeclampsia (2.63 ± 0.7 vs. 7.09 ± 1.39 in controls, p < 0.001).

3. Discussion

This study displays the significant changes in the metabolome of pregnant women with early-onset severe preeclampsia, showing for the first time a comprehensive set of circulating metabolites and associated pathophysiological pathways. The most discriminative pathways were related to the metabolism of specific amino acids such as arginine, alanine, aspartate, glutamate, proline and histidine, in addition to an altered lipid profile.
Among the main pathways identified in the current study are the arginine biosynthesis and metabolism. Indeed, arginine is an essential molecule in the pathophysiology of preeclampsia since it is the precursor of nitric oxide, a potent endothelial-derived vasodilator [17]. A reduced activity of the nitric oxide might contribute to the clinical features of preeclampsia such as vasoconstriction and endothelial dysfunction [17]. In the literature, controversial results have been reported for arginine levels in preeclampsia, likely to be due to differences in the studied population and the methodology used [18,19]. Few trials have reported a potential role for arginine in the prevention and treatment of preeclampsia [20]. Our data show higher levels of arginine in early-onset severe preeclampsia and further demonstrate its interaction with other altered and non-altered metabolites that might be targeted to stop the vicious cycle of activated pathophysiological pathways (Figure 3).
In the present study, alanine, aspartate, glutamate and glutamine metabolism were also identified among the principal metabolic pathways in early-onset severe preeclampsia. Essentially, the glutamine-cycling pathway plays a crucial role in the development of metabolic risk [21]. Abnormal glutamate metabolism suggests liver involvement in the global metabolic modulation since glutamate metabolism is linked to aminotransferase reactions [22]. Indeed, the metabolism of almost all amino acids is initiated by aminotransferases, and glutamate is produced by the transfer of the amino group [23]. AST and ALT are two aminotransferases widely used in monitoring preeclamptic patients since they become elevated in severe cases such as the most extreme phenotype of preeclampsia, the HELLP syndrome. Furthermore, it is known that women exposed to preeclampsia during pregnancy have an increased risk of metabolic syndrome later in life [24].
In addition, our data suggest that histidine metabolism is also disturbed in early-onset severe preeclampsia with high levels of histidine, 1-methylhistidine and other metabolites in line with the literature [12,18]. However, no detailed profiling of this pathway has been done previously in preeclampsia. Histidine is the precursor of carnosine which functions as an antioxidant and scavenger of reactive oxygen species and unsaturated aldehydes of cell membrane fatty acids formed due to peroxidation during oxidative stress [25]. Therefore, high levels of histidine might reflect exacerbated oxidative stress in early-onset severe preeclampsia [1,26].
Moreover, patients with early-onset severe preeclampsia exhibited higher concentrations of valine, leucine and isoleucine in agreement with our previous findings in a population of preeclamptic mothers with growth-restricted fetuses [16]. These three metabolites are essential amino acids that play a crucial role in energy metabolism. A combined profile of isoleucine, leucine, valine, tyrosine and phenylalanine is a good predictor of future diabetes [27]. These results might explain the link between preeclampsia and the two-fold increased risk of diabetes throughout life [28].
Furthermore, this study demonstrates the involvement of the essential fatty acid linoleic acid in early-onset severe preeclampsia. It is known that endothelial dysfunction during preeclampsia might be enhanced by the imbalance of vasoactive prostaglandins (prostacyclin:thromboxane ratio) causing vasoconstriction of small arteries and platelets activation [29]. Linoleic acid is the main precursor of arachidonic acid, the origin compound of prostaglandins and prostanoids. Prior trials investigated whether daily use of linoleic acid and calcium supplementation during the third trimester effectively prevents preeclampsia in high-risk women. No evidence was found that this supplementation influences the incidence of preeclampsia, the length-of-gestation, or the need for preterm delivery [30]. However, it has been demonstrated that daily treatment with aspirin, inhibits prostaglandin synthesis from the arachidonic acid, in high-risk women decreases the incidence of preterm preeclampsia [31].
On the other hand, lipid data seem to be highly disturbed in early-onset severe preeclampsia. It is well established that preeclampsia is a disease characterized by inflammation, complement activation, altered lipid metabolism and related oxidative stress [16,32,33,34]. Lipid classes are linked tightly during their synthesis, which may explain the similarity of observed alterations in most of them. Low phospholipid levels play a role in promoting cell membrane damage and inflammation. In preeclampsia, the decrease in pregnenolone sulfate, dehydroepiandrosterone sulfate and testosterone might be related to impaired placental steroidogenesis [35]. Moreover, low cortisol and cortisone are most likely to be due to enhanced glucocorticoid metabolism, in addition to intensified conversion of cortisol to its inactive form cortisone since the cortisol:cortisone ratio was also significantly lower in preeclampsia compared to controls [36]. This imbalance might contribute to high blood pressure in preeclampsia, obesity, renal disease and other hypertensive disorders [37]. Thus, based on previously published data we can speculate that disturbed lipid metabolism might be involved in the development of preeclampsia while altered pathways of amino acid metabolism are mainly involved in the clinical manifestation of this disease.
The prospective design of the current study and the recruitment of a well-characterized homogenous group of early-onset severe preeclampsia associated with fetal growth restriction with no chronic disorders are the principal strengths of this study. Moreover, the collection of maternal blood samples was achieved directly upon confirming the diagnosis in the cases and at matched gestational age in the controls. Fasting status was assured in all the participating patients. The processing, storage and analysis of the samples followed rigorous protocols. Among the limitations, we declare the relatively small number of cases and controls in this study and the importance of validating our results in larger cohorts and exploring the detected pathways in other phenotypes of preeclampsia such as late-onset preeclampsia and preeclampsia with no associated fetal growth restriction.

4. Materials and Methods

4.1. Study Population

This was a nested case-control study within the project “Targeting endothelial dysfunction in highly prevalent diseases–PIE15/00027”. Singleton pregnancies with a diagnosis of early-onset severe preeclampsia associated with fetal growth restriction who attended the Departments of Maternal-Fetal Medicine at BCNatal (Barcelona, Spain) between July 2016 and December 2017 were recruited prospectively. Preeclampsia was defined as high blood pressure (systolic blood pressure ≥ 140 mmHg and/or diastolic blood pressure ≥ 90 mmHg on two occasions, at least four hours apart) with proteinuria (≥300 mg/24 h or protein/creatinine ratio ≥ 0.3) developed after 20 weeks of gestation [38,39]. Early-onset preeclampsia was defined as disease onset before 34 weeks of gestation [7]. To include a homogenous group of complicated pregnancies, we recruited early-onset cases that needed elective delivery before 34 weeks of gestation indicated for severe preeclampsia which was considered upon presenting one or more of the following severity criteria [39]: blood pressure ≥160 mmHg systolic or ≥110 mmHg diastolic on two occasions at least 4 h apart, thrombocytopenia (<100,000/mm3), impaired liver function (elevated blood concentrations of liver enzymes to twice normal concentration and/or severe persistent right upper quadrant or epigastric pain unresponsive to medication and not accounted for by alternative diagnoses), progressive renal insufficiency (serum creatinine concentration > 1.1 mg/dL), pulmonary edema, new-onset cerebral or visual disturbances. HELLP syndrome was defined as preeclampsia associated with lactate dehydrogenase elevated to 600 u/L or more, AST and ALT elevated more than twice the upper limit of normal, and platelets count < 100,000/mm3 [39]. Pregnancy termination was by labor induction or cesarean section upon obstetric indication. Fetal growth restriction was defined as estimated fetal weight and birthweight below the 10th centile associated with either abnormal cerebroplacental ratio (<5th centile) or abnormal uterine arteries mean pulsatility index (>95th centile), or birthweight below the 3rd centile. Uncomplicated pregnancies with normotensive mothers and an appropriate for gestational age fetus -defined as estimated fetal weight and birthweight above the 10th centile- were randomly selected from our general population to be included as controls and matched with cases by maternal age, ethnicity, pre-gestational body mass index and gestational age at maternal blood draw (±2 weeks). Estimated fetal weight and birthweight centiles were calculated according to local standards [40]. In all pregnancies, gestational age was calculated based on the crown-rump length at first trimester ultrasound [41]. Pregnancies with chromosomal/structural anomalies or intrauterine infection were excluded. The history of pregestational diabetes, autoimmune, renal or coagulation disorders were also considered excluding criteria.

4.2. Data Collection

Maternal age, ethnicity, pregestational body mass index, chronic hypertension, parity, obstetric history, mode of conception and smoking status were collected at enrolment.
Estimated fetal weight and feto-placental Doppler assessment was achieved in all the study participants. Ultrasound studies were performed using a Siemens Sonoline Antares (Siemens Medical Systems, Malvern, PA, USA) or a Voluson 730 Expert (GE Medical Systems, Milwaukee, WI, USA) with 6–4-MHz linear curved-array probes. Estimated fetal weight was calculated using the Hadlock formula [42] and centile based on local reference curves [40]. Fetoplacental Doppler examination followed standardized guidelines [43] included the uterine arteries [44], the umbilical artery [45], the fetal middle cerebral artery [45] and the ductus venosus [46] with the calculation of the cerebroplacental ratio [47]. Maternal biochemical profile was also assessed at the time of maternal blood draw, including the evaluation of renal (creatinine, urea, sodium, potassium) and liver (AST, ALT, GGT) function, uric acid, glucose, triglycerides, total cholesterol, fibrinogen and platelets count.
At the time of delivery, gestational age, birthweight, Apgar scores, umbilical artery pH, neonatal intensive care unit admissions and perinatal mortality were recorded.

4.3. Maternal Blood Sampling

Peripheral maternal blood was obtained by venipuncture within 24–48 h of preeclampsia diagnosis and at matched gestational age for controls. Sampling was done in the morning after fasting for 6–8 h at least. The samples were incubated for 30 min at room temperature to allow clotting and subsequently centrifuged at 1500 g for 10 min at 4 °C to separate the serum from clots. Afterwards, serum samples were transferred to acetonitrile treated tubes and immediately stored at −80 °C until assayed.

4.4. Metabolomic Analysis

The metabolomic analysis comprised the determination of lipids (lipidomics), amino acids and polar metabolites, achieved through a rigorous and well-established four-level extraction protocol. Lipidomic analysis was achieved by two methods, with methanol extraction and with choloform:methanol extraction (Folch method). Detailed methodology is provided in the Appendix A. This analysis was achieved by investigators blinded to the study group of each sample.

4.5. Statistical Analysis

Clinical data were analyzed with the statistical software STATA 14.2 (StataCorp LLC, College Station, TX, USA). Categorical data are displayed as percentages and continuous data as mean ± standard deviation or median (interquartile range) according to their distribution (normality was assessed using the Kolmogorov-Smirnov test). Statistical analysis for continuous variables included the use of student t-tests for normally distributed data or Mann Whitney U tests in non-normally distributed data. Fisher exact test was used for categorical variables. All reported p-values are two-sided. p < 0.05 was set for statistical significance.
For metabolomics data, statistical approach was performed using Metaboanalyst 4.0 (http://www.metaboanalyst.ca/, accessed on 11 August 2021). Initially, a multivariate modeling was applied including the use of unsupervised methods such as PCA, and supervised methods such as PLS-DA and OPLS-DA. A variable importance in projection (VIP) plot, which is a visual representation of the importance of the metabolites in discriminating the groups of interest, is provided. Secondly, for each protein a univariate Student’s t-test was performed and the Benjamini-Hochberg method was used to adjust p values for multiple testing with consideration of a 5% false discovery rate. An additional unsupervised HCA was performed based on the univariate results. Last, differential pathways were identified from an over representation analysis performed in Metaboanalyst using the Pathway Analysis option. This analysis was performed using a Fisher’s exact test to calculate the probability of finding at least a particular number of metabolites containing a biological term of interest in the given compound list based on the Kyoto Encyclopedia of Genes and Genome (KEGG) [48]. Detailed statistical approach is provided in the Appendix A.

5. Conclusions

In conclusion, we identified a complex mix of pathophysiological pathways in early-onset severe preeclampsia in this study. The main changes were attributed to amino acids, specifically arginine, alanine, aspartate, glutamate, valine, leucine, isoleucine, proline and histidine, and linoleic acid metabolism. The metabolomic profile observed in early-onset severe preeclampsia suggests the involvement of multiple pathways in its clinical manifestations, such as vasoconstriction, endothelial dysfunction, oxidative stress, complement activation, inflammation and predisposition to metabolic syndrome and diabetes. The interplay between the detected pathways may provide a better understanding of the underlying etiology for this specific phenotype of preeclampsia and unveil its impending therapeutic targets. Further research is warranted to develop effective therapeutics and investigate their usefulness in reducing maternal and perinatal complications in early-onset severe preeclampsia.

Supplementary Materials

The following are available online at https://www.mdpi.com/article/10.3390/life12010086/s1, Table S1: Univariate analysis results for each metabolite.

Author Contributions

L.Y., E.G. and F.C. (Fatima Crispi) conceived the hypothesis and the study design. M.B., M.P., H.G.-C., O.T.-C., A.P.D., V.H.-G., J.M.C., J.C.G.-P., M.D.-R., E.G. and F.C. (Fatima Crispi) designed the methods for the project “Targeting endothelial dysfunction in highly prevalent diseases–PIE15/00027”. L.Y., J.M., C.P., F.C. (Francesca Crovetto) were involved in recruiting the patients. L.Y. established the database and collected the blood samples. P.H. and N.C. performed the metabolomics data acquisition. L.Y., P.H. and N.C. analyzed the data. L.Y., R.V.S., E.G. and F.C. (Fatima Crispi) drafted the manuscript. All the authors revised the manuscript and approved this submitted final version. All authors have read and agreed to the published version of the manuscript.

Funding

This project has been partially funded with the support of the Erasmus+ Programme of the European Union (Framework Agreement number: 2013-0040). This publication reflects the views only of the author, and the Commission cannot be held responsible for any use, which may be made of the information contained therein. Additionally, the research leading to these results has received funding form “la Caixa” Foundation under grant agreements LCF/PR/GN14/10270005 and LCF/PR/GN18/10310003, the Instituto de Salud Carlos III (PI14/00226, PI15/00130, PIE15/00027, PI17/00675, PI18/00073, PI18/00960, PI19/00888, PI20/00569) integrados en el Plan Nacional de I+D+I y cofinanciados por el ISCIII-Subdirección General de Evaluación y el Fondo Europeo de Desarrollo Regional (FEDER) “Una manera de hacer Europa”, Cerebra Foundation for the Brain Injured Child (Carmarthen, Wales, UK), Ministerio de Economía y Competitividad (SAF PID2019-105/48RB-100), Fundació La Marató de TV3 (202026-10), Instituto Juan Carlos III (JR19/00006), European Reference Network (ERN) RARE-Liver (hepatic diseases) and AGAUR 2017 SGR grant nº 1531 and 517 from Generalitat de Catalunya. O.T.C. was supported by Miguel Servet grant from the Instituto de Salud Carlos III (CP17/00114).

Institutional Review Board Statement

The study was conducted according to the guidelines of the Declaration of Helsinki and approved by the local ethics committee of the Hospital Clinic of Barcelona (HCB/2015/0585).

Informed Consent Statement

Written informed consent was obtained from all subjects involved in the study.

Data Availability Statement

The metabolomics data reported in this study are available as supplementary information.

Acknowledgments

The Hospital Clínic-IDIBAPS Biobank resource has been used in this research. We thank the patients for joining this study and the nurses from the Departments of Maternal-Fetal Medicine at BCNatal (Barcelona, Spain) for their assistance in gathering human samples. We also thank Jordi Mayneris from the Proteomics facility of the Centre for Omic Sciences Joint Unit of the Universitat Rovira i Virgili-Eurecat for their contribution to the metabolomics and bioinformatics analysis.

Conflicts of Interest

The authors declare no conflict of interest.

Appendix A

Appendix A.1. Methods

Appendix A.1.1. Metabolomics Technique

Method 1: Lipidomic Analysis with Methanol Extraction

For the extraction of less hydrophobic lipids, a protein precipitation extraction was performed by adding four volumes of methanol containing internal standard mixture (myristic acid-d27, arachidonic acid-d8, Cholic acid-d5, Taurocholic acid-d5 LysoPC 18:1-d7, and labelled Carnitine Mix from Cambridge Isotopes) to serum. Then, the samples were mixed and incubated at −20 °C for 30 min., centrifuged at 15,000 rpm and supernatant was analysed by UHPLC-qTOF (model 6550 of Agilent, Agilent, Santa Clara, CA USA) in both positive and negative electrospray ionization mode.
The chromatographic method was the same for both ionization modes. A gradient elution with water and acetonitrile with 0.05% formic acid as mobile phase and C18 column (ACQUITY UPLC BEH C18 Column, 1.7 μm, 2.1 mm × 100 mm) that allowed the sequential elution of the less hydrophobic lipids such as non-esterified fatty acids, acyl carnitines, bile acids, steroids and lysophospholipids among others.
The identification of lipid species was performed by matching their accurate mass and tandem mass spectrum, when available, to Metlin-PCDL from Agilent containing more than 40,000 metabolites and lipids. In addition, chromatographic behavior of pure standards for each family and bibliographic information was used to ensure their putative identification.
After putative identification of lipids, these were semi quantified depending on their family similarity by an internal standard calibration curves using the pure chemical standards indicated in Table A1.
Table A1. Standards used for methanol lipidomic extraction.
Standards
15-HETElysoPC 18:1
arachidonic acidlysoPE18:1
Cholic acid lysoPI 18:1
Deoxycholic acidsphingosine-1-P
Dehydroisoandosterone-3-sulfate Taurocholic acid
Hydrocortisone (cortisol)Carnitine Mix

Method 2: Lipidomic Analysis with Choloform:Methanol (Folch Method) Extraction

For the extraction of more hydrophobic lipids, a liquid-liquid extraction with chloroform:methanol (2:1) based on Folch procedure was performed by adding four volumes of chloroform:methanol (2:1) containing internal standard mixture (Lipidomic SPLASH®, Avanti Polar Lipids, Birmingham, AL, USA) to serum. Then, the samples were mixed and incubated at −20 °C for 30 min. Afterwards, water with NaCl (0.8%) was added and mixture was centrifuged at 15,000 rpm. Lower phase was recovered, evaporated to dryness and reconstituted with methanol:methyl-tert-butyl ether (9:1) and analysed by UHPLC-qTOF (model 6550 of Agilent, USA) in both positive and negative electrospray ionization modes.
As method 1, the chromatographic method was the same for both ionizations. Gradient consist in an elution with a ternary mobile phase containing water, methanol and 2-propanol with 10mM ammonium formate and 0.1% formic acid. The stationary phase was a C18 column (Kinetex EVO C18 Column, 2.6 μm, 2.1 mm × 100 mm) that allows the sequential elution of the more hydrophobic lipids such as lysophospholipids, sphingomyelins, phospholipids, diglycerides, triglycerides and cholesteryl esters, among others.
The identification of lipid species was performed by matching their accurate mass and tandem mass spectrum, when available, to Metlin-PCDL from Agilent containing more than 40,000 metabolites and lipids. In addition, chromatographic behaviour of pure standards for each family and bibliographic information was used to ensure their putative identification.
After putative identification of lipids, these were semi quantified depending on their family similarity by and internal standard calibration curves using the pure chemical standards indicated in Table A2.
Table A2. Standards used for Folch based lipidomic analysis.
Standards
Sphingomyelin
d18:1/16:0
Stearoyl-rac-glycerol
Oelamide
Dilynoleyl-rac-glycerol
Palmitoyl-oleyl-lynoleyl-rac-glycerol
Dipalmitoyl-phosphoethanolamine
Dioleyl-phosphocholine
Cholesteryl linoleate

Method 3: Aminoacids Analysis

For the extraction of aminoacids, a protein precipitation extraction was performed by adding four volumes of methanol containing internal standards (Metabolomics labelled aminoacid mixture from Cambridge Isotopes) to serum samples. Then, the samples were mixed and incubated at −20 °C for 30 min., centrifuged at 15,000 rpm and supernatant was derivatized using AccQ-Tag reagent from Waters® (Milford, MA, USA) following manufacturing protocol. Then, derivatized aminoacids were analysed by UHPLC-QqQ (model 6490 of Agilent, USA) in Multiple Reaction Monitoring acquisition.
The chromatographic separation consists of a gradient elution with water and acetonitrile with 0.1% formic acid as mobile phase and C18 column (ACQUITY UPLC HSS T3 Column, 1.7 μm, 2.1 mm × 150 mm) that allows the determination and separation of aminoacids and derivatives. Their semi-quantification was done with pure chemical standard curves for all compounds.

Method 4: Polar Metabolites and Central Carbon Metabolism

For the extraction of polar metabolites and central carbon metabolism, a protein precipitation extraction was performed by adding eight volumes of methanol:water (8:2) containing internal standard mixture (succinic acid-d4, myristic acid-d27, glicerol-13C3 and D-glucose-13C6) to serum samples. Then, the samples were mixed and incubated at 4ºC for 10 min., centrifuged at 15,000 rpm and supernatant was evaporated to dryness and freeze dried in a liophylizator before compound derivatization (metoximation and silylation). The derivatized compounds were analysed by GC-qTOF (model 7200 of Agilent, USA).
The chromatographic separation was based on Fiehn Method, using a J&W Scientific HP5-MS (30 m × 0.25 mm i.d., 0.25 μm film capillary column and helium as carrier gas using an oven program from 60 to 325 °C. Ionization was done by electronic impact (EI), with electron energy of 70 eV and operated in full Scan mode.
In addition of targeted compounds from central carbon metabolism, a screening for the identification of more metabolites was performed by matching their EI mass spectrum and retention time to metabolomic Fiehn library (from Agilent) which contains more than 1.400 metabolites.
After putative identification of metabolites, these and target compounds were semi-quantified depending on their family similarity by an internal standard calibration curves using the pure chemical standards indicated in Table A3.
Table A3. Standards used for central carbon metabolism analysis.
Compound
Piruvic acidAconitic acid
Lactic acid3-Phosphoglyceric acid
Glycolic acidCitric/isocitric acid
2-Hydroxybutyric acidMyristic acid
Oxalic AcidGlucose
3-Hydroxybutiric acidPalmitic acid
GlycerolRibose-5-phosphate
Succinic acidLinoleic acid
Glyceric acidOleic Acid
Fumaric acidStearic acid
Malic acidFructose-6-phosphate
Threonic acidGlucose-6-phosphate
2-hydroxyglutaric acidFructose-1,6-bisphosphate
alpha-Ketoglutaric acid6-Phosphogluconic acid
PhosphoenolpyruvateSucrose
Ornithinealpha-Tocopherol
Glyceraldehyde-3-phosphateCholesterol

Appendix A.2. Statistical Analysis

For metabolomics data, statistical approach was performed using Metaboanalyst 4.0 (http://www.metaboanalyst.ca/, accessed on 11 August 2021). Only those metabolites that were present in ≥ 70% of the samples in at least one group were considered. To estimate missing values in the included metabolites, we used a Bayesian principal component analysis approach. Then, a log base 2 transformation was applied, and data were mean-centered for univariate analyses and Pareto scaled for multivariate analyses. Initially, a multivariate modelling was performed including the use of unsupervised methods such as principal component analysis (PCA), and supervised methods like partial least squares discriminant analysis (PLS-DA) and an orthogonal projection to latent structures discriminant analysis (OPLS-DA). A variable importance in projection (VIP) plot, which is a visual representation of the importance of the particular metabolites in discriminating the groups of interest, is provided. To assess the significance of class discrimination whether it could be due to chance, a permutation test was performed applying 2000 permutations. For the selected model, the goodness of fit (R2X) and the predictive performance (Q2Y), which relate to the explained and predicted variance respectively, were calculated. All these methods were applied with a Pareto scaling.
Secondly, for each metabolite a univariate Student’s t-test was performed and Benjamini-Hochberg method was used to adjust p values for multiple testing with consideration of 5% false discovery rate. An additional unsupervised hierarchical clustering analysis (HCA) was performed based on the univariate results.
Last, differential pathways were identified from an over representation analysis (ORA) performed in metaboanalyst using the Metabolite Set Enrichment Analysis option. Significantly different metabolites based on the univariate analysis were used for the pathway analyses. The ORA is to test if certain groups of metabolites are represented more often than expected by chance within a given metabolite list. This was tested statistically using a Fisher’s exact test to calculate the probability of seeing at least a particular number of metabolites containing a biological term of interest in the given compound list.

References

  1. Mol, B.W.J.; Roberts, C.T.; Thangaratinam, S.; Magee, L.A.; De Groot, C.J.M.; Hofmeyr, G.J. Pre-eclampsia. Lancet 2016, 387, 999–1011. [Google Scholar] [CrossRef]
  2. Duley, L. The Global Impact of Pre-eclampsia and Eclampsia. Semin. Perinatol. 2009, 33, 130–137. [Google Scholar] [CrossRef] [PubMed]
  3. Ghulmiyyah, L.; Sibai, B. Maternal Mortality From Preeclampsia/Eclampsia. Semin. Perinatol. 2012, 36, 56–59. [Google Scholar] [CrossRef] [PubMed]
  4. Redman, C.W.; Sargent, I.L.; Staff, A.C. IFPA senior award lecture: Making sense of pre-eclampsia—Two placental causes of preeclampsia? Placenta 2014, 35, S20–S25. [Google Scholar] [CrossRef] [PubMed]
  5. Brosens, I.; Pijnenborg, R.; Vercruysse, L.; Romero, R. The “Great Obstetrical Syndromes” are associated with disorders of deep placentation. Am. J. Obstet. Gynecol. 2011, 204, 193–201. [Google Scholar] [CrossRef] [PubMed] [Green Version]
  6. Myatt, L.; Roberts, J.M. Preeclampsia: Syndrome or Disease? Curr. Hypertens. Rep. 2015, 17, 83. [Google Scholar] [CrossRef] [PubMed]
  7. Von Dadelszen, P.; Magee, L.A.; Roberts, J.M. Subclassification of Preeclampsia. Hypertens. Pregnancy 2003, 22, 143–148. [Google Scholar] [CrossRef]
  8. Clish, C.B. Metabolomics: An emerging but powerful tool for precision medicine. Mol. Case Stud. 2015, 1, a000588. [Google Scholar] [CrossRef] [Green Version]
  9. Kenny, L.C.; Broadhurst, D.; Brown, M.; Dunn, W.B.; Redman, C.W.G.; Kell, D.B.; Baker, P.N. Detection and identification of novel metabolomic biomarkers in preeclampsia. Reprod. Sci. (Thousand Oaks Calif.) 2008, 15, 591–597. [Google Scholar] [CrossRef] [PubMed] [Green Version]
  10. Austdal, M.; Skrastad, R.B.; Gundersen, A.S.; Austgulen, R.; Iversen, A.C.; Bathen, T.F. Metabolomic biomarkers in serum and urine in women with preeclampsia. PLoS ONE 2014, 9, e91923. [Google Scholar] [CrossRef] [Green Version]
  11. Turner, E.; Brewster, J.A.; Simpson, N.A.B.; Walker, J.J.; Fisher, J. Plasma from women with preeclampsia has a low lipid and ketone body content—A nuclear magnetic resonance study. Hypertens. Pregnancy 2007, 26, 329–342. [Google Scholar] [CrossRef]
  12. Turner, E.; Brewster, J.A.; Simpson, N.A.; Walker, J.J.; Fisher, J. Aromatic amino acid biomarkers of preeclampsia—A nuclear magnetic resonance investigation. Hypertens. Pregnancy 2008, 27, 225–235. [Google Scholar] [CrossRef] [PubMed]
  13. Mukherjee, R.; Ray, C.D.; Ray, S.; Dasgupta, S.; Chaudhury, K. Altered metabolic profile in early and late onset preeclampsia: An FTIR spectroscopic study. Pregnancy Hypertens. 2014, 4, 70–80. [Google Scholar] [CrossRef]
  14. Schott, S.; Hahn, J.; Kurbacher, C.; Moka, D. 31P and 1H nuclear magnetic resonance spectroscopy of blood plasma in female patients with preeclampsia. Int. J. Biomed. Sci. 2012, 8, 258–263. [Google Scholar] [PubMed]
  15. Liu, Y.; Zu, L.; Cai, W.; Cheng, Q.; Hua, T.; Peng, L.; Li, G.; Zhang, X. Metabolomics revealed decreased level of omega-3 PUFA-derived protective eicosanoids in pregnant women with pre-eclampsia. Clin. Exp. Pharmacol. Physiol. 2019, 46, 705–710. [Google Scholar] [CrossRef]
  16. Youssef, L.; Simões, R.V.; Miranda, J.; Luisa, M.; Martín, G.; Paules, C.; Crovetto, F.; Amigó, N.; Cañellas, N.; Gratacos, E. Paired maternal and fetal metabolomics reveal a differential fingerprint in preeclampsia versus fetal growth restriction. Sci. Rep. 2021, 11, 14422. [Google Scholar] [CrossRef] [PubMed]
  17. Baylis, C.; Beinder, E.; Sütö, T.; August, P. Recent insights into the roles of nitric oxide and reninangiotensin in the pathophysiology of preeclamptic pregnancy. Semin. Nephrol. 1998, 18, 208–230. [Google Scholar]
  18. Evans, R.W.; Powers, R.W.; Ness, R.B.; Cropcho, L.J.; Daftary, A.R.; Harger, G.F.; Vergona, R.; Finegold, D.N. Maternal and fetal amino acid concentrations and fetal outcomes during pre-eclampsia. Reproduction 2003, 125, 785–790. [Google Scholar] [CrossRef]
  19. Noris, M.; Todeschini, M.; Cassis, P.; Pasta, F.; Cappellini, A.; Bonazzola, S.; Macconi, D.; Maucci, R.; Porrati, F.; Benigni, A.; et al. L-Arginine Depletion in Preeclampsia Orients Nitric Oxide Synthase Toward Oxidant Species. Hypertension 2004, 43, 614–622. [Google Scholar] [CrossRef] [PubMed] [Green Version]
  20. Dorniak-Wall, T.; Grivell, R.M.; Dekker, G.A.; Hague, W.; Dodd, J.M. The role of L-arginine in the prevention and treatment of pre-eclampsia: A systematic review of randomised trials. J. Hum. Hypertens. 2014, 28, 230–235. [Google Scholar] [CrossRef]
  21. Cheng, S.; Rhee, E.P.; Larson, M.G.; Lewis, G.D.; McCabe, E.L.; Shen, D.; Palma, M.J.; Roberts, L.D.; Dejam, A.; Souza, A.L.; et al. Metabolite profiling identifies pathways associated with metabolic risk in humans. Circulation 2012, 125, 2222–2231. [Google Scholar] [CrossRef] [PubMed] [Green Version]
  22. Kelly, A.; Stanely, C.A. Disorders of glutamate metabolism. Ment. Retard. Dev. Disabil. 2001, 295, 471–487. [Google Scholar] [CrossRef] [PubMed]
  23. Brosnan, M.E.; Brosnan, J.T. Hepatic glutamate metabolism: A tale of 2 hepatocytes. Am. J. Clin. Nutr. 2009, 90, 857–861. [Google Scholar] [CrossRef] [Green Version]
  24. Pouta, A.; Hartikainen, A.L.; Sovio, U.; Gissler, M.; Laitinen, J.; McCarthy, M.I.; Ruokonen, A.; Elliott, P.; Järvelin, M.R. Manifestations of Metabolic Syndrome after Hypertensive Pregnancy. Hypertension 2004, 43, 825–831. [Google Scholar] [CrossRef] [Green Version]
  25. Prokopieva, V.D.; Yarygina, E.G.; Bokhan, N.A.; Ivanova, S.A. Use of Carnosine for Oxidative Stress Reduction in Different Pathologies. Oxid. Med. Cell. Longev. 2016, 2016, 2939087. [Google Scholar] [CrossRef] [PubMed] [Green Version]
  26. Youssef, L.; Erlandsson, L.; Åkerström, B.; Miranda, J.; Paules, C.; Crovetto, F.; Crispi, F.; Gratacos, E.; Hansson, S.R. Hemopexin and α1-microglobulin heme scavengers with differential involvement in preeclampsia and fetal growth restriction. PLoS ONE 2020, 15, e0239030. [Google Scholar] [CrossRef]
  27. Wang, T.J.; Larson, M.G.; Vasan, R.S.; Cheng, S.; Rhee, E.P.; McCabe, E.; Lewis, G.D.; Fox, C.S.; Jacques, P.F.; Fernandez, C.; et al. Metabolite profiles and the risk of developing diabetes. Nat. Med. 2011, 17, 448–453. [Google Scholar] [CrossRef]
  28. Feig, D.S.; Shah, B.R.; Lipscombe, L.L.; Wu, C.F.; Ray, J.G.; Lowe, J.; Hwee, J.; Booth, G.L. Preeclampsia as a Risk Factor for Diabetes: A Population-Based Cohort Study. PLoS Med. 2013, 10, e1001425. [Google Scholar] [CrossRef] [Green Version]
  29. Mills, J.L.; DerSimonian, R.; Raymond, E.; Morrow, J.D.; Roberts, L.J.; Clemens, J.D.; Hauth, J.C.; Catalano, P.; Sibai, B.; Curet, L.B.; et al. Prostacyclin and thromboxane changes predating clinical onset of preeclampsia: A multicenter prospective study. J. Am. Med. Assoc. 1999, 282, 356–362. [Google Scholar] [CrossRef] [Green Version]
  30. Horvath, A.; Koletzko, B.; Szajewska, H. Effect of supplementation of women in high-risk pregnancies with long-chain polyunsaturated fatty acids on pregnancy outcomes and growth measures at birth: A meta-analysis of randomized controlled trials. Br. J. Nutr. 2007, 98, 253–259. [Google Scholar] [CrossRef]
  31. Rolnik, D.L.; Wright, D.; Poon, L.C.; O’Gorman, N.; Syngelaki, A.; de Paco Matallana, C.; Akolekar, R.; Cicero, S.; Janga, D.; Singh, M.; et al. Aspirin versus Placebo in Pregnancies at High Risk for Preterm Preeclampsia. N. Engl. J. Med. 2017, 377, 613–622. [Google Scholar] [CrossRef] [PubMed]
  32. Serrano, N.C.; Guio-Mahecha, E.; Quintero-Lesmes, D.C.; Becerra-Bayona, S.; Paez, M.C.; Beltran, M.; Herrera, V.M.; Leon, L.J.; Williams, D.; Casas, J.P. Lipid profile, plasma apolipoproteins, and pre-eclampsia risk in the GenPE case-control study. Atherosclerosis 2018, 276, 189–194. [Google Scholar] [CrossRef]
  33. Arifin, R.; Kyi, W.M.; Che Yaakob, C.A.; Yaacob, N.M. Increased circulating oxidised low-density lipoprotein and antibodies to oxidised low-density lipoprotein in preeclampsia. J. Obstet. Gynaecol. (Lahore) 2017, 37, 580–584. [Google Scholar] [CrossRef]
  34. Youssef, L.; Miranda, J.; Blasco, M.; Paules, C.; Crovetto, F.; Palomo, M.; Torramade-Moix, S.; García-Calderó, H.; Tura-Ceide, O.; Dantas, A.P.; et al. Complement and coagulation cascades activation is the main pathophysiological pathway in early-onset severe preeclampsia revealed by maternal proteomics. Sci. Rep. 2021, 11, 3048. [Google Scholar] [CrossRef]
  35. Hertig, A.; Liere, P.; Chabbert-Buffet, N.; Fort, J.; Pianos, A.; Eychenne, B.; Cambourg, A.; Schumacher, M.; Berkane, N.; Lefevre, G.; et al. Steroid profiling in preeclamptic women: Evidence for aromatase deficiency. Am. J. Obstet. Gynecol. 2010, 203, 477.e1–477.e9. [Google Scholar] [CrossRef] [PubMed]
  36. Kosicka, K.; Siemiątkowska, A.; Szpera-Goździewicz, A.; Krzyścin, M.; Bręborowicz, G.H.; Główka, F.K. Increased cortisol metabolism in women with pregnancy-related hypertension. Endocrine 2018, 61, 125–133. [Google Scholar] [CrossRef] [Green Version]
  37. Quinkler, M.; Stewart, P.M. Hypertension and the cortisol-cortisone shuttle. J. Clin. Endocrinol. Metab. 2003, 88, 2384–2392. [Google Scholar] [CrossRef] [PubMed] [Green Version]
  38. Steegers, E.A.P.; Von Dadelszen, P.; Duvekot, J.J.; Pijnenborg, R. Pre-eclampsia. Lancet 2010, 376, 631–644. [Google Scholar] [CrossRef]
  39. Roberts, J.M.; Druzin, M.; August, P.A.; Gaiser, R.R.; Bakris, G.; Granger, J.P.; Barton, J.R.; Jeyabalan, A.; Bernstein, I.A.; Johnson, D.D.; et al. ACOG Guidelines: Hypertension in Pregnancy; ACOG: Washington, DC, USA, 2012; ISBN 9781934984284. [Google Scholar]
  40. Figueras, F.; Meler, E.; Iraola, A.; Eixarch, E.; Coll, O.; Figueras, J.; Francis, A.; Gratacos, E.; Gardosi, J. Customized birthweight standards for a Spanish population. Eur. J. Obstet. Gynecol. Reprod. Biol. 2008, 136, 20–24. [Google Scholar] [CrossRef]
  41. Robinson, H.; Fleming, J. A critical evaluation of sonar crown-rump length measurements. Br. J. Obstet. Gynaecol. 1975, 82, 702–710. [Google Scholar] [CrossRef]
  42. Hadlock, F.P.; Harrist, R.B.; Sharman, R.S.; Deter, R.L.; Park, S.K. Estimation of fetal weight with the use of head, body, and femur measurements—A prospective study. Am. J. Obs. Gynecol. 1985, 151, 333–337. [Google Scholar] [CrossRef]
  43. Bhide, A.; Acharya, G.; Bilardo, C.M.; Brezinka, C.; Cafici, D.; Hernandez-Andrade, E.; Kalache, K.; Kingdom, J.; Kiserud, T.; Lee, W.; et al. ISUOG practice guidelines: Use of Doppler ultrasonography in obstetrics. Ultrasound Obstet. Gynecol. 2013, 41, 233–239. [Google Scholar] [CrossRef]
  44. Gómez, O.; Figueras, F.; Fernández, S.; Bennasar, M.; Martínez, J.M.; Puerto, B.; Gratacós, E. Reference ranges for uterine artery mean pulsatility index at 11–41 weeks of gestation. Ultrasound Obstet. Gynecol. 2008, 32, 128–132. [Google Scholar] [CrossRef]
  45. Arduini, D.; Rizzo, G. Normal values of pulsatility index from fetal vessels: A cross-sectional study on 1556 healthy fetuses. J. Perinat. Med. 1990, 18, 165–172. [Google Scholar] [CrossRef] [PubMed]
  46. Hecher, K.; Campbell, S.; Snijders, R.; Nicolaides, K. Reference ranges for fetal venous and atrioventricular blood flow parameters. Ultrasound Obstet. Gynecol. 1994, 4, 381–390. [Google Scholar] [CrossRef] [PubMed]
  47. Baschat, A.A.; Gembruch, U. The cerebroplacental Doppler ratio revisited. Ultrasound Obstet. Gynecol. 2003, 21, 124–127. [Google Scholar] [CrossRef] [PubMed]
  48. Kanehisa, M.; Goto, S. Comprehensive gene and pathway analysis of cervical cancer progression. Nucleic Acids Res. 2000, 28, 27–30. [Google Scholar] [CrossRef]
Figure 1. (a) 2-dimensional and (b) 3-dimensional principal component analysis (PCA) scores plots. (c) Partial least squares discriminant analysis (PLS-DA) scores plot between components 1 and 2. The explained variance is shown in brackets. Controls (CT) are presented in green circles and preeclampsia cases (PE) in violet triangles. (d) Top 15 most important metabolites that contribute to group separation identified through PLS-DA ranked by variable importance in projection (VIP) scores. The right heatmap shows the mean intensity variable in the respective group, with red and blue indicating high and low metabolite levels, respectively. GA, glyco-cholic acid; HDHA, hydroxy-docosahexaenoic acid; LPC, lyso-phosphatidylcholines; LPE, Lyso-phosphatidylethanolamine; LPI, lyso-phosphatidylinositol; NA, non-applicable; Pregnenolone s, pregnenolone sulfate; Stearidonic ac, stearidonic acid; Urso/Hyo ac, urso-deoxycholic/hyo-deoxycholic acid.
Life 12 00086 g001
Figure 2. Unsupervised hierarchical clustering considering the top 25 metabolites selected from univariate analysis. A z-score transformation was performed on the intensity of each metabolite across all samples and the heatmap displays each sample z-score. Rows represent metabolites and columns represent samples. Both metabolites and samples are clustered by Euclidean distance and Ward linkage. 1-Methylhistidine (HMDB00001); 2-MIV-carnitine, 2-methyl-butyryl-carnitine/isovaleryl-carnitine/valeryl-carnitine (HMDB00688); Aminoadipic ac, aminoadipic acid (HMDB00510); Anserine (HMDB00194); Cortisol (HMDB00063); Cortisone (HMDB02802); Cystine (HMDB00192); Ethanolamine (HMDB00149); Free carnitine (HMDB00062); GA, glyco-cholic acid (HMDB0000138); Glutamine (HMDB00641); HDHA, hydroxy-docosahexaenoic acid (NA); Histidine (HMDB00177); IB-carnitine, iso-butyryl-carnitine/butyryl-carnitine (HMDB02013); Homo-citrulline (HMDB00679); Hydroxylysine (HMDB00450); L-2-Aminoadipic ac, L-2-Aminoadipic acid (HMDB00510); Linolenic ac, linolenic acid (HMDB00673); LPE, lyso-phosphatidylethanolamine (HMDB11483); Lysine (HMDB00182); Methionine (HMDB00696); Pregnenolone s, pregnenolone sulfate (HMDB00774); P-carnitine, propionyl-carnitine (HMDB00824); Pyruvic acid (HMDB00243); Tyrosine (HMDB00158).
Life 12 00086 g002
Figure 3. Proposed metabolome view with significant pathways according to the pathway enrichment analysis. The meaning of compound colors within the pathways is as follows: grey means those metabolites are not detected as significantly different in our data and are used as background for enrichment analysis; red means that the metabolites are in the data with significantly higher levels in early-onset severe preeclampsia compared to controls. KEGG database (http://www.kegg.jp/kegg/kegg1.html, accessed on 11 August 2021) was the source of the proposed metabolic pathways.
Life 12 00086 g003
Table 1. Baseline characteristics of the study population.
Controls
n = 6
Preeclampsia
n = 14
p-Value
Maternal characteristics
Age (years)36.5 ± 2.934.1 ± 3.80.28 *
Caucasian ethnicity5 (83.3)6 (42.9)0.10 ƒ
Pre-gestational BMI (kg/m2)22.2 ± 2.724.1 ± 4.10.38 *
Nulliparity5 (83.3)9 (64.3)0.39 ƒ
Previous preeclampsia0 (0)1 (7.1)0.50 ƒ
Chronic hypertension0 (0)1 (7.1)0.50 ƒ
Assisted reproductive technologies0 (0)3 (21.4)0.22 ƒ
Smoking during pregnancy1 (16.7)1 (7.1)0.52 ƒ
Fetal ultrasound assessment
Gestational age at ultrasound (weeks) 26.6 ± 3.730.5 ± 2.60.013 *
Estimated fetal weight (g)994 ± 4961187 ± 3280.30 *
Estimated fetal weight centile34 (29–66)1 (0–3)<0.001 ω
Uterine arteries mean PI (z score)−0.53 ± 1.772.60 ± 2.080.002 *
Umbilical artery PI (z score)−0.40 ± 0.321.27 ± 1.710.07 *
Middle cerebral artery PI (z score)0.13 ± 1.09−1.16 ± 0.990.027 *
Cerebroplacental ratio (z score)−0.06 ± 0.89−1.93 ± 1.60.027 *
Ductus venosus PI (z score)−1 ± 0.79−0.34 ± 1.290.44 *
Maternal biophysical and biochemical profile at the time of sampling
Gestational age at blood draw (weeks) 30 ± 1.831.3 ± 1.80.16 *
Systolic blood pressure (mmHg)150.5 ± 18.1107.7 ± 8.3<0.001 *
Diastolic blood pressure (mmHg)89.3 ± 870.7 ± 3.3<0.001 *
Creatinine (mg/dL)0.42 ± 0.070.69 ± 0.170.001 *
Urea (mg/dL)15.4 ± 4.240.4 ± 16.70.002 *
Glomerular filtration rate (mL/min)85 ± 12.262.1 ± 8<0.001 *
Sodium (mEq/L)138.3 ± 1.2136.4 ± 2.10.048 *
Potassium (mEq/L)4.13 ± 0.214.61 ± 0.230.001 *
AST (u/L)17 (15–23)25 (16–48)0.16 ω
ALT (u/L)15 (9–21)27 (14–65)0.07 ω
GGT (u/L)10 (7–11)19 (15–28)0.013 ω
Uric acid (mg/dL)3.33 ± 0.436.09 ± 1.25<0.001 *
Glucose (mg/dL)75.5 ± 7.187.8 ± 19.70.13 *
Triglycerides (mg/dL)178.8 ± 67.7260.6 ± 97.80.06 *
Total cholesterol (mg/dL)277.2 ± 50.1241.9 ± 540.16 *
Fibrinogen (g/L)4.57 ± 0.983.44 ± 1.050.07 *
Platelets (103/L)271.8 ± 70.6209.1 ± 71.90.09 *
Proteinuria (g/24 h)-2.6 (0.6–5.8)-
Protein/creatinine ratio-2.2 (0.4–4.2)-
Perinatal outcomes
Gestational age at delivery (weeks)40.3 ± 1.132 ± 1.9<0.001 *
Cesarean section1 (16.7)11 (78.6)0.018 ƒ
Female sex4 (66.7)8 (57.1)0.69 ƒ
Birthweight (g)3531 ± 4101287 ± 267<0.001 *
Birthweight centile58 (41–80)0 (0–1)<0.001 ω
APGAR score 5 min < 70 (0)1 (7.1)0.50 ƒ
Umbilical artery pH7.20 ± 0.077.20 ± 0.090.97 *
Data are presented as mean ± standard deviation, median (interquartile range) or n (%) as appropriate. BMI, body mass index; PI, pulsatility index; AST, aspartate aminotransferase; ALT, alanine aminotransferase; GGT, gamma-glutamyl transferase. p value was calculated by student t (*), Mann Whitney U (ω) or Fisher exact (ƒ) tests as appropriate.
Table 2. The 82 metabolites significantly different in preeclampsia vs. controls by univariate analysis considering false discovery rate correction (q-value < 0.05).
HMDBMetabolite NameControls
Mean (SD)
Preeclampsia
Mean (SD)
p-Valueq-ValuePreeclampsia/Controls
HMDB00192Cystine−0.553 (0.167)0.237 (0.251)<0.0001< 0.0001Up
HMDB00149Ethanolamine−0.397 (0.160)0.170 (0.174)<0.0001< 0.0001Up
HMDB00158Tyrosine−0.431 (0.070)0.185 (0.238)<0.0001< 0.0001Up
HMDB00062Free carnitine−0.572 (0.138)0.245 (0.393)<0.0001< 0.0001Up
HMDB00194Anserine−0.361 (0.130)0.155 (0.183)<0.00010.0006Up
HMDB00824Propionyl-carnitine−0.581 (0.079)0.249 (0.464)<0.00010.0006Up
HMDB02013Iso-butyryl-carnitine/
Butyryl-carnitine
−0.565 (0.120)0.242 (0.465)<0.00010.0011Up
HMDB0000138Glyco-cholic acid-iso30.819 (0.401)−0.351 (0.450)<0.00010.0014Down
HMDB00679Homo-citrulline−0.614 (0.158)0.263 (0.318)<0.00010.0021Up
HMDB00243Pyruvic acid−0.505 (0.282)0.216 (0.300)<0.00010.0034Up
HMDB00774Pregnenolone sulfate0.708 (0.395)−0.303 (0.426)0.00010.0035Down
HMDB00696Methionine−0.512 (0.144)0.219 (0.351)0.00010.0038Up
HMDB00510L-2-Aminoadipic acid−0.561 (0.334)0.240 (0.339)0.00010.0038Up
HMDB00673Linolenic acid-iso2−0.567 (0.368)0.243 (0.341)0.00020.0044Up
HMDB00450Hydroxylysine−0.490 (0.292)0.210 (0.354)0.00020.0054Up
HMDB006882-methyl-butyryl-carnitine/Isovaleryl-carnitine/Valeryl-carnitine−0.562 (0.219)0.241 (0.403)0.00020.0060Up
HMDB0000138Glyco-cholic acid-iso20.719 (0.650)−0.308 (0.374)0.00030.0061Down
HMDB000011-Methylhistidine−0.524 (0.168)0.224 (0.390)0.00030.0064Up
HMDB00182Lysine−0.374 (0.181)0.160 (0.271)0.00040.0069Up
HMDB06547Stearidonic acid−0.650 (0.508)0.278 (0.534)0.00040.0069Up
HMDB00904Citrulline−0.300 (0.080)0.129 (0.341)0.00040.0075Up
HMDB00641Glutamine−0.396 (0.169)0.170 (0.301)0.00050.0075Up
HMDB11483LPE 20:2-sn10.616 (0.513)−0.264 (0.380)0.00050.0075Down
HMDB00063Cortisol0.979 (0.168)−0.420 (0.561)0.00060.0089Down
HMDB00168Asparagine−0.311 (0.127)0.133 (0.352)0.00060.0089Up
HMDB00177Histidine−0.372 (0.132)0.160 (0.299)0.00060.0089Up
HMDB00234Testosterone1.018 (0.787)−0.436 (0.695)0.00060.0089Down
HMDB0000138Glyco-cholic acid-iso10.716 (0.543)−0.307 (0.500)0.00070.0094Down
HMDB00687Leucine−0.376 (0.195)0.161 (0.294)0.00070.0096Up
HMDB000082-Hydroxybutyric acid−0.611 (0.395)0.262 (0.460)0.00080.0098Up
NALPI 18:10.631 (0.252)−0.271 (0.740)0.00080.0098Down
HMDB00159Phenylalanine−0.366 (0.170)0.157 (0.298)0.00090.0104Up
HMDB10383LPC 16:1 e−0.294 (0.166)0.126 (0.235)0.00090.0108Up
HMDB00208alpha-Ketoglutaric acid−0.368 (0.208)0.158 (0.306)0.00130.0139Up
NA11.13-Eicosadienoic acid−0.530 (0.377)0.227 (0.418)0.00130.0139Up
HMDB00517Arginine−0.297 (0.132)0.127 (0.367)0.00130.0139Up
NA17-HDHA−0.648 (0.384)0.278 (0.443)0.00130.0139Up
HMDB00167Threonine−0.415 (0.295)0.178 (0.353)0.00150.0156Up
HMDB00883Valine−0.344 (0.265)0.147 (0.274)0.00160.0157Up
HMDB06528w3-docosapentaenoic acid −0.524 (0.416)0.225 (0.435)0.00220.0203Up
HMDB00172Isoleucine−0.309 (0.123)0.133 (0.289)0.00220.0203Up
HMDB00148Glutamic acid−0.262 (0.267)0.112 (0.191)0.00220.0203Up
HMDB00214Ornithine−0.439 (0.261)0.188 (0.394)0.00230.0203Up
HMDB00946Urso-deoxycholic/
Hyo-deoxycholic acid
0.650 (0.394)−0.279 (0.584)0.00240.0204Down
HMDB07132
HMDB07105
HMDB07051
HMDB07023
HMDB07024
DG 34:3−0.411 (0.335)0.176 (0.344)0.00240.0204Up
HMDB00190Lactic acid−0.295 (0.151)0.126 (0.273)0.00240.0204Up
HMDB00826Pentadecanoic acid−0.440 (0.236)0.189 (0.407)0.00250.0206Up
HMDB05474TG 54:6−0.517 (0.475)0.221 (0.415)0.00260.0206Up
HMDB02231Eico-senoic acid−0.521 (0.332)0.223 (0.474)0.00270.0213Up
HMDB00271Sarcosine−0.481 (0.338)0.206 (0.436)0.00300.0230Up
HMDB00161Alanine−0.378 (0.185)0.162 (0.367)0.00330.0243Up
HMDB12328Trans-palmitoleic acid−0.497 (0.244)0.213 (0.607)0.00330.0243Up
HMDB06734ChoE 2020.320 (0.336)−0.137 (0.252)0.00340.0243Down
NALPC 22:3-sn10.629 (0.343)−0.269 (0.607)0.00340.0243Down
HMDB05447
HMDB10490
HMDB10502
HMDB10475
HMDB10489
TG 54:7−0.543 (0.565)0.233 (0.433)0.00350.0243Up
HMDB07972PC 34:1 e0.350 (0.286)−0.150 (0.315)0.00370.0249Down
NALPI 18:20.624 (0.343)−0.267 (0.609)0.00370.0249Down
HMDB0470212.13-EpOME(9)−0.461 (0.293)0.198 (0.443)0.00390.0254Up
HMDB10392LPC 20:2-sn20.516 (0.470)−0.221 (0.455)0.00410.0264Down
HMDB0240261LPI 18:00.633 (0.280)−0.271 (0.643)0.00420.0267Down
HMDB316543-Aminobutanoic acid−0.415 (0.227)0.178 (0.414)0.00420.0267Up
HMDB10221HODE-iso1−0.512 (0.440)0.219 (0.475)0.00480.0295Up
NALPI 22:40.548 (0.358)−0.235 (0.546)0.00490.0300Down
NALPI 20:40.590 (0.305)−0.253 (0.613)0.00530.0320Down
HMDB10386LPC 18:2-sn20.453 (0.348)−0.194 (0.446)0.00560.0330Down
HMDB006942-hydroxyglutaric acid−0.346 (0.099)0.148 (0.557)0.00600.0349Up
HMDB08287
HMDB08257
HMDB08318
HMDB08383
HMDB08286
PC 42:5 e0.339 (0.292)−0.145 (0.333)0.00640.0364Down
NALPI 14:00.660 (0.510)−0.283 (0.689)0.00770.0432Down
HMDB06547Stearidonic acid-iso1−0.405 (0.284)0.173 (0.431)0.00780.0432Up
HMDB01383Sphingosine-1-P0.402 (0.341)−0.172 (0.414)0.00810.0440Down
HMDB01032Dehydro-epiandrost-erone sulfate0.607 (0.361)−0.260 (0.670)0.00850.0440Down
HMDB00123Glycine−0.260 (0.085)0.111 (0.305)0.00870.0440Up
HMDB00575Homo-cystine−0.472 (0.373)0.202 (0.649)0.00870.0440Up
HMDB05461TG 54:5−0.324 (0.164)0.139 (0.614)0.00870.0440Up
HMDB02802Cortisone0.715 (0.138)−0.307 (0.574)0.00870.0440Down
HMDB02226Adrenic acid−0.421 (0.335)0.180 (0.447)0.00870.0440Up
HMDB00112gamma-Aminobutyric acid−0.449 (0.609)0.193 (0.373)0.00920.0460Up
HMDB00162Proline−0.308 (0.256)0.132 (0.329)0.00960.0471Up
HMDB00673Linolenic acid-iso1−0.414 (0.387)0.178 (0.432)0.00980.0474Up
HMDB10391LPC 20:1-sn20.526 (0.403)−0.225 (0.578)0.01000.0480Down
NALPC 22:3-sn20.498 (0.458)−0.214 (0.530)0.01050.0497Down
NALPI 16:00.577 (0.324)−0.247 (0.668)0.01070.0498Down
DG, diglycerides; ChoE, cholesteryl ester; HDHA, hydroxy-docosahexaenoic acid; LPE, lyso-phosphatidylethanolamine; LPI, lyso-phosphatidylinositol; LPC, lyso-phosphatidylcholines; PC, phosphatidylcholines; TG, triglycerides.
Table 3. Over representation analysis of different metabolites in preeclampsia vs controls based on the Kyoto Encyclopedia of Genes and Genome (KEGG).
PathwayTotalExpectedHitsRaw p−log(10)pAdjusted pFDRImpact
Aminoacyl-tRNA biosynthesis4817.03160.0006 × 10−912.200.05 × 10−90.05 × 10−90
Arginine biosynthesis140.4960.004 × 10−354.370.00030.00020.48
Alanine, aspartate and glutamate metabolism280.9970.03 × 10−344.950.0030.00090.45
Valine, leucine and isoleucine biosynthesis80.2840.09 × 10−340.480.0070.0020
Linoleic acid metabolism50.1830.000433.950.0320.0071
D-Glutamine and D-glutamate metabolism60.2130.000831.050.060.0110.50
Arginine and proline metabolism3813.4860.001727.600.140.0200.36
Histidine metabolism160.5740.001827.250.140.0200.27
Phenylalanine, tyrosine and tryptophan biosynthesis40.1420.00721.500.540.071
Butanoate metabolism150.5330.01418.4710.120.03
Nitrogen metabolism60.2120.01717.7210.130
Glyoxylate and dicarboxylate metabolism3211.3640.0241.6110.170.11
Glycine, serine and threonine metabolism331.1740.02715.6810.170.34
Phenylalanine metabolism100.3520.0513.3410.280.36
Lysine degradation250.8930.061.2510.310.14
Glutathione metabolism280.9930.0711.3110.370.11
alpha-Linolenic acid metabolism130.4620.0811.2410.370
Cysteine and methionine metabolism331.1730.110.9610.510.10
Glycerophospholipid metabolism3612.7730.130.8810.590.13
Citrate cycle (TCA cycle)200.7120.160.8110.650.10
Valine, leucine and isoleucine degradation4014.1930.170.7810.650
beta-Alanine metabolism210.7520.170.7710.650
Pyruvate metabolism220.7820.180.7410.670.29
Ubiquinone and other terpenoid-quinone biosynthesis90.3210.280.5610.970
Porphyrin and chlorophyll metabolism3010.6520.290.5410.970
Biotin metabolism100.3510.300.5210.980
Steroid hormone biosynthesis8530.1640.360.45110.08
Glycero-lipid metabolism160.5710.440.36110.01
Tyrosine metabolism4214.9020.440.35110.14
Primary bile acid biosynthesis4616.3220.490.31110.02
Pantothenate and CoA biosynthesis190.6710.500.30110
Seleno-compound metabolism200.7110.520.29110
Sphingolipid metabolism210.7510.530.27110.02
Propanoate metabolism230.8210.570.25110
Glycolysis/Gluconeogenesis260.9210.610.21110.10
Arachidonic acid metabolism3612.7710.730.14110
Biosynthesis of unsaturated fatty acids3612.7710.730.14110
Pyrimidine metabolism3913.8410.760.12110
Steroid biosynthesis4214.9010.790.11110
Purine metabolism6523.0710.910.04110
Publisher’s Note: MDPI stays neutral with regard to jurisdictional claims in published maps and institutional affiliations.

