Article

Erythromycin Treatment of Brassica campestris Seedlings Impacts the Photosynthetic and Protein Synthesis Pathways

1
Division of Applied Life Science (BK21four), Gyeongsang National University, Jinju-daero 501, Jinju 52665, Korea
2
Center for Research Facilities, Gyeongsang National University, Jinju-daero 501, Jinju 52665, Korea
3
Institute of Agriculture & Life Science, Gyeongsang National University, Jinju-daero 501, Jinju 52665, Korea
*
Authors to whom correspondence should be addressed.
These authors contributed equally in this study.
Life 2020, 10(12), 311; https://doi.org/10.3390/life10120311
Submission received: 26 October 2020 / Revised: 20 November 2020 / Accepted: 24 November 2020 / Published: 26 November 2020
(This article belongs to the Special Issue Plant Proteomics)

Abstract

:
Erythromycin (Ery) is a commonly used veterinary drug that prevents infections and promotes the growth of farm animals. Ery is often detected in agricultural fields due to the effects of manure application in the ecosystem. However, there is a lack of information on Ery toxicity in crops. In this study, we performed a comparative proteomic analysis to identify the molecular mechanisms of Ery toxicity during seedling growth based on our observation of a decrease in chlorophyll (Chl) contents using Brassica campestris. A total of 452 differentially abundant proteins (DAPs) were identified including a ribulose-1,5-bisphosphate carboxylase (RuBisCO). The proteomic analysis according to gene ontology (GO) classification revealed that many of these DAPs responding to Ery treatment functioned in a cellular process and a metabolic process. The molecular function analysis showed that DAPs classified within catalytic activity were predominantly changed by Ery, including metabolite interconversion enzyme and protein modifying enzyme. An analysis of functional pathways using MapMan revealed that many photosynthesis components were downregulated, whereas many protein biosynthesis components were upregulated. A good relationship was observed between protein and transcript abundance in a photosynthetic pathway, as determined by qPCR analysis. These combined results suggest that Ery affects plant physiological activity by downregulating protein abundance in the photosynthetic pathway.

1. Introduction

Antibiotics have been used as chemotherapeutic agents in human and veterinary medicine for many decades, and the use of three biologically active molecules has increased globally [1,2]. These substances affect agricultural environments due to human behaviors such as soil fertilization during composting of sludge or manure [3,4,5]. These contaminants accumulate in the soil and affect the soil ecosystem and microbial communities according to their antibiotic resistance [6,7].
Agricultural crops are exquisitely sensitive to their external environments; climate conditions and soil nutrients affect plant growth and development as well as crop yield and quality [8,9]. Brassica campestris, also known as Kimchi cabbage, is a nutritionally rich vegetable that is cultivated worldwide [10]. The early growth of cabbage seedlings is important for forming the leafy head, which affects crop quality [11]. Modern intensive and short-term monoculture requires high inputs of fertilizer and chemicals; thus, composting is a common method to improve soil nutrient contents [12].
Veterinary drugs such as antibiotics are used for disease treatment or prevention, and the use of antibiotics for animal husbandry is at least five times higher than that for humans [3]. Approximately 30–90% of active antibiotic intake is excreted due to low absorption rate in the body [13]. Excreted antibiotics remain in manure during the process of composting and are subsequently released into the agricultural field [3,4,5]. Antibiotics are an environmental factor affecting plant growth and development including woody plants such as Populus alba [14,15]; however, their effects on crop cultivation are largely unknown.
Plant leaves are the major organs of photosynthesis, and leaf color is significantly related to photosynthesis efficiency and influence in plant growth and development such as senescence [16]. Light-driven photosynthetic reactions in the thylakoid membrane include not only the photon-triggered electron transport chain in photosystem II (PSII), the cytochrome b6f complex, photosystem I (PSI) but also the free electron carriers such as plastoquinone and plastocyanin [17,18]. The two light reactions work sequentially, where electrons extracted from water in PSII are transferred through the plastoquinone pool (PQ), the cytochrome b6f complex (Cyt), and plastocyanin (PC) to PSI, and ultimately to ferredoxin and NADP+ to produce NADPH [18]. These electron transfer reactions are coupled with proton pumping into the thylakoid lumen, and the resulting proton gradient is utilized to generate adenosine triphosphate (ATP). ATP and NADPH fuel the Calvin cycle for CO2 fixation and assimilation [17].
d-ribulose-1,5-bisphosphate carboxylase/oxygenase (RuBisCO) catalyzes CO2 fixation in the photosynthetic carbon reduction (Calvin) cycle by combining CO2 with ribulose-1,5-bisphosphate (RuBP) to produce two 3-phosphoglycerate (3-PGA) [19]. RuBisCO is a ubiquitous protein located in the chloroplast stroma and is considered to be the most abundant plant protein by accounting for ~3% of the total leaf mass dry weight [20].
The functional components in the chloroplast are coordinately regulated in both the nucleus and chloroplast for protein expression and subunit assembly [21,22]. Some photosynthetic subunits encoded in the chloroplast genome are synthesized on chloroplastic ribosomes, and others encoded by nuclear genes are translated in the cytoplasm and imported into the chloroplast for assembly into functional complexes [18,21]. In addition, photosynthesis efficiency are regulated by environmental conditions such as light quality, CO2 level, temperature, and nutrients [23], thus suggesting that the activity of photosynthetic apparatus is affected by environmental factors, which influence gene expression and protein translation and modification [24].
Proteomic analysis and gene ontology (GO) classification are powerful tools for comprehensive examination of molecular mechanisms involved in specific biological processes, subcellular organelles, and functional protein pathways [25]. Proteins directly participate in plant physiological phenotypes. Protein function depends on molecular structure and subcellular localization (e.g., chloroplasts and mitochondria), because different cell organelles provide different physiological and biochemical environments [26].
Erythromycin (Ery) is one of the major antibiotic macrolides, which are large-spectrum antibiotics with bacteriostatic activity [27]. Ery inhibits protein synthesis by binding the 50S ribosomal subunit [28]. In this study, we investigated Ery toxicity on B. campestris seedlings by performing a comparative proteomic analysis. We identified numerous differentially abundant proteins (DAPs) in response to Ery, which were predominantly classified in the photosynthesis pathway and protein biosynthesis pathway. These results provide novel insights into the metabolic and physiological plant responses to Ery antibiotics and suggest that environmental antibiotics can adversely affect crop plant growth and development.

2. Materials and Methods

2.1. Erythromycin Treatment and Measurement of Plant Growth and Phyiological Parameters

Napa cabbage (Brassica campestris L. ssp. perkinensis Rupr) seeds were purchased from ASIA seed company (Seoul, Korea). To conduct the seedling growth assay, 36–50 seeds were placed on 1.2% agar media in the presence of Ery (TCI Development, Shanghai, China). Seeds were incubated vertically for 4–5 days in a growth chamber maintained at 22 °C under long-day photoperiod (16 h light/8 h dark) with 200 μEm−2S−1 light intensity using fluorescent lamps. Photographs of seedlings were captured, and primary root length was measured using ImageJ software (http://imagej.nih.gov/ij/download.html; Bethesda, MD, USA). Chlorophyll was extracted from detached cotyledons using methanol, and the contents of chlorophyll a (Chla) and chlorophyll b (Chlb) were calculated as follows: Chla = 16.72A665.2 − 9.16A652.4; Chlb = 34.09A665.2 − 15.28A652.4; A = absorbance [29].

2.2. Detection of Erythromycin Residue in Brassica campestris Seedlings

To detect Ery in B. campestris seedlings, shoots of 4-day-old seedlings grown in the presence of Ery (0, 5, and 10 mg/L) were harvested and washed three times with 50% methanol. To analyze accumulated Ery in planta, washed seedling tissues were freeze-dried, measured (dry weight), and milled using liquid nitrogen. Samples were prepared for liquid chromatography with tandem mass spectrometry (LC-MS/MS), as described Wang et al. [30].

2.3. Total Protein Extraction and One-Dimemnsional Gel Electrophoresis

For total protein extraction, harvested seedlings were ground into fine powder using liquid nitrogen, three volumes of ice-chilled protein extraction buffer [1 × PBS pH 7.4, 0.1% Triton X-100, protease inhibitor cocktail tablets (Complete Mini, Roche, Indianapolis, IN, USA)] were added, and the suspension was mixed well. The tubes were incubated in ice for 15 min and then centrifuged for 10 min at 4 °C. The supernatants (total protein extracts) were transferred to new tubes.
For one-dimensional SDS-PAGE, 50 μg of Napa cabbage (Brassica campestris subsp. napus var pekinensis MAKINO) total proteins were diluted with denaturing sample buffer (0.5 M Tris-HCl pH 6.8, 10% SDS, 20% glycerol, 1% bromophenol blue, 0.2% DTT) and heated at 95 °C for 5 min. Samples were subjected to SDS-PAGE, stained with Coomassie Brilliant R250 (Sigma-Aldrich, St. Louis, MO, USA), and then destained with water.

2.4. In-Gel Digestion

A one-dimensional SDS-PAGE lane containing all protein bands was excised from top to bottom using a razor blade, and excised gel slices were washed twice with 100 µL of distilled water for 15 min at room temperature. Excised gel bands were destained using acetonitrile. The gel slices were dried completely in a vacuum, and then alkylated by incubating with 55 mM iodoacetamide/0.1 M ammonium bicarbonate for 30 min at room temperature in the dark. After alkylation, the gel slices were dried again, and then the dried gel slices were swollen in digestion buffer (25 mM ammonium bicarbonate, 0.1% n-octyl glucoside, and 50 ng/mL of sequencing grade trypsin (Promega, Madison, MI, USA)) for rehydration. Peptides were extracted from the gel slices using 66% acetonitrile, 33% water, 0.1% trifluoroacetic acid (TFA). Extracted peptides were dried with a speedvac (Hanil, Korea), and stored at −80 °C before analysis [31].

2.5. LC-MS/MS Analysis

The dried peptides were redissolved in 20 µL of 5% formic acid and analyzed using on-line nanoflow LC-MS/MS. All nano-LC-MS/MS experiments were performed using an Ekisigent nanoLC415 system (EKsigent, Dublin, OH, USA) connected to Triple TOF 6600 mass spectrometry system (SCIEX, Redwood City, CA, USA) with a nanoelectron-spray ion source (New Objective, Woburn, MA, USA).

2.6. Data Analysis

After MS/MS analysis, data files were processed using UniProt and ProteinPilot 5.0.1 (SCIEX, Redwood City, CA, USA). Based on the combined MS and MS/MS spectra, proteins were successfully identified at ≥95% confidence interval using their scores in the MASCOT v 2.6 search engine (Matrix Science Ltd., London, UK) and the following search parameters: plant database (Brassica campestris subsp. napus var pekinensis MAKINO database), trypsin as the digestion enzyme, single missed cleavage sites, fixed carbamidomethyl (C) modifications and methionine oxidation, ±0.1 Da precursor ion tolerance, and ±0.1 Da MS/MS fragment ion tolerance. The database search results were manually curated to yield the protein identifications using 1% global false discovery rate (FDR) determined by the FDR tool in ProteinPilot software. Scaffold v 4.11.0 (Proteome Software Inc., Portland, OR, USA) was used to validate MS/MS-based peptide and protein identifications. The identified proteins were searched, and information on functional grouping was obtained using PANTHER (http://pantherdb.org) and STRING (http://string-db.org) databases for gene ontology (GO) analysis. MapMan software (v 3.6.0RC1; http://mapman.gabipd.org) was used for the functional pathway analysis [32]. A workflow chart of the proteomic analysis is presented in Figure S3.

2.7. RNA Extraction and qRT-PCR

Total RNA was extracted from B. campestris seedlings using TRIzol reagent (Thermo Fisher Scientific, Waltham, MA, USA) according to the manufacturer’s instructions, treated with DNase I (Thermo Fisher Sci, Waltham, MA, USA), and RNA was purified using a Riboclear Column (GeneAll, Seoul, Korea). First-strand cDNA was synthesized from 2 μg of total RNA using a cDNA synthesis kit (Thermo Fisher Scientific). Then, qRT-PCR was performed on a CFX Connect Real-Time PCR Detection System (Bio-Rad, Hercules, CA, USA) using the cDNA template, gene-specific primers (Supplementary Table S1), and AccuPower 2× GreenStar qPCR Master Mix (Bioneer, Daejeon, Korea). EF1a or Act7 was used as the internal reference gene for data normalization. Average gene expression levels were determined using the comparative Ct method (2−ΔΔCt).

3. Results

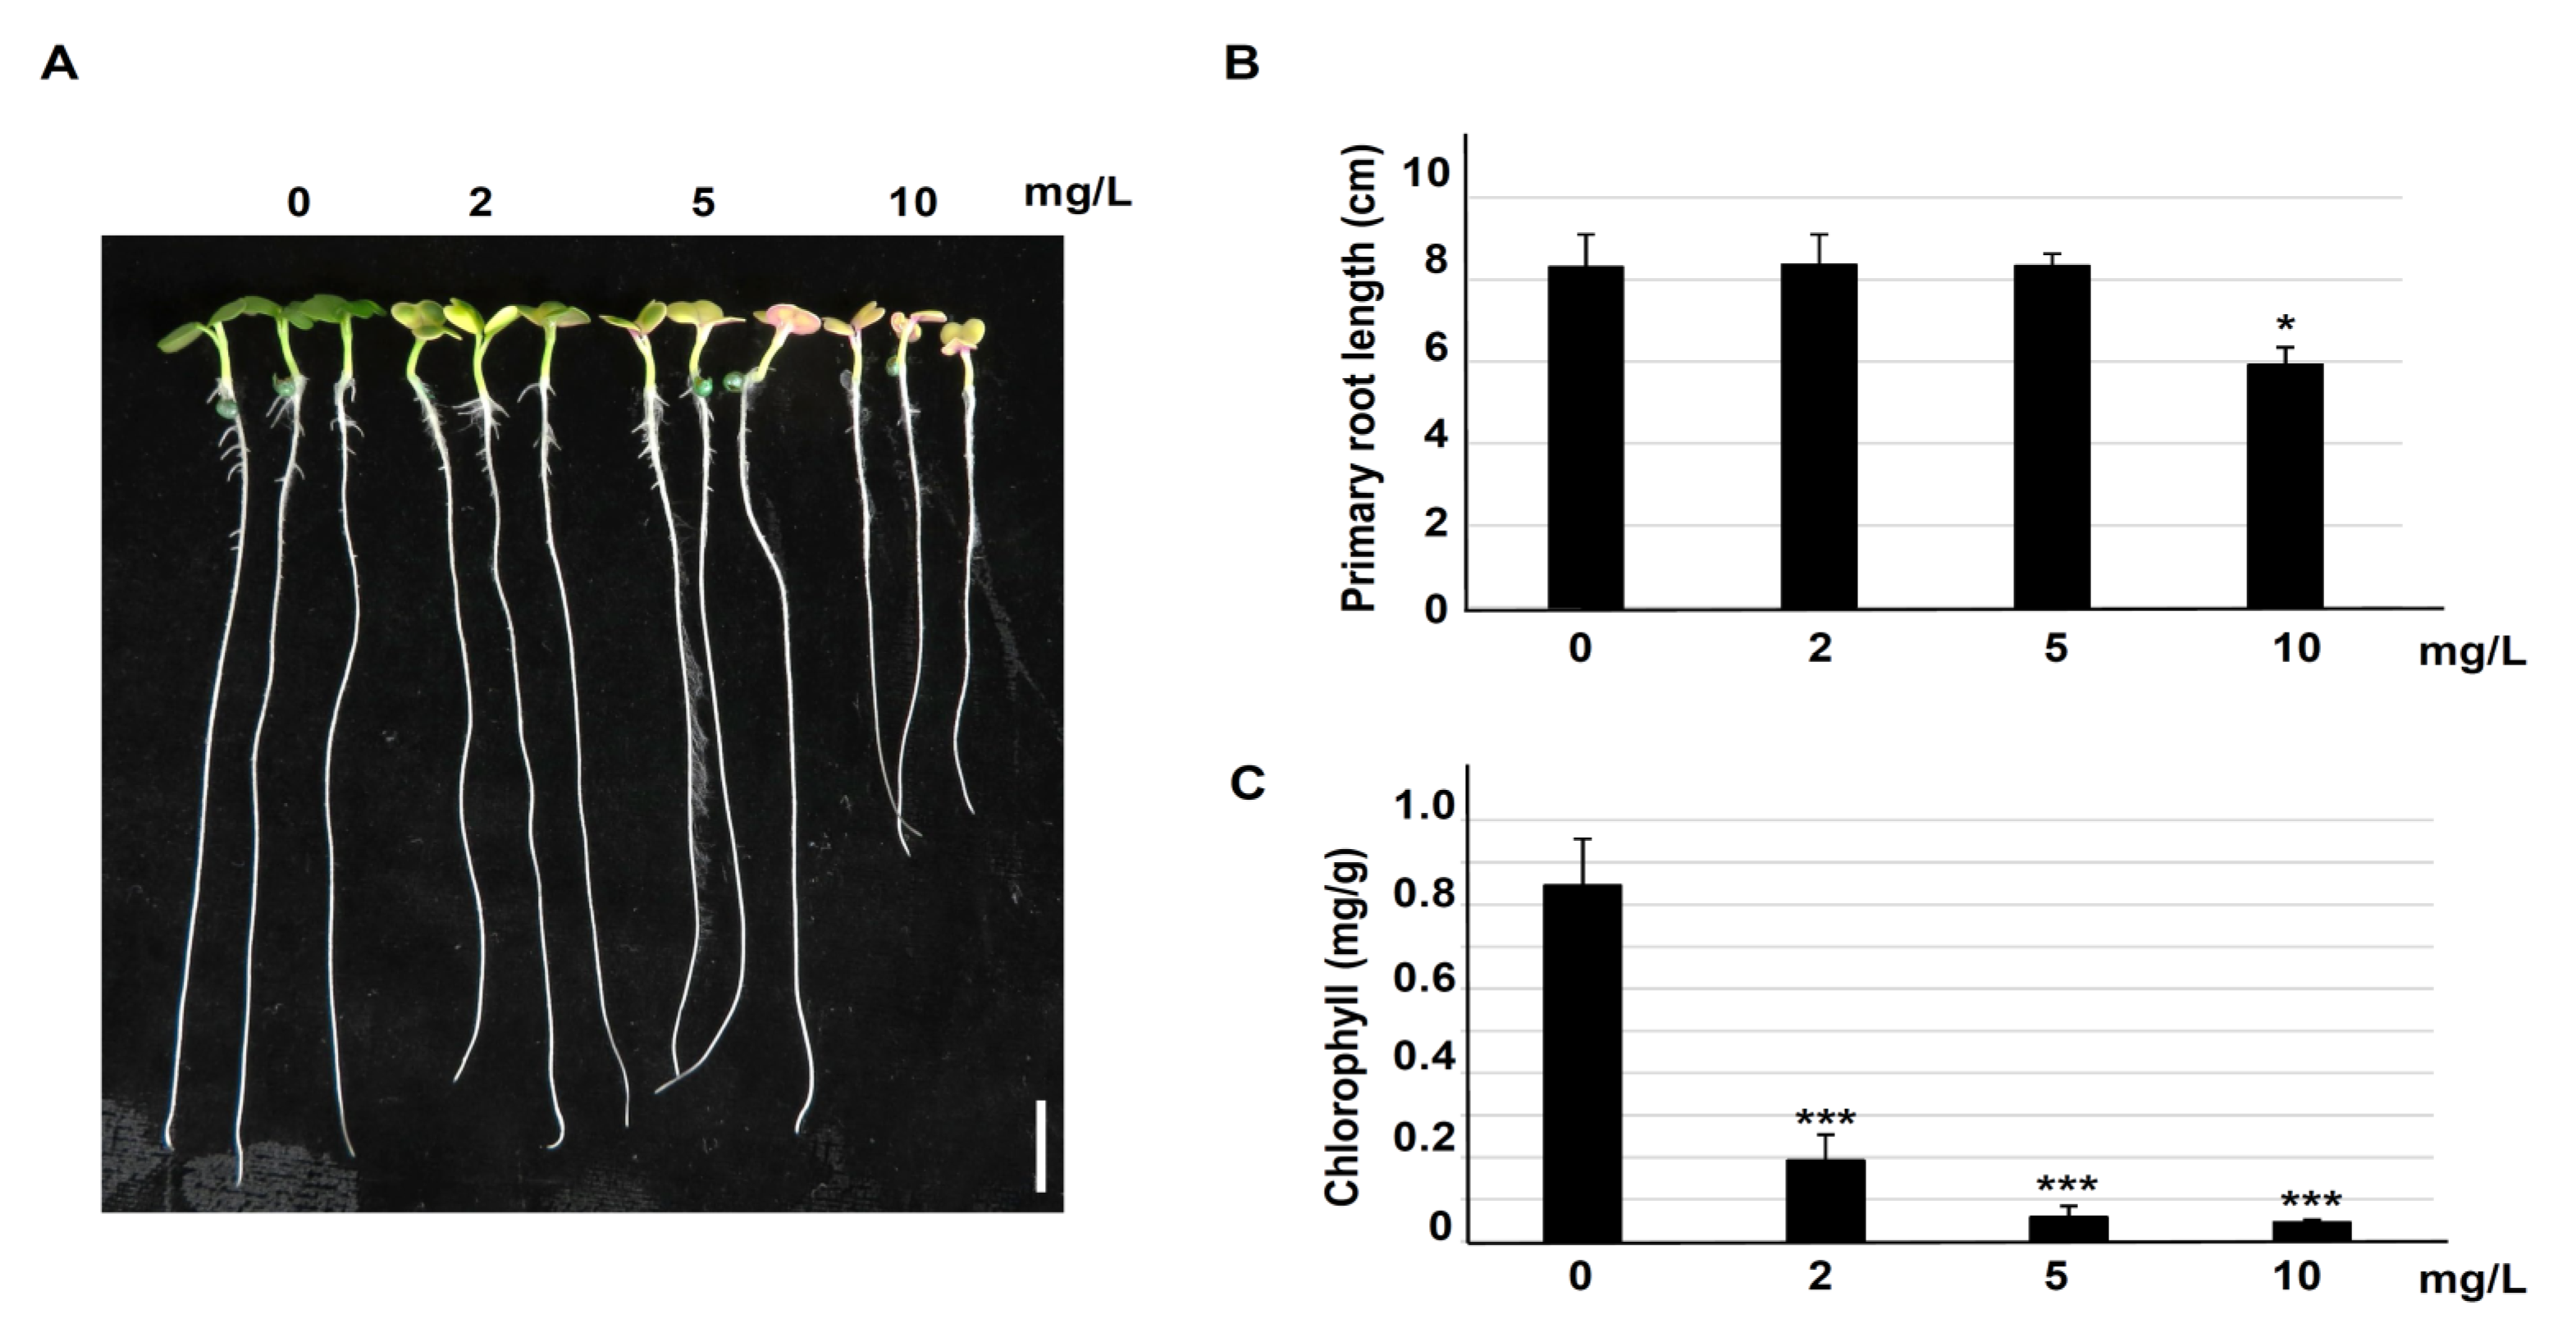
3.1. Erythromycin Inhibits Brassia campestris Seedling Growth

The effect of Ery on crop physiology, growth, and development was investigated in B. campestris seedlings (Figure 1). Seeds were placed on 1.2% agar media containing the indicated Ery concentration (0, 2, 5, and 10 mg/L), and the primary root lengths and chlorophyll contents were examined in cotyledons. High Ery concentration (10 mg/L) reduced primary root growth, whereas primary root growth was similar under low Ery concentrations (2 and 5 mg/L) and control conditions (0 mg/L Ery) (Figure 1B).
Primary root growth can be affected by radical emergence during seed germination. Therefore, we examined radicle emergence in the absence and presence of Ery (10 mg/L). Seed coat rupture was examined every 6 h after imbibition until radicle emergence. There was no significant difference between 0 and 10 mg/L Ery until 24 h after imbibition (Figure S1), suggesting that Ery does not affect seed germination. Chlorophyll contents in cotyledons were dramatically reduced by Ery (Figure 1C); specifically, both chlorophyll a and chlorophyll b were reduced as the total chlorophyll content was reduced (Figure S2). These combined results indicated that Ery inhibited chlorophyll accumulation, suggesting that Ery may affect photosynthetic metabolic process.

3.2. Erythromycin Accumulation in Vegetative Tissue

Ery influences leafy tissue development (Figure 1). We hypothesized that Ery was absorbed through the root and subsequently translocated and accumulated in leaf tissue. To investigate Ery levels in shoots, we collected cotyledons from seedlings grown on agar media in the absence (0 mg/L) and presence of Ery (5 and 10 mg/L) for 4 days and examined Ery levels using LC-MS/MS. Although Ery was applied once by adding to the agar medium, Ery absorption through roots may last until harvesting. The Ery residual levels in seedling aerial parts in the presence of 5 and 10 mg/L Ery were 18.3 ± 1.89 and 34.6 ± 0.99 mg/kg (dried weight), respectively. Three times replicated experiments were exhibited similar value. By contrast, Ery was not detected in seedlings grown in the absence of Ery (0 mg/L). These results revealed that Ery was absorbed from contaminated medium, transported from root to shoot, and accumulated in the shoots. These results suggest that Ery residues accumulate in edible plant tissues and may influence human health.

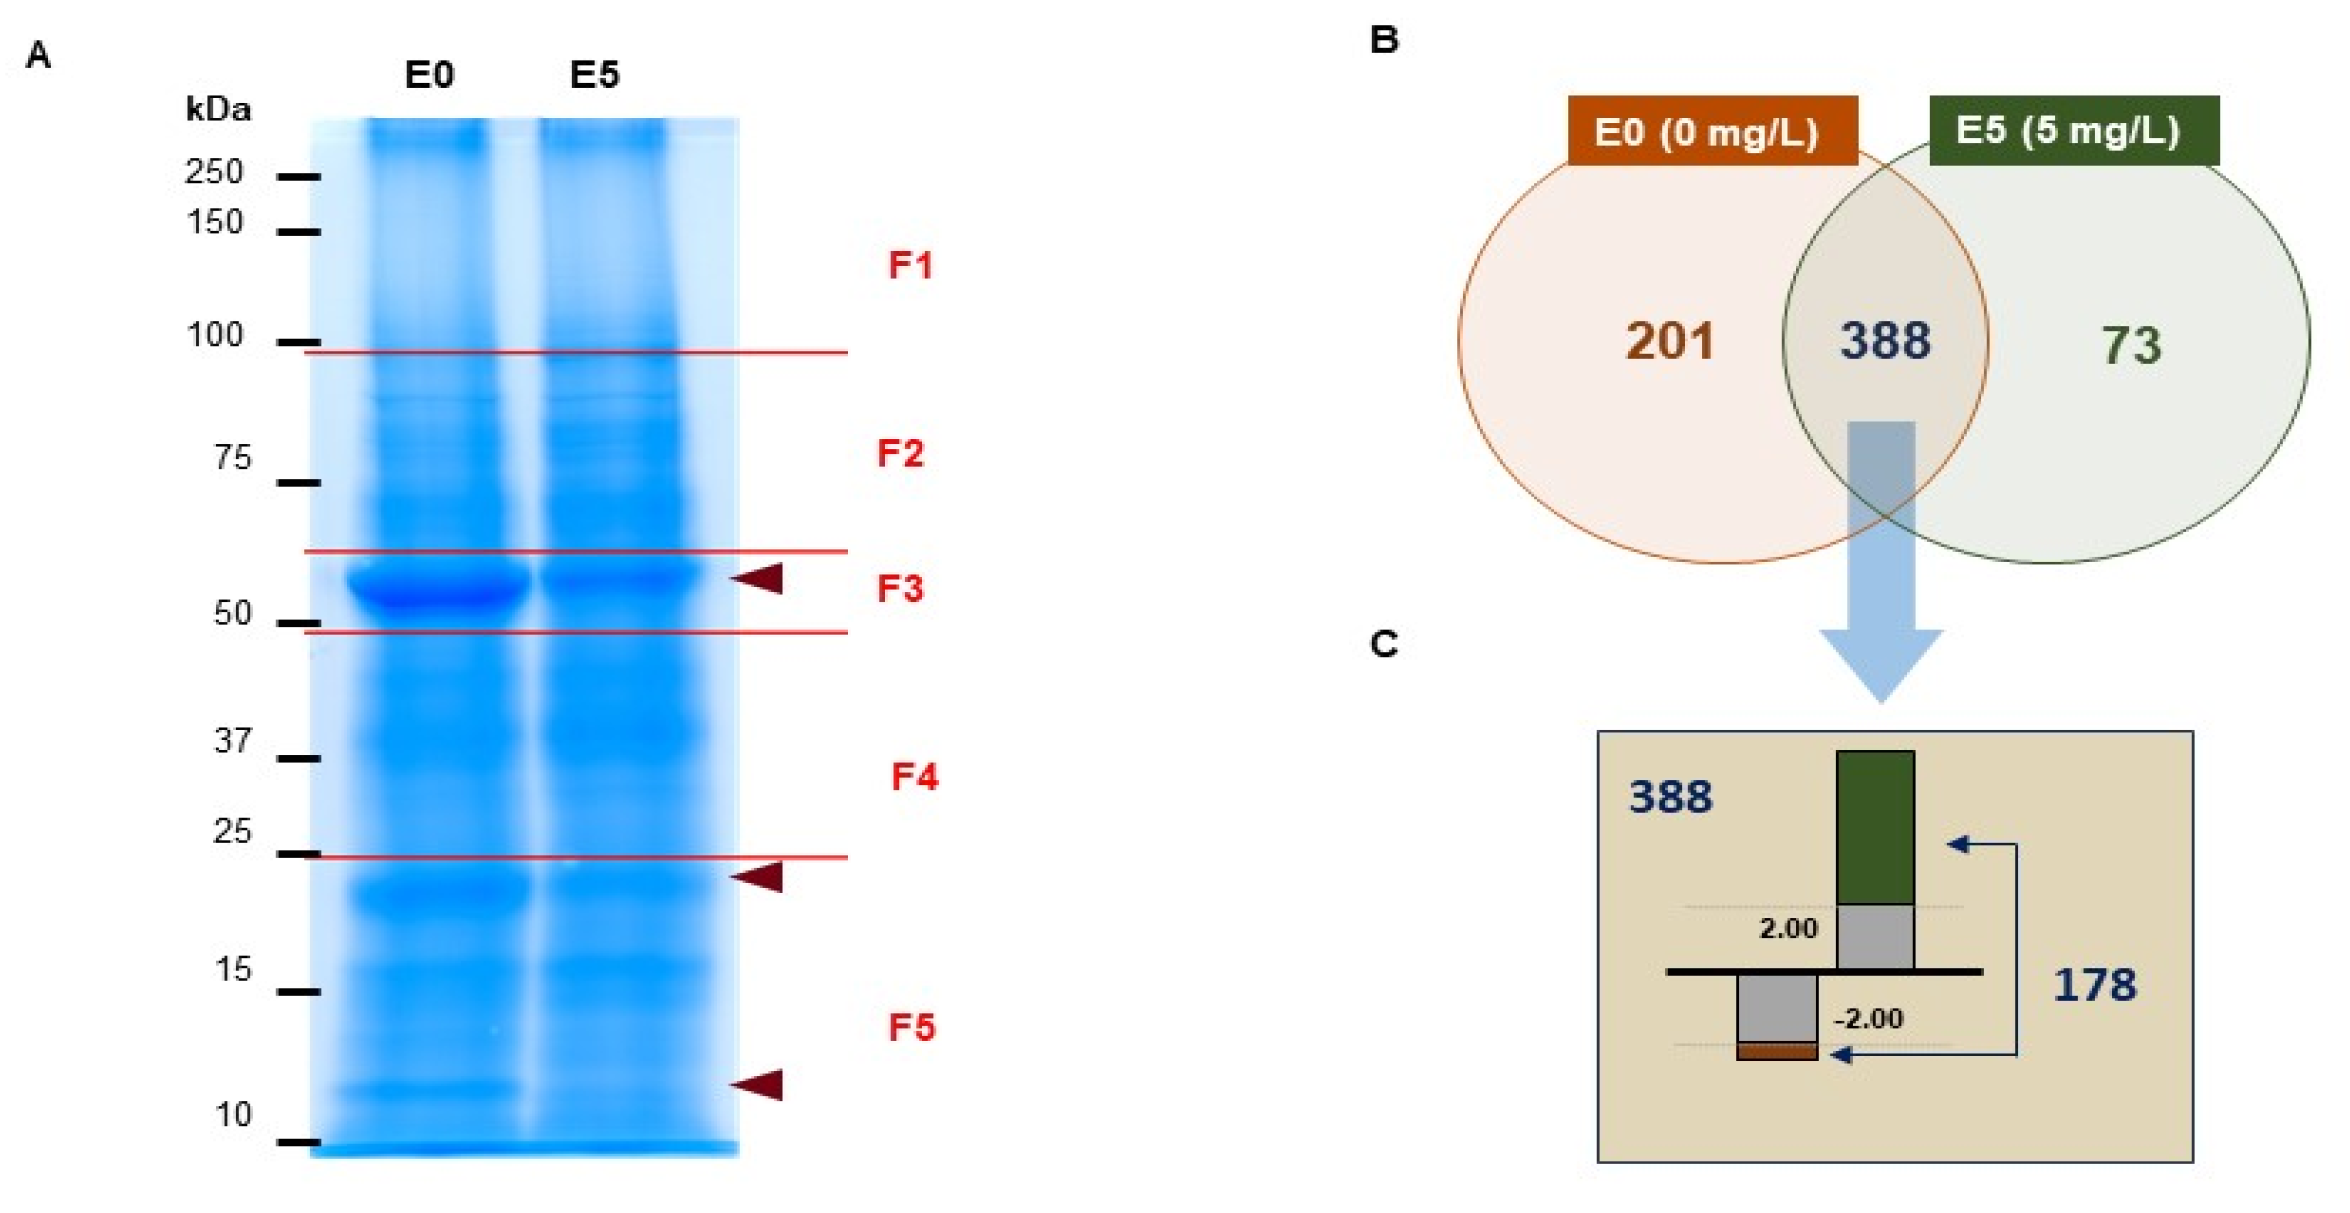
3.3. Differential Proteomic Analysis of Brassica campestris Seedlings

To better understand the effects of Ery during seedling growth, we performed differentially expressed proteomic analysis using B. campestris seedlings grown in the absence (0 mg/L, E0) or presence (5 mg/L, E5) of Ery. First, we separated proteins in a size-dependent manner by subjecting them to 12% SDS-PAGE, observed significantly changed protein abundance between E0 and E5 around 50, 20, and 10 kDa (Figure 2A, arrowhead), and confirmed with four times other biological replicates. As shown by the reduction in chlorophyll contents (Figure 1), those protein bands are predicted as RuBisCO large subunits (rbcL) and RuBisCO small subunits (rbcS) [33]. The most abundant protein in B. campestris seedling leaf was RuBisCO, which accounted for 11.56% of total leaf protein [34]. Next, we divided five different fractions (F1 to F5, Figure 2A) and analyzed embedded proteins using LC-MS/MS. In-gel digestion with trypsin and cleanup was performed for loading onto LC-MS/MS and analyzed peptides were quantified and profiled for protein identification (Figure S3). A total of 662 proteins were identified in both E0 and E5 as shown in a Venn diagram analysis (Figure 2B); 73 proteins were specifically expressed in E5 compared to E0, and 201 proteins were not detected in E5. Although 388 proteins were commonly detected in both E0 and E5, >2-fold difference was quantified between E0 and E5 for 178 proteins (FDR < 0.01), with 17 downregulated proteins and 161 upregulated proteins (Figure 2C and Table S2). These results indicated that Ery modulates the levels of many B. campestris seedling proteins.

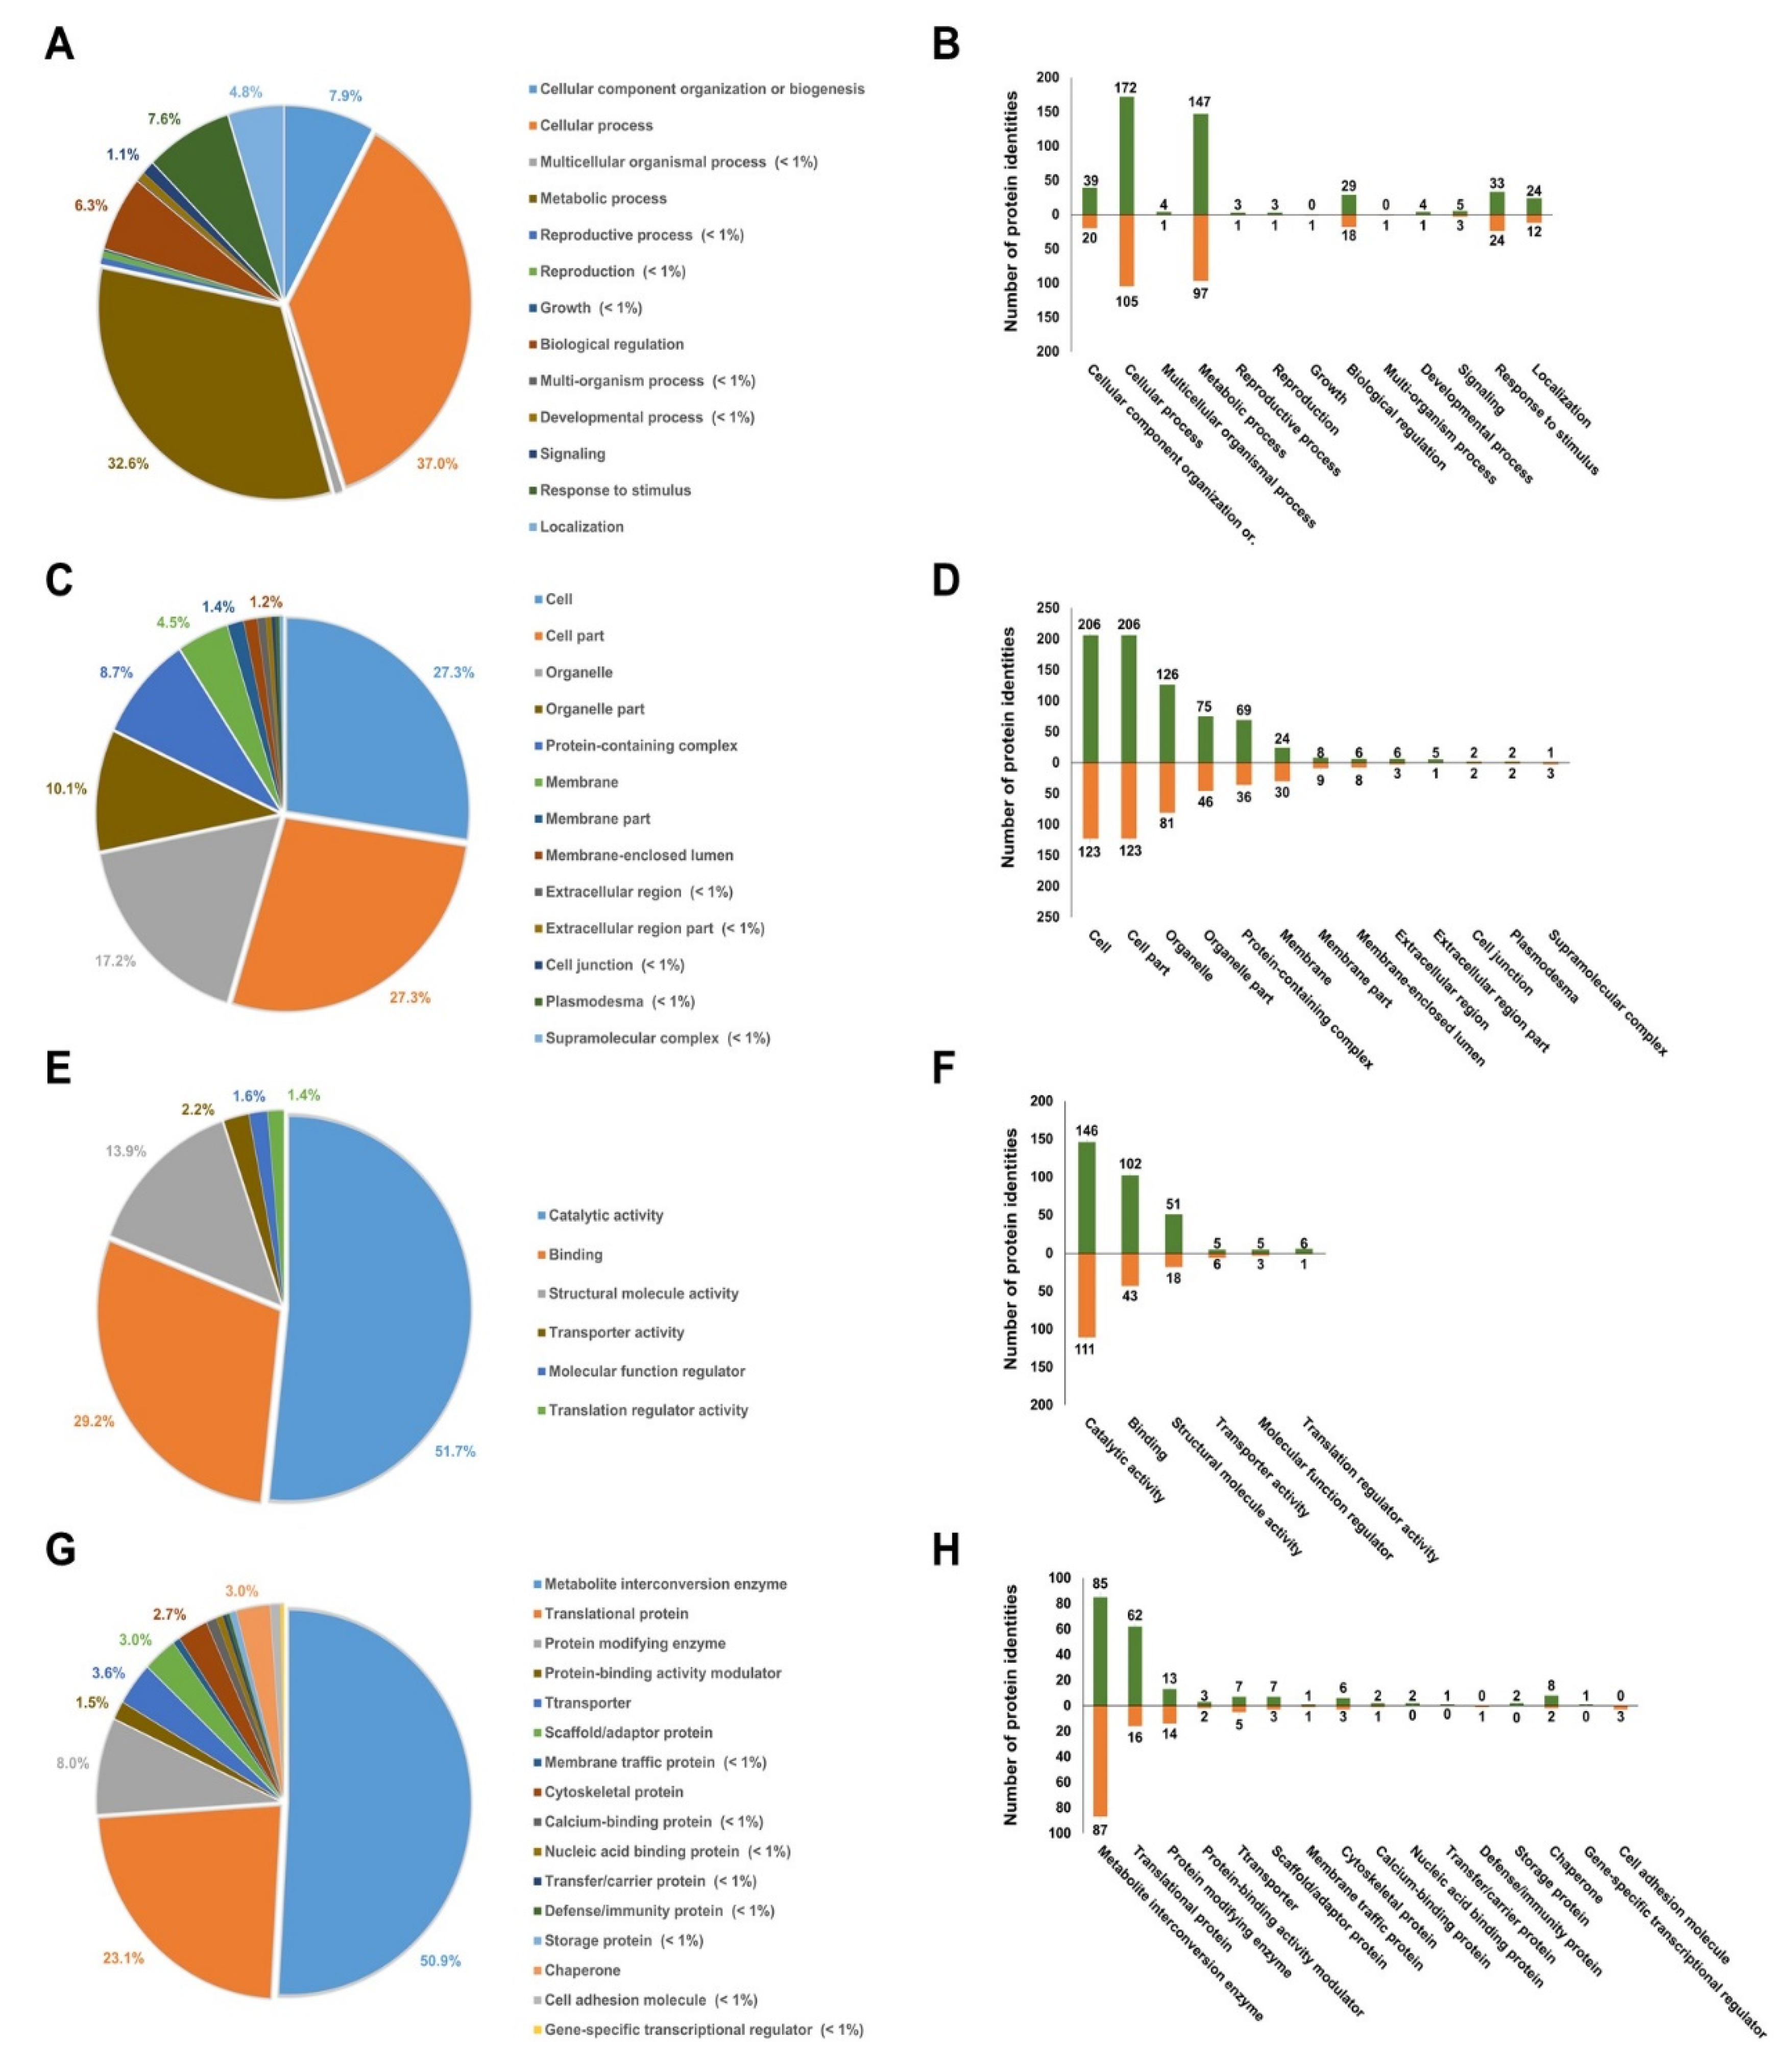
3.4. Gene Ontology Analysis of Differentially Expressed Proteins

To deduce functional biological processes, the differentially abundant proteins (DAPs) in E5 were analyzed using PANTHER (http://pantherdb.org) and STRING (http://string-db.org) databases and categorized using gene ontology (GO) analysis (Figure S3). GO analysis identified four categories of DAPs: biological process, molecular function, cellular component, and protein class (Figure 3). In the biological process analysis of DAPs, 37% cellular process and 33% metabolic process were dominant among shown other GO biological categories including cellular component organization or biogenesis, localization, biological regulation, response to stimulus, reproductive process, reproduction, multiorganism process, signaling, developmental process, multicellular organismal process, and growth (Figure 3A,B). Proteins involved in reproductive process, signaling, or growth were rarely changed in response to Ery, suggesting that Ery affects energy generation or consumption for plant survival rather than plant reproduction or development. Although most DAPs in the cellular component category were cytosolic proteins with 54% cell and cell part, the second major portion was 27% organelle and organelle parts (Figure 3C,D). The remaining 20% portion was involved in membrane, membrane parts, membrane-enclosed lumen, protein-containing complex, extracellular region, supramolecular complex, cell junction, and plasmodesma. Proteins in the molecular functional level were categorized as follows: 52% catalytic activity, 29% binding, 14% structural molecule activity, and 5% others including transporter and regulator function (Figure 3E). Comparison of E0 and E5 showed that more proteins displayed increased levels than decreased levels (Figure 3F). More specifically, we further classified the protein classes (Figure 3G,H). As expected from biological process and molecular function analysis, 51% metabolic interconversion enzyme and 23% translational proteins represent the major proportions of these classes, with 28% protein modifying enzyme, transporter, scaffold/adaptor protein, chaperone, cell adhesion molecule, protein-binding activity modulator, transfer/carrier protein, nucleic acid binding protein, and cytoskeletal protein. These combined analyses suggested that Ery induced changes in the expression levels of many proteins that may be involved in the function of metabolic enzymes in organelles.

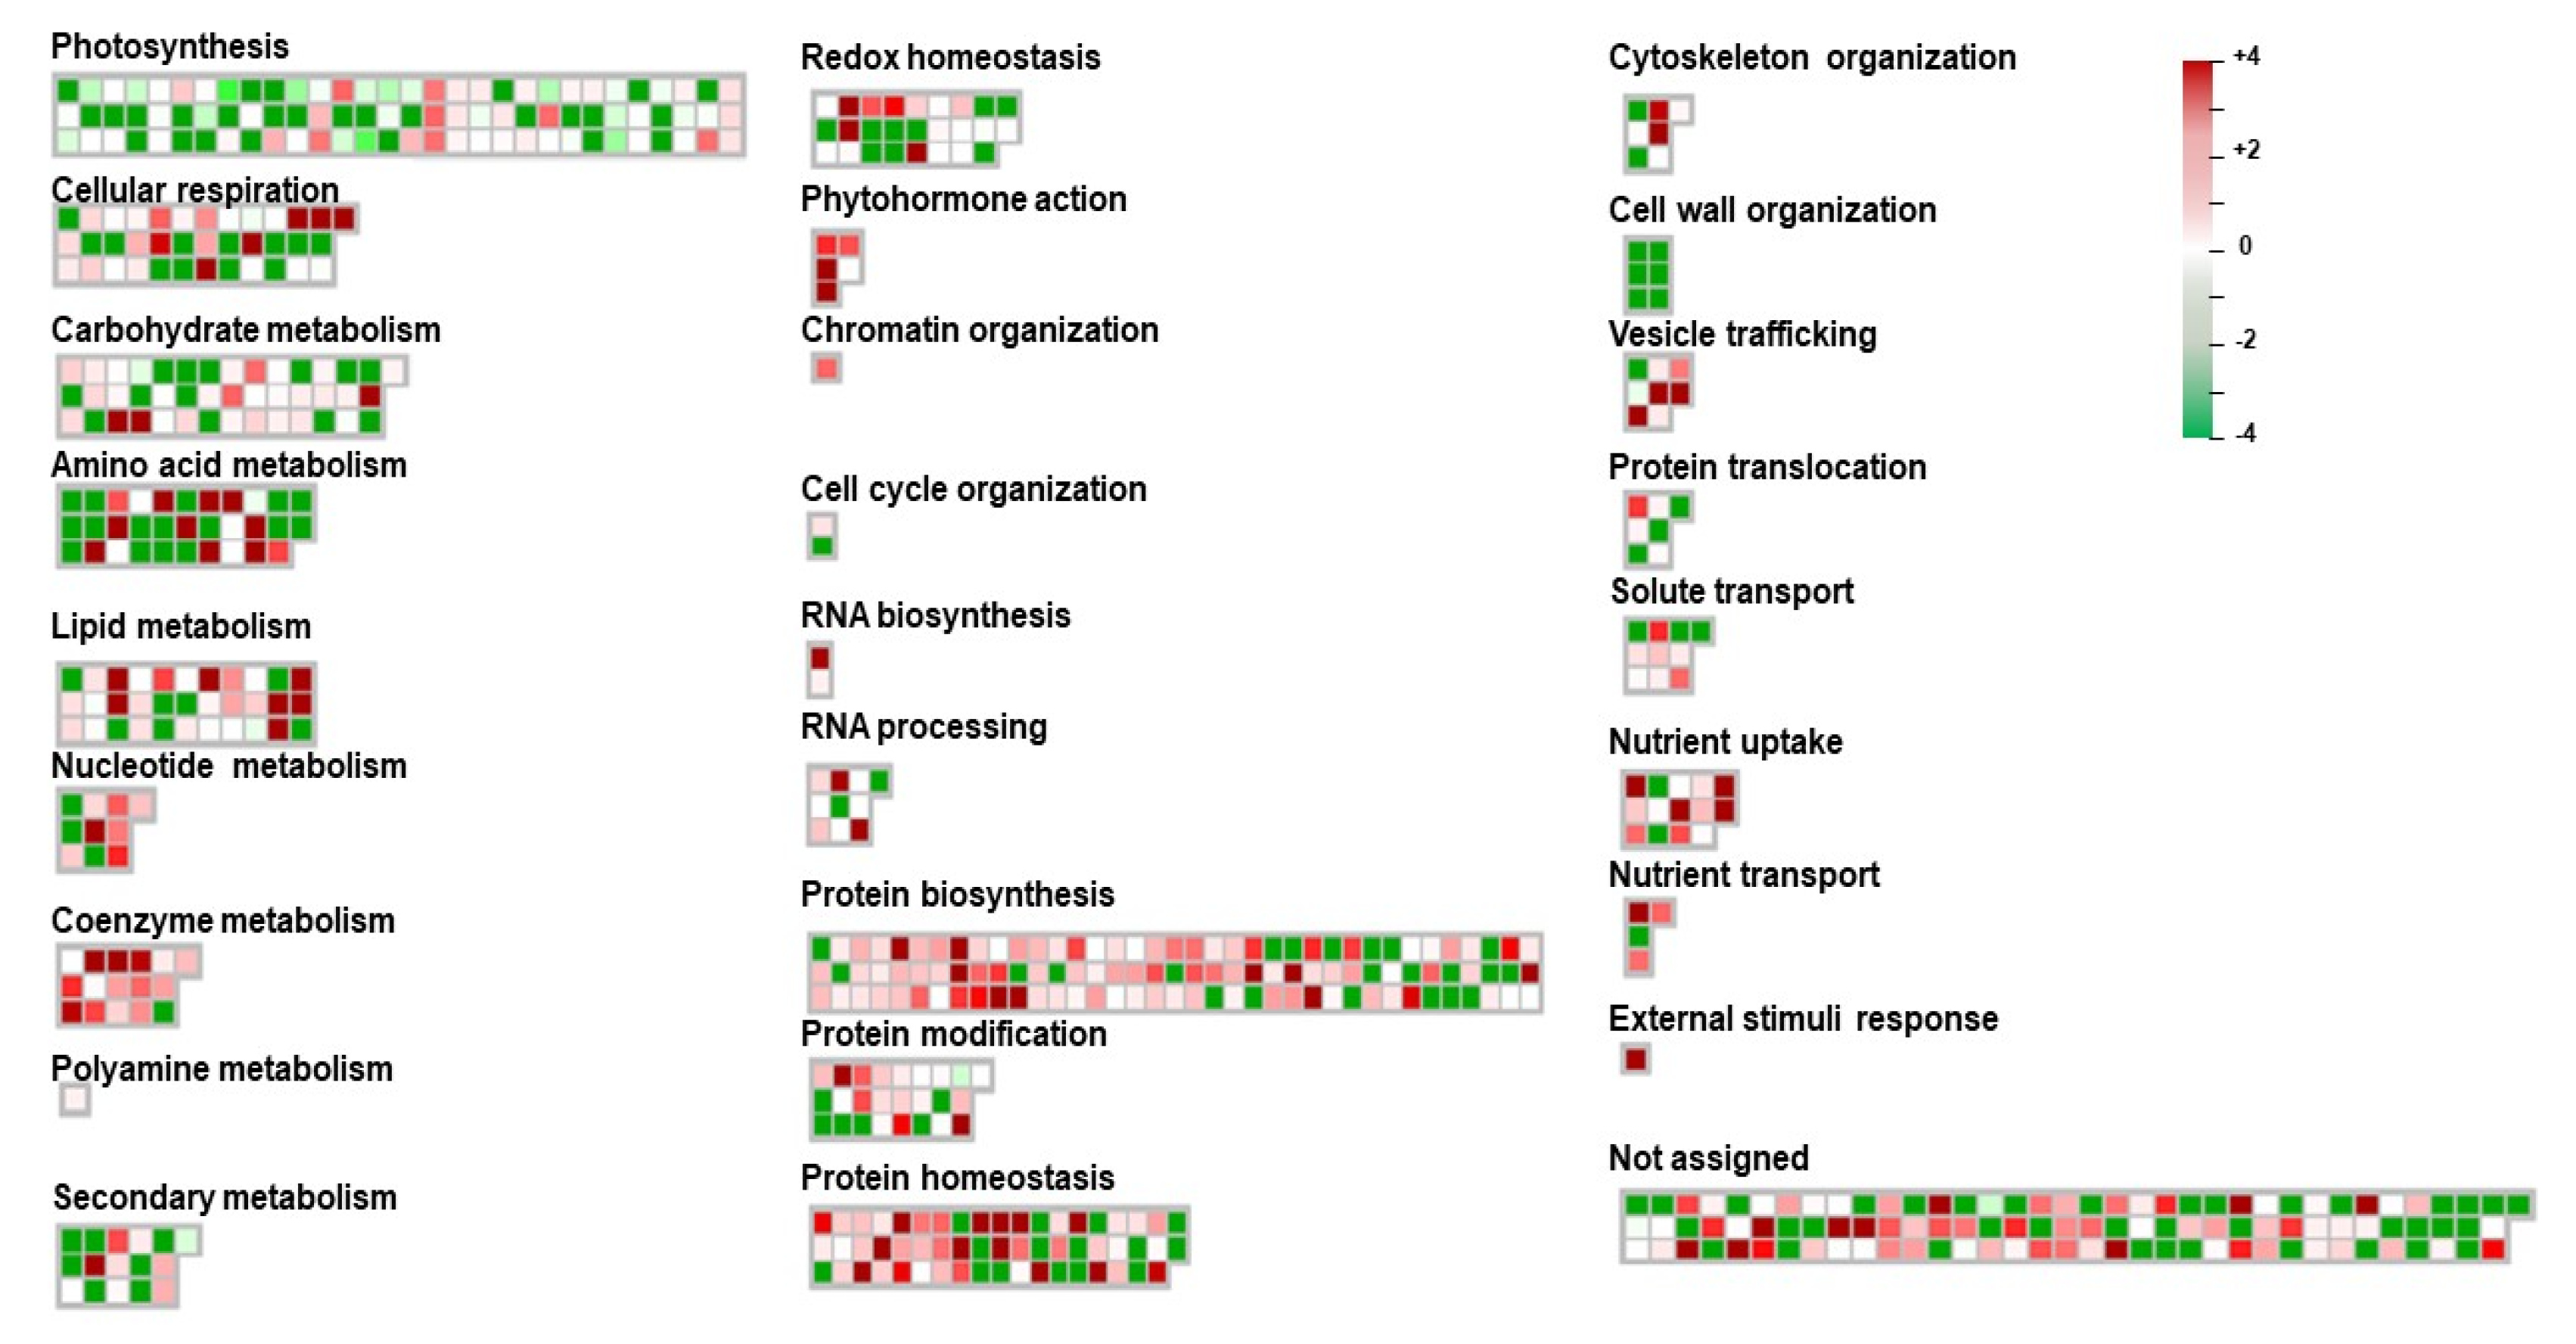
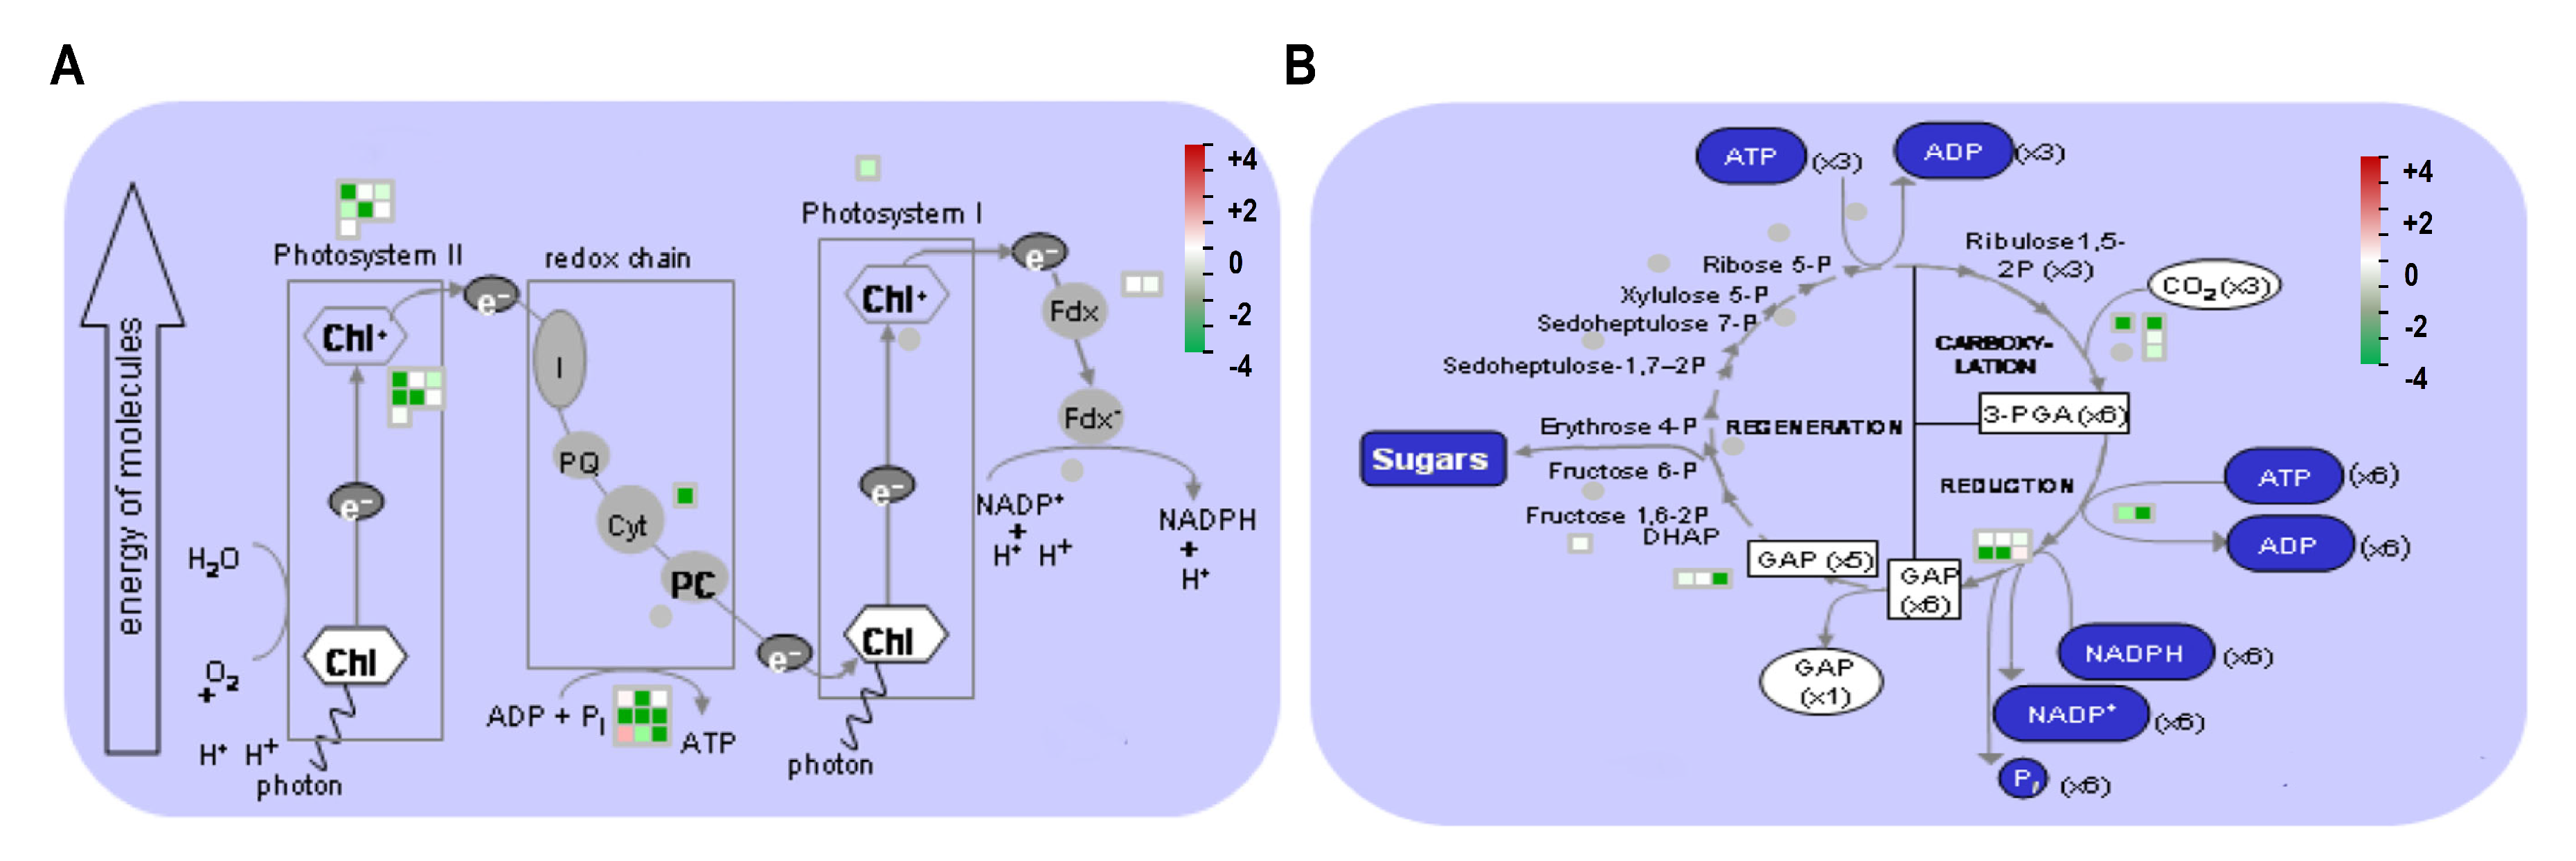
3.5. MapMan Pathway Analysis of Differentially Expressed Proteins

Our proteomics analysis revealed that Ery modulated the levels of a number of proteins involved in central metabolism. To further identify Ery-induced changes in the functional metabolic pathway during plant growth, we mapped quantified DEP values to MapMan pathways (MapMan ontology version 3.6.0), which refines plant-sourced protein classification and annotation frameworks [32]. Functional pathways contain 18.3% photosynthesis and photorespiration (66 DAPs), 19.4% proteins synthesis (70 DAPs), 21.2% metabolic pathway including carbohydrate metabolism (80 DAPs), 9.4% protein homeostasis (34 DAPs), 3.6% redox homeostasis (13 DAPs), 5% transport (18 DAPs), 2.5% cell structure (9 DAPs), and 19.4% not assigned (70 DAPs) (Figure S4). Although we identified 452 DAPs, 360 DAPs were applied to investigate the protein abundance of individual DAP based on molecular functional category, since 92 DAPs were difficult to use gene accession number, which is required to analyze transcript abundance (Table S2). Then, we analyzed the change in each DAP in the molecular functional pathway to understand the modulation of indicated pathways. Most DAPs in each pathway were distributed with similar numbers of upregulated and downregulated, except for photosynthesis and protein biosynthesis. The photosynthetic pathway and protein biosynthesis pathway had much higher numbers of downregulated DAPs and upregulated DAPs, respectively (Figure S4). The quantified values of characterized proteins (Table S2) were represented in MapMan pathway, and the relative protein abundances were compared in log2 range (Figure 4). As expected, most proteins characterized in the photosynthetic pathway displayed decreased expression levels (color gradient green). By contrast, many protein functions in protein biosynthesis, protein modification, and protein homeostasis displayed increased expression levels (color gradient red) (Figure 4). The list of significantly expressed DAPs in these MapMan pathways are presented in Table 1 for photosynthesis and Table 2 for protein synthesis. Given that all ribosomal proteins are estimated as approximately 8.47% of total lead proteins [34], many ribosomal proteins were identified in Table 2. For the protein annotation in Table 1 and Table 2, we also used Arabidopsis AGI locus as an identifier (http://plants.ensembl.org/Brassica_rapa/; http://brassicadb.org/) due to the lack of Brassica gene accessions.

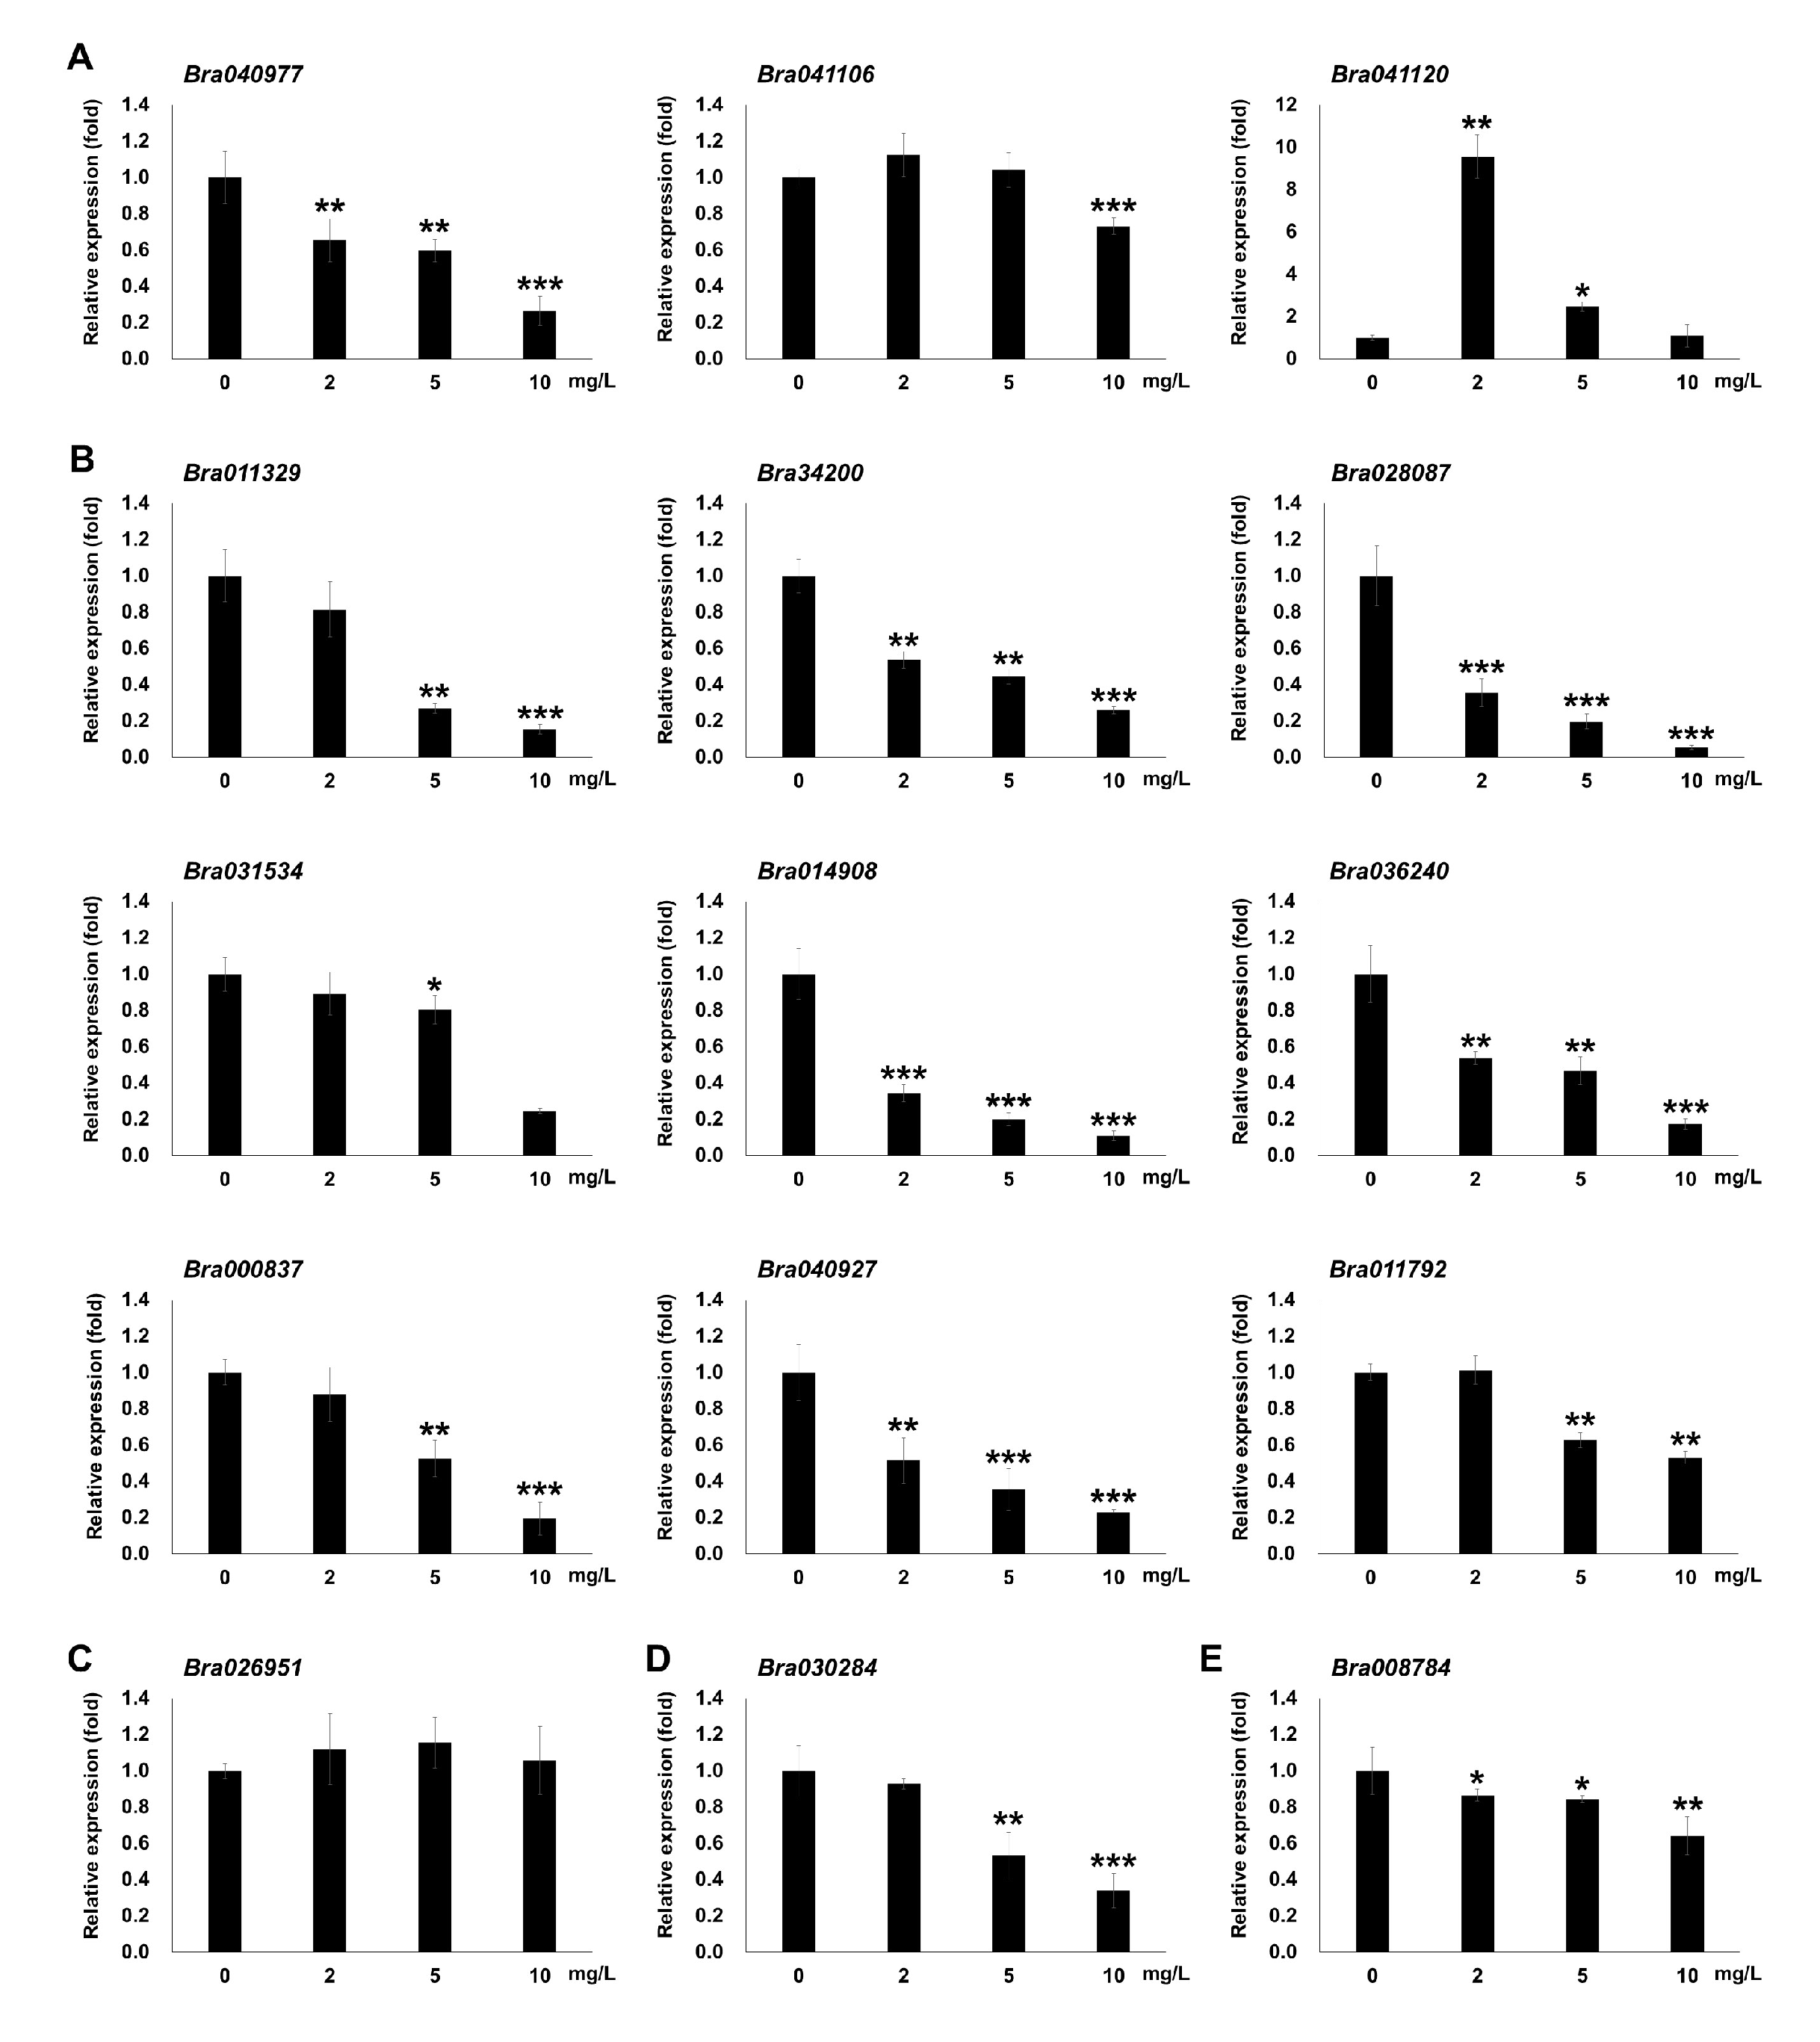
3.6. DAPs in Photosynthesis and qRT-PCR Analysis

Given that Ery downregulated protein function in photosynthesis, we investigated the role of DAPs in the photosynthesis pathway and/or chloroplast function using MapMan (Figure 5). As shown in Table 1, we found that most DAPs (E5) in the photosynthesis pathway had lower quantitative values than expressed proteins in the control (E0) (color gradient green), indicating that Ery reduced the expression levels of protein functions in photosynthesis, including those corresponding to PSII in the light reaction (Figure 5A) and RuBisCO in the Calvin cycle (Figure 5B). This result suggested that Ery reduced photosynthetic activities of these DAPs.
To further investigate the relationship between DAPs and transcription, we performed qRT-PCR. Although the DAPs were identified from seedlings treated with 5 mg/L Ery (E5), the transcript levels of corresponding proteins were evaluated in seedlings grown on 0, 2, 5, and 10 mg/L Ery (Figure 6). The abundance patterns of targeted Brassica genes encoding functional proteins in a photosynthetic pathway (Table S2) were merged with our results in Table 1 and Figure 4 and Figure 6. Photosynthetic-related genes included Bra040977, Bra041106, Bra041120, Bra011329, Bra034200, Bra028087, Bra031534, Bra014908, Bra036240, Bra000837, Bra040927, Bra011792, and Bra026951. Some of these genes are encoded in the chloroplastic genome and play roles in the chloroplast according to Arabidopsis identifier information, such as Bra040977, Bra041106, and Bra041120 (Figure 6A). This result indicated that Ery can influence chloroplastic gene expression and chloroplastic protein abundance. Most tested genes in the photosynthetic pathway were downregulated and their gene expression was significantly reduced (Student’s t-test; * p < 0.05, ** p < 0.01, *** p < 0.001) (Figure 6B). Bra026951, which was annotated as an upregulated DAP, was not induced significantly at the transcriptional level, whereas Bra041120 was highly upregulated at low Ery concentration (2 mg/L) and dramatically declined at high Ery concentrations (5 and 10 mg/L) (Figure 6A,C). These results suggested that some identified DAP genes were regulated within different temporal points for gene expression or protein expression/stability depending on Ery concentration. We also observed similar consistent results in different pathways; for example, Bra030284 encoded an RNA-binding protein and was categorized in both protein biosynthesis pathway and RNA processing. Bra008784 serves a role as a phosphate solute carrier at the mitochondrial membrane in an unassigned group (Figure 6D,E). These results demonstrate that our proteomic and transcript analyses results are consistent.

4. Discussion

Environmental residual chemicals such as heavy metals and antimicrobial drugs originating from use in humans and animals affect plant growth and development. These chemicals can accumulate in crop plants, affect food chains, and impact human health [35]. Erythromycin antibiotics have been detected in agricultural fields used for cultivating crops [36,37]. However, it is not well understood how Ery affects crop physiology and/or productivity. This study investigated the effects of Ery in crop growth and development using B. campestris seedlings. Although the chemical structure of Ery is not easily absorbed and translocated through cellular membranes [38], Ery accumulation and translocation was reported in hydroponically grown poplar plants irrigated with a recirculating Hoagland‘s nutrient solution containing ~0.01 mg/L Ery [15]. We confirmed Ery accumulation and translocation from root to shoot in B. campestris. Poplar plants grown on 1 mg/L Ery exhibited similar health as those grown on 0 mg/L Ery [15], consistent with our observed phenotypes of B. campestris grown on 0 and 5 mg/L Ery (Figure 1). These results indicated that low Ery concentrations do not alter morphological phenotypes and suggested that it would be difficult to identify potential toxicity from low Ery concentrations during crop cultivation. By contrast, we observed a severe chlorophyll-deficient phenotype in seedlings grown on higher concentrations than 2 mg/L Ery (Figure 1 and Figure S1) [39], and growth defects at 10 mg/L Ery, suggesting that higher Ery concentrations affect plant growth and development. These combined results suggest that Ery levels detected in the environment (<0.1 mg/L, [36,37]) may not induce morphological and physiological effects and reduced chlorophyll contents due to Ery absorption may not be distinguishable from senescent leaf development during crop cultivation.
Higher Ery concentrations induced physiological differences in B. campestris seedlings such as chlorophyll-deficient phenotype (Figure 1 and Figure S1). We identified many Ery-induced differentially abundant proteins (DAPs) (Table S2). These DAPs primarily function in cellular processes and are predicted to have catalytic activity in metabolite interconversion enzyme and protein modifying enzyme (Figure 3). Consistently, studies using a fish report that Ery affects catalytic activities [40,41]. Ery inhibits acetylcholinesterase (AChE) and glutathione S-transferase (GST) activity but enhances superoxide dismutase (SOD) and catalase (CAT) activitys [40,41,42]. Identified DAPs were rarely involved in cell division, cytoskeleton, plant hormone, and vascular tissue development according to classification of biological and molecular functional process, thereby supporting evidence that Ery does not primarily affect morphology.
Ery predominantly inhibits prokaryotic protein synthesis by binding irreversibly to the 50S ribosomal subunit [43,44]. Prokaryotic ribosome is composed of 30S and 50S subunits containing four rRNA species and approximately 55 ribosomal proteins (r-proteins), and its structure and function resemble chloroplast ribosome [45,46]. Functional pathway analysis using MapMan indicated that Ery either directly or indirectly affects photosynthetic protein expression and protein biosynthesis (Figure S4 and Figure 4). Many DAPs in the photosynthetic pathway were downregulated (Figure S4 and Figure 4, Table 1), whereas DAPs classified in protein biosynthesis, modification, and homeostasis were predominantly upregulated (Figure S4 and Figure 4, Table 2). Chloroplast organelles possess an independent protein synthesis pathway [47]. Approximately one-third of chloroplast r-proteins are encoded by the chloroplast genome, and two-thirds are encoded in the nucleus, synthesized in the cytoplasm, and migrate to the chloroplast [48]. As shown in Table 2, Ery contributed to the abundant expression of ribosomal proteins in the chloroplastic genome and nuclear genome compared to the control (E0), suggesting that Ery interrupted the chloroplast translation machinery, including ribosomal structure and organization that results from chloroplastic and nucleic genomes.
Ery affected metabolic process (Figure 3). As photosynthetic activity, which is an important metabolic process in plants [15,42,49], we observed decreases in photosynthetic pigment, chlorophyll content (Figure 1 and Figure S1), a photosynthetic pathway of DAPs functional distribution (Figure 4 and Figure S4), and downregulation of chloroplastic DAPs and/or DAPs functioning in photosynthetic machinery such as rbcL and rbcS (RuBisCO) (Table 1). Chlorophylls play key roles in all aspects of the photosynthetic light reaction, including light harvesting, energy transfer, and light energy conversion, suggesting that the alteration of chlorophyll fluorescence parameters may reflect photosynthesis change. The photosynthetic activity of Porphyra yezoensis was reduced by Ery treatment, which reduced Fv/Fm and changed color [49]. Studies using Microcystis flos-aquae and Selenastrum capricornutum showed that Ery inhibits Fv/Fm and the Fv/F0 ratio by targeting a candidate thylakoid membrane system [42,50]. These Ery-induced effects on chlorophyll fluorescence quenching and Fv/Fm depended on Ery dosage and exposure time [49,51,52]. In the light reaction during photosynthesis, photochemical energy conversion by charge separation in PSII reaction centers is reduced by changes in the linear electron transport rate to PSI through the cytochrome complex [53,54]. As expected, Ery inhibited protein synthesis of components in the thylakoid, including the PSII reaction center and cytochrome complex, and reduces membrane proteins including ATPase (Figure 5A) [50]. These results suggested that Ery inhibited primary photochemistry due to PSII reaction center deficiency and/or disrupted electron transport from PSII to PSI due to cytochrome complex deficiency (Figure 5A) [51]. Studies using eukaryotic green algae that possess chloroplasts showed that levofloxacin and amphotericin B antibiotics significantly inhibit photosynthetic electron transport [55,56].
Ribulose bisphosphate carboxylase is a rate-limiting enzyme in the photosynthetic carbon reduction cycle that catalyzes the first step of the carbon assimilation process (Figure 5B). Ery inhibited the synthesis of ribulose bisphosphate carboxylase subunits (rbcL and rbcS), reduced their contents (Figure 2A, Table S2 and Table 1) [52], interfered with assembly, and attenuated RuBisCO activity of this enzyme. Transgenic tobacco plants expressing <50% of wild-type RuBisCO activity had reduced starch and sucrose levels [57,58], and leaf development and growth of transgenic plants expressing only 20% of normal RuBisCO activity were altered with reduced photosynthetic capacity [59]. Ery also affected photosynthetic gene transcription (Figure 6) [60] and protein abundance (Table 1), suggesting that disrupted electron transport, decreased reducing power of ATP and NADPH levels, and low RuBisCO activity affect carbon fixation and assimilation.
In conclusion, we suggest that environmental Ery acted as a protein synthesis inhibitor, thereby changing protein abundance and modulating plant physiology involved especially in photosynthesis, and crop production. As this is the first proteomics study of the effects of veterinary antibiotics in plants, we also provided a comprehensive overview of proteomics analyses of plant response to macrolide antibiotics. Our study may lead to a broader understanding of molecular and physiological responses to environmental antibiotics in crop plants.

Supplementary Materials

The following are available online at https://www.mdpi.com/2075-1729/10/12/311/s1. Figure S1. Ery effect on seed germination; Figure S2. Chlorophyll a and chlorophyll b levels with and without Ery treatment on B. campestris seedlings; Figure S3. Schematic chart of proteomic workflow; Figure S4. Protein abundance using functional categories; Supplementary Table S1. Primers used in qRT-PCR analyses; Supplementary Table S2. List of identified differentially expressed proteins modulated by Ery (FDR < 0.01).

Author Contributions

Y.-E.Y., H.M.C., M.S.C., and Y.B.L. designed and performed the experiments, analyzed data, and wrote the manuscript. D.-w.B., S.J.L., and H.C. performed experiments. M.C.K., M.S.C., and Y.B.L. discussed and commented on results and revised the manuscript. All authors have read and agreed to the published version of the manuscript.

Funding

This research was supported by the National Research Foundation of Korea [NRF no. 2015R1A6A1A03031413 (YBL) and NRF no. 2018R1A1A3A04077119 (MSC)].

Conflicts of Interest

The authors declare no conflict of interest.

References

  1. Lv, J.; Deng, S.; Zhang, L. A review of artificial intelligence applications for antimicrobial resistance. Biosaf. Health 2020. [Google Scholar] [CrossRef]
  2. Marshall, B.M.; Levy, S.B. Food animals and antimicrobials: Impacts on human health. Clin. Microbiol. Rev. 2011, 24, 718–733. [Google Scholar] [CrossRef] [PubMed] [Green Version]
  3. Ezzariai, A.; Hafidi, M.; Khadra, A.; Aemig, Q.; El Fels, L.; Barret, M.; Merlina, G.; Patureau, D.; Pinelli, E. Human and veterinary antibiotics during composting of sludge or manure: Global perspectives on persistence, degradation, and resistance genes. J. Hazard. Mater. 2018, 359, 465–481. [Google Scholar] [CrossRef] [PubMed]
  4. Nkoa, R. Agricultural benefits and environmental risks of soil fertilization with anaerobic digestates: A review. Agron. Sustain. Dev. 2014, 34, 473–492. [Google Scholar] [CrossRef] [Green Version]
  5. Boxall, A.B.A.; Fogg, L.A.; Blackwell, P.A.; Kay, P.; Pemberton, E.J.; Croxford, A. Veterinary medicines in the environment. Rev. Environ. Contam. Toxicol. 2004. [Google Scholar] [CrossRef]
  6. Ding, C.; He, J. Effect of antibiotics in the environment on microbial populations. Appl. Microbiol. Biotechnol. 2010, 87, 925–941. [Google Scholar] [CrossRef]
  7. Cheong, M.S.; Seo, K.H.; Chohra, H.; Yoon, Y.E.; Choe, H.; Kantharaj, V.; Lee, Y.B. Influence of sulfonamide contamination derived from veterinary antibiotics on plant growth and development. Antibiotics 2020, 9, 456. [Google Scholar] [CrossRef]
  8. Osakabe, Y.; Osakabe, K.; Shinozaki, K. Plant Environmental Stress Responses for Survival and Biomass Enhancement. Clim. Chang. Plant Abiotic Stress Toler. 2013, 79–108. [Google Scholar] [CrossRef]
  9. Pessarakli, M. Plant Responses under Environmental Stress Conditions. Adv. Plants Agric. Res. 2015, 2, 276–286. [Google Scholar] [CrossRef] [Green Version]
  10. Roy, R.; Finck, A.; Blair, G.; Tandon, H. Nutrient management guidelines for some major field crops. Plant Nutr. Food Secur. 2006, 235–348. [Google Scholar]
  11. Power, A.G. Ecosystem services and agriculture: Tradeoffs and synergies. Philos. Trans. R. Soc. B Biol. Sci. 2010, 365, 2959–2971. [Google Scholar] [CrossRef] [PubMed]
  12. Misra, R.V.; Roy, R.N.; Hiraoka, H. On-Farm Composting Methods, Composting Methods and Techniques; UN-FAO: Rome, Italy, 2003; pp. 1–26. [Google Scholar]
  13. Sarmah, A.K.; Meyer, M.T.; Boxall, A.B.A. A global perspective on the use, sales, exposure pathways, occurrence, fate and effects of veterinary antibiotics (VAs) in the environment. Chemosphere 2006, 65, 725–759. [Google Scholar] [CrossRef] [PubMed]
  14. Minden, V.; Deloy, A.; Volkert, A.M.; Leonhardt, S.D.; Pufal, G. Antibiotics impact plant traits, even at small concentrations. AoB Plants 2017, 9. [Google Scholar] [CrossRef] [PubMed] [Green Version]
  15. Carla, E.; Francini, A.; Raffaelli, A.; Sebastiani, L. Science of the Total Environment Morpho-physiological response of Populus alba to erythromycin: A timeline of the health status of the plant. Sci. Total Environ. 2016, 569–570, 540–547. [Google Scholar] [CrossRef]
  16. Kura-hotta, M.; Satoh, K.; Katoh, S. Relationship between photosynthesis and chlorophyll content during leaf senescence of rice seedlings. Plant Cell Physiol. 1987, 28, 1321–1329. [Google Scholar] [CrossRef]
  17. Rochaix, J.D. Regulation of photosynthetic electron transport. Biochim. Biophys. Acta—Bioenerg. 2011, 1807, 375–383. [Google Scholar] [CrossRef] [Green Version]
  18. Eberhard, S.; Finazzi, G.; Wollman, F.A. The dynamics of photosynthesis. Annu. Rev. Genet. 2008, 42, 463–515. [Google Scholar] [CrossRef] [Green Version]
  19. Raines, C.A. The Calvin cycle revisited. Photosynth. Res. 2003, 75, 1–10. [Google Scholar] [CrossRef]
  20. Bar-On, Y.M.; Milo, R. The global mass and average rate of rubisco. Proc. Natl. Acad. Sci. USA 2019, 116, 4738–4743. [Google Scholar] [CrossRef] [Green Version]
  21. Gray, J.C.; Sullivan, J.A.; Wang, J.H.; Jerome, C.A.; MacLean, D.; Allen, J.F.; Horner, D.S.; Howe, C.J.; Lopez-Juez, E.; Herrmann, R.G.; et al. Coordination of plastid and nuclear gene expression. Philos. Trans. R. Soc. B Biol. Sci. 2003, 358, 135–145. [Google Scholar] [CrossRef] [Green Version]
  22. Barkan, A.; Goldschmidt-Clermont, M. Participation of nuclear genes in chloroplast gene expression. Biochimie 2000, 82, 559–572. [Google Scholar] [CrossRef] [Green Version]
  23. Morales, F.; Ancín, M.; Fakhet, D.; González-Torralba, J.; Gámez, A.L.; Seminario, A.; Soba, D.; Ben Mariem, S.; Garriga, M.; Aranjuelo, I. Photosynthetic metabolism under stressful growth conditions as a bases for crop breeding and yield improvement. Plants 2020, 9, 88. [Google Scholar] [CrossRef] [PubMed] [Green Version]
  24. Haak, D.C.; Fukao, T.; Grene, R.; Hua, Z.; Ivanov, R.; Perrella, G.; Li, S. Multilevel regulation of abiotic stress responses in plants. Front. Plant Sci. 2017, 8, 1564. [Google Scholar] [CrossRef] [PubMed]
  25. Liu, Y.; Lu, S.; Liu, K.; Wang, S.; Huang, L.; Guo, L. Proteomics: A powerful tool to study plant responses to biotic stress. Plant Methods 2019, 15, 135. [Google Scholar] [CrossRef] [PubMed]
  26. Kosová, K.; Vítámvás, P.; Urban, M.O.; Prášil, I.T.; Renaut, J. Plant abiotic stress proteomics: The major factors determining alterations in cellular proteome. Front. Plant Sci. 2018, 9, 122. [Google Scholar] [CrossRef] [PubMed] [Green Version]
  27. Shryock, T.R.; Mortensen, J.E.; Baumholtz, M. The effects of macrolides on the expression of bacterial virulence mechanisms. J. Antimicrob. Chemother. 1998, 41, 505–512. [Google Scholar] [CrossRef] [Green Version]
  28. Usary, J.; Champney, W.S. Erythromycin inhibition of 50S ribosomal subunit formation in Escherichia coli cells. Mol. Microbiol. 2001, 40, 951–962. [Google Scholar] [CrossRef] [Green Version]
  29. Sumanta, N.; Haque, C.I.; Nishika, J.; Suprakash, R. Spectrophotometric Analysis of Chlorophylls and Carotenoids from Commonly Grown Fern Species by Using Various Extracting Solvents. Res. J. Chem. Sci. 2014, 2231, 606X. [Google Scholar]
  30. Wang, K.; Lin, K.; Huang, X.; Chen, M. A Simple and Fast Extraction Method for the Determination of Multiclass Antibiotics in Eggs Using LC-MS/MS. J. Agric. Food Chem. 2017, 65, 5064–5073. [Google Scholar] [CrossRef]
  31. Paulo, J.A. Sample preparation for proteomic analysis using a GeLC-MS/MS strategy. J. Biol. Methods 2016, 3, 45. [Google Scholar] [CrossRef] [Green Version]
  32. Schwacke, R.; Ponce-Soto, G.Y.; Krause, K.; Bolger, A.M.; Arsova, B.; Hallab, A.; Gruden, K.; Stitt, M.; Bolger, M.E.; Usadel, B. MapMan4: A Refined Protein Classification and Annotation Framework Applicable to Multi-Omics Data Analysis. Mol. Plant 2019, 12, 879–892. [Google Scholar] [CrossRef] [PubMed]
  33. Gubernator, B.; Bartoszewski, R.; Kroliczewski, J.; Wildner, G.; Szczepaniak, A. Ribulose-1,5-bisphosphate carboxylase/oxygenase from thermophilic cyanobacterium Thermosynechococcus elongatus. Photosynth. Res. 2008, 95, 101–109. [Google Scholar] [CrossRef] [PubMed]
  34. Lee, J. Leaf Proteome Analysis in Brassica rapa L. (Inbred line ‘Chiifu’) using Shotgun Proteome Approach. Plant Breed. Biotechnol. 2015, 3, 389–395. [Google Scholar] [CrossRef]
  35. Thompson, L.A.; Darwish, W.S. Environmental Chemical Contaminants in Food: Review of a Global Problem. J. Toxicol. 2019, 2019, 2345283. [Google Scholar] [CrossRef] [Green Version]
  36. Kim, K.R.; Owens, G.; Kwon, S.I.; So, K.H.; Lee, D.B.; Ok, Y.S. Occurrence and environmental fate of veterinary antibiotics in the terrestrial environment. Water. Air Soil Pollut. 2011, 214, 163–174. [Google Scholar] [CrossRef]
  37. Hirsch, R.; Ternes, T.; Haberer, K.; Kratz, K.L. Occurrence of antibiotics in the aquatic environment. Sci. Total Environ. 1999, 225, 109–118. [Google Scholar] [CrossRef]
  38. Pan, M.; Wong, C.K.C.; Chu, L.M. Distribution of antibiotics in wastewater-irrigated soils and their accumulation in vegetable crops in the Pearl River Delta, Southern China. J. Agric. Food Chem. 2014, 62, 11062–11069. [Google Scholar] [CrossRef]
  39. Opris, O.; Copaciu, F.; Loredana Soran, M.; Ristoiu, D.; Niinemets, Ü.; Copolovici, L. Influence of nine antibiotics on key secondary metabolites and physiological characteristics in Triticum aestivum: Leaf volatiles as a promising new tool to assess toxicity. Ecotoxicol. Environ. Saf. 2013, 87, 70–79. [Google Scholar] [CrossRef]
  40. Liu, J.; Lu, G.; Ding, J.; Zhang, Z.; Wang, Y. Tissue distribution, bioconcentration, metabolism, and effects of erythromycin in crucian carp (Carassius auratus). Sci. Total Environ. 2014, 490, 914–920. [Google Scholar] [CrossRef]
  41. Liu, J.; Lu, G.; Cai, Y.; Wu, D.; Yan, Z.; Wang, Y. Modulation of erythromycin-induced biochemical responses in crucian carp by ketoconazole. Environ. Sci. Pollut. Res. 2017, 24, 5285–5292. [Google Scholar] [CrossRef]
  42. Wan, J.; Guo, P.; Peng, X.; Wen, K. Effect of erythromycin exposure on the growth, antioxidant system and photosynthesis of Microcystis flos-aquae. J. Hazard. Mater. 2015, 283, 778–786. [Google Scholar] [CrossRef] [PubMed]
  43. Cundliffe, E. On the nature of antibiotic binding sites in ribosomes. Biochimie 1987, 69, 863–869. [Google Scholar] [CrossRef]
  44. Carol, P.; Rozier, C.; Lazaro, E.; Ballesta, J.P.G.; Mache, R. Erythromycin and 5S rRNA binding properties of the spinach chloroplast ribosomal protein CL22. Nucleic Acids Res. 1993, 21, 635–639. [Google Scholar] [CrossRef] [Green Version]
  45. Harris, E.H.; Boynton, J.E.; Gillham, N.W. Chloroplast ribosomes and protein synthesis. Microbiol. Rev. 1994, 58, 700–754. [Google Scholar] [CrossRef] [PubMed]
  46. Mache, R. Chloroplast ribosomal proteins and their genes. Plant Sci. 1990, 72, 1–12. [Google Scholar] [CrossRef]
  47. Zoschke, R.; Bock, R. Chloroplast translation: Structural and functional organization, operational control, and regulation. Plant Cell 2018, 30, 745–770. [Google Scholar] [CrossRef] [Green Version]
  48. Daniell, H.; Lin, C.S.; Yu, M.; Chang, W.J. Chloroplast genomes: Diversity, evolution, and applications in genetic engineering. Genome Biol. 2016, 17, 1–29. [Google Scholar] [CrossRef] [PubMed] [Green Version]
  49. Oh, M.-H.; Kang, Y.-H.; Lee, C.-H.; Chung, I.-K. Effects of Six Antibiotics on the Activity of the Photosynthetic Apparatus and Ammonium Uptake of Thallus of Porphyra yezoensis. Algae 2005, 20, 121–125. [Google Scholar] [CrossRef]
  50. Liu, B.Y.; Nie, X.P.; Liu, W.Q.; Snoeijs, P.; Guan, C.; Tsui, M.T. Toxic effects of erythromycin, ciprofloxacin and sulfamethoxazole on photosynthetic apparatus in Selenastrum capricornutum. Ecotoxicol. Environ. Saf. 2011, 74, 1027–1035. [Google Scholar] [CrossRef]
  51. Deng, C.N.; Zhang, D.Y.; Pan, X.L. Toxic effects of erythromycin on photosystem I and II in Microcystis aeruginosa. Photosynthetica 2014, 52, 574–580. [Google Scholar] [CrossRef]
  52. Liu, B.; Liu, W.; Nie, X.; Guan, C.; Yang, Y.; Wang, Z.; Liao, W. Growth response and toxic effects of three antibiotics on Selenastrum capricornutum evaluated by photosynthetic rate and chlorophyll biosynthesis. J. Environ. Sci. 2011, 23, 1558–1563. [Google Scholar] [CrossRef]
  53. Guidi, L.; Lo Piccolo, E.; Landi, M. Chlorophyll fluorescence, photoinhibition and abiotic stress: Does it make any difference the fact to be a C3 or C4 species? Front. Plant Sci. 2019, 10, 174. [Google Scholar] [CrossRef] [PubMed]
  54. Roháček, K. Chlorophyll Fluorescence Parameters. Photosynthetica 2002, 40, 13–29. [Google Scholar] [CrossRef]
  55. Sandmann, G.; Böger, P. Inhibition of photosynthetic electron transport by amphotericin B. Physiol. Plant. 1981, 51, 326–328. [Google Scholar] [CrossRef]
  56. Pan, X.; Zhang, D.; Chen, X.; Mu, G.; Li, L.; Bao, A. Effects of levofloxacin hydrochlordie on photosystem II activity and heterogeneity of Synechocystis sp. Chemosphere 2009, 77, 413–418. [Google Scholar] [CrossRef] [PubMed]
  57. Quick, W.P.; Fichtner, K.; Schulze, E.D.; Wendler, R.; Leegood, R.C.; Mooney, H.; Rodermel, S.R.; Bogorad, L.; Stitt, M. Decreased ribulose-1,5-bisphosphate carboxylase-oxygenase in transgenic tobacco transformed with “antisense” rbcS—IV. Impact on photosynthesis in conditions of altered nitrogen supply. Planta 1992, 188, 522–531. [Google Scholar] [CrossRef] [PubMed]
  58. Fichtner, K.; Quick, W.P.; Schulze, E.-D.; Mooney, H.A.; Rodermel, S.R.; Bogorad, L.; Stitt, M. Decreased ribulose-1,5-bisphosphate carboxylase-oxygenase in transgenic tobacco transformed with antisense rbcS. Planta 1993, 190, 1–9. [Google Scholar] [CrossRef]
  59. Jiang, C.Z.; Rodermel, S.R. Regulation of photosynthesis during leaf development in RbcS antisense DNA mutants of tobacco. Plant Physiol. 1995, 107, 215–224. [Google Scholar] [CrossRef] [Green Version]
  60. Goh, E.B.; Yim, G.; Tsui, W.; McClure, J.A.; Surette, M.G.; Davies, J. Transcriptional modulation of bacterial gene expression by subinhibitory concentrations of antibiotics. Proc. Natl. Acad. Sci. USA 2002, 99, 17025–17030. [Google Scholar] [CrossRef] [Green Version]
Figure 1. The effects of Ery on Brassica campestris seedling growth and development. Sterilized seeds were placed on Ery-containing agar medium and grown vertically for four days. (A) Morphological phenotype at day 4. (B) Primary root length. (C) Chlorophyll contents. Data represent mean ± SD (n = 48). All experiments were replicated four times with similar results. Asterisks indicate statistically significant difference from control (0 mg/L) (Student’s t-test; * p < 0.05, *** p < 0.001).
Life 10 00311 g001
Figure 2. SDS-PAGE image and identified protein levels. (A) Coomassie brilliant blue stained gel image. Total proteins were extracted from 4-day-old seedlings grown on either 0 mg/L (E0) or 5 mg/L (E5) Ery and were separated by 12% SDS-PAGE. Separated proteins were divided into five fractions in a size-dependent manner: F1, top~100 kDa; F2, 100~60 kDa; F3, 60~50 kDa; F4, 50~25 kDa; F5, 25 kDa to the bottom. (B) Venn diagram of quantified proteins. Proteins were identified by data processing using peptides from LC-MS/MS analyses. (C) The number of identified proteins in E0 and E5 samples; 178 proteins of 388 proteins were identified in both E0 and E5 and showed >2-fold difference (false discovery rate (FDR) < 0.01) in abundance.
Life 10 00311 g002
Figure 3. Gene ontology annotation of Ery-responsive proteins. Identified annotated proteins are included and presented according to (A) biological process, (C) cellular component, (E) molecular function, and (G) protein class. The percentage distributions of the gene ontology (GO) terms were determined using the PANTHER and STRINGs databases. Protein abundance patterns are presented according to (B) biological process, (D) molecular function, (F) cellular component, and (H) protein class. The columns above and under the x-axes represent the numbers of upregulated and downregulated proteins by Ery, respectively.
Life 10 00311 g003
Figure 4. Bin-wise distributions of differentially expressed proteins using MapMan. Relative expression levels (log2) of accumulation are shown by a color gradient from high (red, +4) to low (green, −4).
Life 10 00311 g004
Figure 5. Visualization of molecular processes associated with photosynthesis using MapMan. A photosynthetic pathway showing that 5 mg/L Ery changed protein (colored squares) levels along with log2 values. Color gradients represent the relative differences in protein accumulation from high (red, +4) to low (green, −4). (A) Light reactions, thylakoids in the chloroplast (B) Calvin cycle, stroma in the chloroplast
Life 10 00311 g005
Figure 6. Relative transcript abundance of identified DAPs including the photosynthetic pathway. (A) DAPs encoded in chloroplastic genome in the photosynthetic pathway (B) DAP genes encoded in nuclear genome in photosynthetic pathway (C) Bra026951, a vacuolar ATPase protein (D) Bra030284 in the protein synthesis pathway (E) Bra008784 from an unassigned group. The relative transcript levels of indicated B. campestris genes were analyzed by qRT-PCR. Total RNA was extracted from seedlings grown in the presence of 0, 2, 5, and 10 mg/L Ery for 4 days. Gene expression was normalized to that of EF1a. Bars represent mean ± SD (n = 12). The experiments were replicated three times with similar results. Asterisks indicate statistically significant differences relative to the control (0 mg/L Ery). Student’s t-test; * p < 0.05, ** p < 0.01, *** p < 0.001.
Life 10 00311 g006
Table 1. Significantly Differentially Expressed Proteins by Ery in Photosynthesis (FDR < 0.01).
Protein IDMolecular
Weight
Quantitative Value
(Normalized Total Spectra)
Brassica
Accession
AGI Locus
Identifier
Description
E0E5
M4EHZ120 kDa456.80.0Bra028406AT5G38410Ribulose bisphosphate carboxylase small chain
M4EYY520 kDa205.00.0Bra034027AT1G67090Ribulose bisphosphate carboxylase small chain
M4EPE028 kDa81.50.0Bra030660AT1G06680PsbP domain-containing protein
M4DG9728 kDa62.40.0Bra015520AT1G06680PsbP domain-containing protein
A0A249RRH756 kDa33.90.0Bra040977ATCG00680Photosystem II CP47 reaction center protein
A0A249RQW139 kDa25.10.0 ATCG00020Photosystem II protein D1 (psbA)
M4FBB126 kDa22.40.0Bra038377AT4G09650Uncharacterized protein
M4C9F826 kDa22.40.0Bra000837AT4G03280Plastoquinol–plastocyanin reductase
M4DNQ728 kDa18.30.0Bra018144AT3G47470Chlorophyll a–b binding protein, chloroplastic
M4EV3923 kDa15.60.0Bra032672AT4G12800PSI subunit V
A0A249RPW69 kDa15.60.0Bra041107ATCG00580Cytochrome b559 subunit alpha (psbE)
A0A249RQ239 kDa14.30.0 ATCG01060Photosystem I iron–sulfur center (psaC)
A0A249RPV252 kDa12.90.0Bra041123ATCG00280Photosystem II CP43 reaction center protein (psbC)
M4DD6528 kDa12.20.0Bra014433AT3G61470Chlorophyll a–b binding protein, chloroplastic
M4F5A224 kDa8.80.0Bra036258AT4G02530Uncharacterized protein
M4CLA230 kDa8.10.0Bra004989AT2G40100Chlorophyll a–b binding protein, chloroplastic
A0A249RRE640 kDa6.80.0 ATCG00270Photosystem II D2 protein (psbD)
M4D4C524 kDa6.80.0Bra011329AT4G32260Uncharacterized protein
M4CFL729 kDa4.80.0Bra002999AT5G54270Chlorophyll a–b binding protein, chloroplastic
A0A249RPW882 kDa3.40.0Bra041122ATCG00350Photosystem I P700 chlorophyll a apoprotein A2 (psaB)
M4E904 (+2)32 kDa2.00.0Bra025260AT3G27240Cytochrome c domain-containing protein
M4C8N926 kDa1.40.0Bra000567AT3G63540PsbP domain-containing protein
M4F58431 kDa33.33.8Bra036240AT4G02770Uncharacterized protein
M4EZF725 kDa25.15.7Bra034200AT4G03280Plastoquinol–plastocyanin reductase
M4C90925 kDa29.97.6Bra000687AT4G09650Uncharacterized protein
M4ELR331 kDa26.511.4Bra029732AT3G08940Chlorophyll a–b binding protein, chloroplastic
M4DEI724 kDa38.713.3Bra014908AT1G31330PSI-F
M4E72553 kDa48.217.1Bra024580AT1G23310Aminotran_1_2 domain-containing protein
M4FIJ816 kDa5.419.0Bra040927AT2G28900Uncharacterized protein
M4EDU165 kDa4.119.0Bra026951AT1G12840V-type proton ATPase subunit C
A0A249RPX135 kDa59.726.6Bra041106ATCG00540Cytochrome f (petA)
M4ERV728 kDa82.138.0Bra031534AT1G06680PsbP domain-containing protein
M4D5N573 kDa26.553.2Bra011792AT4G37870Phosphoenolpyruvate carboxykinase (ATP)
A0A249RRD655 kDa292.5146.2Bra041120ATCG00120ATP synthase subunit alpha, chloroplastic
M4EH2253 kDa2700.11086.0Bra028087ATCG00490Ribulose bisphosphate carboxylase large chain (rbcL)
Table 2. Significantly Differentially Expressed Proteins by Ery in Protein Synthesis (FDR < 0.01).
Protein IDMolecular
Weight
Quantitative Value
(Normalized Total Spectra)
Brassica
Accession
AGI Locus
Identifier
Description
E0E5
M4D1Y332 kDa9.50.0Bra010483AT5G50250Uncharacterized protein
M4CNF715 kDa8.80.0Bra005745AT5G0296040S ribosomal protein S23
M4EQE336 kDa8.80.0Bra031014AT1G18080WD_REPEATS_REGION domain-containing protein
M4D7B017 kDa7.50.0Bra012370AT1G23290Ribosomal_L18e/L15P domain-containing protein
M4DFM617 kDa7.50.0Bra015299AT1G04270Structural constituent of ribosome
M4CHU316 kDa6.80.0Bra003776AT1G74970Structural constituent of ribosome
M4DZD232 kDa6.80.0Bra021879AT2G33800S5 DRBM domain-containing protein
M4E88045 kDa6.80.0Bra024986AT1G43170Structural constituent of ribosome
A0A249RQ0611 kDa6.80.0Bra001922AT5G4732030S ribosomal protein S19, chloroplastic (rps19)
A0A249RPV723 kDa6.80.0Bra027599AT5G4525030S ribosomal protein S4, chloroplastic (rps4)
M4D38426 kDa4.80.0Bra010937AT1G27450Adenine phosphoribosyltransferase
M4C7V729 kDa4.10.0Bra000285AT2G43030Ribosomal protein L3 family protein
M4DCB819 kDa4.10.0Bra014131AT1G48350Ribosomal protein L18 family protein
M4DJ7726 kDa4.10.0Bra016555AT1G18540Ribosomal_L6e_N domain-containing protein
M4CPV919 kDa3.40.0Bra006248AT5G1432030S ribosomal protein S13, chloroplast
A0A249RPV927 kDa3.40.0Bra013947AT4G2609030S ribosomal protein S2, chloroplastic (rps2)
A0A249RR2330 kDa3.40.0 ATCG0083050S ribosomal protein L2, chloroplastic (rpl2)
M4DDG713 kDa2.70.0Bra014535AT2G4346060S ribosomal protein L38
M4F6Q322 kDa2.70.0Bra036763AT1G3568050S ribosomal protein L21, chloroplastic
M4CX7724 kDa2.00.0Bra008824AT5G13510Ribosomal protein L10 family protein
A0A249RRI714 kDa2.00.0Bra040980ATCG0078050S ribosomal protein L14, chloroplastic (rpl14)
M4DXP836 kDa1.40.0Bra021294AT3G18130WD_REPEATS_REGION domain-containing protein
A0A249RQJ618 kDa1.40.0 ATCG0081050S ribosomal protein L22, chloroplastic (rpl22)
M4ENY925 kDa0.03.8Bra030509AT1G02780Ribosomal protein L19
M4EZX011 kDa1.45.7Bra034363AT2G2771060S acidic ribosomal protein P2
M4D4S2 6 kDa0.05.7Bra011477AT3G4401040S ribosomal protein S29
M4CVX627 kDa2.07.6Bra008373AT1G78630Structural constituent of ribosome
M4D85724 kDa3.49.5Bra012667AT4G16720Ribosomal protein L15
M4DLG030 kDa3.49.5Bra017341AT3G25920Ribosomal_L18e/L15P domain-containing protein
M4CCC716 kDa0.09.5Bra001857AT4G1500060S ribosomal protein L27
M4CHH912 kDa4.811.4Bra003662AT1G77940Ribosomal_L7Ae domain-containing protein
M4EMA818 kDa5.413.3Bra029928AT5G23740Ribosomal_S17_N domain-containing protein
M4FD4416 kDa0.013.3Bra039014AT2G19730Ribosomal_L28e domain-containing protein
M4CIF021 kDa7.515.2Bra003984AT1G66580Ribosomal_L16 domain-containing protein
M4DVY724 kDa6.815.2Bra020681AT5G4876060S ribosomal protein L13A
M4C81184 kDa5.415.2Bra000339AT2G440606,7-dimethyl-8-ribityllumazine synthase
M4D8V617 kDa3.415.2Bra012916AT3G49910KOW domain-containing protein
M4DU0719 kDa3.415.2Bra020000AT1G0959060S ribosomal protein L21
M4DW2810 kDa3.415.2Bra020722AT3G6111040S ribosomal protein S27
M4EE1185 kDa0.015.2Bra027021AT1G62750Elongation factor G, chloroplastic
M4E3F123 kDa2.717.1Bra023302AT1G32990Structural constituent of ribosome
M4DQ4025 kDa0.017.1Bra018631AT2G27530Ribosomal protein
M4DWX716 kDa8.819.0Bra012616AT4G1810060S ribosomal protein L32
M4DVR147 kDa8.819.0Bra020605AT5G28020Cysteine synthase
M4CUN416 kDa6.819.0Bra007929AT1G70600Ribosomal_L18e/L15P domain-containing protein
M4CFK113 kDa4.819.0Bra002983AT5G0480040S ribosomal protein S17
M4EBR873 kDa10.222.8Bra026227AT1G30580Obg-like ATPase 1
M4DND024 kDa9.522.8Bra018017AT3G4901060S ribosomal protein L13
M4CAC514 kDa12.224.7Bra001154AT3G0556060S ribosomal protein L22-2
M4D38923 kDa12.224.7Bra010943AT1G2740060S ribosomal protein L17
M4CQ0023 kDa8.824.7Bra006289AT5G15200S4 RNA-binding domain-containing protein
M4FGB717 kDa8.128.5Bra040145AT5G1838040S ribosomal protein S16
M4C7F717 kDa5.428.5Bra000135AT2G39460Ribosomal_L23eN domain-containing protein
M4D1R216 kDa8.130.4Bra010412AT4G27090Ribosomal_L14e domain-containing protein
M4EBD313 kDa7.530.4Bra026092AT2G3206040S ribosomal protein S12
M4FH7037 kDa13.632.3Bra040448AT3G63490Ribosomal protein
M4D5W412 kDa12.932.3Bra010696AT4G3920040S ribosomal protein S25
M4CGU417 kDa17.036.1Bra003427AT4G00100Ribosomal_S13_N domain-containing protein
M4D7X021 kDa15.638.0Bra012580AT4G18730Structural constituent of ribosome
M4EHJ814 kDa10.938.0Bra028263AT5G62300Ribosomal_S10 domain-containing protein
M4FGG9105 kDa10.939.9Bra040197AT3G04380Histone-lysine N-methyltransferase
P5142315 kDa17.641.8Bra029570AT4G02890Ubiquitin-60S ribosomal protein L40 (RL40_BRARP)
M4DL7737 kDa12.241.8Bra017258AT2G36145Uncharacterized protein
M4CS0618 kDa20.445.6Bra006998AT3G5343060S ribosomal protein L12
M4DIF517 kDa12.253.2Bra016282AT1G26630Eukaryotic translation initiation factor 5A
M4D17828 kDa21.057.0Bra010227AT4G3170040S ribosomal protein S6
M4EGW325 kDa27.862.7Bra028028AT1G3403040S ribosomal protein S18
M4EZ4438 kDa30.564.6Bra034087AT3G09820Adenosine kinase
M4CUY532 kDa29.264.6Bra008030AT1G7237040S ribosomal protein SA
M4DLT028 kDa31.277.8Bra017461AT2G0125060S ribosomal protein L7
M4ELW045 kDa34.679.7Bra029780AT3G09630Ribos_L4_asso_C domain-containing protein
M4CEM1236 kDa30.585.4Bra002652AT5G58410RING-type E3 ubiquitin transferase
M4D61165 kDa48.2163.3Bra011919AT1G55490ATP binding/protein binding
M4EPY774 kDa46.8172.8Bra030858AT1G55490ATP binding/protein binding
Publisher’s Note: MDPI stays neutral with regard to jurisdictional claims in published maps and institutional affiliations.

