Article

Driving Forces in Archetypical Land-Use Changes in a Mountainous Watershed in East Asia

1
Professorship of Ecological Services (PES), Faculty of Biology, Chemistry and Geosciences, BayCEER, University of Bayreuth, Bayreuth 95440, Germany
2
Natural and Social Science Interface (NSSI), Institute for Environmental Decisions (IED), ETH Zurich, 8092 Zurich, Switzerland
3
Department of Geography, Seoul National University, Shilim-Dong, Kwanak-Gu, Seoul 151-742, Korea
4
Department of Plant Ecology, University of Bayreuth, Bayreuth 95440, Germany
*
Author to whom correspondence should be addressed.
Land 2014, 3(3), 957-980; https://doi.org/10.3390/land3030957
Submission received: 5 June 2014 / Revised: 22 July 2014 / Accepted: 4 August 2014 / Published: 13 August 2014

Abstract

:
Identifying patterns and drivers of regional land use changes is crucial for supporting land management and planning. Doing so for mountain ecosystems in East Asia, such as the So-yang River Basin in South Korea, has until now been a challenge because of extreme social and ecological complexities. Applying the techniques of geographic information systems (GIS) and statistical modeling via multinomial logistic regression (MNL), we attempted to examine various hypothesized drivers of land use changes, over the period 1980 to 2000. The hypothesized drivers included variables of topography, accessibility, spatial zoning policies and neighboring land use. Before the inferential statistic analyses, we identified the optimal neighborhood extents for each land use type. The two archetypical sub-periods, i.e., 1980–1990 with agricultural expansions and 1990–2000 with reforestation, have similar causal drivers, such as topographic factors, which are related to characteristics of mountainous areas, neighborhood land use, and spatial zoning policies, of land use changes. Since the statistical models robustly capture the mutual effects of biophysical heterogeneity, neighborhood characteristics and spatial zoning regulation on long-term land use changes, they are valuable for developing coupled models of social-ecological systems to simulate land use and dependent ecosystem services, and to support sustainable land management.

1. Introduction

Land use and land cover change (LUCC) is regarded as one of the prime determining factors of global environmental change, with significant impacts on ecosystems, climate and human vulnerability [1,2]. Human impacts on ecosystems mainly occur via land-cover conversion, land degradation or land-use intensification [3]. The impacts of LUCC are probably most serious in mountain regions, which are centers of global biodiversity and provide essential services for at least half of the global population [4]. Despite the fact that mountain ecosystems are changing rapidly in response to diverse natural and anthropogenic drivers and are characterized by high social-ecological heterogeneity, so far LUCC studies have not been as focused on mountain regions when compared to other areas for LUCC process [4]. Many LUCC researches for mountain regions focused on the land abandonment in upland areas, though other phenomena are also important LUCC processes in mountainous areas [5].
In land-use studies, the main goals include finding the biophysical and human drivers of land-use and land-cover change, and understanding how they affect the structure and function of terrestrial systems [6]. Drivers of land use change are defined as proximate and underlying factors [7]. Underlying driving factors such as the systemic and structural conditions of human-environmental relations, reflecting accessibility to land, labor, capital, technology and information, lead to proximate causes (human activities and immediate actions) of land-use changes at specific levels [3]. However, the make-up of driving factors for land-use changes differs across specific regions [8,9]. Moreover, the same driving factors may generate different land-use change patterns in different locations. Studies on land-use changes therefore need to account for spatial characteristics at the landscape scale [10]. Consequently, one pertinent research question is how various driving forces and actors cumulatively affect land-use change in a given spatial context.
Models of land-use change could represent various aspects of complexity of land-use systems. These models analyze the causes and consequences of land use changes to better understand the functioning of the land use system, thereby supporting land use planning and policies [11,12,13]. These models make it possible to understand land-use changes by using selected variables, while trying to predict both the location and magnitude of changes [14]. In particular, descriptive LUCC models, based on spatially explicit influential statistics using regression analysis, explain relations between land-use changes and driving factors to understand underlying causalities assuming existing theories and hypotheses [9]. Multinomial logistic regression analysis is a widely used statistical approach to identify significant causal factors of LUCC with various types of independent variables reflecting socio-economic and environmental factors [15,16,17]. Once validated empirical statistical models can predict future land-use change patterns in response to different changing scenarios of selected driving factors, these models are helpful for informing land use planning practice and policy [14,18,19].
Given the high social-ecological heterogeneity and diverse natural-anthropogenic drivers of changes in mountain ecosystems [
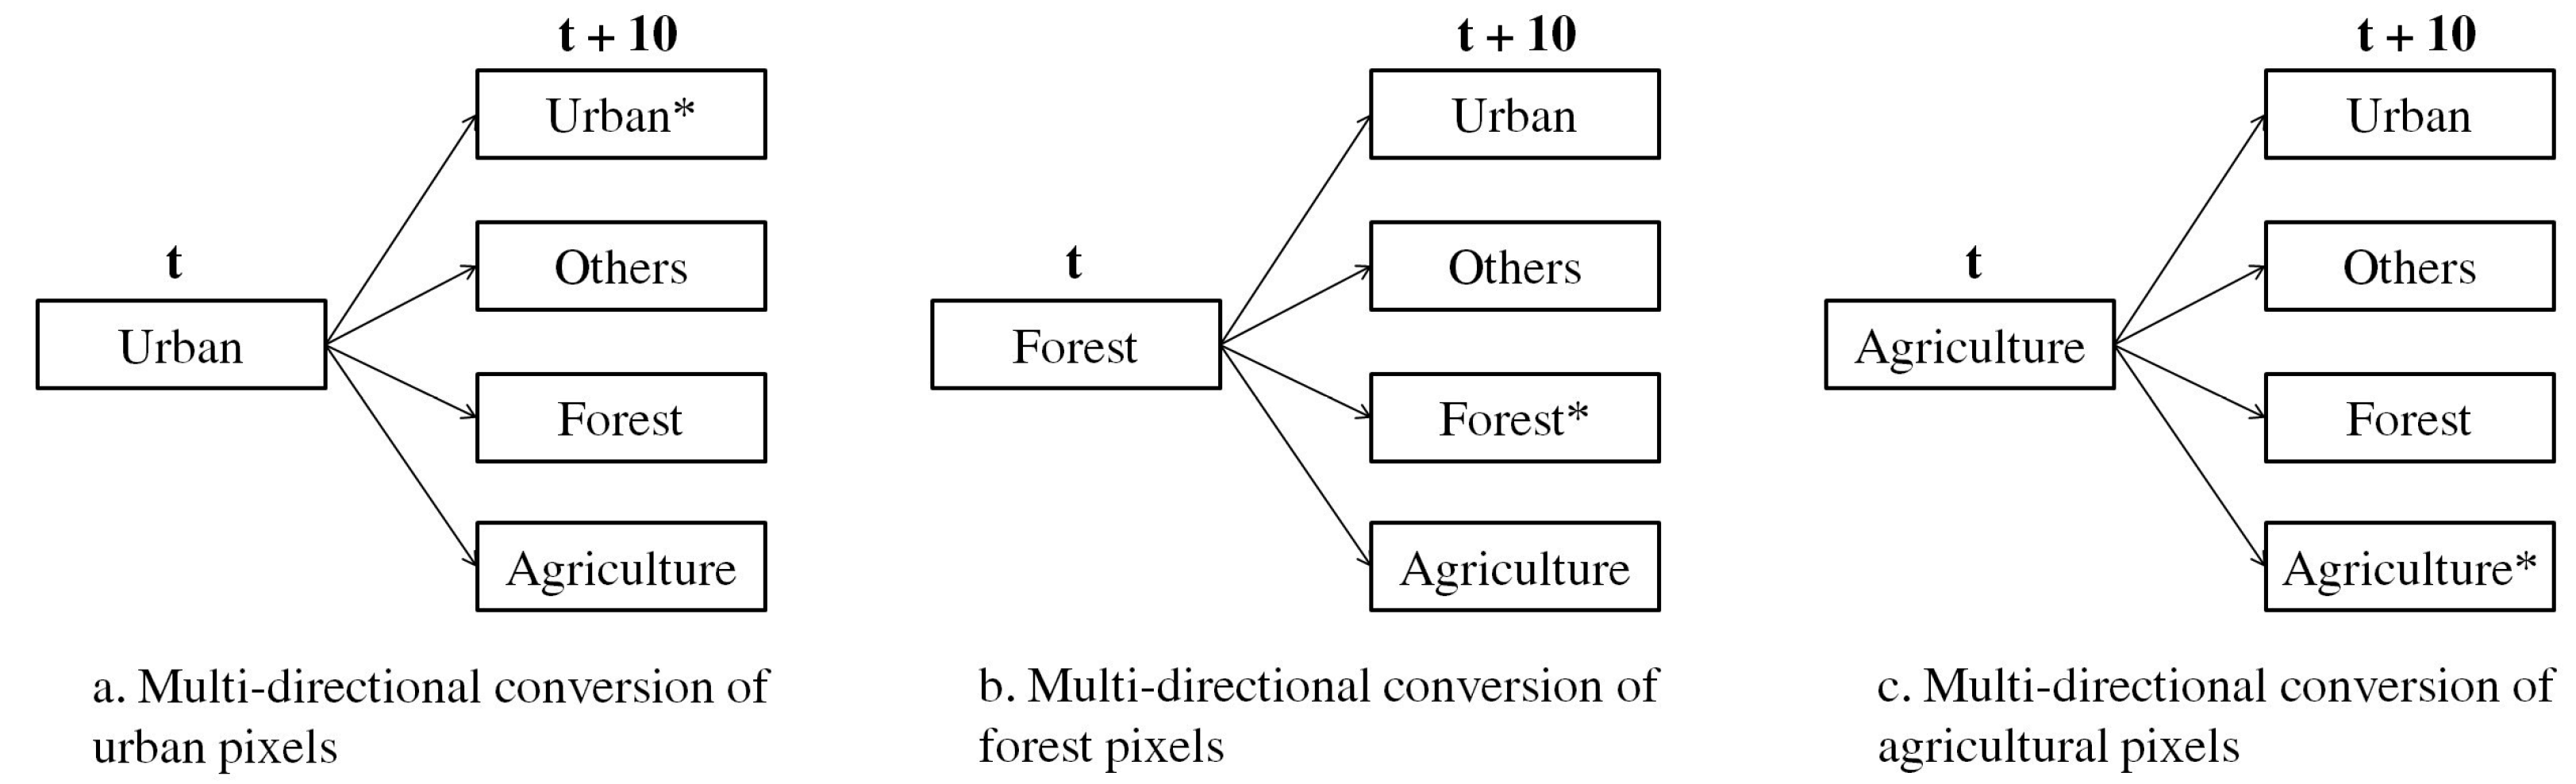
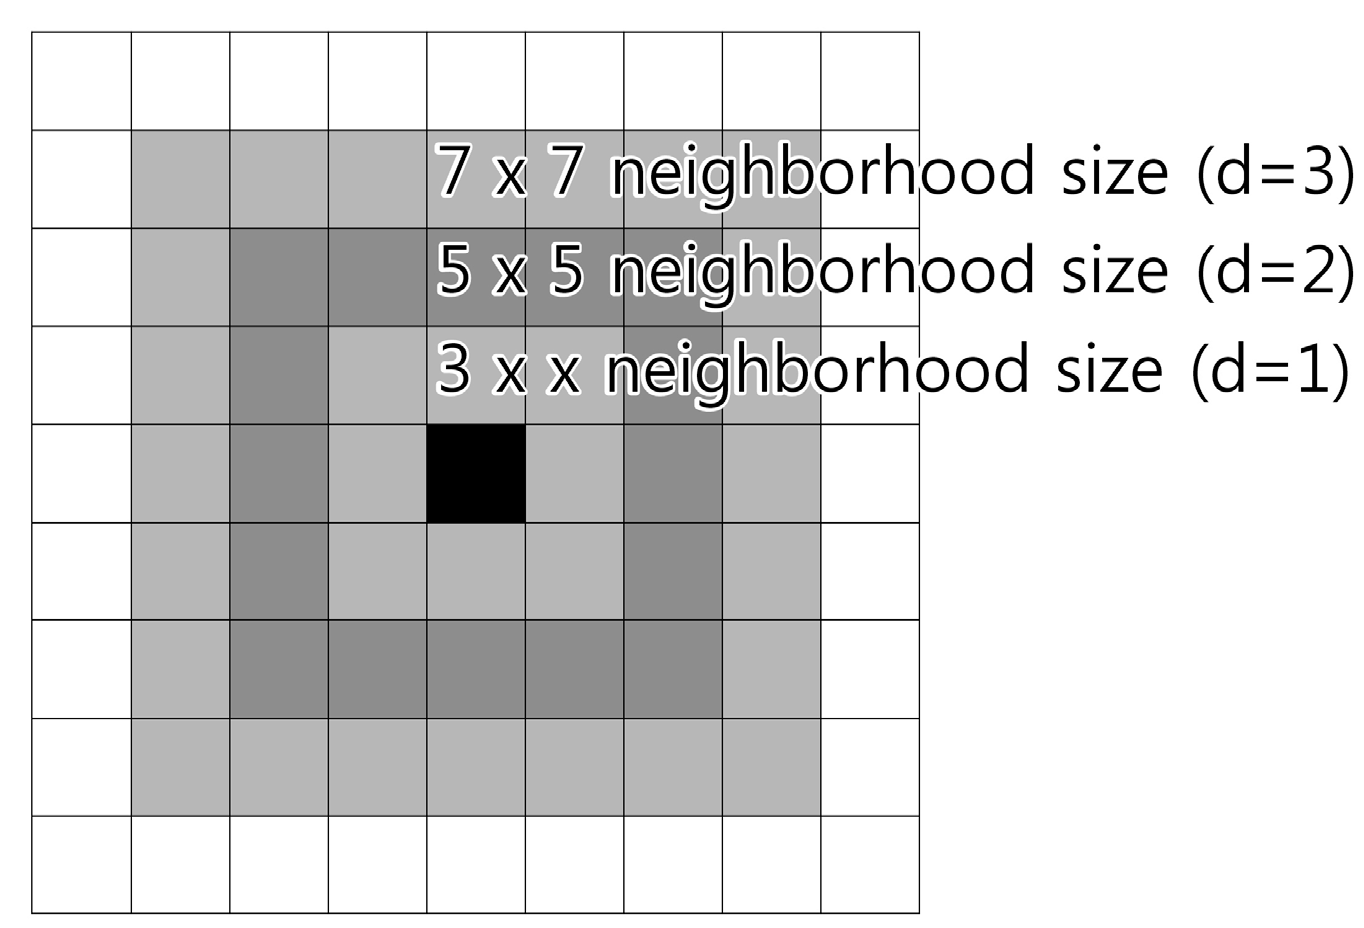
4], a comprehensive understanding of the potential drivers of LUCC is currently lacking in existing studies of mountainous areas. While much research focuses on specific land-use transitions such as urbanization, urban sprawl, or (de)forestation, analyses of multi-directional land-use conversions are comparably rare, despite their importance for guiding integrated regional planning. In a heterogeneous mountain environment, spatial interactions, such as the effects of neighborhood land-use patterns on LUCC at particular locations, are important drivers [20]. To our knowledge no LUCC studies in Asia-Pacific mountainous areas have considered these spatial interactive effects. So far there have been only a few LUCC studies in the European Alps that have considered neighborhood effects (e.g., Rutherford et al. [15]). However, these studies are still limited to the assumption of a fixed neighborhood extent (i.e., 5 × 5 pixels) given that the optimal extent may vary according to land-use types and regional conditions [20,21].
So far, research on LUCC in South Korea has focused on spatio-temporal patterns and causal factors of urban expansion, in part due to rapid urbanization since the 1960’s. Mountainous areas, which cover over 60% of the country, were excluded from these studies, with the exception of some forest cover change research. These studies were conducted with the aim of identifying the probable causes of land-use change using logistic regression analysis [22,23], or to predict future land-use change based on existing prediction models that were built on the identified causation patterns of urban areas [24,25]. Land-use studies in rural areas mainly focused on patterns of spatio-temporal changes to understand urbanization processes at rural scales [26,27,28]. However, land-use changes in rural mountainous areas are significant and relevant issues in South Korea, leading to significant effects on ecosystem functioning through, e.g., soil and water pollution by chemical fertilizers [29]. Rural mountainous areas have experienced spatially concentrated land-use change and forest transitions due to various driving forces such as regional policies, population migration and changes in rural industrial structures [30]. Moreover, mountainous areas in East Asia have experienced reforestation phenomenon based on governmental planning and zoning policies since the 1970’s [30,31]. Although these policies were helpful in maintaining forest resources, there were some environmental problems from intensive agricultural activities in these regions. Currently, although understanding of land-use change processes in agricultural mountainous areas in East Asia are necessary to solve environmental problems based on human-induced land-use, such issues are often poorly covered or missing in land-use studies.
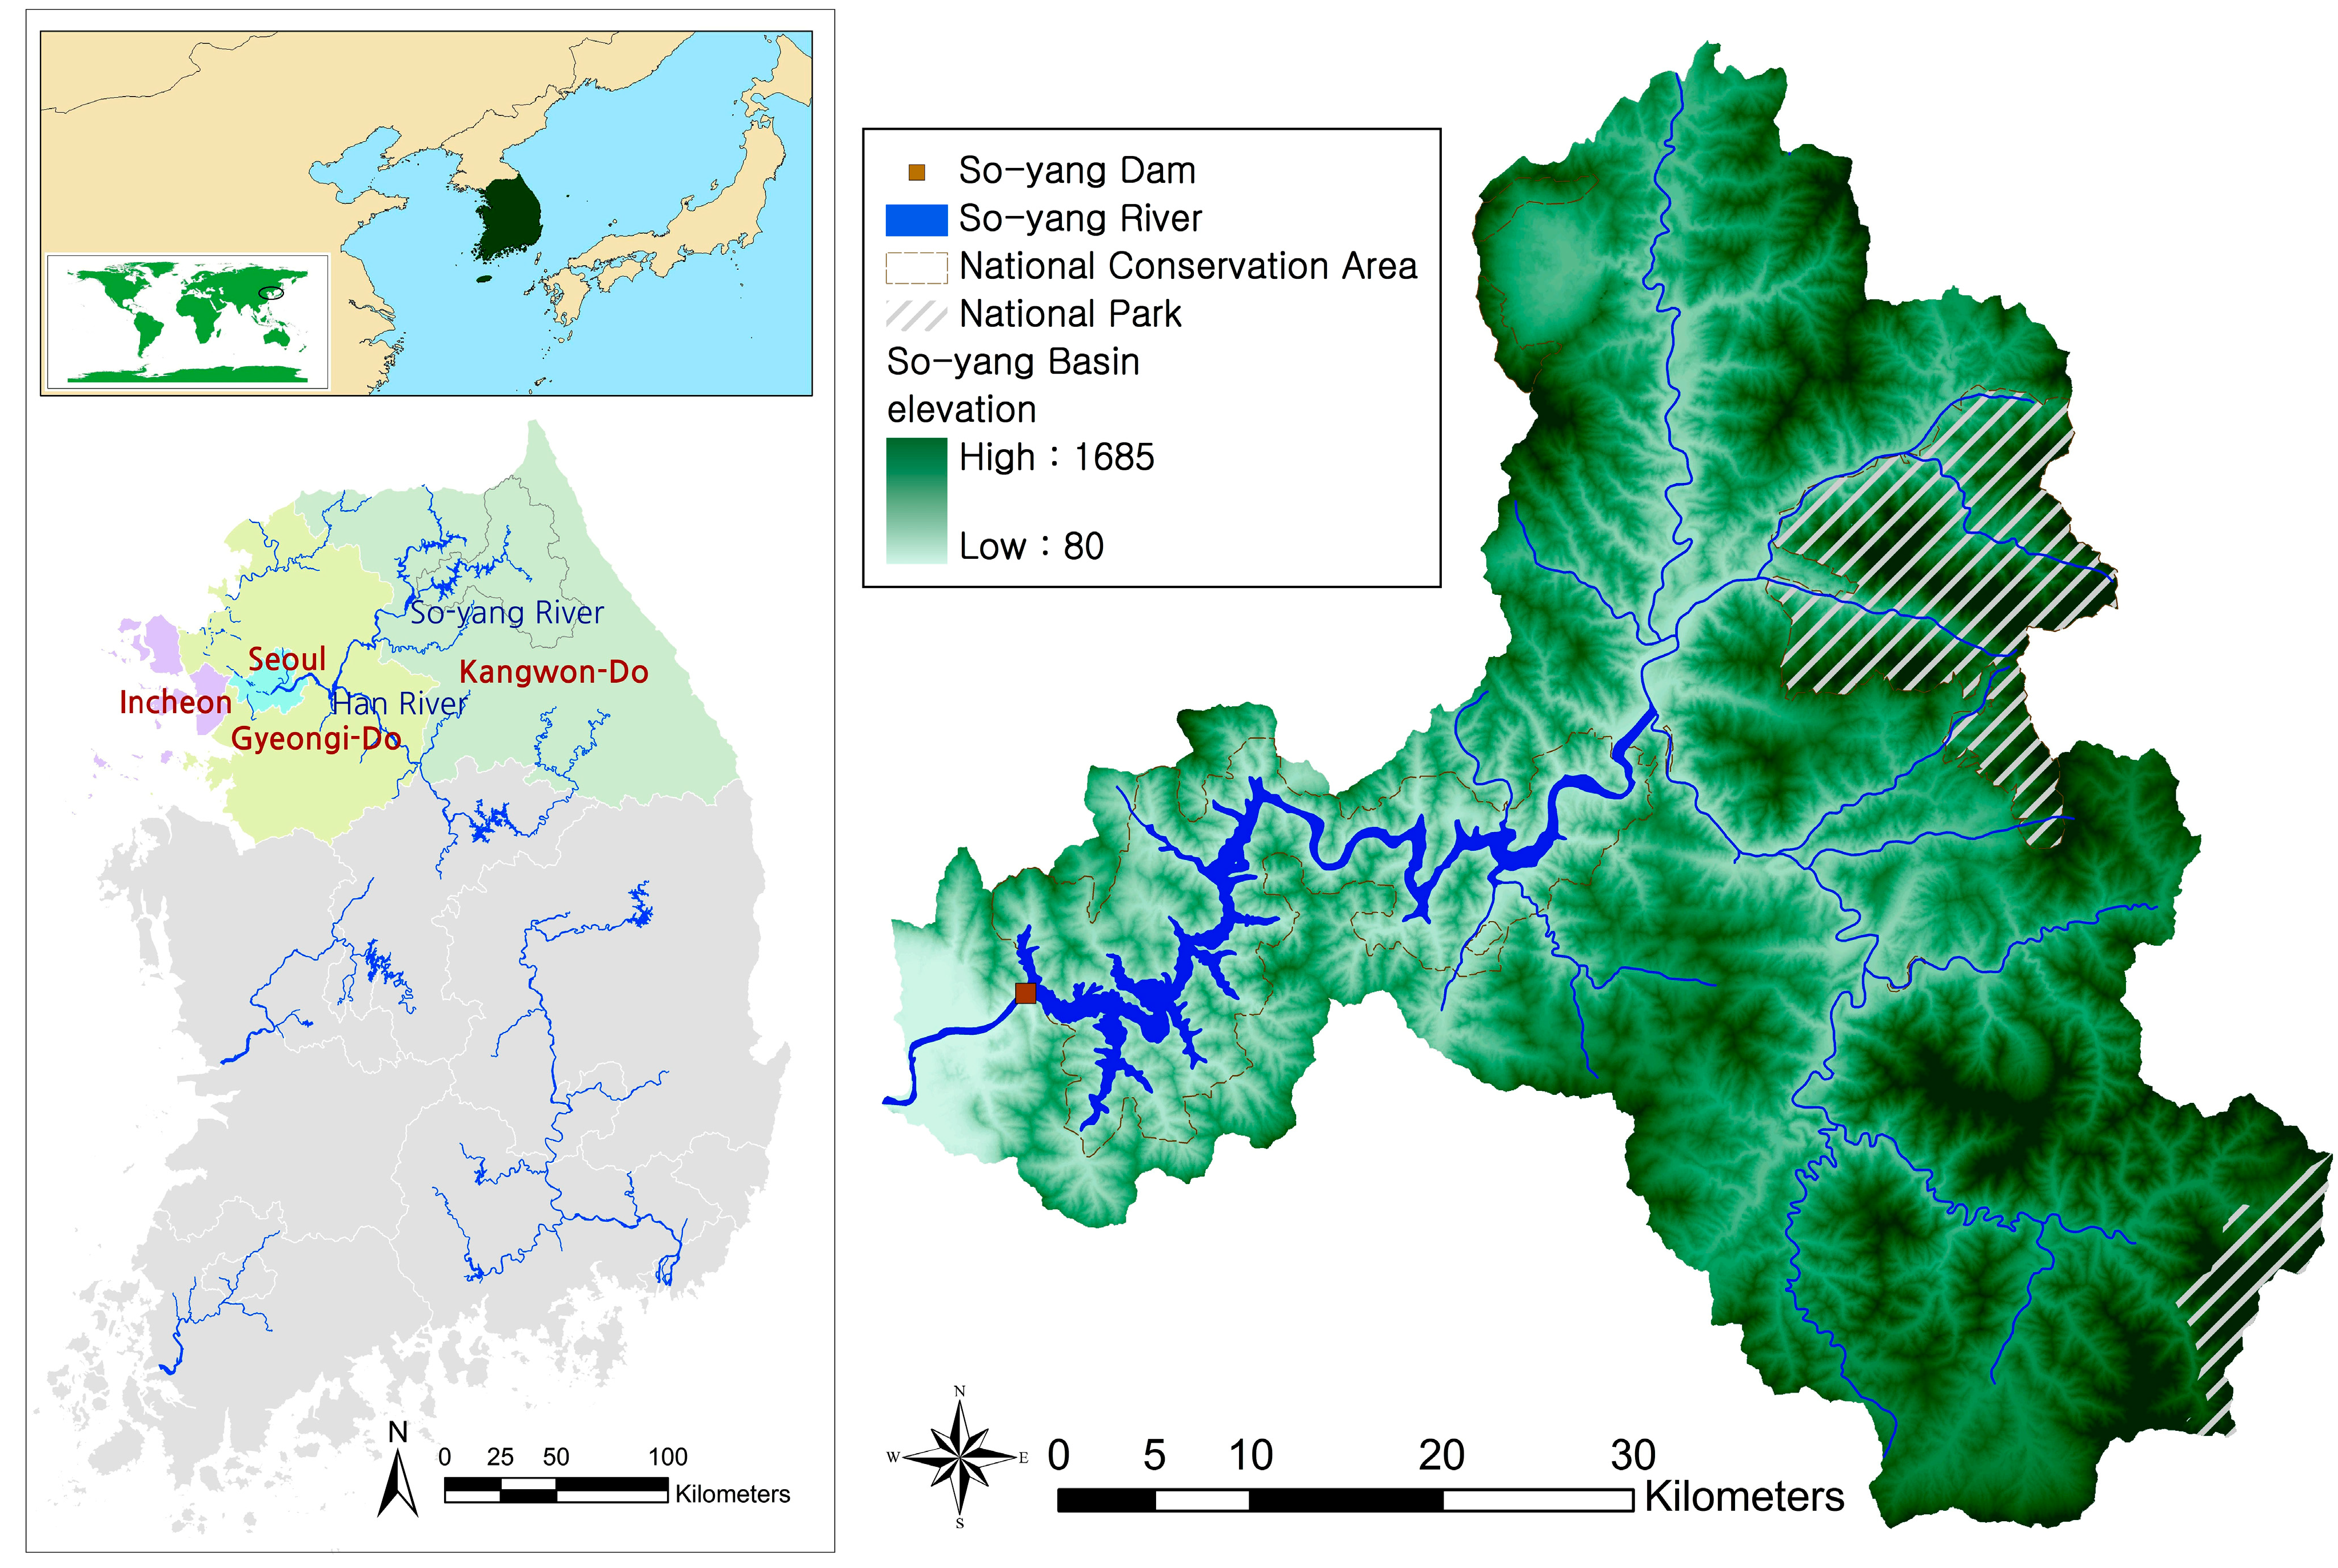
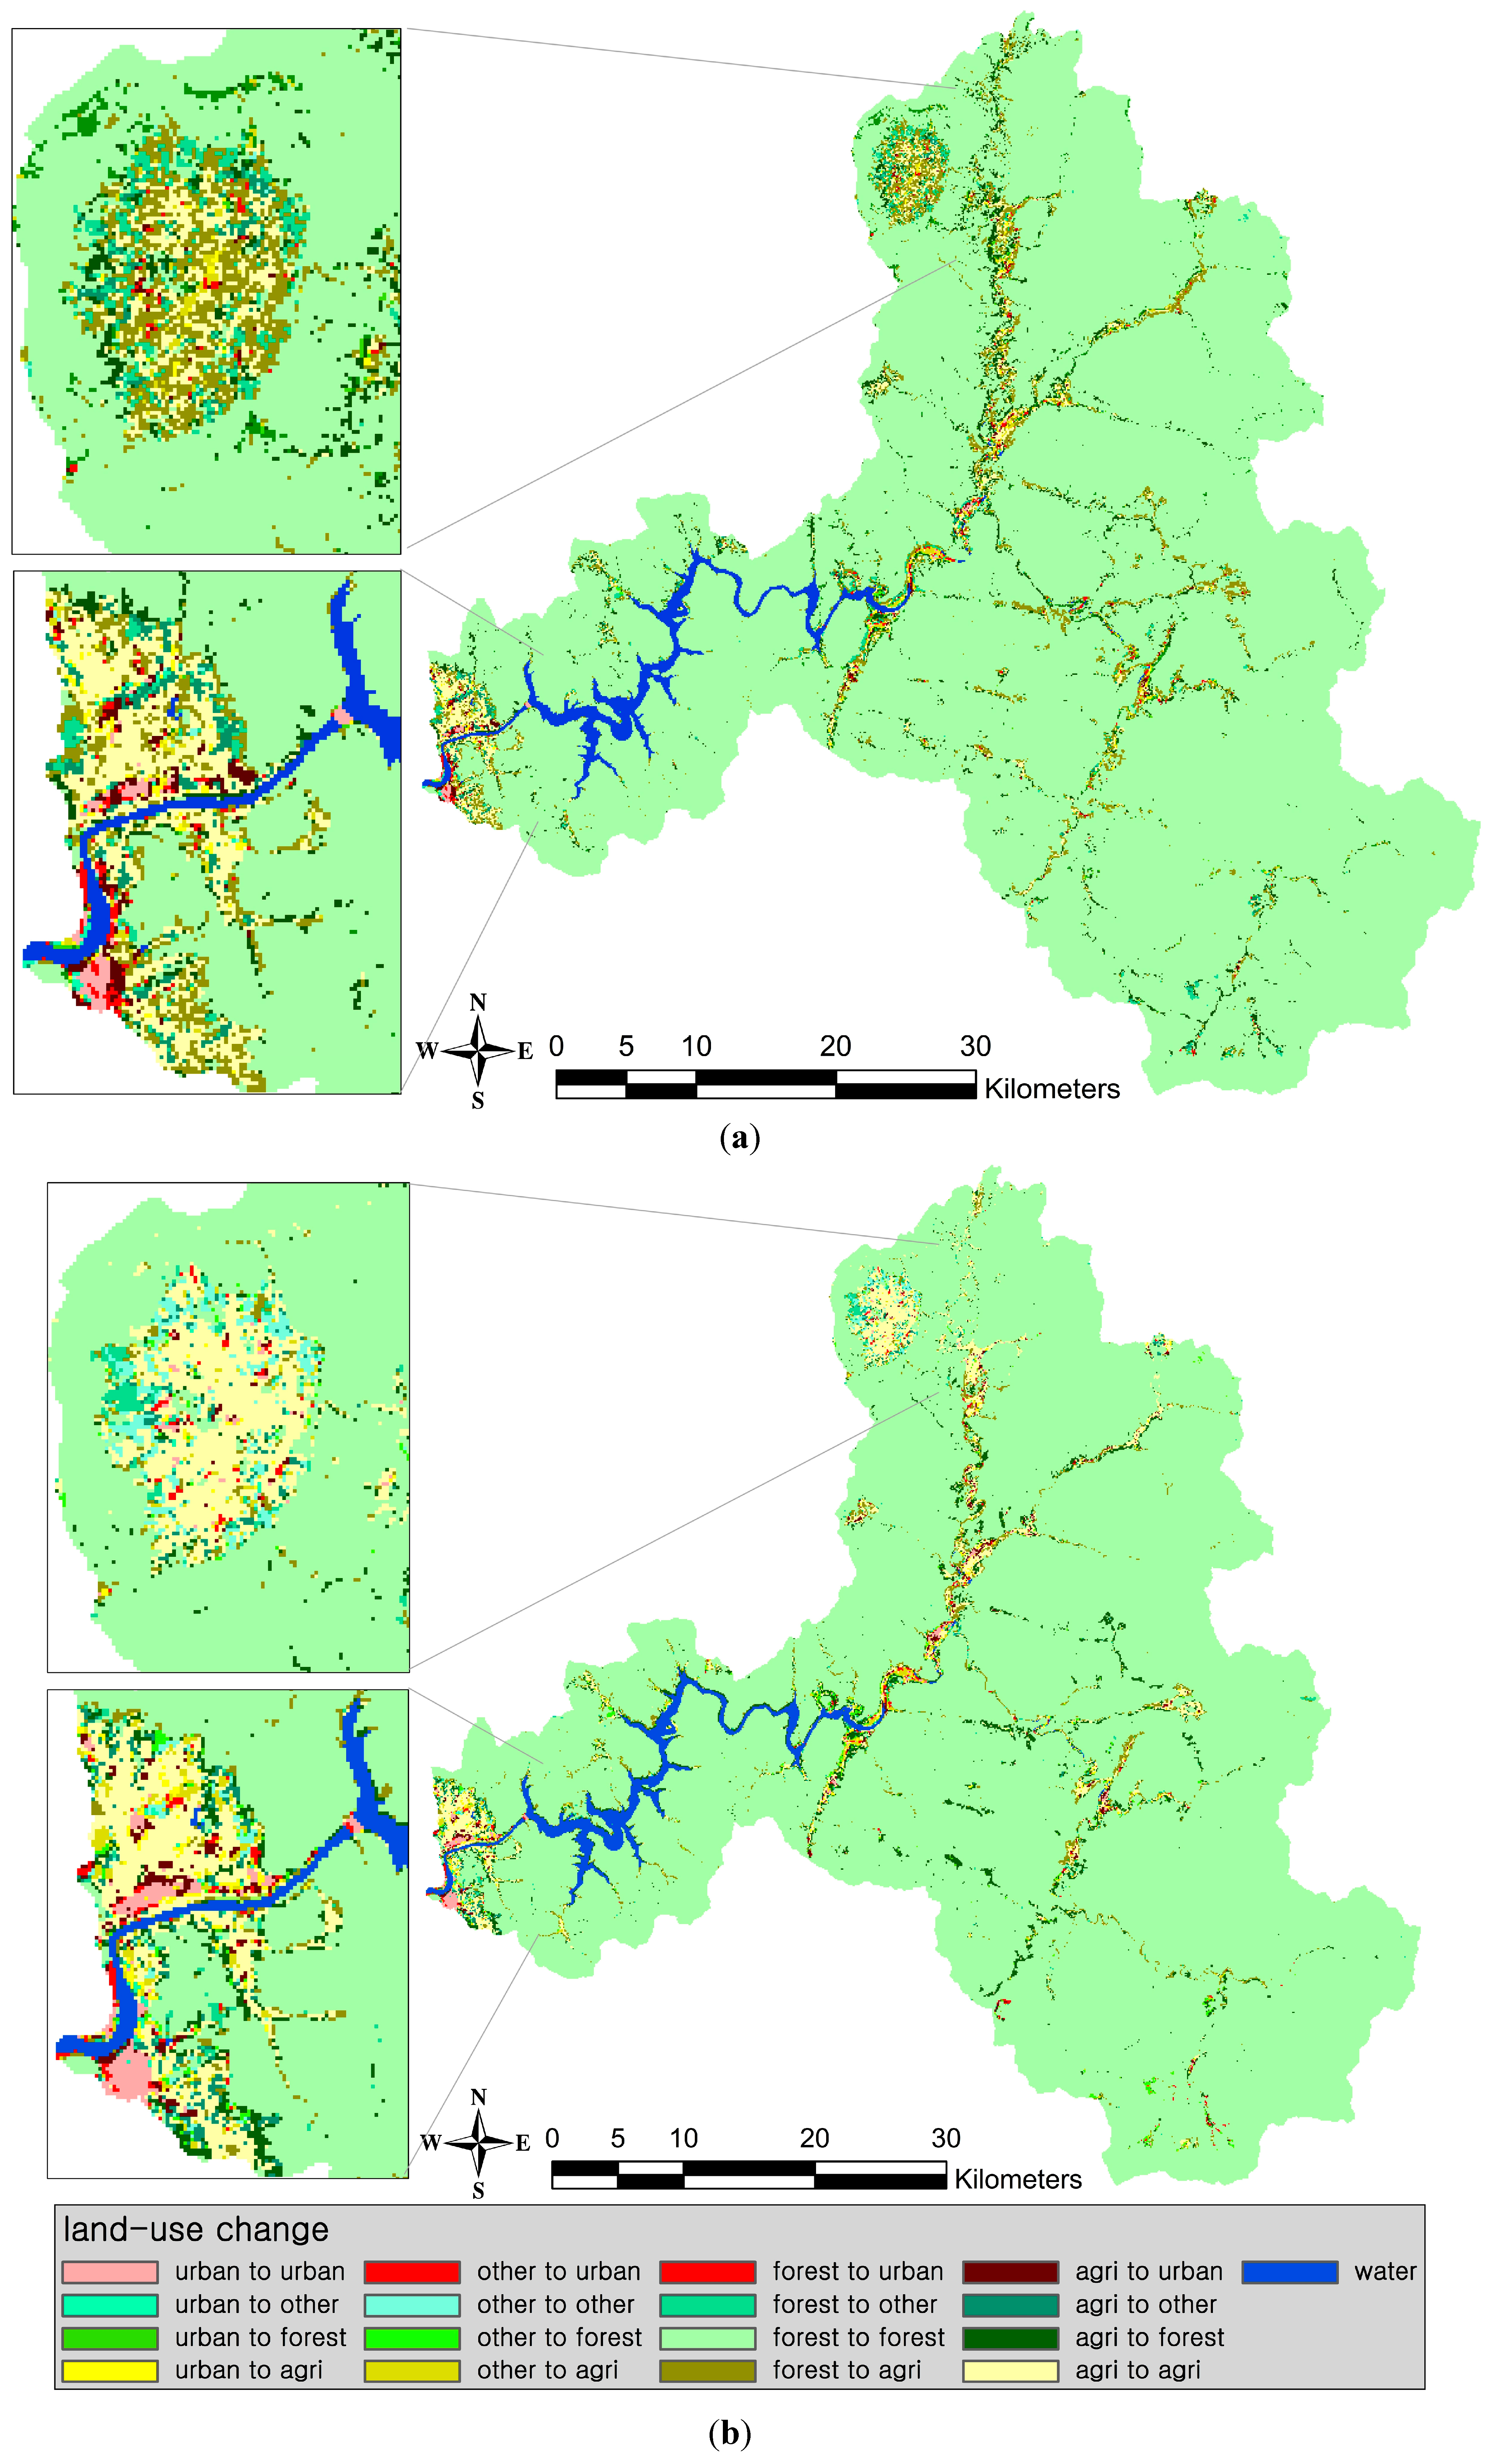
This paper aims to quantify spatio-temporal patterns of land-use and cover changes and their driving factors in a mountainous watershed of South Korea during archetypical periods of land transition (in sensu Foley et al. [1]). The period 1980–1990 is characterized by agricultural expansion, deforestation and moderate urbanization. In contrast the period 1990–2000 shows an agricultural contraction, reforestation but severe urbanization. These two periods represent typical land transitions of the region along an economic development path. To fill the gaps in current understanding of such land and cover change in mountainous areas, we examined the effects of neighborhood land-use and environmental factors on land-use changes along with a wide range of other socio-ecological explanatory factors. The general aim is to support regional land-use planning policy and practice, as well as the development of integrated land-use change models in the case study region or other similar areas.

2. Method

2.1. Study Area

The So-yang River is located in the north-eastern part of the Kang-won province, near the border between South and North Korea (Figure 1). This river is a major tributary of the Han River which originates in North Korea and flows across from North Korea to Chun-cheon in South Korea. The river is regarded as an important source of drinking water for the Seoul metropolitan area and as an important military site near the border of North Korea.
Figure 1. So-yang River Basin in South Korea, Study area (128°19′22″~128°12′11″ N, 37°53′53″~37°58′50″ E).
Land 03 00957 g001
It is difficult to utilize land resources in an efficient way due to geographical characteristics of the region as it is also strongly regulated for environmental (water regulation) and security reasons. Forests, which cover 90% of the land area in the region, although mainly publicly owned, have been excluded from regional development plans. Due to natural (mountainous topographic) and social (regulation policies) constraints, land-uses activities have focused on riverside areas where there are more opportunities to develop agricultural and industrial facilities than forest areas with overlapping land regulations [32]. These limitations on regional development made people immigrate to other urban areas, to find income sources and jobs, and eventually have withered regional economies [32]. Moreover, dam construction in the So-yang River worsened agricultural conditions, with local climate changes and accessibilities to infrastructures adding further to the difficulties [33]. Population in the region decreased following the dam’s construction and urban migration trend in South Korea since 1960’s, this has generated fragmented land use, such as abandoned houses and farm areas [34]. While population and residential areas have decreased in rural upstream counties, there has been urbanization of residential areas and increased sprawl of tourism facilities downstream in Chun-cheon city [34]. Highland farming has expanded since the 1970’s to produce commercial crops in agricultural areas and has become a major income source for farm households [33]. One of the most serious environmental problems related to land-use change by human activities arose in the summer of 2006. During that summer, typhoons and heavy downpours of rain lead to a significant decrease in water quality by siltation and water pollutants from agricultural land. Highland agriculture, where soil is reconditioned to retain soil fertility, is considered as a major source of soil erosion, soil degradation and water pollution [35,36]. In recent years, regional governments have tried to foster organic management of fields, wary of soil and water pollution caused by highland-farming. They offered incentives to people that returned to organic farming [37]. By efforts to improve housing and recreational facilities in the area, some towns have recently experienced population growth [34]. In this situation, it is necessary to understand the characteristics of underlying land-use changes and to identify solutions for future environmental and land-use plans.

2.2. Multinomial Logistic Regression Modeling of Land-Use Changes

Multinomial logistic regression (MNL) is an extended form of binary logistic regression used widely in land-use change studies [15,16]. MNL allows multiple categories as dependent variables that reflect land-use types, while independent variables that reflect land-use change determinants are normally continuous variables [38]. The results from parameter estimation indicate probabilities of change for specific land-use types related to a reference category of unchanged areas, the sum of probabilities for each land-use change are 1 [39]. MNL models estimate the direction and intensity of the dependent variables used as explanatory variables by predicting a probability outcome associated with each category of the dependent variable. The probability that Y = h can be stated as:
P ( Y = h ) = e β   χ l h m = 1 M e β   χ l m
where m denotes the land cover classes used for analysis, β is a vector of estimation parameters and xl are the exogenous variables for all Y and at all locations l. This equation holds, if the error terms are independently and identically distributed as log Weibull [38,40]. Normalizing all probabilities yields a log-odds ratio [38,41]:
ln [ P l h P l m ] = x   l ( β h β m )
The dependent variable is expressed as the log of the odds of one alternative, relative to a base alternative. If model assumptions hold, the maximum likelihood estimators are asymptotically normally distributed, with a mean of zero and a variance of one for large samples. The significance of estimators is tested with z-statistics, which are reported in the output tables. Likelihood-ratio (LR) tests compare the log likelihood from the full model with that of a reduced model omitting explanatory variables. To test the hypothesis with (m-1) parameters, a likelihood-ratio and Wald test can be used [16].
We used MNL models of multi-directional conversions of urban, forest and agricultural types during the periods of 1980-1990 and 1990-2000 to determine patterns and factors of LUCC phenomena reflecting human-environmental interactions (Figure 2). Urbanizations and agricultural expansions are typical examples of human-driven LUCC that have altered the landscape and ecosystems drastically [42]. Forest change is also regarded as a significant LUCC process because it is the dominant cover type in the region and central to the artificial LUCC in the marginal areas.
Figure 2. Three types of multi-directional conversions for three corresponding multinomial logistic regression (MNL) models (Note: Each model will be considered in two periods: 1980–1990 and 1990–2000. (Category with * is used as reference category reflecting unchanged land).
Land 03 00957 g002
Validations of models are evaluated using the area under relative operating characteristics (ROC). The area under the ROC curve (AUC) is an index of discrimination accuracy that can validate possibilities of land-use changes independent of any specified quantity of land-use changes. The index is 1 when the model has perfect assignments to probability of land-use changes. If ROC is 0.5 the model has random probability. If the index is higher than 0.5 the model performs better than chance [43,44].

2.3. Explanatory Factors, Their Causal Hypotheses and Data Sources

Land-use maps of 1980 produced from Landsat MSS with a 60 m × 60 m resolution and 1990 and 2000 produced from Landsat TM satellite imagery with a 30 m × 30 m resolution are obtained from the website of the Korean Water Management Information System [45]. To determine patterns and factors of land-use changes, urban, forest and agriculture land-cover types are selected in this research. Pixels that are classified as water are excluded prior to land use change analyses to simplify extraction of correct land-use types. Variables on land-use changes are diverse and often selected differently according to their expected effect on land-use changes [46]. Environmental variables are mapped at a resolution of 90 m and produced by DIGEM 2.0 software [47]. Rainfall data are interpolated from weather stations data using an Inverted Distance Weight (IDW) method. Distance variables are calculated based on digital base maps, all done by ArcGIS 9.3’s spatial analyst tool. In this research, the environment, distance, neighborhood and population variables reflecting various characteristics of the region are hypothesized as explanatory factors of land use changes.
Table 1. Selected explanatory variables, their hypothesized effects, and data sources.
VariablesAbbreviationHypothesized Effect on Conversion to ...Data Source
UrbanForestAgri
Biophysical
Summer rainfall (mm)S_RAIN+WAMIS 1
Altitude (m)ALT+Aster GDEM
Slope (°)SLO+Extracted from GDEM using DIGEM 2.0 (Conrad, 1998 [47] )
Upslope contributing area (m2/m)UPS+Extracted from GDEM using DIGEM 2.0 (Conrad, 1998 [47])
Wetness index (=in (UPS/tan(SLO))WET+Calculated based on UPS and SLO
Distance
Distance to road (m)D_ROAD+ITS 2
Distance to stream network (m)D_STR+WAMIS
Distance to urban area (m)D_URBAN+WAMIS land-cover maps
Neighboring Land-Use 3
Enrichment factors of urbanEF_URBANi 4+Extracted from LUCC maps
Enrichment factors of othersEF_OTHERi++Extracted from LUCC maps
Enrichment factors of forestEF_FORESTi+Extracted from LUCC maps
Enrichment factors of agricultureEF_AGRIi+Extracted from LUCC maps
Land Regulation Policy
Regulation ZoneREG5+WAMIS
Population
Population density (people/km2)P_DENS++Statistical data
1. WAMIS (Water Management Information System) in South Korea; 2. ITS (Intelligent Traffic System) in South Korea; 3. see Section 2.4 for detailed explanation; 4. where i = optimal neighborhood size of each land-use type (see Section 2.4 for detailed calculation procedure); 5. REG = 0 is no protection mode applied as a redundant variable, REG = 1 is natural conservation code applied from 1971, REG = 2 is national park code applied from 1970.
Rainfall is selected as an expected climate LUCC factor, because rainfall fluctuation and amounts generate changes in crop yields and land-use practices [48]. In this research, we used summer rainfall, because rainfall is centered in the summer monsoon and typhoons, generating significant flood damage to agricultural and urban areas. Among independent variables, geomorphologic factors reflecting topographic conditions are important for determining land-use changes. Elevation is regarded as a significant LUCC factor, as while lower elevation areas along rivers are generally more suitable for human settlements and agricultural activities than higher areas [49]. Slope is important for determining factors of land-use changes especially in mountainous areas, because residential areas are characterized by lowest slope and agricultural lands are organized around the residential areas with gentle slopes [50]. Upslope contributing area, reflecting runoff and flow of water, is selected as a factor representing potential and risk of agricultural production [51]. Wetness index is also an important variable and represents temporary spatial flow of water bodies in the event of rain. It is selected to determine hydrological influences on land-use changes and interactions between hydrology, soil, climate, and land-use [52]. Distance to urban areas, roads, and streams as natural and artificial land-use change factors are set as LUCC factors because anthropogenic land-uses largely take place near roads and existing urban areas [53], as well as near river systems. Interactions between neighboring land-use types are major LUCC factors in many land-use models which influence decision-making processes of land-users and land-use policies. As patterns of land-use changes have self-organizing characteristics, such as urbanization, neighborhood interactions are considered as major factors of LUCC [20]. Moreover, phenomena of LUCC such as urbanization, forestation and agricultural expansion are likely to occur in boundary areas. For these reasons, enrichment factors to reflect neighborhood interactions are selected as expected driving factors. Human population is also a significant driving factor of LUCC. Urbanization and agricultural expansion are driven by population growth, while population changes affect regional socio-political and economic conditions [54]. Land regulation policies as a form of land zoning are significant land-use change factors, causing land use and environmental changes such as mitigation of deforestation [55]. In the So-yang River Basin, there exist many overlapping zoning policies to protect mountain and water sources [32]. We selected two zoning policies, one is a national conservation area, which was set to protect water sources and mountainous ecosystems and the other is a national park which was established to manage mountain resources under strong regulation. These two zoning policies are merged into one regulation variable as a categorical variable in our model, where a value of 1 is natural conservation areas designated in 1975 and value of 2 is Sol-ak National Park designated in 1970, which means stronger land regulation to protect forest resources. These expected driving factors are hypothesized as expected determinants of land-use changes (Table 1).

2.4. Neighborhood Interactions of Land-Use

Neighborhood relationships to land-uses are regarded as important land-use change factors. Neighborhood relations are spatial interactions with adjacent areas who’s influence diminishes with distance [56,57]. To analyze and quantify neighborhood characteristics of land-use change, we used the concepts and methods of land-use enrichment factors, as proposed by Verburg et al. [21]. The enrichment factors refer to the abundance of a land-use type in the neighborhood of a specific raster cell, determined by the occurrence of the specific land-use type in the entire area [21,58,59]. The equation for enrichment factors is as follows:
F i , k , d = n k , d , i / n d , i N k / N
where Fi,k,d characterizes the enrichment of neighborhood d at location i with land-use type k. The shape and distance of the neighborhood from the central cell i is identified by neighborhood d (Figure 3). The result for each cell i means enrichments factors for the different land-use types k. This calculation is repeated for varying neighborhood sizes at different distances d. After this calculation, the average neighborhood characteristic for a specific land-use type l is calculated by extracting the average of the enrichment factors for all grid cells into a certain land use type l.
F ¯ i , k , d = 1 N i L F i , k , d
where L is the set of all locations with land-use type l and Nl, the total number of grid cells within this set. In this study, we used ArcGIS based calculations of enrichment factors as done by Hallin-Pihlatie [58]. The enrichment factors are presented on logarithmic scales to obtain equal scales for land-use types that occur more than average in the neighborhood (enrichment factor > 1) and less than average in the neighborhood (enrichment factor < 1). When the values are close to 0, there are no neighborhood effects for land-use and land cells are randomly distributed compositions of a random selection of grid-cells regardless of neighborhood effects. After calculating neighborhood enrichment factors, optimal neighborhood extent to give highest level of neighborhood explanation is selected for each land-use type [21]. As optimal neighborhood sizes are varied for each land-use type, different neighborhood sizes are considered in this model.
Figure 3. Configuration of neighborhood size (advised from Verburg et al. [21] ).
Land 03 00957 g003

3. Results

3.1. Temporal Land Cover Changes between 1980 and 2000

In the first period from 1980 to 1990, the study area experienced growth in urban and agricultural areas as well as loss in forest areas. Although urban classes had low shares in the region, the rate of change in these classes is higher than for other land-use classes. Agricultural land-use increased in this period where forest remained constant as can be seen in (Table 2). Land-use change patterns between 1990 and 2000 show differences when compared to the earlier period. While urban and forest areas have increased, agricultural land decreased in the later period. These land-use changes mainly occurred due to urban expansions in the Chun-cheon area. Forest changed to a small degree under the influence of zoning of national protection areas, which made it difficult to utilize forest resources.
Table 2. Land-use changes between 1980 and 2000.
Land-CoverArea (km2)Net Change80–90 (% of Initial Area)90–00 (% of Initial Area)
19801990200080–90 (km2)90–00 (km2)
Urban8.1611.4119.333.256.7139.7852.87
Forest2428.682411.702430.82−16.9719.10−0.700.79
Agriculture108.01119.81113.0311.80−6.7810.93−5.66
Others18.1520.0816.811.93−6.2410.62−27.12

3.2. Neighborhood Factors of Land-Use Changes

To understand interactions of enrichment factors with land-use changes, we calculated neighborhood enrichment factors of pixels with land-cover changes in ArcGIS. Enrichment factors of changing areas of specific land-use types between 1980 and 1990 are presented in Figure 4. Most land-use types with neighborhood factors tend to become less influenced with increasing distance to the central cell. From this result, it was apparent that urban and agricultural land-use changes in these regions are related to existing urban areas, while forest expansion is mostly situated near land-use types such as grasslands and bare soil. All considered land-use types show negative correlations with forest enrichment factors, which are reflected in land-use changes. These occur less frequently in mountainous areas with forest, and also for forest expansions. These tendencies are also present in the next period between 1990 and 2000. New urban areas are located near the neighboring areas of existing urban lands, while forest and agricultural growths occur in the neighborhood of other land types and urban areas as seen in Figure 5. Land-use changes in this period also appeared in the areas dominated by forest, which have similar enrichment factors of distance and neighboring areas in comparison with the earlier period.
Figure 4. Temporal land-use changes between 1980-1990 (a) and 1990-2000 (b) in the So-yang River Basin.
Land 03 00957 g004
Compared to urban and agricultural land-use, new forest areas are more easily affected by the neighboring land-use as seen in Figure 5 and Figure 6. Hence, enrichment factors of all land-use types to new forest areas reach threshold points with drastic decreases of neighboring enrichment factors.
Figure 5. Enrichment factors (EF) of land-use changes between 1980 and 1990.
Land 03 00957 g005
Figure 6. Enrichment factors (EF) of land-use changes between 1990 and 2000.
Land 03 00957 g006
The enrichment factors with the highest values for each land-use are used as boundaries determining neighborhood land-use variables in logistic regression analysis. In many cases, neighborhood relations are visible for the immediate neighbors. With these nearest neighbors, enrichment factors with neighborhood size (7 × 7 grid size) are used in logistic regression to represent influences of neighboring urban lands to new urban and agricultural areas, and the influence of neighboring forest to new agricultural areas in the first decade. In the later period, enrichment factors with neighborhood size (5 × 5 grid size) are added to represent influences of both neighboring forest and agricultural areas to new agricultural areas and neighboring urban areas to new urban areas.

3.3. Land-Use Change Factors from Logistic Regression

To extract land-use change factors and quantify the influence of explanatory variables, multinomial logistic regression models are applied. The statistical analyses are conducted for all grid cells in the region. The results of logistic models are illustrated for each land-use type in Table 3, Table 4, Table 5, Table 6, Table 7 and Table 8. These models are applied to areas with a high probability of land-use change between two time periods. Odds ratio values indicate changes in odds of land-use changes upon changes on independent variables (explanatory variables) [20]. The values between 0 and 1 indicate that an increase in the values of independent variables leads to a decrease in possibility of land-use changes. On the contrary to this, values above 1 indicate that an increase in values of independent variables leads to an increase in possibility of land-use changes. [20]. In statistical results, environmental and neighborhood variables have higher or lower odds ratio values than distance variables with values around 1. This result could be interpreted as land-use changes are more likely influenced by changes on environmental and neighborhood variables. These logistic models have good explanatory ability with high degrees of AUC values with 0.751–977 (see Table 3, Table 4, Table 5, Table 6, Table 7 and Table 8), which mean that land-use changes could be explained by independent variables [9,20]. These results make it possible to simulate locations of land-use change areas based on the independent variables used in this study.
Results of urban change models are shown in Table 3 and Table 4. Major driving factors affecting urban conversion are elevation and neighboring urban areas with significant probabilities. Urban areas with high elevation and small patches are easily converted to other land-use types. In the case of urban land-use changes, environmental factors like elevation and slope are less affected by urban changes when compared with other land cover changes.
Table 3. Factors of urban land-use changes using logistic regression (1980~1990).
VariableUrban to OthersUrban to ForestUrban to Agriculture
Coefficient (B)Odds RatioCoefficient (B)Odds RatioCoefficient (B)Odds Ratio
S_RAIN0.013 **1.013−0.0020.998−0.0050.995
ALT0.010 **1.0100.011 **1.0110.005 *1.005
SLO0.0051.0050.084 **1.0880.0151.015
UPS−0.766 *0.465−0.3640.695−0.598 *0.550
D_RIV0.001 *1.0010.000 *1.0000.0001 **1.001
D_STR0.0001.0000.0011.001−0.0010.999
P_DENS0.0001.0000.0001.0000.000 **1.000
EF_URBAN7−0.019 **0.981−0.024 **0.976−0.012 **0.988
EF_FOREST7−4.875 **0.006−0.4016690.4161.515
EF_AGRI7−0.122 **0.865−0.155 **0.856−0.0190.982
Constant−6.647 1.162 5.492
AUC0.765 0.886 0.790
*: Significant at p < 0.05; **: Significant at p < 0.01.
Table 4. Factors of urban land-use changes using logistic regression (1990~2000).
VariableUrban to OthersUrban to ForestUrban to Agriculture
Coefficient (B)Odds RatioCoefficient (B)Odds RatioCoefficient (B)Odds Ratio
S_RAIN0.016 *1.0160.020 **1.0090.0061.006
ALT0.0001.0000.003 **1.003−0.001 *0.999
SLO−0.094 *0.9100.0071.007−0.058 **0.944
D_STR0.002 **1.0020.0001.0000.0011.001
D_URBAN−0.0090.9910.016 **1.0160.014 **1.014
P_DENS−0.003 *0.997−0.004 *0.996−0.002 **0.998
EF_URBAN5−0.024 **0.977−0.016 **0.983−0.014 **0.986
EF_FOREST5−2.974 *0.0513.979 **53.4581.313 **3.717
EF_AGRI7−0.0730.9300.132 **1.1410.0440.1.045
REG = 1−1.0700.3431.185 **3.2720.3781.459
REG = 20.4061.50016.8041.985 × 10716.4221.355 × 107
REG = 00 0 0
Constant−11.841 −18.684 −3.787
AUC0.751 0.901 0.804
*: Significant at p < 0.05; **: Significant at p < 0.01.
Results of land use change models in relation to forests are shown in Table 5 and Table 6. Forest land-use changes are related to environmental factors and neighboring forest areas. In the case of forest changes, forest neighborhood variables show different correlation directions according to size of forest and neighboring urban areas.
Agricultural land-use models are shown in Table 7 and Table 8. Agricultural land-use changes have similar environmental driving factors as urban growth. These environmental factors reflecting topographical conditions are less influential to agricultural changes than forest.
Table 5. Factors of forest land-use changes using logistic regression (1980~1990).
VariableForest to UrbanForest to OthersForest to Agriculture
Coefficient (B)Odds RatioCoefficient (B)Odds RatioCoefficient (B)Odds Ratio
S_RAIN−0.0010.9990.0001.000−0.009 **0.991
ALT−0.001 **0.9990.0001.000−0.003 **0.997
SLO−0.150 **0.860−0.117 **0.890−0.098 **0.907
UPS−0.0100.9900.2981.3470.219 **1.245
D_STR−0.001 *0.9990.0011.001−0.001 **0.999
D_URBAN−0.002 **0.998−0.001 **0.999−0.001 **0.999
P_DENS0.0001.0000.0001.000−0.001 **0.999
EF_FOREST31.815 *6.1432.005 **7.4230.737 *2.089
EF_FOREST7−6.513 **0.001−6.137 **0.002−3.583 **0.028
EF_AGRI70.0361.0370.0421.0430.103 **1.108
REG = 1−1.1250.3250.988 *2.685−0.410 **0.664
REG = 21.936 *6.934−18.3561.067 × 10−8−0.856 *0.425
REG = 00 0
Constant3.091 0.130 7.996
AUC0.977 0.953 0.950
*: Significant at p < 0.05; **: Significant at p < 0.01.
Table 6. Factors of forest land-use changes using logistic regression (1990~2000).
VariableForest to UrbanForest to OthersForest to Agriculture
Coefficient (B)Odds RatioCoefficient (B)Odds RatioCoefficient (B)Odds Ratio
ALT−0.0020.998−0.003 **0.997−0.005 **0.995
SLO−0.093 **0.911−0.076 **0.927−0.066 **0.936
UPS0.0611.0630.1031.1090.369 **1.446
D_STR−0.003 *0.9970.0001.000−0.001 **0.999
D_ROAD−0.0010.9990.0001.0000.000 **1.000
D_URBAN−0.003 *0.9990.000 *1.000−0.001 **0.999
EF_FOREST32.98119.7044.794 **120.751−0.5280.590
EF_FOREST5−4.849 *0.008−8.733 **0.000−0.4570.633
EF_AGRI70.0861.089−0.068 *0.9340.162 **1.175
Constant−0.429 1.504 −0.330
AUC0.951 0.939 0.942
*: Significant at p < 0.05; **: Significant at p < 0.01.
Table 7. Factors of agricultural land-use changes using logistic regression (1980~1990).
VariableAgriculture to UrbanAgriculture to OthersAgriculture to Forest
Coefficient (B)Odds RatioCoefficient (B)Odds RatioCoefficient (B)Odds Ratio
S_RAIN0.0011.0010.010 **1.009−0.002 **0.998
ALT0.001 *1.0010.002 **1.0020.003 **1.003
SLO−0.050 **0.9510.0131.0130.096 **1.100
UPS0.0431.0440.386 **1.4710.096 *1.101
D_STR0.001 **1.0010.001 **1.0010.0001.000
P_DENS0.001 **1.0010.001 **1.0010.0001.000
EF_URBAN70.014 **1.014−0.006 *0.994−0.013 **0.987
EF_FOREST30.1561.169−0.759 **0.468−0.610 **0.544
EF_FOREST7−1.0130.363−2.091 **0.1240.958 **2.606
EF_AGRI7−0.0160.985−0.0300.970−0.085 **0.919
REG = 10.793 *2.2091.535 **4.6420.0181.018
REG = 2−0.7130.4900.3001.3500.2741.315
REG = 00 0 0
Constant−2.996 −9.419 −0.365
AUC0.821 0.778 0.785
*: Significant at p < 0.05; **: Significant at p < 0.01.
Table 8. Factors of agricultural land-use changes using logistic regression (1990~2000).
VariableAgriculture to UrbanAgriculture to OthersAgriculture to Forest
Coefficient (B)Odds RatioCoefficient (B)Odds RatioCoefficient (B)Odds Ratio
S_RAIN−0.0010.9990.017 **1.0170.015 **1.015
ALT0.0001.000−0.003 **0.9970.002 **1.002
SLO−0.020 **0.9800.022 **1.0220.052 **1.054
D_STR0.0001.0000.001 **1.0010.000 **1.000
D_URBAN−0.003 **0.9970.0001.0000.001 **1.001
P_DENS0.000 **1.0000.0001.000−0.001 **0.999
EF_URBAN50.021 **1.022−0.013 **0.987−0.0020.998
EF_OTHER50.014 **1.014−0.0020.9980.008 **1.008
EF_FOREST5−0.3630.695−2.386 **0.0921.851 **6.368
EF_AGRI30.0191.019−0.039 *0.9620.061 **1.063
EF_AGRI7−0.0270.974−.131 **0.877−0.071 **0.932
REG = 1−0.0620.9400.382 **1.4650.478 **1.612
REG = 2−2471.2800.9042.4690.3801.463
REG = 00
Constant−1.126 −13.526 −14.193
AUC0.798 0.785 0.781
*: Significant at p < 0.05; **: Significant at p < 0.01.

4. Discussion

4.1. Driving Factors of Land-Use Changes

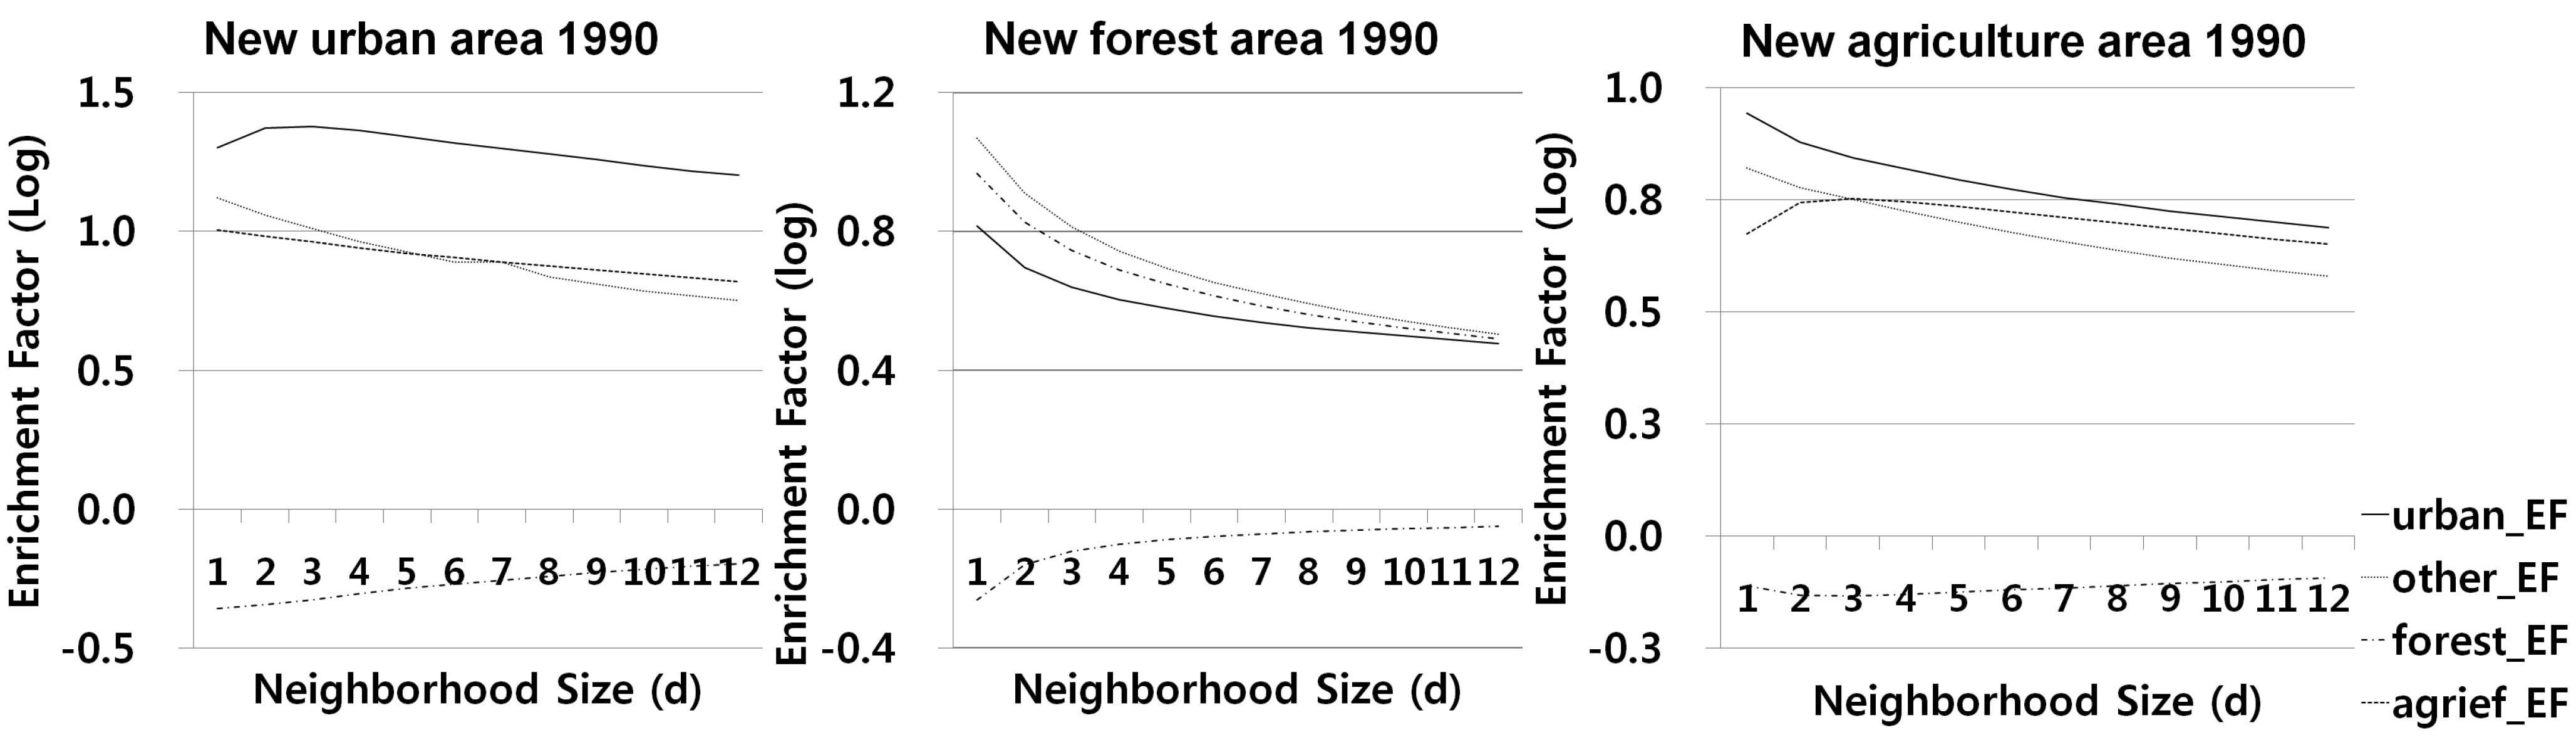
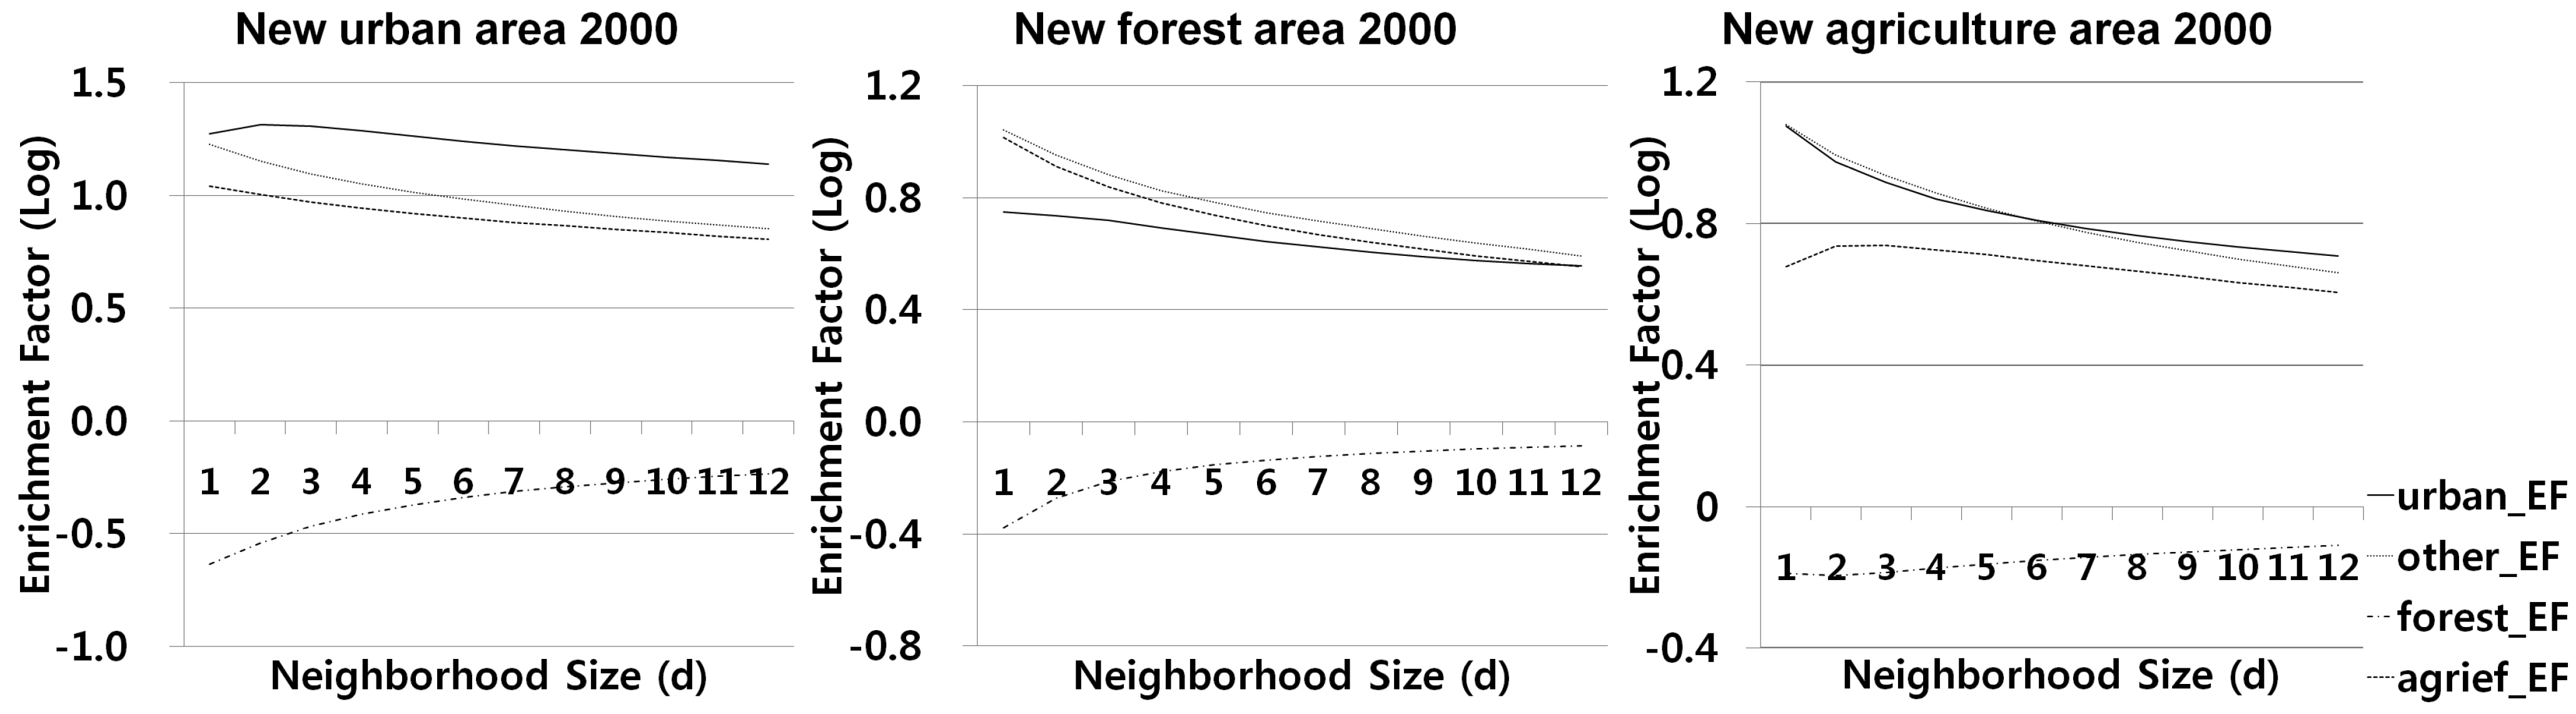
In this study, we identified land-use change patterns in the region, which could be compared with archetypical periods of land transition. After that, we extracted variables, which were used as independent variables in multinomial logistic models to analyze land-use changes in the So-yang River Basin. Our statistical analysis suggests that land-use change factors and enrichment factors show different patterns for the two different time decades, where the degree of some results of the relations of correlation coefficients and directions of effects vary. Although most results correspond with the research hypothesis of factors of land-use changes, some results were unexpected.

4.1.1. Driving Factors of Land-Use Changes in 1980–1990

Biophysical drivers: The first decade was characterized by agricultural expansions, deforestation and urbanization. During the period after a highway to Seoul was constructed in 1975, commercial highland agriculture increased in the Kangwon province, because it was regarded as a new economic income source in rural mountainous areas [60]. During this period, the impacts of environmental factors like summer rainfall, elevation and slope are in accordance with our hypotheses. We hypothesized that summer rainfall has negative explanatory power in relation to urban and agricultural land-use. This is due to the environmental characteristics of the research site, as people in this region have experienced flood damage frequently due to monsoon periods and typhoons. From the analysis, we could find that agricultural areas are easily changed into other land type areas with lower summer rainfall. Topographic factors, specifically elevation and slope have negative correlations to human induced land-use changes, as expected. Areas with low elevations and gentle slopes are easily converted to agricultural and urban areas, while forest expansions occurred in areas with low accessibility due to topographic limitations. This result is in concurrence with other studies on agricultural abandonment of mountainous areas in Europe [61] and Asia [62]. As for upslope contributing areas and wetness index reflecting hydrological and geomorphologic aspects, areas with low upslope contributing area index were converted to agricultural land in the first time period, which does not coincide with our research hypothesis. This result could be explained with rainfall characteristics in the region. Areas with less rainfall intensity during monsoon periods are preferred for new agricultural areas, reflecting the importance of water inflows at upper slopes.
Distance factors and population density: Distance factors and population density have low explanatory powers compared to other variables. This result can be attributed to the fact that land-use changes occur in the narrow basin area of the river, which make it difficult to clarify distance effects. Previous research on forest transition in South Korea concluded that the population factor is one of the major land-use change factors in mountainous areas [30]. However, population density shows insignificant explanatory power to explain land use changes from our statistical analysis.
Neighboring land use: Forest areas highly were correlated with neighboring forest factors, especially neighborhood factors of 7 × 7 grid cells. This suggests that land-use changes in the region resulted from spatial policies to restrain urban and agricultural changes near forest areas for security and environmental reasons. Agricultural land in areas dominated by forest is easily converted to forests, which might in addition reflect natural conversions of abandoned fields. However, areas nearest to forest also experienced land-use changes to both urban and agricultural lands. These land-use changes led to highland agriculture occurring in the marginal forest areas. These results show that factors that affect land-use changes differ for each land-use class due to their spatial relations. However, differences between the causal patterns of land use changes in the two periods (1980–1990 and 1990–2000) are relatively low, with the exception of changes of agricultural land-use, meaning that similar driving factors and mechanisms affect land-use changes constantly.
Land regulation policies: Land regulation policies during this phase did not affect urban land-use changes because there already were a few urban areas located in regulation areas. Sol-ak National Park was designated within the Tae-baek mountain range and had been managed strictly since then because it is one of the most famous national parks and sightseeing areas in South Korea. The national park did not affect land-use changes directly after 1980’s. However, forest changes next to urban areas in the 1980’s could be interpreted by the way that tourism facilities in the park areas were increased more than other urban land use types in this period. Comparing national parks and national conservation areas, the latter are more influential with respect to agricultural land-use changes. Since national conservation areas are designated to protect water quality in So-yang Lake, farmlands and farmers were directly affected by this policy and this led to agricultural contraction.

4.1.2. Driving Factors of Land-Use Changes in 1990–2000

Most land-use change factors hypothesized in this research have consistent explanatory powers between the two different time periods. Although similar factors affect to land use changes steadily, there are some differences of land-use change patterns between earlier and later stemming from the decrease of agricultural areas in the second phase. During this period, agriculture decreased all over the catchment except centralized highland agriculture areas such as Hae-an Myeon and Ja-won Ri. This change also generated different results in statistical analysis of land-use change factors.
Biophysical drivers: The explanatory power of rainfall is opposite for forest and agricultural land use changes. Agricultural areas with higher summer rainfall are easily converted to forest areas because of problems derived from an increase of summer rainfall [63], which could generate planned forestation in the agricultural areas to prevent flood damages in the region. In the earlier period, topographic variables of elevation and slope explain urban and agricultural expansions. However, these tendencies have changed in the subsequent period from 1990 to 2000 indicated by influences of slope factors on agricultural lands. In the later period, areas with gentle slope were more easily converted to agricultural lands. This result reflects expansions of highland farming into smooth mountainous areas. In contrast to urban and agricultural expansions, forest expansion occurs at higher elevations and with increased slope, typically abandoned lands with limited use, especially those within national conservation areas. Due to the land regulations at these sites, forest growth occurred in the processes of natural conversion. This difference stems from geomorphologic characteristics of mountainous areas.
Distance factors, population density, and neighborhood land-use: These factors are similar to their results of MNL analysis when compared with the earlier period of 1980-1990. Distance and population factors are still less affected land-use changes. Neighborhood factors in the later period affect land-use change similarly to those of the earlier period.
Land regulation policies: Land-use in urban areas affected by land regulation in the later period, barely changes for the entire period.

4.2. Underlying Factors of Land-Use Changes in the So-Yang River Basin

We tried to find driving factors of land-use changes. However, land-use changes are affected by various factors because of the complex characteristics of human-environmental systems, which are difficult to derive from statistical results. In this chapter, we described underlying factors from literature reviews and briefly compare them with the statistical results which are suggested as major land-use change factors in the local communities.
With respect to urban areas, deregulation in green belt areas to ease local development and improve accessibility by constructing roads and bridges are important land-use change factors [64]. In particular, policy changes in 1994 to utilize lands surrounding water sources generated expansions of urban areas in the marginal forest [65]. However, results of statistical analysis with distance and neighboring factors could not support these findings.
Land abandonment with population migration after zoning policies and dam constructions since 1970’s generated growth of natural forest. So-yang Lake generates local climates changes, such as increased days with fog and frost, which worsen agricultural conditions and productivity as well as residential health status [33,60]. Moreover, dam constructions brought about a raise of agricultural and living costs by worsening accessibility, and while zoning policies made it more difficult to utilize lands efficiently and get higher income [32,33]. These underlying factors could be linked with the results for topographic variables.
Although overall agricultural areas decreased during the period, agricultural expansions occurred in highland farming areas influenced by socio-economic factors such as income improvement in highland crops and support policies for agriculture, which expand cultivation areas of household and reclamation of forest areas [65]. Apart from this reason, political factors affected agricultural land-use changes. Korean agricultural households and societies faced economic crisis after the launch of WTO systems in 1995. To solve this problem, the central government tried to introduce various policies to maintain agricultural sectors, such as farm subsidies and deregulations in agricultural land uses. The Korean government introduced a direct payment system for aged farmers’ early retirement and environmentally friendly farming practice since the late 1990’s to preserve the income of rural households and promote environmentally friendly farming as a new income source [66]. Regulation policies, such as maximum holdings of farmland and lands to the tillers principle regulating landholdings of no-till farmers, were regarded as troublesome factors for agricultural activities in agricultural areas. After the government eased these regulations, land owners could easily increase their land extent with advanced technologies. Aside from these political factors, recent climate changes brought about agro-environmental changes such as temperature rise, intensive rainfall in summer monsoon periods, reduced sunshine hours and fruit cultivation areas advancing north, in the Tae-back mountain range as well as other high elevation areas [63].

4.3. Limitations and the Way Forward

The challenge of this study is related to acquisition of spatial data for land-use changes, population data for driving factors and land use regulation maps for the research site. Land use maps used in the research were produced by an institution of the Korean government as explained in the earlier chapter. Although they had higher reliability compared to other maps, these also had problems with accuracy of classification because they were produced based on different Landsat satellite images. Maps of 1980 were built on Landsat MSS with 60 m resolution, however other maps of 1990 and 2000 were based on Landsat TM with 30 m resolution. This resolution differences may reduce accuracies of “trace” LUCC (i.e., the LUCC areas with only a few 30 m × 30 m pixels. As these differences could affect data accuracy, we used these data by merging pixel resolution, thereby reducing this problem.
Data acquisition significantly affects the accuracy of the land use model [11]. In our study, it was especially problematic to get socio-economic data for detailed administrative areas and to convert these data into spatial data. Although some policy factors like zoning area have spatial dimensions for policy implementations, such low spatial differences of this variable within the study area weakened the measurement of its effect on LUCC when using the spatial statistical models. Moreover, many underlying land-use change factors, such as expansions of highland farming, are difficult to find from this quantitative approach due to data limitations. The same limitation might extend to population density as the population data obtained was based on administrative areas, which means all areas or cells in an administration unit have the same numbers. The weak or null effects of these less spatially distributed variables do not necessarily mean lower importance of these variables in reality [30].
The problems of these socio-economic drivers could be moderated through some actor-based follow-up studies reflecting land use decisions. To do so, we could use household surveys to acquire socio-economic data and develop decision models for land use actors. Otherwise, it is necessary to develop methods for spatial disaggregation of statistical data in mountainous regions.

5. Conclusions

In this study, we aimed to find land-use change patterns and factors using logistic regression methods to develop statistical models of land-use changes. We extracted neighborhood variables as an index of enrichment factors and various environmental data used as independent variables in multinomial logistic models. After calculating these factors, we quantified relationships between land-use changes and their driving factors to urban, forest, and agricultural lands in the So-yang River Basin using three types of multinomial logistic regression. From this statistical analysis, it was concluded that driving factors and enrichment factors showed similar patterns for two different time periods, meaning that similar processes affect land-use changes constantly in Asian mountainous watershed areas. Statistical results indicate that topographic and neighborhood factors are major driving factors in urban, forest and agricultural land-use changes, corresponding with most hypothesized effects on land-use change. Although major land-use change factors consistently affect all land-use changes, these specific models could help to understand spatial determinants of land-use change processes. It turned out that land-use change models should be subdivided into specific land-use types to utilize driving factors of different land-use types. Driving factors reflecting spatial relations could define transition rules in the land-use change models. In particular, simulation models for future land-use changes could be developed based on the results of our research. When we compared two models for different time periods, there were some similarities among LUCC factors. On the other side they represent two archetypical situations. In the earlier period, agricultural expansion, deforestation and moderate urbanization were dominating, while the later was characterized by agricultural contraction, reforestation and severe urbanization. These factors can be used in simulation models (e.g. cellular automata models) for LUCC changes by quantifying transitional rules and land conversion probabilities of land-use changes for specific pixels (e.g. cellular automata models), and by setting neighborhood thresholds for neighborhood interactions. Moreover, we described various underlying factors which are difficult to be found in statistical results, but are relevant for constructing socio-economic and policy scenarios. These land-use simulation models potentially could contribute to enhance policy making with land-use plans and regional environmental management.

Acknowledgments

We appreciate the valuable comments by Michael Curran, ETH Zurich on an earlier draft of this paper as well as the English corrections of Daniela Kretz as well as Bärbel Tenhunen, University of Bayreuth. This study was carried out as part of the International |Research Training Group TERRECO (GRK 1565/1) funded by the Deutsche Forschungsgemeinschaft (DFG) at the University of Bayreuth, Germany and the Korean Research Foundation (KRF) at Kangwon National University, Chuncheon, South Korea.

Author Contributions

All authors developed research approaches and contributed to the writing of the paper. Ilkwon Kim collected data and conducted statistical analysis. Ilkwon Kim, Quang Bao Le and Thomas Koellner analyzed and interpreted the results.

Conflicts of Interest

The authors declare no conflict of interest.

References

  1. Foley, J.A.; DeFries, R.S.; Asner, G.P.; Barford, C.; Bonan, G.; Carpenter, S.R.; Chapin, F.S.; Coe, M.T.; Daily, G.C.; Gibbs, H.K.; et al. Global consequences of land use. Science 2005, 309, 570–574. [Google Scholar]
  2. Verburg, P.H.; Neumann, K.; Nol, L. Challenges in using land use and land cover data for global change studies. Glob. Chang. Biol. 2011, 17, 974–989. [Google Scholar] [CrossRef]
  3. Lambin, E.F.; Geist, H.J.; Lepers, E. Dynamics of land-cover change in tropical regions. Ann. Rev. Environ. Resour. 2003, 28, 205–241. [Google Scholar] [CrossRef]
  4. Koerner, C.H.; Ohsawa, M. Mountain systems. In Ecosystems and Human Well-Being: Current State and Trends; Hassan, R., Scholes, R., Ash, N., Eds.; Island Press: Washington, DC, USA, 2005; pp. 681–716. [Google Scholar]
  5. Monteiro, A.T.; Fava, F.; Hiltbrunner, E. Assessment of land cover changes and spatial drivers behind loss of permanent meadows in the lowlands of Italian Alps. Landsc. Urban Plan. 2011, 100, 287–294. [Google Scholar] [CrossRef]
  6. Rindfuss, R.R.; Walsh, S.J.; Turner, B.L.; Fox, J.; Mishra, V. Developing a science of land change: Challenges and methodological issues. Proc. Natl. Acad. Sci. USA 2004, 101, 13976–13981. [Google Scholar] [CrossRef] [PubMed]
  7. Geist, H.J.; Lambin, E.F. Proximate causes and underlying driving forces of tropical deforestation. BioScience 2002, 52, 143–150. [Google Scholar] [CrossRef]
  8. Kasperson, J.E.; Kasperson, R.E.; Turner, B.L., II. Regions at risk: Exploring environmental criticality. Environment 1996, 38, 4–15. [Google Scholar] [CrossRef]
  9. Schneider, L.C.; Pontius, R.G., Jr. Modeling land-use change in the Ipswich watershed, Massachusetts, USA. Agric., Ecosyst. Environ. 2001, 85, 83–94. [Google Scholar]
  10. Verburg, P.H.; van Berkel, D.B.; van Doorn, A.M.; van Eupen, M.; van den Heiligenberg, H.A. Trajectories of land use change in Europe: A model-based exploration of rural futures. Landsc. Ecol. 2010, 25, 217–232. [Google Scholar]
  11. Verburg, P.H.; Schot, P.P.; Dijst, M.J.; Veldkamp, A. Land use change modelling: Current practice and research priorities. Geo J. 2004, 61, 309–324. [Google Scholar]
  12. Anselme, B.; Bousquet, F.; Lyet, A.; Etienne, M.; Fady, B.; le Page, C. Modelling of spatial dynamics and biodiversity conservation on Lure mountain (France). Environ. Model. Softw. 2010, 25, 1385–1398. [Google Scholar] [CrossRef]
  13. Perez-Vega, A.; Mas, J.F.; Ligmann-Zielinska, A. Comparing two approaches to land use/cover change modeling and their implications for the assessment of biodiversity loss in deciduous tropical forest. Environ.Model. Softw. 2012, 29, 11–23. [Google Scholar] [CrossRef]
  14. Veldkamp, A.; Lambin, E.F. Predicting land-use change. Agric., Ecosyst. Environ. 2001, 85, 1–6. [Google Scholar]
  15. Rutherford, G.N.; Guisan, A.; Zimmermann, N.E. Evaluating sampling strategies and logistic regression methods for modeling complex land cover changes. J. Appl. Ecol. 2007, 44, 414–424. [Google Scholar] [CrossRef]
  16. Mueller, D.; Zeller, M. Land use dynamics in the central highlands of Vietnam: A spatial model combining village survey data with satellite imagery interpretation. Agric. Econ. 2002, 27, 333–354. [Google Scholar] [CrossRef]
  17. Monroe, D.K.; Southworth, J.; Tucker, C.M. Modeling spatially and temporally complex land-cover change: The case of Western Honduras. Prof. Geogr. 2004, 56, 544–559. [Google Scholar]
  18. Serneels, S.; Lambin, E.F. Proximate causes of land-use change in Narok District, Kenya: A spatial statistical model. Agric., Ecosyst. Environ. 2001, 85, 65–81. [Google Scholar]
  19. Washington, C.; Pijanowski, B.; Campbell, D.; Olsen, J.; Maitima, J.; Musili, A.; Kibaki, T.; Kaburu, H.; Hayombe, P.; Owango, E.; et al. Using a role-playing game to inform the development of land-use models for the study of a complex socio-ecological system. Agric. Syst. 2010, 130, 117–126. [Google Scholar] [CrossRef]
  20. Verburg, P.H.; Ritsema van Eck, J.; de Nijs, T.; Dijst, M.J.; Schot, P. Determinants of land-use change patterns in The Netherlands. Environ. Plan. B 2004, 31, 125–150. [Google Scholar] [CrossRef]
  21. Verburg, P.H.; Ritsema van Eck, J.; de Nijs, T; Visser, H.; de Jong, K. A method to analyze neighborhood characteristics of land use patterns. Comput. Environ. Urban Syst. 2004, 28, 667–690. [Google Scholar]
  22. Kim, J. An analysis of land use change in the urban fringe using GIS and logistic regression in Korea. Korea Spat. Plan. Rev. 2002, 33, 175–200. [Google Scholar]
  23. Kim, J.; Yuh, H.; Kim, C. A study on the land use pattern determinants in the detached housing area of new towns-the case study of Bundang-Ilsan new town. Korea Spat. Plan. Rev. 2007, 42, 43–64. [Google Scholar]
  24. Kim, S.; Lee, Y. The effect of spatial scale and resolution in the prediction of future land use using CA-Markov technique. J. Korean Geogr. Inf. Stud. 2007, 10, 57–69. [Google Scholar]
  25. Lee, D.; Ryu, D.; Kim, H.; Lee, S. Analyzing the future land use change and its effects for the region of Yangpyeong-gun and Yeoju-gun in Korea with the Dyna-CLUE model. J. Korea Soc. Environ. Restor. Technol. 2011, 14, 119–130. [Google Scholar]
  26. Hwang, H.; Ko, Y. An analysis on the structural changes of rural land use according to urbanization. J. Korean Soc. Rural Plan. 2007, 13, 85–92. [Google Scholar]
  27. Ji, N.; Yeo, H. Analysis of land-use changes in small town centers. J. Korea Plan. Assoc. 2007, 42, 25–41. [Google Scholar]
  28. Gao, Y.; Kim, D. Spatio-temporal change detection of land-use and urbanization in rural areas using GIS and RS—Case study of Yongin and Anseong regions. J. Agric. Sci. 2011, 38, 153–162. [Google Scholar]
  29. Kim, B.; Park, J.; Hwang, G.; Jun, M.; Choi, K. Eutrophication of reservoirs in South Korea. Limnology 2001, 2, 223–229. [Google Scholar] [CrossRef]
  30. Bae, J.; Joo, R.; Kim, Y. Forest transition in South Korea: Reality, path and drivers. Land Use Policy 2012, 29, 198–207. [Google Scholar] [CrossRef]
  31. Fang, J.; Chen, A.; Peng, C.; Zhao, S.; Ci, L. Changes in forest biomass carbon storage in China between 1949 and 1998. Science 2001, 292, 2320–2322. [Google Scholar] [PubMed]
  32. Kim, J. Current Status of and Measures to Improve Environmental Controls on the Upper Course of Soyang River’s Multi-Purpose Dam; Research Report 06-07; Research Institute for Kangwon: Chun-cheon, Korea, 2006. [Google Scholar]
  33. Choi, S. Effects and Countermeasures of Dam Construction on Surrounding Areas: Focused on So-yang Multipurpose Dam; Research Report 01-01; Research Institute for Kangwon: Chun-cheon, Korea, 2001. [Google Scholar]
  34. Yoon, H.J. A study on the model of spatial reconfiguration of rural areas according to the industry restructuring. J. Reg. Assoc. Archit. Inst. 2010, 12, 209–220. [Google Scholar]
  35. Lee, J.Y. A hydrological analysis of current status of turbid water in Soyang River and its mitigation. J. Soil Groundw. Environ. 2008, 13, 85–92. [Google Scholar]
  36. Thanh Nguyen, T.; Hoang, V.N.; Seo, B. Cost and environmental efficiency of rice farmers in South Korea. Agr. Econ. 2012, 43, 369–378. [Google Scholar] [CrossRef]
  37. Hoang, V.N.; Thanh Nguyen, T. Analysis of environmental efficiency variations: a nutrient balance approach. Ecol. Econ. 2013, 86, 37–46. [Google Scholar] [CrossRef] [Green Version]
  38. Lesschen, J.P.; Verburg, P.H.; Staal, S.J. Statistical Methods for Analyzing the Spatial Dimension of Changes in the Land Use and Farming Systems; LUCC Report Series No. 7; International Livestock Research Institute: Nairobi, Keyna/Wageningen, The Netherlands, 2005. [Google Scholar]
  39. Overmas, K.P.; de Groot, W.T.; Huigen, M.G.A. Comparing inductive and deductive modeling of land use decisions: Principles, a model and an illustration from the Philippines. Hum. Ecol. 2007, 35, 439–452. [Google Scholar] [CrossRef]
  40. McFadden, D. Conditional logit analysis of qualitative choice behaviour. In Frontiers in Econometrics; Zarembka, P., Ed.; Academic Press: New York, NY, USA, 1973; pp. 105–142. [Google Scholar]
  41. Greene, W.H. Econometric Analysis, 7th ed.; Prentice-Hall: Upper Saddle River, NJ, USA, 2012; p. 764. [Google Scholar]
  42. Guerschman, J.P.; Paruelo, J.M.; Burke, I.C. Land use impacts on the normalized difference vegetation index in temperate Argentina. Ecol. Appl. 2003, 13, 616–628. [Google Scholar] [CrossRef]
  43. Pontius, R.G., Jr.; Schneider, L.C. Land-cover change model validation by an ROC method for the Ipswich watershed, Massachusetts, USA. Agric., Ecosyst. Environ. 2001, 85, 239–248. [Google Scholar]
  44. Temme, A.J.A.M.; Verburg, P.H. Mapping and modeling of changes in agricultural intensity in Europe. Agric., Ecosyst. Environ. 2011, 140, 46–56. [Google Scholar]
  45. Water resource Management Information System (WAMIS). Available online: http://www.wamis.go.kr (accessed on 9 July 2012).
  46. Corbelle-Rico, E.; Crecente-Maseda, R.; Sante-Riveira, I. Multi-scale assessment and spatial modeling of agricultural land abandonment in a European peripheral region: Galicia (Spain), 1956–2004. Land Use Policy 2012, 29, 493–501. [Google Scholar] [CrossRef]
  47. Conrad, O. DiGem-Software for Digital Elevation Model. Ph. D. Thesis, University of Göttingen, Göttingen, Germany, 1998. [Google Scholar]
  48. Veldkamp, A.; Fresco, L.O. CLUE: A conceptual model to study the conversion of land use and its effects. Ecol. Model. 1996, 85, 253–270. [Google Scholar] [CrossRef]
  49. Hall, C.A.S.; Tian, H.; Qi, Y.; Pontius, G.; Cornell, J. Modelling spatial and temporal patterns of tropical land use change. J. Biogeogr. 1995, 22, 753–757. [Google Scholar] [CrossRef]
  50. Mottet, A.; Ladet, S.; Coque, N.; Gibon, A. Agricultural land-use change and its driver in mountain landscape: A case study in the Pryrenees. Agric. Ecosyst. Environ. 2006, 114, 296–310. [Google Scholar] [CrossRef]
  51. Le, Q.B.; Park, S.J.; Vlek, P.L.; Cremers, A.B. Land-Use Dynamic Simulator (LUDAS): A multi-agent system. I. Structure and theoretical specification. Ecol. Inf. 2008, 3, 135–153. [Google Scholar]
  52. Blanchard, P.E.; Lerch, R.N. Watershed vulnerability to losses of agricultural chemicals: Interactions of chemistry, hydrology, and land-use. Environ. Sci. Technol. 2000, 34, 3315–3322. [Google Scholar]
  53. J, D.A.; Perry, G.L.; Romero-Calcerrada, R. Regression Techniques for examining land use/cover change: A case study of a Mediterranean landscape. Ecosystems 2007, 10, 562–578. [Google Scholar] [CrossRef]
  54. Meyer, W.B.; Turner, B.L. Human population growth and global land-use/cover change. Annu. Rev. Ecol. Syst. 1992, 23, 39–61. [Google Scholar] [CrossRef]
  55. Dewi, S.; van Noordwijk, N.; Elakdinata, A.; Pfund, J.L. Protected areas within multifunctional landscapes: Squeezing out intermediate land use intensities in the tropics? Land Use Policy 2013, 30, 38–56. [Google Scholar] [CrossRef]
  56. Barredo, J.I.; Kasanko, M.; McCormick, N.; Lavalle, C. Modelling dynamic spatial processes: Simulation of urban future scenarios through cellular automata. Landsc. Urban Plan. 2003, 64, 145–160. [Google Scholar]
  57. Geertman, S.; Hagoort, M.; Ottens, H. Spatial-temporal specific neighbourhood rules for cellular automata land-use modelling. Int. J. Geogr. Inf. Sci. 2007, 21, 547–568. [Google Scholar]
  58. Hallin-Pihlatie, L. Exploring neighborhood interaction with Desktop GIS. In Proceedings of the 12th AGILE International Conference on Geographic Information Science, Hannover, Germany, 2–5 June 2009.
  59. Pan, Y.; Roth, A.; Yu, Z.; Doluschitz, R. The impact of variation in scale on the behavior of a cellular automata used for land use change modelling. Comput., Environ. Urban Syst. 2010, 34, 400–408. [Google Scholar]
  60. Lee, H. Process and formation of the high-cool lands agriculture in Kangwon Province. Geogr. J. Korean 1990, 15, 1–19. [Google Scholar]
  61. MacDonald, D.; Crabtree, J.R.; Wiesinger, G.; Dax, T.; Stamou, N.; Fleury, P.; Gibon, A. Agricultural abandonment in mountain areas of Europe: Environmental consequences and policy response. J. Environ. Manag. 2000, 59, 47–69. [Google Scholar] [CrossRef]
  62. Pingali, P.L. From subsistence to commercial production systems: The transformation of Asian agriculture. Am. J. Agric. Econ. 1997, 79, 628–634. [Google Scholar]
  63. Kim, S.; Lee, S. The impact of climate changes on highland agriculture region in Taeback Mountainous. Clim. Res. 2011, 6, 100–109. [Google Scholar]
  64. Lee, S. A Study on the Change and Predictions of Urban Spatial Configuration of Chuncheon City. Ph.D. Thesis, Kangwon Nat’l University, Chun-cheon, Korea, 2009. [Google Scholar]
  65. Choi, J.; Moon, H.; Yeom, G.; Kim, E.; Lee, Y.; Kim, K.; Lee, C.; Sin, E.; Kim, J. Comprehensive Countermeasures for Water Quality Improvement upon Consideration of Water System: Focused on Han River Basin; Research Report 21; Korea Environmental Institute: Chun-cheon, Korea, 2001. [Google Scholar]
  66. Im, J.; Lee, Y. Progress and challenges of direct payment programs in Korea agricultural sector. Korean J. Agric. Manag. Policy 2007, 34, 169–195. [Google Scholar]

