
Towards Sustainable Management of Urban Ecological Space: A Zoning Approach Hybridized by Ecosystem Service Value and Ecological Risk Assessment


1
School of Public Affairs, Zhejiang University, Hangzhou 310058, China
2
Center for Balance Architecture, Zhejiang University, Hangzhou 310063, China
*
Author to whom correspondence should be addressed.
Land 2022, 11(8), 1220; https://doi.org/10.3390/land11081220
Submission received: 2 July 2022
/
Revised: 25 July 2022
/
Accepted: 29 July 2022
/
Published: 2 August 2022
(This article belongs to the Special Issue Urban Land Development in the Process of Urbanization)
Abstract
:Massive growth is posing threat to the ecological security and sustainability of cities. Ecosystem service value (ESV) and ecological risk index (ERI) assessment can be conducted to enhance urban ecosystem management through the enhanced recognition of these values and risks in decision-making. This paper aimed to measure spatiotemporal ESV and ERI for Shizuishan City located in central China, and, based on this, how to zone urban ecological space using land cover data (for the years 2010, 2015, and 2020). The management options of different zones were suggested to mitigate and manage any potential negative impacts on urban ecological security. Results show that: (1) The spatial distribution characteristic of ESV is “high in the south and low in the north”. The total ESV exhibited an upward tendency from 2010 to 2020. (2) The high-ERI areas were distributed in the peripheral region, while the low-ERI areas were concentrated in the central region. The ERI of water was in decline continuously, whereas the ERI of wetland maintained a high level. (3) The zoning approach integrating ESV and ERI assessment can truly reflect the status of the environment and better clarify the direction of ecological development for different areas. Among four different ecological zones, the high-ESV and low-ERI areas (I) have abundant ecological resources, and they are set as “Priority Development Areas”. The low-ESV and low-ERI areas (II) are set as “Ecological Improvement Areas” because the area of ecological lands are confined. The low-ESV and high-ERI areas (III) have a fragile ecological environment, and they are set as “Exploitation-Prohibited Areas”. The high-ESV and high-ERI areas (IV) are mainly distributed near water and wetland, and they are set as “Research-focused Areas”.
1. Introduction
Natural ecosystems perform fundamental life-support services upon which human civilization depends. A robust ecosystem can contribute to social and economic well-being by providing a stable base for a diverse set of urban activities. The spatial prioritization and optimization of urban ecological space is a nature-based solution to promote ecosystem services and maintain urban ecological security [1,2]. Urban ecological planning is the process of facilitating decision-making to carry out the spatial arrangements of urban ecological space with consideration given to the ecosystem service and ecological risk. Sustainable management aims to control urban development and improve the framework of life in the cities. To avoid putting unnecessary strain on the supporting ecosystem constitute the major objective of sustainable management [3]. It is about creating an equilibrium between consumerist human culture and the living world. In simple terms, sustainable management is the practice of interacting with the planet [4]. Sustainable management is essential because ecosystem services and their ecological process provide goods and services to human well-being and subsistence [5]. Nevertheless, these goods and services were once mistakenly regarded as abundant and inexhaustible, which directly accelerated excessive consumption of their supply and increased their scarcity [6], ultimately resulting in the degradation of the ecosystem and the increased ecological risk. So, it is urgent to implement sustainable management to legitimately control the consumption of ecological resources by human activities and minimize the damage to the biodiverse ecosystem [7]. Meanwhile, there are spatio-temporal interactions between ecosystem service value and ecological risk. Thus, analyzing the ecological risk based on ecosystem service value, and then constructing ecological zones of different levels and managing them rationally will be an inevitable requirement for ecological civilization construction and sustainable management in the new era.
Human activities usually affect the process, structure, and functions of the ecological environment by altering land cover types [8], and these changes in the ecosystem can be reflected by ecosystem service value (ESV) changes [9]. Thus, ESV can be used to evaluate the potential of the regional ecosystem for human services and explore the changing impacts of human disturbances on the ecological environment [10]. According to the construction of the evaluation framework and pricing method, the approaches in ESV assessments can be roughly divided into two types. One is based on the unit service function price [11] (hereinafter referred to as the functional value method), and the other is based on the equivalent value factor per unit ecosystem area [12] (hereinafter referred to as the equivalent factor method). The functional value method is primarily employed in small-scale regions. Meanwhile, this approach requires multiple input parameters, and the calculation process is extremely cumbersome, which leads to difficulty in unifying the evaluation processes and parameter thresholds [13]. Therefore, this approach is not applicable for the assessment of ESV on a large scale. The equivalent factor method is an alternative market method, which is mainly built on the area of different landscape types and their corresponding value equivalents [14]. This method is intuitive and easy to use, requires relatively little data, and is highly comparable and comprehensive, making it a pervasive approach for evaluating ESV at regional and global scales [15]. The prototype of this method was proposed by Costanza et al. and was used to estimate the value of 17 ecosystem services by 16 land resources [16]. However, this prototype method had high requirements for data collection and processing, and the calculation is relatively complicated and is not generalized [17]. Hence, taking the findings of Constanza et al. as a reference, Xie et al. established a table of China’s equivalents of ecosystem service value supplied per unit area of ecosystem grounded on the ecological questionnaire survey conducted by Chinese professionals and finally calculated the 11 types of ecosystem service value [5]. Compared with other methods, this method is considered more practical and has the advantages of low data requirements, high comparability of results, and the ability for comprehensive evaluation [18]. Subsequently, extensive studies on ecosystem service valuation have been carried out in terms of the pattern [19], process [20], and function [21]. Most recent attention has focused on the relationship between ESV and urbanization, and studies were performed on the changing trend of ESV in rapid urbanization areas [22], the synergies between ESV and economic development [23], and the driving mechanism of changes in ESV [24]. Moreover, a number of studies have directly focused on the changes in ESV of ecological lands, such as the spatial autocorrelation in land use type and ESV in rainforest national parks [15], and the effect of biological invasion on ESV [25]. Overall, these studies highlight the impact of human activities on regional ESV.
Ecological risk represents the likelihood of adverse ecological effects occurring as a consequence of anthropogenic activities and natural hazards [26], which reveals the ability of an ecosystem to maintain its self-stability under specific environmental pressures [27]. As an important means of ecological and environmental management [28], an ecological risk assessment is performed to evaluate the likelihood of adverse ecological effects occurring as a result of exposure to physical or chemical stressors. This helps us appreciate the fact that anthropogenic activities and natural environmental changes may be detrimental to regional ecosystems [29]. There are two chief approaches to ecological risk assessment. One is based on the risk source–risk receptors–exposure and hazard assessment model [30]. The most original approach of ecological risk assessments focused on the environmental impacts of chemical contaminants or pollution events on ecosystems, mostly emphasizing a single risk source or a single risk receptor [31]. Risk assessment that follows this method has been carried out by taking water contaminants [32], toxic metal [33], landslides [34], and other sudden environmental events or specific objects as the risk sources. Currently, this approach is still used for analyzing particular site-specific hazards in small geographic areas, such as monitoring the impact of toxic chemicals on local human health [35]. Thus, this approach is susceptible to subjective factors in that it focuses on identifying the risk sources and receptors, while different scholars will have different views on their determination of them. The other group of literature mostly depends on RS, GIS, and Landscape metrics to construct the landscape ecological risk index (ERI) which combines multiple sources of risk generated by natural or human disturbances [36] to evaluate the ecological risk from the perspective of the land-cover change. River basins [37], protected areas [38], administrative districts [39], urban agglomerations [40], etc., are extensively examined. This approach takes account of scale effects, temporal changes, and regional spatial heterogeneity, which contributes to the spatial visualization of regional ecological management. Meanwhile, with the advancement of global change and ecological risk studies, this approach has become mainstream research and is widely applied. Most recent studies have focused on analyzing the spatiotemporal distribution of ecological risk, and the study areas were selected areas with intensive human activities, mainly in watersheds, urban territories [41], mining areas [42], and coastal areas [43]. Moreover, some studies have been conducted on exploring the driving forces of ecological risk [44] or constructing the ecological risk projection model [45]. In conclusion, the ecological risk assessment has changed dramatically, such as the evaluation elements have developed from single-risk source and single-risk receptor to multi-risk source and multi-risk receptors [46], and the evaluation scope has expanded from small-scale areas to the regional landscape [47], and the evaluation unit has been transformed from an administrative region to risk communities.
There is a growing body of research on ecosystem service evaluation and ecological risk evaluation. However, gaps remain: (1) the ESV and ERI remain relatively independent, and there have been infrequent studies that would combine these two assessment approaches and ecological zone to identify the priority of urban ecological area protection and propose targeted ecological management measures. (2) The study areas were mostly economically prosperous areas such as the Beijing–Tianjin–Hebei urban agglomeration and Yangtze River Delta in China and areas with special geomorphological characteristics in the southwest of China, while the northwest area of China has not received much attention.
Therefore, unlike previous studies, this research took Shizuishan City in northwest China as an illustration, based on land cover data in 2010, 2015, and 2020, and not only analyzed the temporal and spatial distribution of ESV and ERI in the study area but also established a zoning approach integrated the ESV and ERI to facilitate the proposal of targeted ecological management measures. To the best of our knowledge, few studies have comprehensively evaluated the regional ecological environment from human well-being and potential risks perspectives. Meanwhile, compared with previous work that applies a single ESV or ERI assessment, this zoning approach emphasizes the integrity of the ecosystem, which can reflect the ecological environment security status from positive and negative sides. Then the decision-making basis and theoretical guidance will be precisely provided for the ecological environment construction of the study area.
2. Materials and Methods
2.1. Study Area
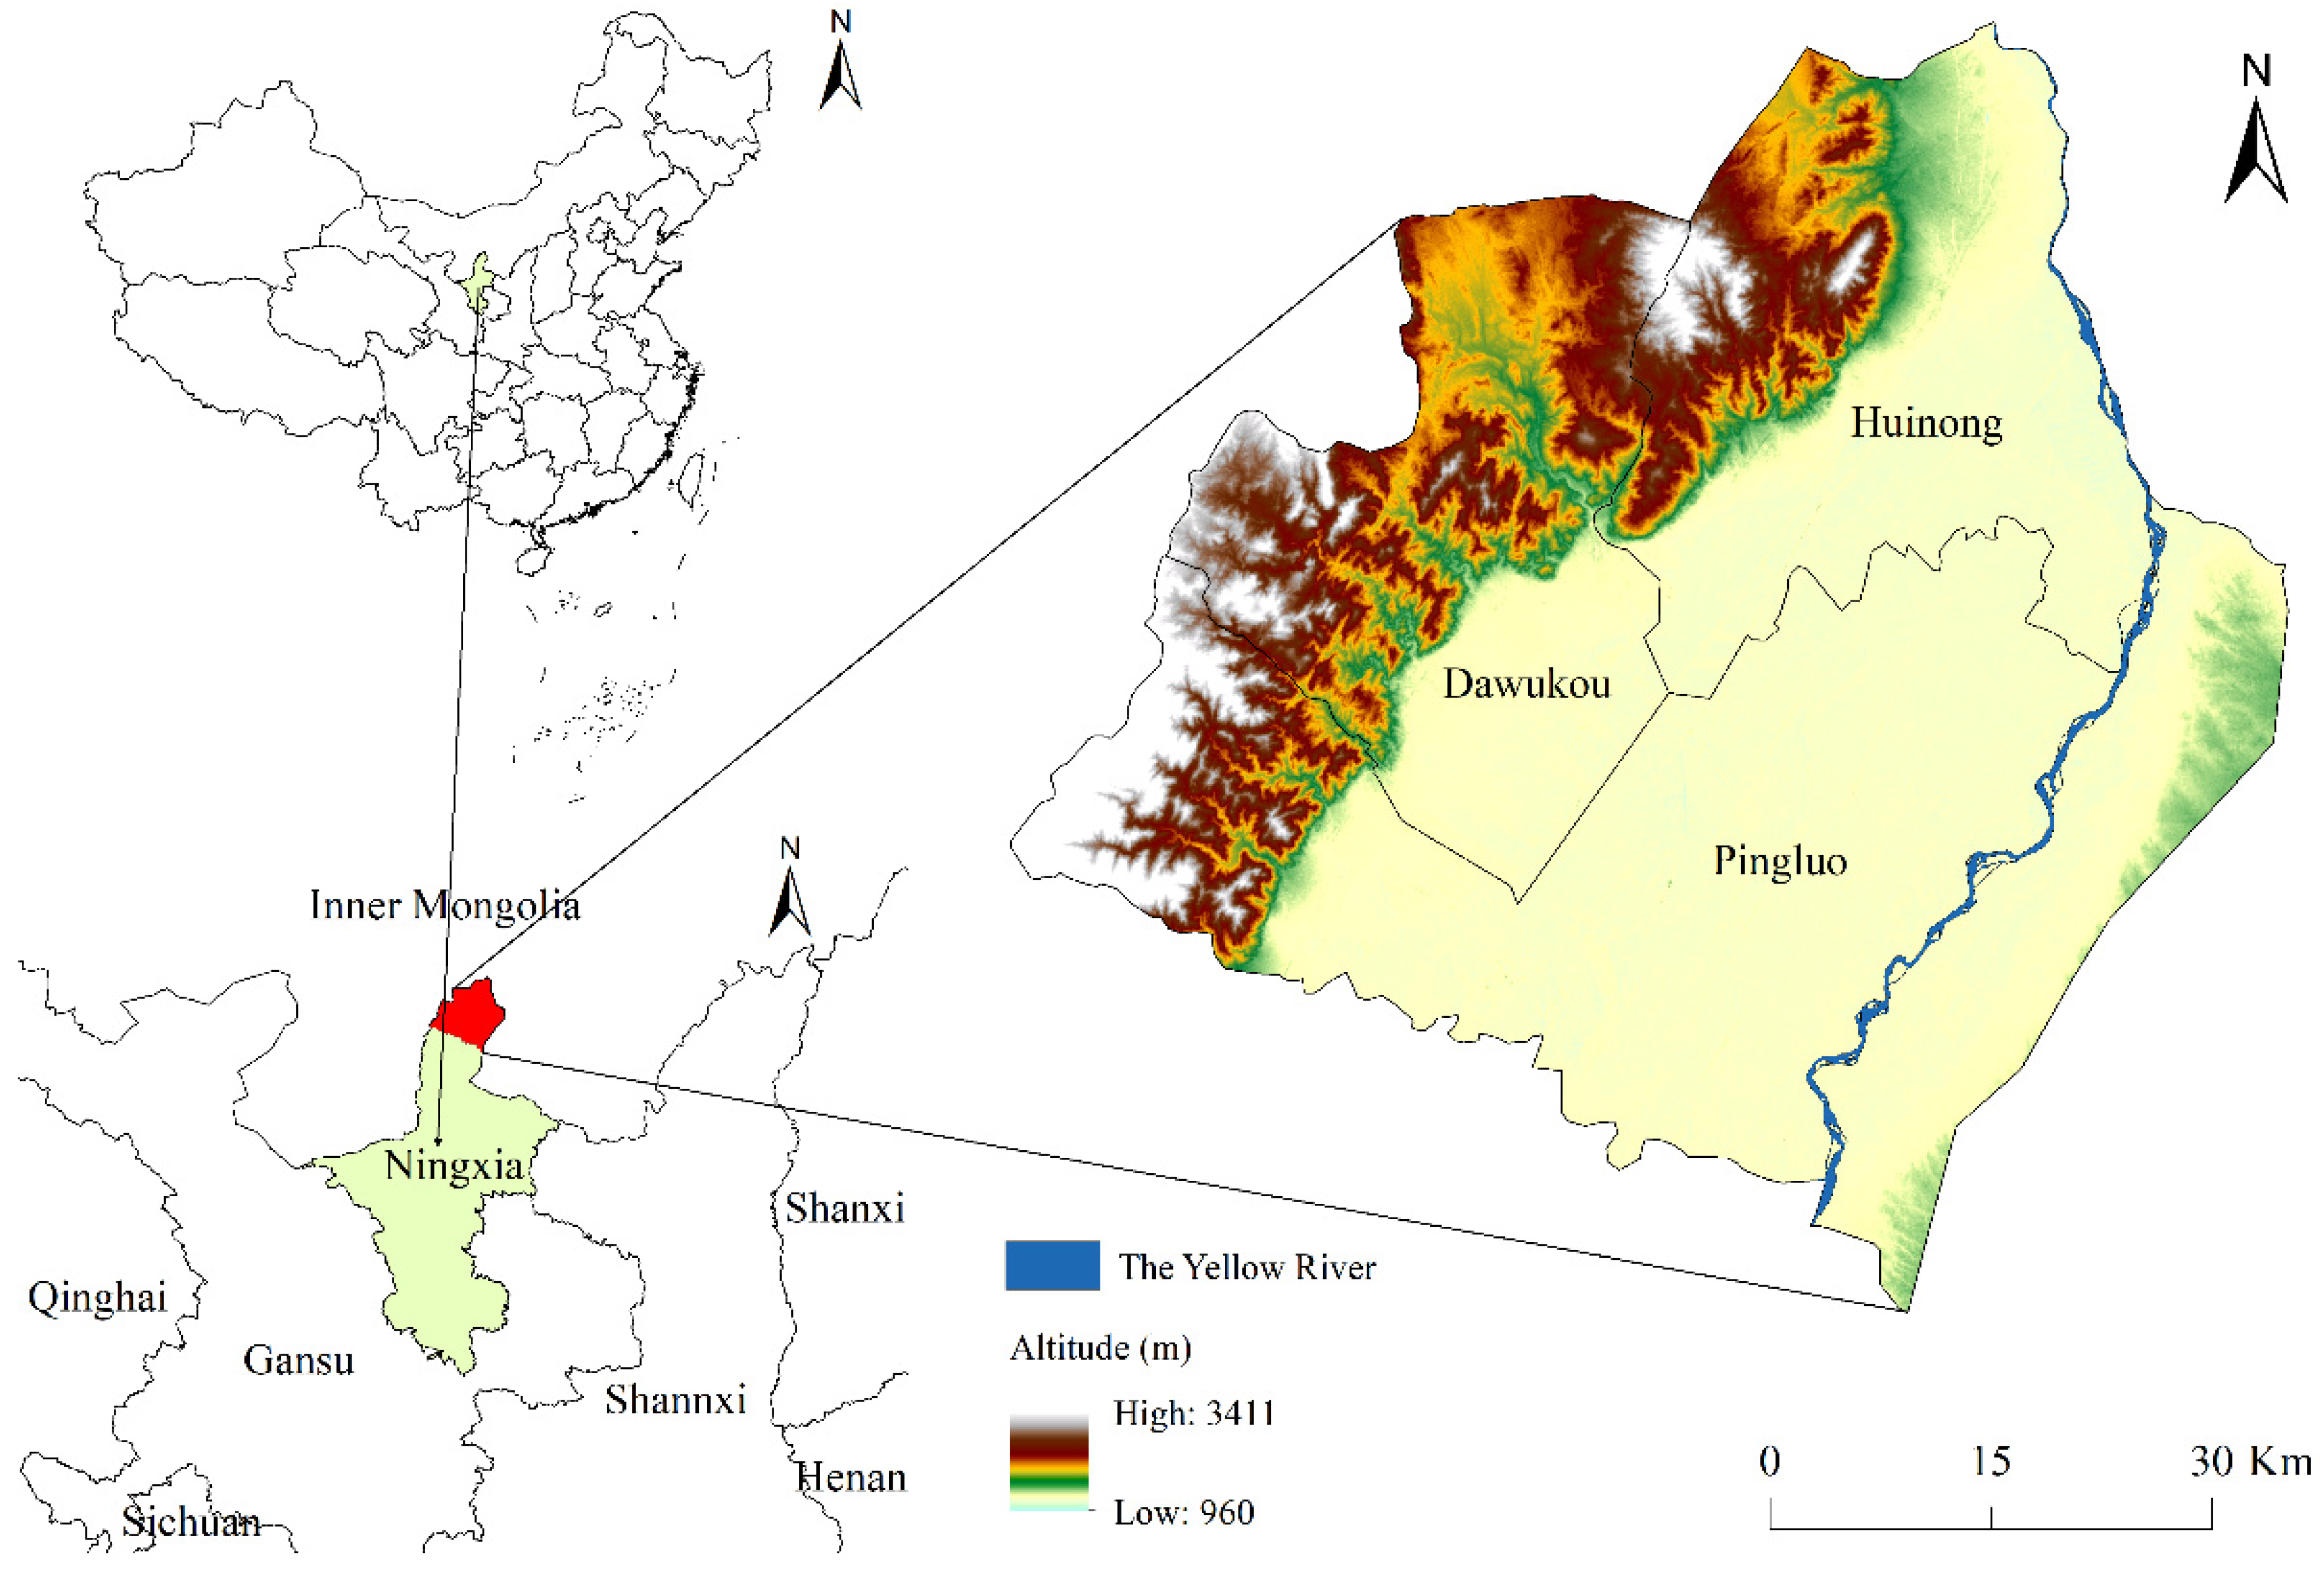
The area of the study is Shizuishan City, which is located in the north of Ningxia Hui Autonomous Region, China (Figure 1). It extends over an area of about 5309.5 km2 with a population of 805,000 and encompasses two districts and one county: Dawukou, Huinong, and Pingluo. Topographically, the altitude ranges from 940–3411 m, and there exist diversified landforms including mountains, alluvial plain, and platforms. It has a continental climate characterized by hot summers and cold winters and is a typical arid and semi-arid region with an annual average temperature of 8.4–9.9 °C and annual precipitation of 167.5–188.8 mm on average. As the most important river systems in Shizuishan City, Xinghai Lake, Sha Lake, and Yellow River play an irreplaceable role in regulating climate, purifying the environment, and preserving biodiversity.
This region was selected for two reasons: (1) Shizuishan City is one of the representative resource-based cities in Northwest China, which heavily depends on mineral exploitation and is vulnerable to the deterioration of the ecological environment. Some developing countries are also facing such urban development dilemma. Therefore, identifying the priority areas of ecological space in Shizuishan City will contribute to the scientific management and control of ecological lands, and research results will provide suggestions for the policy on green transformation development of resource-based cities in Northwest China. Meanwhile, it also has general value for the management of urban ecological space beyond China; (2) Shizuishan City is a typical arid and semi-arid region in the upper reaches of the Yellow River, where water bodies are particularly important for the improvement of the ecological environment in this region. Thus, carrying out ecological space research is effective in identifying the priority water protection zones, and the research results are excepted to provide a valuable reference for the preservation and restoration of watersheds in the arid and semi-arid regions of China and some desert cities around the world.
2.2. Data
The data involved in this study include land use and statistical data. The land use grids of 2010, 2015, and 2020 with a spatial resolution of 30 m × 30 m were derived from GLC_FCS30-1985_2020 which is developed by the Aerospace Information Research Institute of the Chinese Academy of Science [48] (http://www.aircas.ac.cn/, accessed on 18 May 2022). Produced from Landsat-TM, Landsat-ETM+, and OLI sensors, it covers 29 land-use types. The data were reclassified into eight types-: dry land, paddy field, forest land, grassland, water, wetland, bare land, and impervious surface (Table 1). The statistical data of main grain market price and grain yield per unit of farmland area (The statistical data were obtained to calculate the Ecosystem Service Value Index) were obtained from the Bureau of Statistics of Ningxia Hui Autonomous Region (http://tj.nx.gov.cn/, accessed on 20 April 2022), and the Food and Strategic Reserves Administration of Ningxia Hui Autonomous Region (http://lswz.nx.gov.cn/, accessed on 20 April 2022).
2.3. Methods
2.3.1. Ecological Zones
The zonation of urban ecological space is constructed on the basis of assessing ecosystem service value and ecological risk. To spatialize the ecosystem service value and ecological risk, the evaluation units were established. Building on the relevant studies, the area of landscape samples is supposed to reach 2–5 times the average, thus comprehensively reflecting the landscape pattern information around the sampling site [49]. The northwest of the study area is a mountainous region and the northeast is a plain region. The landscape features, such as forest land, grassland, and cultivated land, in this area, are relatively broken. Therefore, the study area was divided into plenty of 3 km × 3 km grids by comprehensively considering the calculation intensity, calculation accuracy, and the actual situation in the study area. Then a total of 516 evaluation units were obtained. What is more, the geometric center of the grid was taken as a sampling point of the ecosystem service value index and ecological risk index as calculated by Fragstats.
These indices of the 516 evaluation units were standardized by using the Z-score standardization method to build a scatter plot with ecosystem service value on X-axis and ecological risk on Y-axis. Finally, the four quadrants of the scatter plot were divided to represent different types of ecological zones. Among them, quadrant Ⅰ represents a high value-low risk, quadrant Ⅱ represents a low-ESV and low-ERI, quadrant Ⅲ represents a low-ESV and high-ERI, and quadrant Ⅳ represents a high-ESV and low-ERI [50].
2.3.2. Ecosystem Service Value Index
According to the ecosystem service value equivalence coefficients as proposed by Costanza et al. (1997) [16] and “China’s equivalents of ecosystem service value supplied by per unit area of an ecosystem (Table 2)” by Xie et al. (2015) [5], the calculation equation of ecosystem service value (ESVk) is expressed as follows:
where ESVk represents the ecosystem service value of sample k (RMB/ha), Akj indicates the area of landscape j in sample k (ha), VCj refers to the ecosystem service value per unit area of landscape j (RMB/ha), and its calculation equation is expressed as follows:
where mi represents the average crop area of grain i in the study area from 2010 to 2020 (ha), pi denotes the average price of grain i in the study area from 2010 to 2020 (RMB), qi refers to the average yield per unit area of grain i in the study area from 2010 to 2020, M stands for the total crop area of all kinds of grain (ha) [51], and Vj means the ESV equivalents of different landscape types, which can be obtained from Table 2.
2.3.3. Ecological Risk Index
The landscape ecological risk refers to the possible adverse consequences of the interactions between the landscape pattern and ecological processes under the influences of natural and or human factors, and it can be defined as the combined result of the different probabilities of the risk probability and landscape loss degree. The magnitude of regional ecological risk is related to the intensity of the external disturbance to which the local ecosystem is exposed and the internal resistance capacity of different landscape types within the ecosystem [52]. Different landscape types play different roles in protecting species, preserving biodiversity, and promoting ecosystem succession. Thus, based on previous research results and the practicalities in the study area, the spatial pattern characteristics of each landscape are converted into a composite representation of the relative scale of ecological risk and the degree of the potential loss. Then an evaluation model of the ecological risk (ERIk) was constructed by using the landscape disturbance degree index (Ui), landscape vulnerability index (Fi), and the area of different landscape types [53], which can be expressed as follows:
where n represents the number of landscape types, Aki indicates the area of landscape i in sample area k, Ak is the total area of sample k, Ui refers to the landscape disturbance degree index, and Fi stands for the landscape vulnerability index.
The landscape disturbance degree index can be adopted to measure the external disturbance caused to the urban ecosystem by the changes in resources and environment as a result of the changes in the population size and composition in the process of rapid urbanization [54]. To be specific, the activities that can disrupt the urban ecosystem include the expansion of construction land, the destruction of ecological lands, and the construction of urban roads [55]. Thus, the landscape disturbance degree index was constructed by integrating the landscape fragmentation degree index, landscape separation degree index, and landscape dominance degree index [56], which is expressed as follows:
where Ci, Ni, and Di represent the landscape fragmentation index, landscape separation index, and landscape dominance index, respectively. Table 3 shows the formula used to calculate these indices and the ecological meaning. α, b, and c refer to the weights of the corresponding landscape indices. According to the previous research results and the characteristics of the study area, α = 0.5, b = 0.3, and c = 0.2 were assigned as weights [57].
The landscape vulnerable index is an effective indicator that is applied to denote the resistance and the degree of loss of the stability of different landscape types due to external disturbance. The eight landscape types, including bare land, wetland, water area, paddy field, dry land, grassland, forest land, and impervious surface were assigned the values of 8-1, respectively. Then, they were normalized to obtain Fi [61].
3. Results
3.1. Spatiotemporal Analysis of ESV
3.1.1. Distribution Characteristics of ESV
Kriging interpolation [62] was performed on the ecosystem service value index [63]. The spatial distribution of the ecosystem service value in the study area in 2020 was mapped (Figure 2). In previous studies, it was indicated that the natural breakpoint method achieves high grading accuracy by taking into account the balance of extreme differences in index intensity at all levels [64]. In this way, better-integrated mapping results can be achieved [65]. Therefore, this method was applied to classify ESV into five levels: low value, medium-low value, medium value, medium-high value, and high value.
In general, the ecosystem service value in the study area was high in the south but low in the north. The high-value areas were distributed mainly in the south of Dawukou District and the south of Pingluo County, where Xinghai Lake and Sha Lake were located, respectively. These areas featured high vegetation coverage, favorable hydrothermal conditions, and strong adjustment capabilities. Therefore, these areas could provide various ecosystem services, creating a high ecosystem value. The medium-high-value areas were concentrated around the high-value areas, with a small number of them distributed near the Yellow River Basin in the east of Pingluo County. The medium-value areas included the south of Dawukou District, the east and west of Pingluo County, and the south of Huinong District. Notably, the medium-value areas in the east of Pingluo County were integrally and continuously distributed. These areas were found in the middle and upper reaches of the Shizuishan section of the Yellow River Basin, which suggests the increasing efforts made in Shizuishan City over recent years to preserve the Yellow River Basin. The medium-low-value areas were extensively distributed in Dawukou District, Huinong District, and Pingluo County. The landscape types in these areas were dominated by forest land and grassland. However, these areas were also interspersed with some bare land, which led to a highly fragmented landscape. Thus, the corresponding ecosystem service value was relatively low. The low-value areas accounted for the largest proportion and were distributed throughout the study area. They featured either dense population or low vegetation coverage. The disruption caused by human activities impeded vegetation growth. As a result, the ecosystem service value was the lowest in these areas [66].
The total ESV of Shizuishan City in 2020 amounted to RMB 8.550 billion. Concerning landscape types, water had the largest ESV of RMB 2.479 billion, accounting for 28.99% of the whole. Water provides a major driving force for the evolution of the ecosystem [67], which deserves effective preservation. The ESV of grassland was lower than that of water, accounting for 20.48% of the total. The value of paddy fields, forest land, and arid land accounted for a similar proportion, reaching 13.29%, 12.89%, and 12.36%, respectively. Despite a confined area of wetland, its ESV accounted for 11.67%. Therefore, enhancing the protection and restoration of wetlands is considered effective in improving ESV for Shizuishan City [68]. The ESV of bare land was the lowest, accounting for barely 0.3% of the total. In terms of ecosystem services types, the ESV of regulating services reached RMB 6.227 billion. As the highest amount, it accouned for more than half of the total. Thus, water is essential for regulating the circulation of the ecosystem. The ESV of provisioning services was significantly lower than that of regulating services, accounting for only 13.97% of the total. The ESV of supporting services and cultural services was the lowest, accounting for 7.96% and 5.25%, respectively (Table 4).
3.1.2. Variation among Landscape Types and Services Types in ESV
The total ESV in the study area exhibited an upward tendency from 2010 to 2020, amounting to RMB 7.594 billion in 2010, RMB 8.043 billion in 2015, and RMB 8.550 billion in 2020, respectively. It suggests that a satisfactory performance has been achieved over recent years in enforcing environmental protection policies in Shizuishan City, with the ecological environment considerably improved. As for landscape types, the ESV increased slightly for both arid land and paddy field, despite an insignificant decrease in their proportion. On the one hand, it demonstrates that the protection of cultivated land attracted close attention during urban development, as a result of which the expansion of construction land did not occupy a large amount of them. On the other hand, it also revealed the limited role of cultivated land in improving total ESV in the study area. There was a slight decrease in the ESV and the proportion of ESV of forest land, indicating the lack of effort in preserving and restoring forest land and the grain for the green project in the recent ten years. Consequently, the area of forest land was reduced. Due to the large area of grassland, its ESV was proportionately high. Nevertheless, its ESV declined continuously during the study period. On the one hand, the rapid urbanization process drove the expansion of construction land, which eroded the grassland. On the other hand, grassland was not preserved effectively, which led to serious degradation. Consequently, its ESV showed a downward trend [69]. Wetland displayed a massive potential to deliver high ESV. Due to its relatively minor area, however, it was not comparable to the ESV provided by other landscape types in the study area. However, in the past ten years, the ESV of wetland showed an increasing trend, from RMB 0.528 billion to RMB 0.997 billion. It suggests that Shuizuishan City stuck to the red line of wetland protection throughout development, which improved the system of wetland preservation. As a result, the area of wetland was expanded continuously. During the study period, the ESV of water increased by RMB 0.783 billion, reaching the highest level in 2020. It is because the construction of ecological civilization was carried out effectively in the study area. This is conducive to preserving important water bodies such as Xinghai Lake, Sha Lake, and the Yellow River Basin. Moreover, the conversion of farmland to lake can be promoted. Therefore, the ecological environment of water was improved (Figure 3a).
As a crucial region for water replenishment in the upper-middle reach of the Yellow River, the study area played a significant regulatory role. Therefore, among the four types of ecosystem services, the ESV of regulating services accounted for the largest proportion, exceeding 70% in all three periods. The ESV of provisioning services was considerably lower than that of regulating services, accounting for about 10%. Moreover, it diminished over time, which is attributable to the reduction in grassland and forest land [70]. Providing a stable operating environment for the ecosystem, these two types of the landscape should be prioritized for protection in the follow-up ecological environment management. The ESV of both supporting services and cultural services accounted for less than 10%, with cultivated land as the main landscape type to provide supporting services. Although its area accounted for more than 40% of the total, the output of its service value was insignificant, which led to a tiny proportion of supporting services value across the study area. Meanwhile, the utilization of cultural tourism resources in the study area was relatively limited. As a result, the proportion of cultural services value was extremely low (Figure 3b).
3.2. Spatiotemporal Analysis of ERI
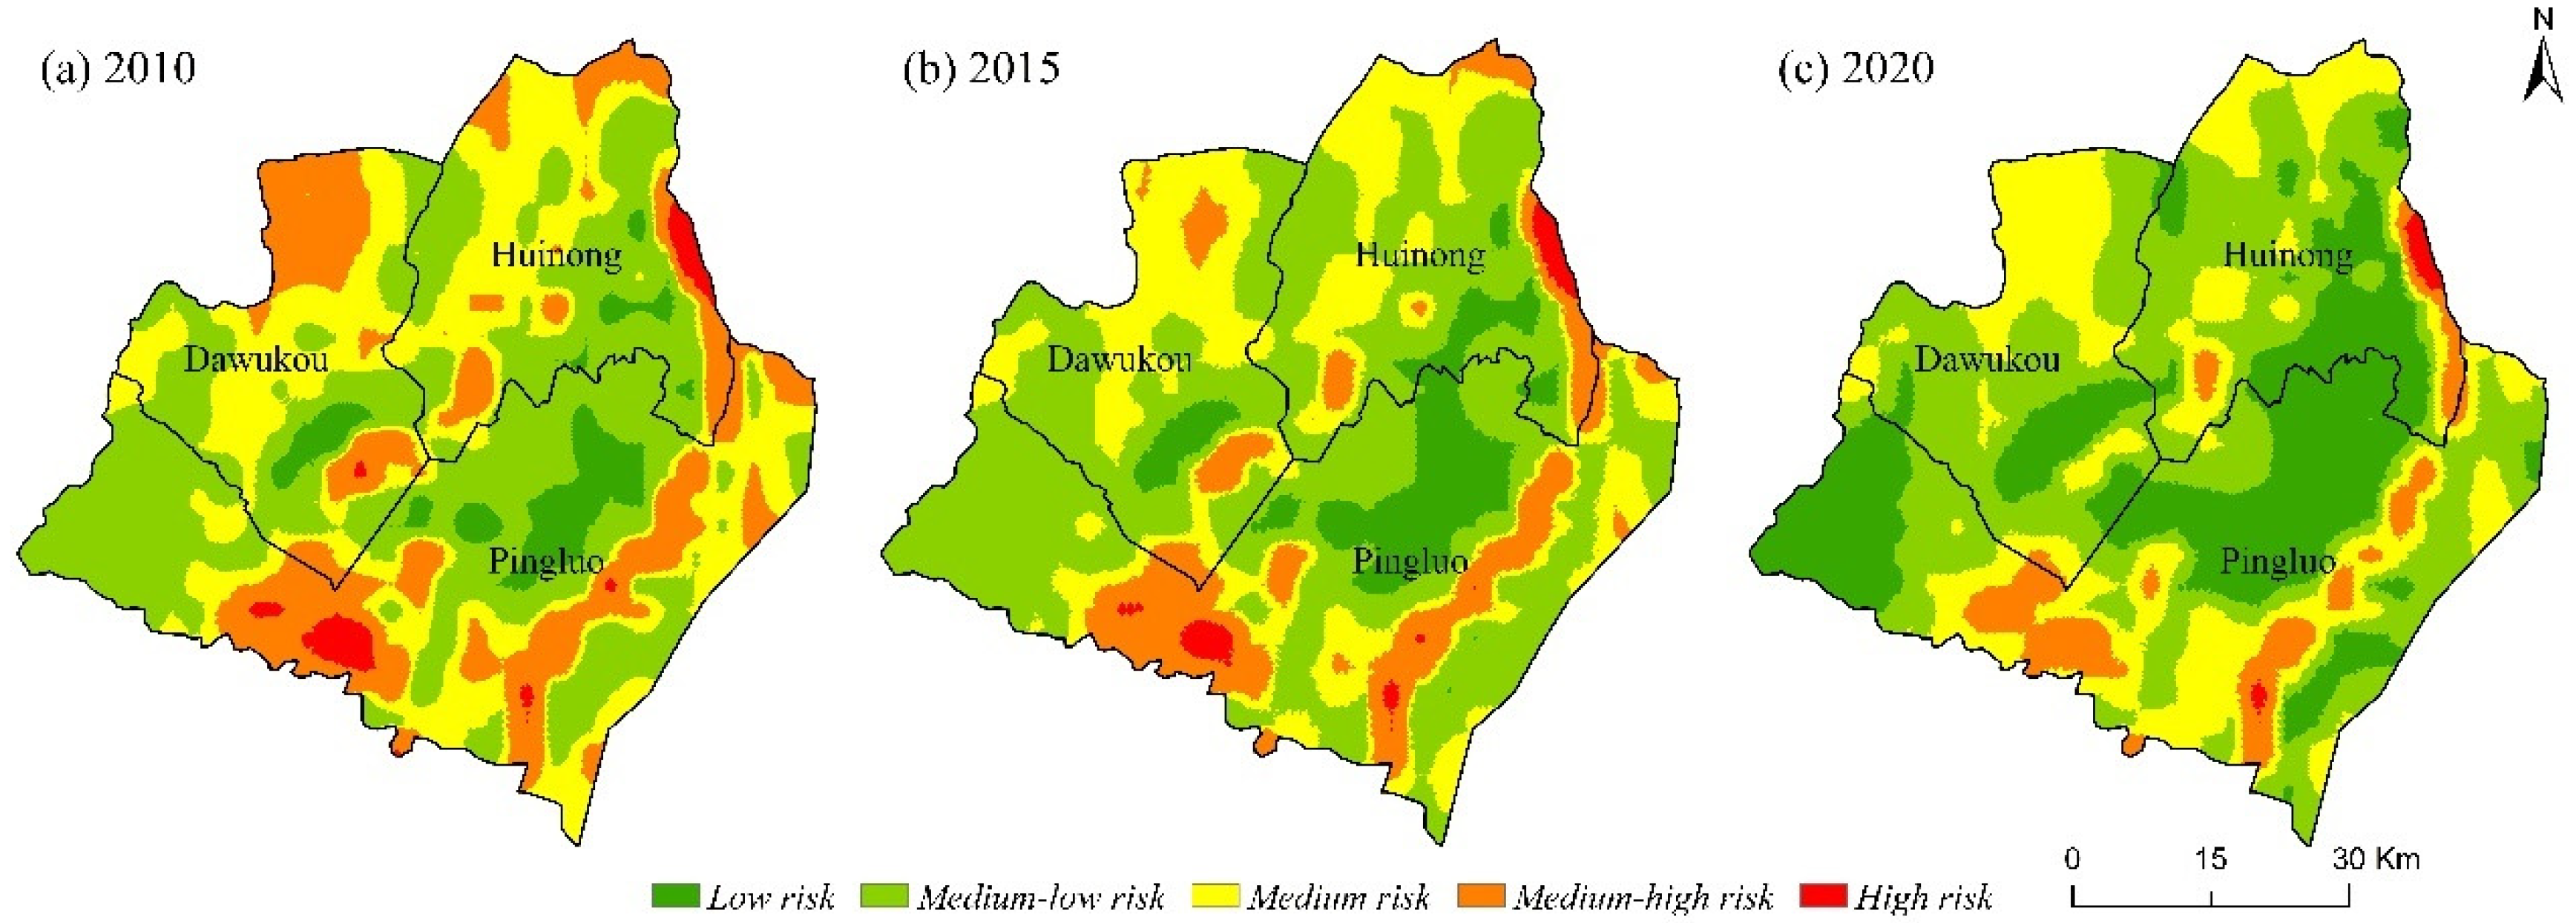
To reveal the spatial and temporal characteristics of ERI in the study area, the Ordinary Kriging Method was used to map the distribution of ecological risk during the three phases of the study area. This is based on the level of ERI for each evaluation unit (Figure 4). According to the interpolation results, the ecological risk values were divided into five levels using the same method: low risk (0.20 < ERI), medium-low risk (0.20 ≤ ERI < 0.26), medium risk (0.26 ≤ ERI < 0.34), medium-high risk (0.34 ≤ ERI < 0.52), and high risk (ERI > 0.52). Then, the area and proportion of different risk levels were calculated (Table 5).
In general, the ecological risk in the study area was high in the periphery but low in the middle, with the ecological risk showing a downward trend from 2010 to 2020. Among them, the medium-low-risk areas and medium-risk areas accounted for a relatively high proportion. Accounting for a relatively low proportion, both the medium-high-risk area and the high-risk area were in decline gradually. The environmental risk was mitigated by the government incorporating the construction of ecological civilization into the Five-Sphere Integrated Plan in 2012 (The Five-sphere Integrated Plan—the development of socialism with Chinese characteristics encompassing economic, political, cultural, social, and ecological development-was proposed on November 8, 2012 at the 18th National Congress of the CPC). Due to various policies implemented, a remarkable achievement was made in environmental protection.
In 2010, the low-risk areas accounted for a proportion of 5.48%, concentrating in the south of Dawukou District, the southeast of Huinong District, and the northeast of Pingluo County. Mainly distributed around the low-risk areas, the medium-low-risk areas were commonly found in the Helan Mountain area and along the Yellow River. These areas were dominated by paddy fields, arid land, forest land, and grassland, showing stable land-use trends. Additionally, the local landscape types were less affected by the exterior environment, thus maintaining a medium-low risk level. The medium-risk areas accounted for 29.74% of the study area. Moreover, except for the center of Dawukou District and the west and north of Huinong District were continuous, the rest were scattered. Most of these areas were located in the transitional belt between bare land and forest land, showing high fragmentation degrees and high disturbance degrees. Consequently, the risk level increased [71]. The medium-high-risk areas accounted for 20.48%, with apparent region heterogeneity. The distribution states in the south and north of Dawukou District were clustered, with the southern part located in Xinghai Lake, and the Northern part was distributed across a large area of bare land. The distributed state in the west of Pingluo County was also clustered, with bare land and cultivated land in dominance. The distribution state in the east of Pingluo County was banded, covering the upper reaches of the Shizuishan section of the Yellow River. Accounting for a proportion of 1.56%, high-risk areas were distributed in the east and west of Pingluo County and east of Huinong District. They were located in upstream of the Shizuishan section of the Yellow River, Sha Lake, and downstream of the Shizuishan section of the Yellow River, respectively. The landscape types of this area were water and wetland, and the ecosystem was highly brittle. Meanwhile, this area was experiencing environmental deterioration, due to urbanization construction, population growth, and growing demand for cultivated land.
Compared with 2010, the changes in the distribution of ecological risk in 2015 were less significant. Among them, the low-risk areas and the medium-low-risk areas emerged in the expansion trend, with the proportion improving from 5.48% to 9.04% and from 42.74% to 50.83%, respectively. The medium-risk areas decreased slightly, with only a few of them transformed into low-risk areas. The transformed areas were located in the middle of Dawukou District and Huiinong District and in the east of Pingluo County. Due to the increased efforts on land reclamation in these areas, some bare land was transformed into forest land, which improved the fragile environment [72]. The medium-high-risk areas were significantly reduced by 7.51%, concentrating in the north of Dawukou District. Furthermore, the south of Dawukou District, the southwest of Huinong District, and the east of Pingluo County were all reduced but to varying degrees. The changes in Dawukou District and Huinong District resulted from land reclamation and the discontinuation of mine treatment. Thus, the bare land with high risk and the abandoned land that collapsed due to mining were reclaimed into grassland and forest land. The changes in Pingluo County resulted from the protection and restoration of the Yellow River, showing a decline in the fragmentation degree of the water landscape. This improved the resilience of the ecosystem [73]. The high-risk areas exhibited a slight decrease, concentrating in the south of Dawukou District and the east and west of Pingluo County.
Compared with 2015, the distribution of ecological risk changed significantly in 2020. To be specific, the proportion of low-risk areas increased by 18.15%. The increased areas were concentrated in the west, east, and north of Pingluo County, the south of Dawukou District, and the south of Huinong District. A vast majority of the increased areas were converted from medium-low-risk areas. The proportion of medium-low-risk areas was reduced by 10.58%, while that of the medium-risk areas remained unchanged, despite a significant change in the distribution of these areas. The medium-risk areas showed a reduction in Dawukou District and Huinong District, but an expansion in Pingluo County. The expansion areas were located in Sha Lake and the Yellow River. The proportion of the medium-high-risk areas and the high-risk areas declined by 3.27% and 0.7%, respectively, but the medium-high-risk areas remained in Sha Lake and the Yellow River Basin. A series of protection and restoration policies were enforced in Shizuishan City to reduce the ecosystem risk facing the environment of the water landscape. However, the restoration of the ecosystem was a lengthy process [74]. Thus, a high-risk level persisted in these areas. The high-risk areas were located the upstream of Shizuishan section of the Yellow River and the wetland in the east of Huinong District. The wetland in this area confronted a high-risk level for years. On the one hand, the landscape of the wetland was highly vulnerable. On the other hand, the disturbance of human activities was severe in this area. Therefore, it is indispensable to designate this wetland as a priority region of ecological management in the future. Meanwhile, supervision should be strengthened in this area to hinder further ecological degradation [75].
3.3. Construction of Ecological Zone Based on Value-Risk
The ESV and the ERI of all evaluation units were standardized to obtain the quadrant distribution of the ecological zone in Shizuishan City from 2010 to 2020, where the X-axis indicates the ESV and the Y-axis represents the ERI (Figure 5). On this basis, the study area could be divided into four different ecological zones (Figure 6). Zone Ⅰ and Zone Ⅲ represent the high-ESV and low-ERI areas and the low-ESV and high-ERI areas, respectively, with these two areas being opposed to each other. Zone Ⅱ and Zone Ⅳ represent the low-ESV and low-ERI areas and high-ESV and high-ERI areas, respectively, with these two regions corresponding to each other.
Accounting for a relatively small proportion, the high-ESV and low-ERI areas (Ⅰ) were mainly distributed in the west of Pingluo County, the northeast of Dawukou District, and the west of Huinong District. These areas were all located in the Helan Mountain and were dominated by forest land and grassland. Moreover, they feature high vegetation coverage and plentiful ecological resources. Therefore, these areas appeared a high level of ESV. Meanwhile, these areas were distant from the city center, which exposed them to solely limited disturbance from human activities. As a result, the ecosystem here could maintain a low level of ecosystem risk. The high-ESV and low-ERI areas (Ⅰ) were also widely distributed along the Yellow River Basin in the east of Pingluo County, where hydrological resources were abundant to promote the vigorous growth of vegetation along the coast. Moreover, the long distance from the city center resulted in the low intensity and scale of human activities. Therefore, there was a high level of ESV but a low level of ERI in these areas.
Accounting for the largest proportion, the low-ESV and low-ERI areas (Ⅱ) were mainly distributed in the north of Pingluo County, the south of Dawukou District, and Huinong District. The landscape type in these areas was dominated by paddy fields and arid land. Due to the strict regulation on preserving cultivated land in the study area, the intensity of urban development was relatively low, and the reduction in cultivated land did not reach a significant level. However, the dilemma is that the area of ecological lands were excessively small. Given the low level of ecosystem risk, it is difficult to achieve high ESV in these areas due to the lack of ecological lands such as grassland, forest land, and water. Therefore, boosting the Grain for Green Project would be a major task for ecological construction in these areas [76].
The low-ESV and high-ERI areas (Ⅲ) were concentrated in the north of Dawukou District and the north of Huinong District. Although these areas were located in the Helan Mountain, the area of forest land was overwhelmingly limited. Virtually, the area of bare land here accounted for a larger proportion. In this case, despite these areas covering an amount of vegetation to achieve a small ESV, the intrusion of bare land caused the ecological environment to be very fragile. At the same time, these areas used to be the key region for mineral resources exploitation, which resulted in a significant reduction in ecological lands. Accordingly, the ERI of these areas was extremely high. The low-ESV and high-ERI areas (Ⅲ) were also extensively distributed in the east of Pingluo County, with bare land as the dominant landscape type.
Accounting for the lowest proportion, the high-ESV and high-ERI areas (Ⅳ) were concentrated in the southwest and the southeast of Pingluo County, where Sha Lake and the Yellow River Basin were located. Due to the abundant hydrological resources in Sha Lake, the ESV was relatively high in these areas. However, there were also some impervious surfaces and cultivated land discovered here. Therefore, the water was severely disturbed by human activities, and the distribution of impervious surfaces was extensive. As a result, there were high ESV and high ERI in this region. With a tremendous amount of cultivated land distributed along the Yellow River Basin, the ecological environment was prone to the damage caused by human activities, such as “reclaiming land from lakes”. Meanwhile, studies revealed that the reclamation of cultivated and the construction of water conservancy projects contributed to the drying of lakes. In this case, they were transformed into secondary salinization land. Therefore, the ERI was relatively high in this region. Moreover, distributed in the south of Dawukou District and the east of Huinong District, the high-ESV and high-ERI areas (Ⅳ) were dominated by water and wetland. Both of them were located in densely populated regions with a large area of impervious surfaces.
4. Discussion
4.1. Policy and Planning Implications
Environmental problems are common problems of urban development and need targeted management measures to solve. At present, the environmental problems of Shizuishan City have constrained the regional development, and the current eco-management pattern conducted by this city is insufficient. It is urgent to reinforce the integration of identification, resolution, and management of environmental issues. In this context, the zonation of ecological space provides a path to identify the barriers and clarify the directions of ecological conservation to realize sustainable development. Management measures and policy recommendations of different zones are provided according to the specific characteristics (Table 6).
Although this study focused mainly on the conservation of the ecological environment in Shizuishan, China, it has general value for the sustainable management of urban ecological space beyond China. First, the rapidly urbanizing global was faced with prevalent environmental issues. Meanwhile, the environmental issues in different countries and regions have similarities, such as climate change, water resources shortage, and biodiversity loss. Thus, the exploration of an ecological spatial zoning approach on a large scale not only shows the way for promoting sustainable development in China but also provides useful references for other developing countries. Second, depending on excessive resource exploitation to promote economic development is the current urbanization model of many developing countries. The instance of Shizuishan is not unique, but a microcosm of quite a few regions in developing countries. Thus, assessing the status of the ecological environment, identifying ecological problems, and proposing targeted management methods in Shizuishan should, therefore, provide useful references for other developing countries in optimizing the management of the ecological environment. Third, by zoning the urban ecological space, this paper reminds us that the ecosystem service value and ecological risk should be placed in the same important position to assess the regional ecological environment quality. The fact that spatio-temporal interactions between ESV and ERI deserve more scholarly attention in future studies. Given the differentiated institutional and social environment, adopting a more localized approach to studies and policies in this field will be a better choice.
4.2. Contributions and Limitations
This study depicts the spatial-temporal variation of Shizuishan City based on ESV and ERI, which have been widely used, and proved to be reasonable and applicable, and the evaluation results can provide a reference for the spatial zonation of the regional ecological space and formulating the corresponding countermeasures. We found that the areas with high ESV were mainly distributed in the places with high vegetation coverage and benign hydrothermal conditions, and covered by the typical ecological land uses incorporating water, wetland, forest land, and grassland, which is consistent with previous studies. The areas with high ERI were distributed in places with strong human disturbance, dominated by water, wetland, and bare land.
However, the study is unable to provide scientific support for planning and reorganizing ecological space through the approach that merely depends on ESV or ERI. An integrated methodology is required to prioritize the urban ecological space and serves as the policy design and the overall arrangements of urban ecological protection. Therefore, we established a zoning approach that integrated ESV and ERI to identify four different types of ecological zones, and comprehensively evaluated the ecological conditions of the study area. This approach can not only take into account a variety of living objects in the ecosystem but also consider regional development in terms of human well-being, and potential risks, which enhances the practicability and utility. In addition, this approach emphasizes the integrity and uniqueness of the ecosystem, which can reflect the ecological environment security status from positive and negative sides, enabling managers to measure the economic, ecological, and social factors more accurately. Thereafter targeted ecological environment management plan and future development plan will be put forward, to further promote a virtuous circle of the regional ecosystem. Finally, this approach provides an innovative research view for ecological security construction, that is, to evaluate the regional ecological environment from multiple perspectives and aspects.
This research attaches importance to establishing a zoning approach to construct ecological zones and reflect the status of the ecological environment. However, ecological zones should be considered as the result of the interaction between the ESV and ERI, but in this study, the mechanism between these two was not discussed clearly, and also the dominant driving forces affecting the construction of ecological zones are still unknown. Moreover, the evaluation models of ESV and ERI still need to be improved, only from the landscape pattern to consider the ecological risk or only from the equivalents to evaluate the ecosystem service value limiting the precision of our study. In the future, research should further explore the precise quantification of ESV and ERI, comprehensively consider the interaction between the ESV and ERI to establish a more thorough zoning approach, and improve the accuracy and scientificity of the assessment of ecological environment status and the ecological management measures.
5. Conclusions
In this study, a spatial zoning approach that integrates ESV and ERI is developed to assess the state of the urban ecological environment from 2010 to 2020, with the targeted management measures put forward. The main conclusions are outlined as follows:
Firstly, the spatial distribution of ESV presents a trend of high in the south but low in the north. The total ESV exhibited an upward trend from 2010 to 2020. Among diverse landscape types, the ESV of water was the highest, mainly due to the lush vegetation along its shores and favorable hydrothermal conditions. The ESV of bare land was close to zero. In this case, it will show a state of low-ESV once invaded by several bare land. Moreover, some low-ESV areas resulted from population aggregation and impervious surfaces expansion. Among the entire ecosystems, the proportion of ESV of services types was unbalanced, with regulating services accounting for over 70%, and provisioning services and cultural services accounting for merely about 5%.
Secondly, the distribution characteristic of ERI is that it was high in the urban fringe but low in the center. The total ERI exhibited a downward trend from 2010 to 2020 due to the reclamation, protection, and restoration work. More specifically, the low-ERI areas expanded constantly, while the high-ERI areas kept shrinking. Among them, the landscape types in low-ERI areas include paddy fields, dry land, forest land, grassland, and bare land, which were concentrated, showing a strong anti-interference capability. Dominated by water and wetland, the high-ERI areas had a fragile ecological environment and were vulnerable to destruction.
Finally, among the four types of ecological zones, the high-ESV and low-ERI areas (Ⅰ) accounted for a relatively low proportion. Dominated by forest land and grassland, these areas had abundant natural resources and were set as “Priority Development Areas”. The low-ESV and low-ERI areas (Ⅱ) accounted for the largest proportion, with paddy fields and dry land as the dominant landscape. Therefore, the ecological lands here were confined, and these areas were set as “Ecological Improvement Areas”. Previously, the low-ESV and high-ERI areas (Ⅲ) presented an important region of mineral resources exploitation, showing a staggered distribution of grassland and bare land. Consequently, the local ecological environment was exceedingly fragile, and they were set as “Exploitation-Prohibited Areas”. Accounting for the lowest proportion, the high ESV and high-ERI areas (Ⅳ) were mainly distributed near Sha Lake, Xinghai Lake, and the Yellow River. Given the strong disturbance from human activities, they were set as “Research-focused Areas”.
The study provided a deeper insight into comprehensively evaluating the ecological conditions and putting forward targeted management measures. However, the limitation of this study is that the evaluation models of ESV and ERI still need to be improved in terms of the indicator selection. Meanwhile, it will be a better choice to further explore the ecological effects behind the zoning approach. For future work, we plan to establish a more thorough zoning approach in order to improve the accuracy of the assessment of the ecological conditions.
Author Contributions
Y.W. and C.G. had the original idea and designed the study. C.G. processed and analyzed the data and wrote the manuscript; Y.W. and Y.Z. had insights on the revision of the manuscript and suggestions for improvement. Y.W. provided help and guidance for data processing mapping. Y.W., C.G. and Y.Z. revised the paper. Y.Z. polished the manuscript. All authors have read and agreed to the published version of the manuscript.
Funding
The research was funded by National Natural Science Foundation of China (Grant No. 71874155).
Institutional Review Board Statement
Not applicable.
Informed Consent Statement
Not applicable.
Data Availability Statement
The data in the article are detailed in Section 2.2. All the data used are reflected in the article. If you need other relevant data, please contact the author.
Acknowledgments
We are grateful for the data provider of Aerospace Information Research Institute of Chinese Academy of Science (http://www.aircas.ac.cn/, accessed on 18 May 2022), and the anonymous reviewers and the editor for their constructive comments and suggestion for the paper.
Conflicts of Interest
The authors declared that they have no conflict of interest to this work.
References
- Filho, W.L.; Icaza, L.E.; Neht, A.; Klavins, M.; Morgan, E.A. Coping with the impacts of urban heat islands. A literature-based study on understanding urban heat vulnerability and the need for resilience in cities in a global climate change context. J. Clean. Prod. 2018, 171, 1040–1049. [Google Scholar]
- Ren, Z.; Zheng, H.; He, X.; Zhang, D.; Shen, G.; Zhai, C. Changes in spatio-temporal patterns of urban forest and its above-ground carbon storage: Implication for urban CO2 emissions mitigation under China’s rapid urban expansion and greening. Environ. Int. 2019, 129, 438–450. [Google Scholar] [CrossRef] [PubMed]
- Zhang, Y.; Long, H.; Tu, S.; Ge, D.; Ma, L.; Wang, L. Spatial identification of land use functions and their tradeoffs/synergies in China: Implications for sustainable land management. Ecol. Indic. 2019, 107, 105550. [Google Scholar] [CrossRef]
- Zhang, X.; Hes, D.; Wu, Y.; Hafkamp, W.; Lu, W.; Bayulken, B.; Schnitzer, H.; Li, F. Corrigendum to “Catalyzing sustainable urban transformations towards smarter, healthier cities through urban ecological infrastructure, regenerative development, eco towns and regional prosperity”. J. Clean. Prod. 2016, 131, 155. [Google Scholar] [CrossRef]
- Xie, G.; Zhang, C.; Zhang, C.S.; Xiao, Y.; Lu, C.X. The value of ecosystem services in China. Resour. Sci. 2015, 37, 1740–1746. [Google Scholar]
- Daily, G.C.; Söderqvist, T.; Aniyar, S.; Arrow, K.; Dasgupta, P.; Ehrlich, P.R.; Folke, C.; Jansson, A.; Jansson, B.-O.; Kautsky, N.; et al. The Value of Nature and the Nature of Value. Science 2000, 289, 395–396. [Google Scholar] [CrossRef] [PubMed] [Green Version]
- Kyvelou, S.; Filho, W.L. Sustainable management and urban space quality in the Mediterranean. Manag. Environ. Qual. Int. J. 2006, 17, 611–624. [Google Scholar] [CrossRef]
- Zhang, Y.; Long, H.; Wang, M.Y.; Li, Y.; Ma, L.; Chen, K.; Zheng, Y.; Jiang, T. The hidden mechanism of chemical fertiliser overuse in rural China. Habitat Int. 2020, 102, 102210. [Google Scholar] [CrossRef]
- Mao, D.; He, X.; Wang, Z.; Tian, Y.; Xiang, H.; Yu, H.; Man, W.; Jia, M.; Ren, C.; Zheng, H. Diverse policies leading to contrasting impacts on land cover and ecosystem services in Northeast China. J. Clean. Prod. 2019, 240, 117961. [Google Scholar] [CrossRef]
- Xiao, R.; Lin, M.; Fei, X.; Li, Y.; Zhang, Z.; Meng, Q. Exploring the interactive coercing relationship between urbanization and ecosystem service value in the Shanghai–Hangzhou Bay Metropolitan Region. J. Clean. Prod. 2019, 253, 119803. [Google Scholar] [CrossRef]
- Zhao, T.; Ouyang, Z.; Wang, X.; Miao, H.; Wei, Y. Ecosystem services and their valuation of terresteial surface water system in China. J. Nat. Resour. 2003, 18, 443–452. [Google Scholar]
- Xie, G.; Lu, C.; Len, Y.; Zhen, D.; Li, S. Ecological assets valuation of the Tibetan Plateau. J. Nat. Resour. 2003, 18, 189–196. [Google Scholar]
- Xie, G.; Zhang, C.; Zhang, L.; Chen, W.; Li, S. Improvement of the Evaluation Method for Ecosystem Service Value Based on Per Unit Area. J. Nat. Resour. 2015, 30, 1243–1254. [Google Scholar]
- Xie, G.; Zhen, L.; Lu, C.; Xiao, Y.; Chen, C. Expert knowledge based valuation method of ecosystem services in China. J. Nat. Resour. 2008, 23, 911–919. [Google Scholar]
- Li, L.; Tang, H.; Lei, J.; Song, X. Spatial autocorrelation in land use type and ecosystem service value in Hainan Tropical Rain Forest National Park. Ecol. Indic. 2022, 137, 108727. [Google Scholar] [CrossRef]
- Costanza, R.; d’Arge, R.; de Groot, R.; Farber, S.; Grasso, M.; Hannon, B.; Limburg, K.; Naeem, S.; O’Neill, R.V.; Paruelo, J.; et al. The value of the world’s ecosystem services and natural capital. Nature 1997, 387, 253–260. [Google Scholar] [CrossRef]
- Zhao, D.; Xiao, M.; Huang, C.; Liang, Y.; Yang, Z. Land Use Scenario Simulation and Ecosystem Service Management for Different Regional Development Models of the Beibu Gulf Area, China. Remote Sens. 2021, 13, 3161. [Google Scholar] [CrossRef]
- Zhou, K.; Liu, Y.; Tan, R.; Song, Y. Urban dynamics, landscape ecological security, and policy implications: A case study from the Wuhan area of central China. Cities 2014, 41, 141–153. [Google Scholar] [CrossRef]
- Xiao, W.; Zhang, W.; Lyu, X.; Wang, X. Spatio-temporal patterns of ecological capital under different mining intensities in an ecologically fragile mining area in Western China: A case study of Shenfu mining area. J. Nat. Resour. 2020, 35, 68–81. [Google Scholar]
- Mekuria, W.; Diyasa, M.; Tengberg, A.; Haileslassie, A. Effects of Long-Term Land Use and Land Cover Changes on Ecosystem Service Values: An Example from the Central Rift Valley, Ethiopia. Land 2021, 10, 1373. [Google Scholar] [CrossRef]
- Barral, M.P.; Oscar, M.N. Land-use planning based on ecosystem service assessment: A case study in the Southeast Pampas of Argentina. Agric. Ecosyst. Environ. 2012, 154, 34–43. [Google Scholar] [CrossRef]
- Das, M.; Das, A. Dynamics of Urbanization and its impact on Urban Ecosystem Services (UESs): A study of a medium size town of West Bengal, Eastern India. J. Urban Manag. 2019, 8, 420–434. [Google Scholar] [CrossRef]
- Fu, J.; Zhang, Q.; Wang, P.; Zhang, L.; Tian, Y.; Li, X. Spatio-Temporal Changes in Ecosystem Service Value and Its Coordinated Development with Economy: A Case Study in Hainan Province, China. Remote Sens. 2022, 14, 970. [Google Scholar] [CrossRef]
- Bernués, A.; Tello-García, E.; Rodríguez-Ortega, T.; Ripoll-Bosch, R.; Casasús, I. Agricultural practices, ecosystem services and sustainability in High Nature Value farmland: Unraveling the perceptions of farmers and nonfarmers. Land Use Policy 2016, 59, 130–142. [Google Scholar] [CrossRef]
- Shiferaw, H.; Bewket, W.; Alamirew, T.; Zeleke, G.; Teketay, D.; Bekele, K.; Schaffner, U.; Eckert, S. Implications of land use/land cover dynamics and Prosopis invasion on ecosystem service values in Afar Region, Ethiopia. Sci. Total Environ. 2019, 675, 354–366. [Google Scholar] [CrossRef] [PubMed]
- Peng, J.; Dang, W.; Liu, Y.; Zong, M.; Hu, X. Review on landscape ecological risk assessment. Acta Geogr. Sin. 2015, 70, 664–677. [Google Scholar]
- Hope, K.B. An examination of ecological risk assessment and management practices. Environ. Int. 2006, 32, 983–995. [Google Scholar] [CrossRef]
- Wang, F.; Wnag, D.; Zhang, L.; Liu, J.; Hu, B.; Sun, Z.; Chen, J. Spatiotemporal analysis of the dynamic changes in land use ecological risks in the urban agglomeration of Beijing-Tianjin-Hebei vegion. Acta Ecol. Sin. 2018, 38, 4307–4316. [Google Scholar]
- Wang, H.; Liu, X.; Zhao, C.; Chang, Y.; Liu, Y.; Zang, F. Spatial-temporal pattern analysis of landscape ecological risk assessment based on land use/land cover change in Baishuijiang National nature reserve in Gansu Province, China. Ecol. Indic. 2021, 124, 107454. [Google Scholar] [CrossRef]
- Zeng, C.; He, J.; He, Q.; Mao, Y.; Yu, B. Assessment of Land Use Pattern and Landscape Ecological Risk in the Chengdu-Chongqing Economic Circle, Southwestern China. Land 2022, 11, 659. [Google Scholar] [CrossRef]
- Solomon, K.R.; Giesy, J.P.; LaPoint, T.W.; Giddings, J.M.; Richards, R.P. Ecological risk assessment of atrazine in North American surface waters. Environ. Toxicol. Chem. 2013, 32, 10–11. [Google Scholar] [CrossRef] [PubMed]
- Le, T.M.; Pham, C.L.T.; Nguyen, H.M.N.; Duong, T.T.; Le, T.P.Q.; Nguyen, D.T.; Vu, N.D.; Minh, T.B.; Tran, T.M. Distribution and ecological risk assessment of phthalic acid esters in surface sediments of three rivers in Northern Vietnam. Environ. Res. 2022, 209, 112843. [Google Scholar] [CrossRef] [PubMed]
- Ali, M.M.; Islam, S.; Islam, A.R.M.T.; Bhuyan, S.; Ahmed, A.S.; Rahman, Z.; Rahman, M. Toxic metal pollution and ecological risk assessment in water and sediment at ship breaking sites in the Bay of Bengal Coast, Bangladesh. Mar. Pollut. Bull. 2022, 175, 113274. [Google Scholar] [CrossRef]
- Du, Y.; Peng, J.; Zhao, S.; Hu, Z.; Wang, Y. Ecological risk assessment of landslide disasters in mountainous areas of Southwest China: A case study in Dali Bai Autonomous Prefecture. Acta Geogr. Sin. 2016, 71, 1544–1561. [Google Scholar]
- Song, J.; Fang, H. Ecological risk evaluation of antibiotics in river water in North China. In Basic & Clinical Pharmacology & Toxicology; WILEY: Hoboken, NJ, USA, 2021; Volume 128, p. 35. [Google Scholar]
- Zhang, T.; Du, Z.; Yang, J.; Yao, X.; Ou, C.; Niu, B.; Yan, S. Land Cover Mapping and Ecological Risk Assessment in the Context of Recent Ecological Migration. Remote Sens. 2021, 13, 1381. [Google Scholar] [CrossRef]
- Paukert, C.P.; Pitts, K.L.; Whittier, J.B.; Olden, J.D. Development and assessment of a landscape-scale ecological threat index for the Lower Colorado River Basin. Ecol. Indic. 2011, 11, 304–310. [Google Scholar] [CrossRef]
- Ayre, K.K.; Landis, W.G. A Bayesian Approach to Landscape Ecological Risk Assessment Applied to the Upper Grande Ronde Watershed, Oregon. Hum. Ecol. Risk Assess. Int. J. 2012, 18, 946–970. [Google Scholar] [CrossRef]
- Jin, X.; Jin, Y.; Mao, X. Ecological risk assessment of cities on the Tibetan Plateau based on land use/land cover changes—Case study of Delingha City. Ecol. Indic. 2019, 101, 185–191. [Google Scholar] [CrossRef]
- Kang, P.; Chen, W.; Hou, Y.; Li, Y. Linking ecosystem services and ecosystem health to ecological risk assessment: A case study of the Beijing-Tianjin-Hebei urban agglomeration. Sci. Total Environ. 2018, 636, 1442–1454. [Google Scholar] [CrossRef]
- Li, W.; Zinda, J.A.; Zhang, Z. Does the “Returning Farmland to Forest Program” Drive Community-Level Changes in Landscape Patterns in China? Forests 2019, 10, 933. [Google Scholar] [CrossRef] [Green Version]
- Peng, J.; Zong, M.; Hu, Y.; Liu, Y.; Wu, J. Assessing Landscape Ecological Risk in a Mining City: A Case Study in Liaoyuan City, China. Sustainability 2015, 7, 8312–8334. [Google Scholar] [CrossRef] [Green Version]
- Hayes, E.H.; Landis, W.G. Regional Ecological Risk Assessment of a Near Shore Marine Environment: Cherry Point, WA. Hum. Ecol. Risk Assess. Int. J. 2004, 10, 299–325. [Google Scholar] [CrossRef]
- Ai, J.; Yu, K.; Zeng, Z.; Yang, L.; Liu, Y.; Liu, J. Assessing the dynamic landscape ecological risk and its driving forces in an island city based on optimal spatial scales: Haitan Island, China. Ecol. Indic. 2022, 137, 108771. [Google Scholar] [CrossRef]
- Zhang, S.; Zhong, Q.; Cheng, D.; Xu, C.; Chang, Y.; Lin, Y.; Li, B. Landscape ecological risk projection based on the PLUS model under the localized shared socioeconomic pathways in the Fujian Delta region. Ecol. Indic. 2022, 136, 108642. [Google Scholar] [CrossRef]
- Wang, P.; Wang, Y.; Liu, X.; Chen, X.; Kong, F. Ecological risk assessment of an ecological migrant resettlement region based on landscape structure: A case study of Hongsibu in Ningxia. Acta Ecol. Sin. 2018, 38, 2672–2682. [Google Scholar]
- Liu, Y.; Wang, Y.; Peng, J.; Zhang, T.; Wei, H. Urban landscape ecological risk assessment based on the 3D framework of adaptive cycle. Acta Geogr. Sin. 2015, 70, 1052–1067. [Google Scholar]
- Zhang, X. Global Land-Coer Classification and Mapping at 30m Using Quantitative Remote Sensing Technique. Ph.D. Dissertation, University of Chinese Academy of Sciences, Beijing, China, 2020. [Google Scholar]
- Rangel-Buitrago, N.; Neal, W.J.; de Jonge, V.N. Risk assessment as tool for coastal erosion management. Ocean Coast. Manag. 2020, 186, 105099. [Google Scholar] [CrossRef]
- Peng, J.; Yang, Y.; Xie, P.; Liu, Y. Zoning for the construction of green space ecological networks in Guangdong Province based on the supply and demand of ecosystem services. Acta Ecol. Sin. 2017, 37, 4562–4572. [Google Scholar]
- Zhen, S.; Zhang, J.; Lin, J.; Zheng, Y.; Wu, X. Evaluation of ecosystem service value and its spatio-temporal differences—Taking the Jiulong River Basin as an example. J. Henan Inst. Sci. Technol. (Nat. Sci. Ed.) 2022, 50, 40–48. [Google Scholar]
- Xie, X.P.; Chen, Z.C.; Wang, F.; Bai, M.W.; Xu, W.Y. Ecological risk assessment of Taihu Lake basin based on landscape pattern. Ying Yong Sheng Tai Xue Bao = J. Appl. Ecol. 2017, 28, 3369–3377. [Google Scholar]
- Zhang, Y.; Zhang, F.; Wang, J.; Ren, Y.; Abduwasit, G.; Hsiang-te, K. Ecological risk assessment and prediction of Ebinur Lake region based on Land use/Land cover change. China Environ. Sci. 2016, 36, 3465–3474. [Google Scholar]
- Xie, G. Regional eco-risk analysis of based on landscape structure and spatial statistics. Acta Ecol. Sin. 2008, 28, 5020–5026. [Google Scholar]
- Zhang, W.; Chang, W.J.; Zhu, Z.C.; Hui, Z. Landscape ecological risk assessment of Chinese coastal cities based on land use change. Appl. Geogr. 2020, 117, 102174. [Google Scholar] [CrossRef]
- Wei, F.; Liu, J.; Xia, L.; Long, X.; Xu, Z. Landscape ecological risk assessment in Weibei dryland region of Shaanxi Province based on LUCC. China Environ. Sci. 2022, 42, 1963–1974. [Google Scholar]
- Yue, Q.; Zhao, X.; Li, S.; Tan, K.; Pu, J.; Wang, Q. Landscape pattern changes and ecological risk in the Padam River Basin under the background of the “Belt and Road” Initiative. World Reg. Stud. 2021, 30, 839–850. [Google Scholar]
- Han, Z.; Li, J.; In, H.; Shengtu, Y.; Xu, C. Analysis of ecological security of wetland in Liaohe River delta based on the landscape pattern. Ecol. Environ. Sci. 2010, 19, 701–705. [Google Scholar]
- Zhen, J.; Wang, Z.; Yu, L.; Wang, L.; Yan, L. Ecological risk assessment of Caohai watershed based on landscape pattern. Environ. Chem. 2019, 38, 784–792. [Google Scholar]
- Peng, J.; Wang, Y.; Zhang, Y.; Wu, J.; Li, W.; Li, Y. Evaluating the effectiveness of landscape metrics in quantifying spatial patterns. Ecol. Indic. 2010, 10, 217–223. [Google Scholar] [CrossRef]
- Gao, B.; Li, C.; Wu, Y.; Zheng, K.; Wu, Y. Landscape ecological risk assessment and influencing factors in ecological conservation area in Sichuan-Yunan provinces, China. Chin. J. Appl. Ecol. 2021, 32, 1603–1613. [Google Scholar]
- Wu, Y.; Wu, C.A. study on kriging-based urban base and standard land value assessment—Taking Hangzhou City as a case. Econ. Geogr. 2001, 21, 584–588. [Google Scholar]
- Du, J.; Zhao, S.; Qiu, S.; Guo, L. Land use change and landscape ecological risk assessment in loess hilly region of western Henan Province from 2000 to 2015. Res. Soil Water Conserv. 2021, 28, 279–291. [Google Scholar]
- Cui, B.; Zhang, Y.; Wang, Z.; Gu, C.; Liu, L.; Wei, B.; Gong, D.; Rai, M.K. Ecological Risk Assessment of Transboundary Region Based on Land-Cover Change: A Case Study of Gandaki River Basin, Himalayas. Land 2022, 11, 638. [Google Scholar] [CrossRef]
- Li, H.; Zhou, Q.; Li, B.; Guo, H.; Wang, F.; He, C. Spatiotemporal Change and Correlation Analysis of Ecosystem Service Values and Ecological Risk in Three Gorges Reservoir Area in the Past 30 Years. Resour. Environ. Yangtze Basin 2021, 30, 654–666. [Google Scholar]
- Wang, S.; Zhang, Q.; Wang, Z.; Yu, L.; Xiang, S.; Cao, M. GIS-based ecological risk assessment and ecological zoing in the Three Gorges Reservior area. Acta Ecol. Sin. 2022, 42, 1–11. [Google Scholar]
- Su, X.; Kang, S.; Tong, L.A. dynamic evaluation method and its application for the ecosystem service value of an inland river basin: A case study on the Shiyanghe River Basin in Hexi Corridor of Gansu Province. Acta Ecol. Sin. 2006, 26, 2011–2019. [Google Scholar]
- Chen, K.; Li, S.; Zhou, Q.; Duo, H.; Chen, Q. Analyzing Dynamics of Ecosystem Service Values based on Variation of Landscape Patterns in Qinghai Lake Area in Recent 25 Years. Resour. Sci. 2008, 30, 274–280. [Google Scholar]
- Yan, E.; Lin, H.; Wang, G.; Xia, C. Analysis of evolution and driving force of ecosystem service values in the Three Gorges Reservoir region during 1990–2011. Acta Ecol. Sin. 2014, 34, 5962–5973. [Google Scholar]
- Wei, H.; Zhao, W.; Zhang, X.; Wang, X. Regional ecosystem service value evaluation based on land use changes: A case study in Dezhou, Shandong Provience, China. Acta Ecol. Sin. 2017, 37, 3830–3839. [Google Scholar]
- Su, Y.; Di, X.; Ming, H.; Zhou, B. Ecological Risk Assessment in Yongchuan District of Chongqing City Based on Landscape Pattern. Bull. Soil Water Conserv. 2020, 40, 195–201. [Google Scholar]
- Wang, J.; Bai, W.; Tian, G. Spatiotemporal characteristics of landscape ecological risks on the Tibetan Plateau. Resour. Sci. 2020, 42, 1739–1749. [Google Scholar] [CrossRef]
- Xu, F.; Lyu, X. Ecological risk pattern based on land use changes in Jiangsu coastal areas. Acta Ecol. Sin. 2018, 38, 7312–7325. [Google Scholar]
- Chen, X.; Xie, G.; Zhang, J. Landscape ecological risk assessment of land use changes in the coastal area of Haikou City in the past 30 years. Acta Ecol. Sin. 2021, 41, 975–986. [Google Scholar]
- Hou, R.; Li, H.; Gao, Y. Ecological Risk Assessment of Land Use in Jiangxia District of Wuhan Based on Landscape Patttern. Res. Soil Water Conserv. 2021, 28, 323–330. [Google Scholar]
- Gao, Q.; He, L.; Huang, X.; Jiang, Y. Dynamics of the Ecosystem service values of framing-pastoral zone along the upper reaches of Haihe River. J. Nat. Resour. 2002, 17, 706–712. [Google Scholar]
- Yu, J.; Tang, B.; Chen, Y.; Zhang, L.; Nie, Y.; Deng, W. Landscape ecological risk assessment and ecological security pattern construction in landscape resource-based city: A case study of Zhangjiajie City. Acta Ecol. Sin. 2022, 42, 1290–1299. [Google Scholar]
- Cui, Y.; Gao, X.; Dong, B.; Wei, H. Landscape ecological risk assessment of county. J. Zhejiang AF Univ. 2021, 38, 541–551. [Google Scholar]
- Li, T.; Wang, Z.; Gao, W. Ecological Risk assessment of moon island in hebei province based on landscape pattern. Trans. Oceanol. Limnol. 2021, 43, 169–178. [Google Scholar]
Figure 1.
Overview of the study area.

Figure 2.
Distribution of ecosystem service value in Shizuishan City, 2020.

Figure 3.
Ecosystem service value of different landscape types and services types in Shizuishan City, 2010–2020.
Figure 3.
Ecosystem service value of different landscape types and services types in Shizuishan City, 2010–2020.

Figure 4.
Distribution of ecological risk in Shizuishan City from 2000 to 2020.

Figure 5.
Quadrant distribution of ecological zones in Shizuishan.

Figure 6.
Spatial distribution of ecological zones in Shizuishan City.


Table 1.
Reclassified land-use types.
| Reclassification System | Original Classification System | Area (Km2) | ||
|---|---|---|---|---|
| 2010 | 2015 | 2020 | ||
| Dry land | Rainfed cropland | 1090.82 | 1104.95 | 1147.04 |
| Paddy field | Irrigated cropland | 502.49 | 518.56 | 539.64 |
| Forest land | Open deciduous broadleaved forest | 239.87 | 234.60 | 221.98 |
| Closed deciduous broadleaved forest | ||||
| Open evergreen needle-leaved forest | ||||
| Closed evergreen needle-leaved forest | ||||
| Grassland | Shrubland | 797.04 | 764.10 | 668.61 |
| Grassland | ||||
| Sparse vegetation | ||||
| Herbaceous cover | ||||
| Wetland | Wetland | 44.10 | 57.86 | 83.35 |
| Impervious Surface | Impervious Surface | 154.53 | 166.71 | 221.52 |
| Bare Land | Bare areas | 1192.12 | 1161.72 | 1111.02 |
| Unconsolidated bare areas | ||||
| Water | Water body | 60.23 | 72.70 | 88.04 |
Table 2.
China’s equivalents of ecosystem service value supplied by per unit area of ecosystem.
| Landscape Type | Dry Land | Paddy Field | Forest Land | Grassland | Wetland | Bare Land | Water | Impervious Surface |
|---|---|---|---|---|---|---|---|---|
| Provisioning services | ||||||||
| Food production | 0.85 | 1.36 | 0.23 | 0.24 | 0.51 | 0.00 | 0.80 | 0.00 |
| Raw material production | 0.40 | 0.09 | 0.54 | 0.35 | 0.50 | 0.00 | 0.23 | 0.00 |
| Regulating services | ||||||||
| Water supply | 0.02 | 2.63 | 0.28 | 0.20 | 2.59 | 0.00 | 8.29 | 0.00 |
| Climate regulation | 0.67 | 1.11 | 1.76 | 1.24 | 1.90 | 0.02 | 0.77 | 0.00 |
| Gas regulation | 0.36 | 0.57 | 5.27 | 3.28 | 3.60 | 0.00 | 2.29 | 0.00 |
| Purify environment | 0.10 | 0.17 | 1.57 | 1.08 | 3.60 | 0.00 | 2.29 | 0.00 |
| Hydrological regulation | 0.27 | 2.72 | 3.81 | 2.40 | 24.23 | 0.03 | 102.24 | 0.00 |
| Supporting services | ||||||||
| Soil retention | 1.03 | 0.01 | 2.14 | 1.51 | 2.31 | 0.02 | 0.93 | 0.00 |
| Nutrient cycling | 0.12 | 0.19 | 0.16 | 0.12 | 0.18 | 0.00 | 0.07 | 0.00 |
| Biodiversity conservation | 0.13 | 0.21 | 1.95 | 0.37 | 7.87 | 0.02 | 2.55 | 0.00 |
| Cultural services | ||||||||
| Aesthetic landscape | 0.06 | 0.09 | 3.86 | 0.61 | 4.73 | 0.01 | 1.89 | 0.00 |
Table 3.
Ecological meaning and expression of the landscape pattern index.
| Index | Calculation | Ecological Meaning |
|---|---|---|
| Landscape fragmentation degree index | Represents the fragmentation of the landscape, the higher the value, the lower the stability of the landscape ecosystem [58]. | |
| Landscape separation degree index | Represents the separation of patches in the landscape, the higher the value, the more complex the landscape spatial distribution [59]. | |
| Landscape dominance degree index | Represents the significance of patches in the landscape, which directly reflects the influence of patches on the formation and change in landscape patterns [60]. |
Note: ni is the number of patches in the i the landscape type; Ai is the area of the ith landscape type, A is the total area; Li is the landscape relative density; Pi is the landscape relative coverage; d and e are the weights of the corresponding indices, which are 0.6 and 0.4 respectively.
Table 4.
Ecosystem service value (%) of landscape types and services types in Shizuishan City, 2020.
Table 4.
Ecosystem service value (%) of landscape types and services types in Shizuishan City, 2020.
| ESV (RMB, Billion) | Proportion (%) | |
|---|---|---|
| Landscape Type | ||
| Arid Land | 1.059 | 12.38 |
| Paddy Field | 1.136 | 13.29 |
| Forest Land | 1.102 | 12.89 |
| Grassland | 1.751 | 20.48 |
| Wetland | 0.997 | 11.67 |
| Bare Land | 0.026 | 0.30 |
| Water | 2.479 | 28.99 |
| Impervious surface | 0.000 | 0.00 |
| Services Type | ||
| Provisioning Services | 0.680 | 7.96 |
| Regulating Services | 6.227 | 72.83 |
| Supporting Services | 1.194 | 13.97 |
| Cultural Services | 0.449 | 5.25 |
Table 5.
Area (%) of ecological risk classes in Shizuishan City, 2010–2020.
| Risk Level | 2010 | 2015 | 2020 | |||
|---|---|---|---|---|---|---|
| Area (km2) | Proportion (%) | Area (km2) | Proportion (%) | Area (km2) | Proportion (%) | |
| Low Risk | 223.69 | 5.48 | 368.97 | 9.04 | 1110.03 | 27.19 |
| Medium-Low Risk | 1744.86 | 42.74 | 2074.07 | 50.83 | 1631.94 | 39.98 |
| Medium Risk | 1213.99 | 29.74 | 1059.22 | 25.96 | 1046.34 | 25.63 |
| Medium-High Risk | 836.15 | 20.48 | 529.23 | 12.97 | 273.41 | 6.70 |
| High Risk | 63.68 | 1.56 | 48.80 | 1.20 | 20.61 | 0.50 |
Table 6.
Management measures of different ecological zones in Shizuishan City.
| Areas | Criteria | Barriers | Countermeasures |
|---|---|---|---|
| Prioritized Development Areas | High-ESV and Low-ERI | None | (1) In these areas, the theory of sustainable development must be adhered to. It is better to strengthen the protection of ecological lands such as water and soil conservation forests and sand-fixing forests, ensuring the delivery of ESV to the surrounding areas. (2) It is requisite to promote the coordinated development of economic growth and ecological conservation by giving full play to the advantages of natural conditions in these areas. (3) Through sensible land use planning, eco-tourism projects should be undertaken on the basis of preserving the ecological environment, thus manifesting the value of ecosystem service and implementing the ecological civilization construction conviction of “Lucid waters and lush mountains are invaluable assets”. |
| Improvement Areas | Low-ESV and Low-ERI | Lack of Ecological Lands | (1) The foremost task in these areas is to improve ESV. Therefore, it will be a good choice to carry out ecological reconstruction of bare land here to expand the ecological lands on the premise of preventing the decline in the total area of permanent basic farmland and the erosion of cultivated land. (2) Apart from improving the quality of the ecological environment and optimizing the layout of the ecological structure [77], it is also essential to prevent the rise of ERI. So, it is better to strengthen the supervision of the ecological environment in these areas to prevent environmental vandalism such as deforestation, mining, and river pollution. |
| Exploitation- Prohibited Areas | Low-ESV and High-ERI | Fragile Environment | (1) The primary objective is to reduce the level of ERI, which can be achieved by giving priority to strengthening the management and restoration of bare land, reclaiming the bare land caused by coal mining, the bare land concentrated in a large area, and the bare land mixed in grassland into arbor land, shrub land, and grassland through engineering and biological measures. Meanwhile, gradually discontinuing mining activities and liquidating the existing mining enterprises are also good choices. (2) The secondary aim is to improve the level of ESV, by implementing the protection and restoration of grassland on the premise of “natural restoration is the mainstay and artificial restoration is the supplementary” [78]. For the salted grassland, it is essential to prevent the irreversible damage caused by excessive grazing by taking such measures as grassland sealing and breeding and seasonal grazing [79]. |
| Research-focused Areas | High-ESV and High-ERI | Strong Human Disturbance | (1) First of all, it is necessary to establish the ecological protection areas for important water bodies and wetlands such as Xinghai Lake, Sha Lake, and the Yellow River Basin, with the responsibilities for ecological protection allocated to each town and subdistrict offices in line with the principle of proximity, thus putting an end to the phenomenon of “reclaiming farmlands from lakes”. (2) Secondly, it is essential to reduce soil erosion and the impact of the disturbance caused by humans by strengthening the maintenance of forest land and grassland projects along the river. (3) Finally, to deal with the strong human interference, the number of tourists on every scenic spot must be limited. Meanwhile, through cooperation with colleges or scientific research institutions in setting up scientific investigation stations or scenery sketching bases and prohibiting irrelevant personnel from entering, the flow of people can be controlled, while the scientific and aesthetic value of the ecosystem can be fully demonstrated. |
Publisher’s Note: MDPI stays neutral with regard to jurisdictional claims in published maps and institutional affiliations. |
© 2022 by the authors. Licensee MDPI, Basel, Switzerland. This article is an open access article distributed under the terms and conditions of the Creative Commons Attribution (CC BY) license (https://creativecommons.org/licenses/by/4.0/).
Share and Cite
MDPI and ACS Style
Wu, Y.; Gu, C.; Zhang, Y. Towards Sustainable Management of Urban Ecological Space: A Zoning Approach Hybridized by Ecosystem Service Value and Ecological Risk Assessment. Land 2022, 11, 1220. https://doi.org/10.3390/land11081220
AMA Style
Wu Y, Gu C, Zhang Y. Towards Sustainable Management of Urban Ecological Space: A Zoning Approach Hybridized by Ecosystem Service Value and Ecological Risk Assessment. Land. 2022; 11(8):1220. https://doi.org/10.3390/land11081220
Chicago/Turabian StyleWu, Yuzhe, Chenzhuo Gu, and Yingnan Zhang. 2022. "Towards Sustainable Management of Urban Ecological Space: A Zoning Approach Hybridized by Ecosystem Service Value and Ecological Risk Assessment" Land 11, no. 8: 1220. https://doi.org/10.3390/land11081220
Note that from the first issue of 2016, this journal uses article numbers instead of page numbers. See further details here.