
Diagnostic Species Diversity Pattern Can Provide Key Information on Vegetation Change: An Insight into High Mountain Habitats in Central Apennines

 ,
,  , , ,
, , ,  and
and 
Abstract
:1. Introduction
2. Materials and Methods
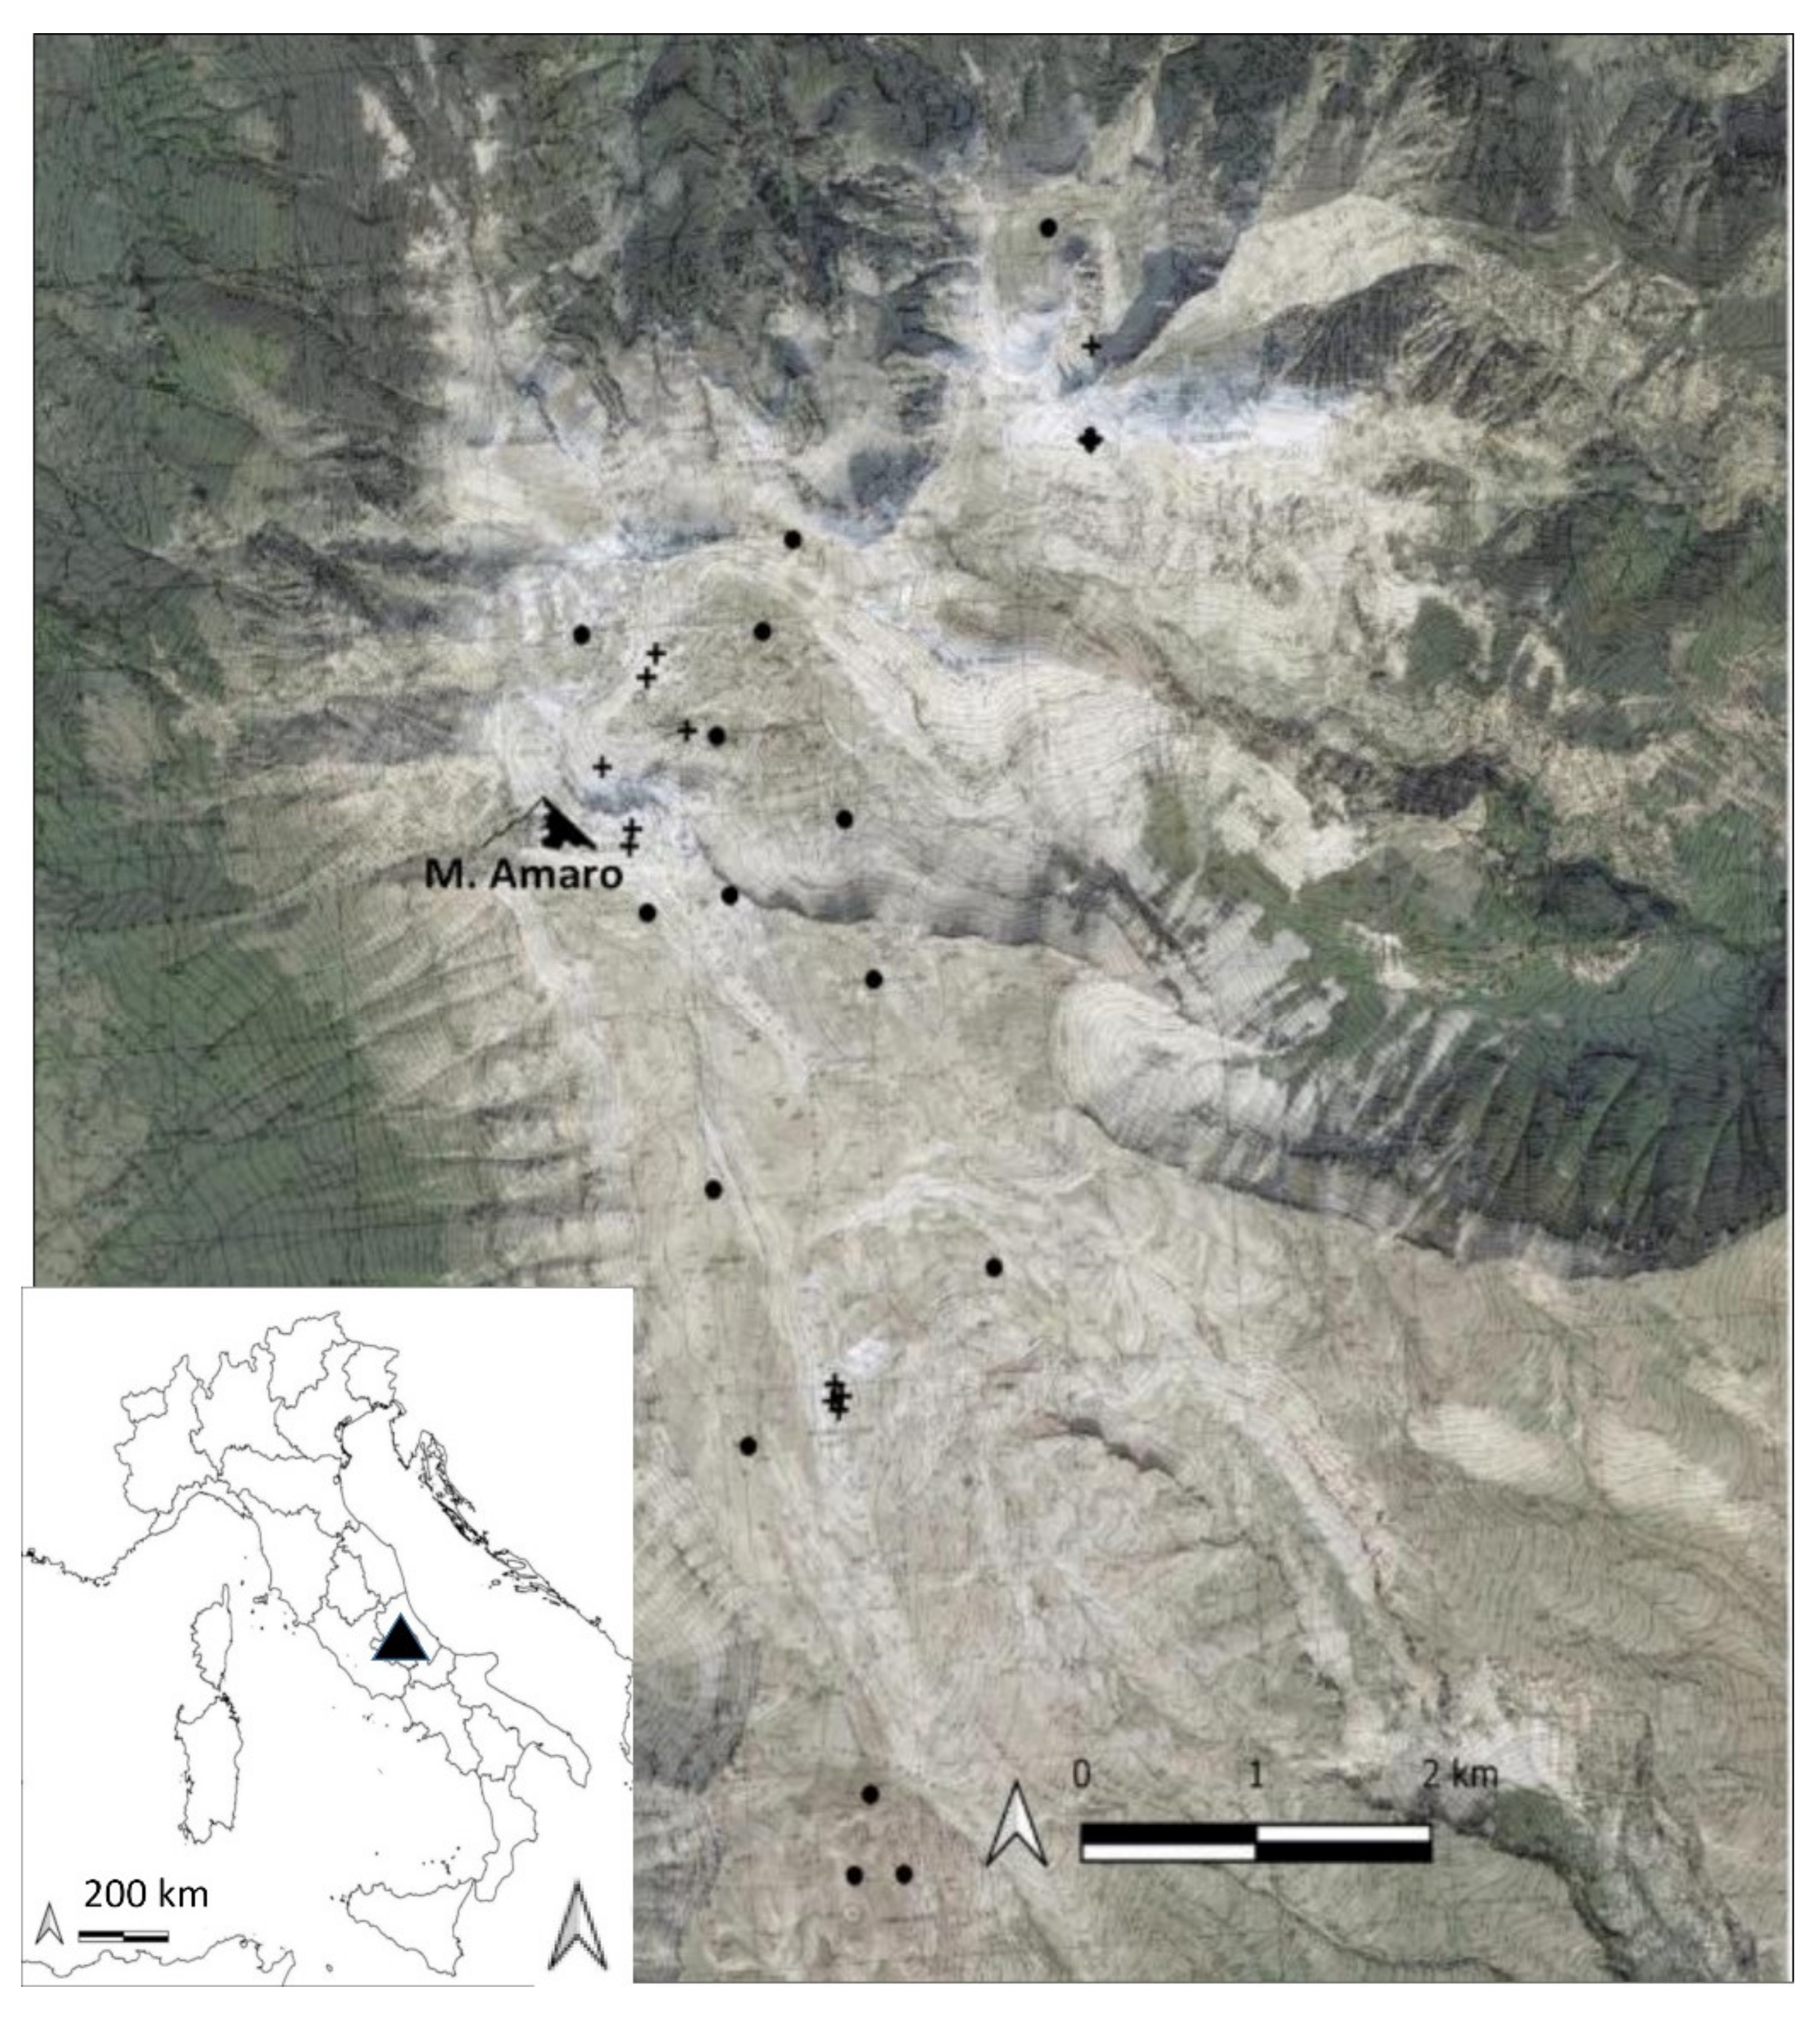
2.1. Study Area
2.2. Vegetation Data
2.3. Data Analysis
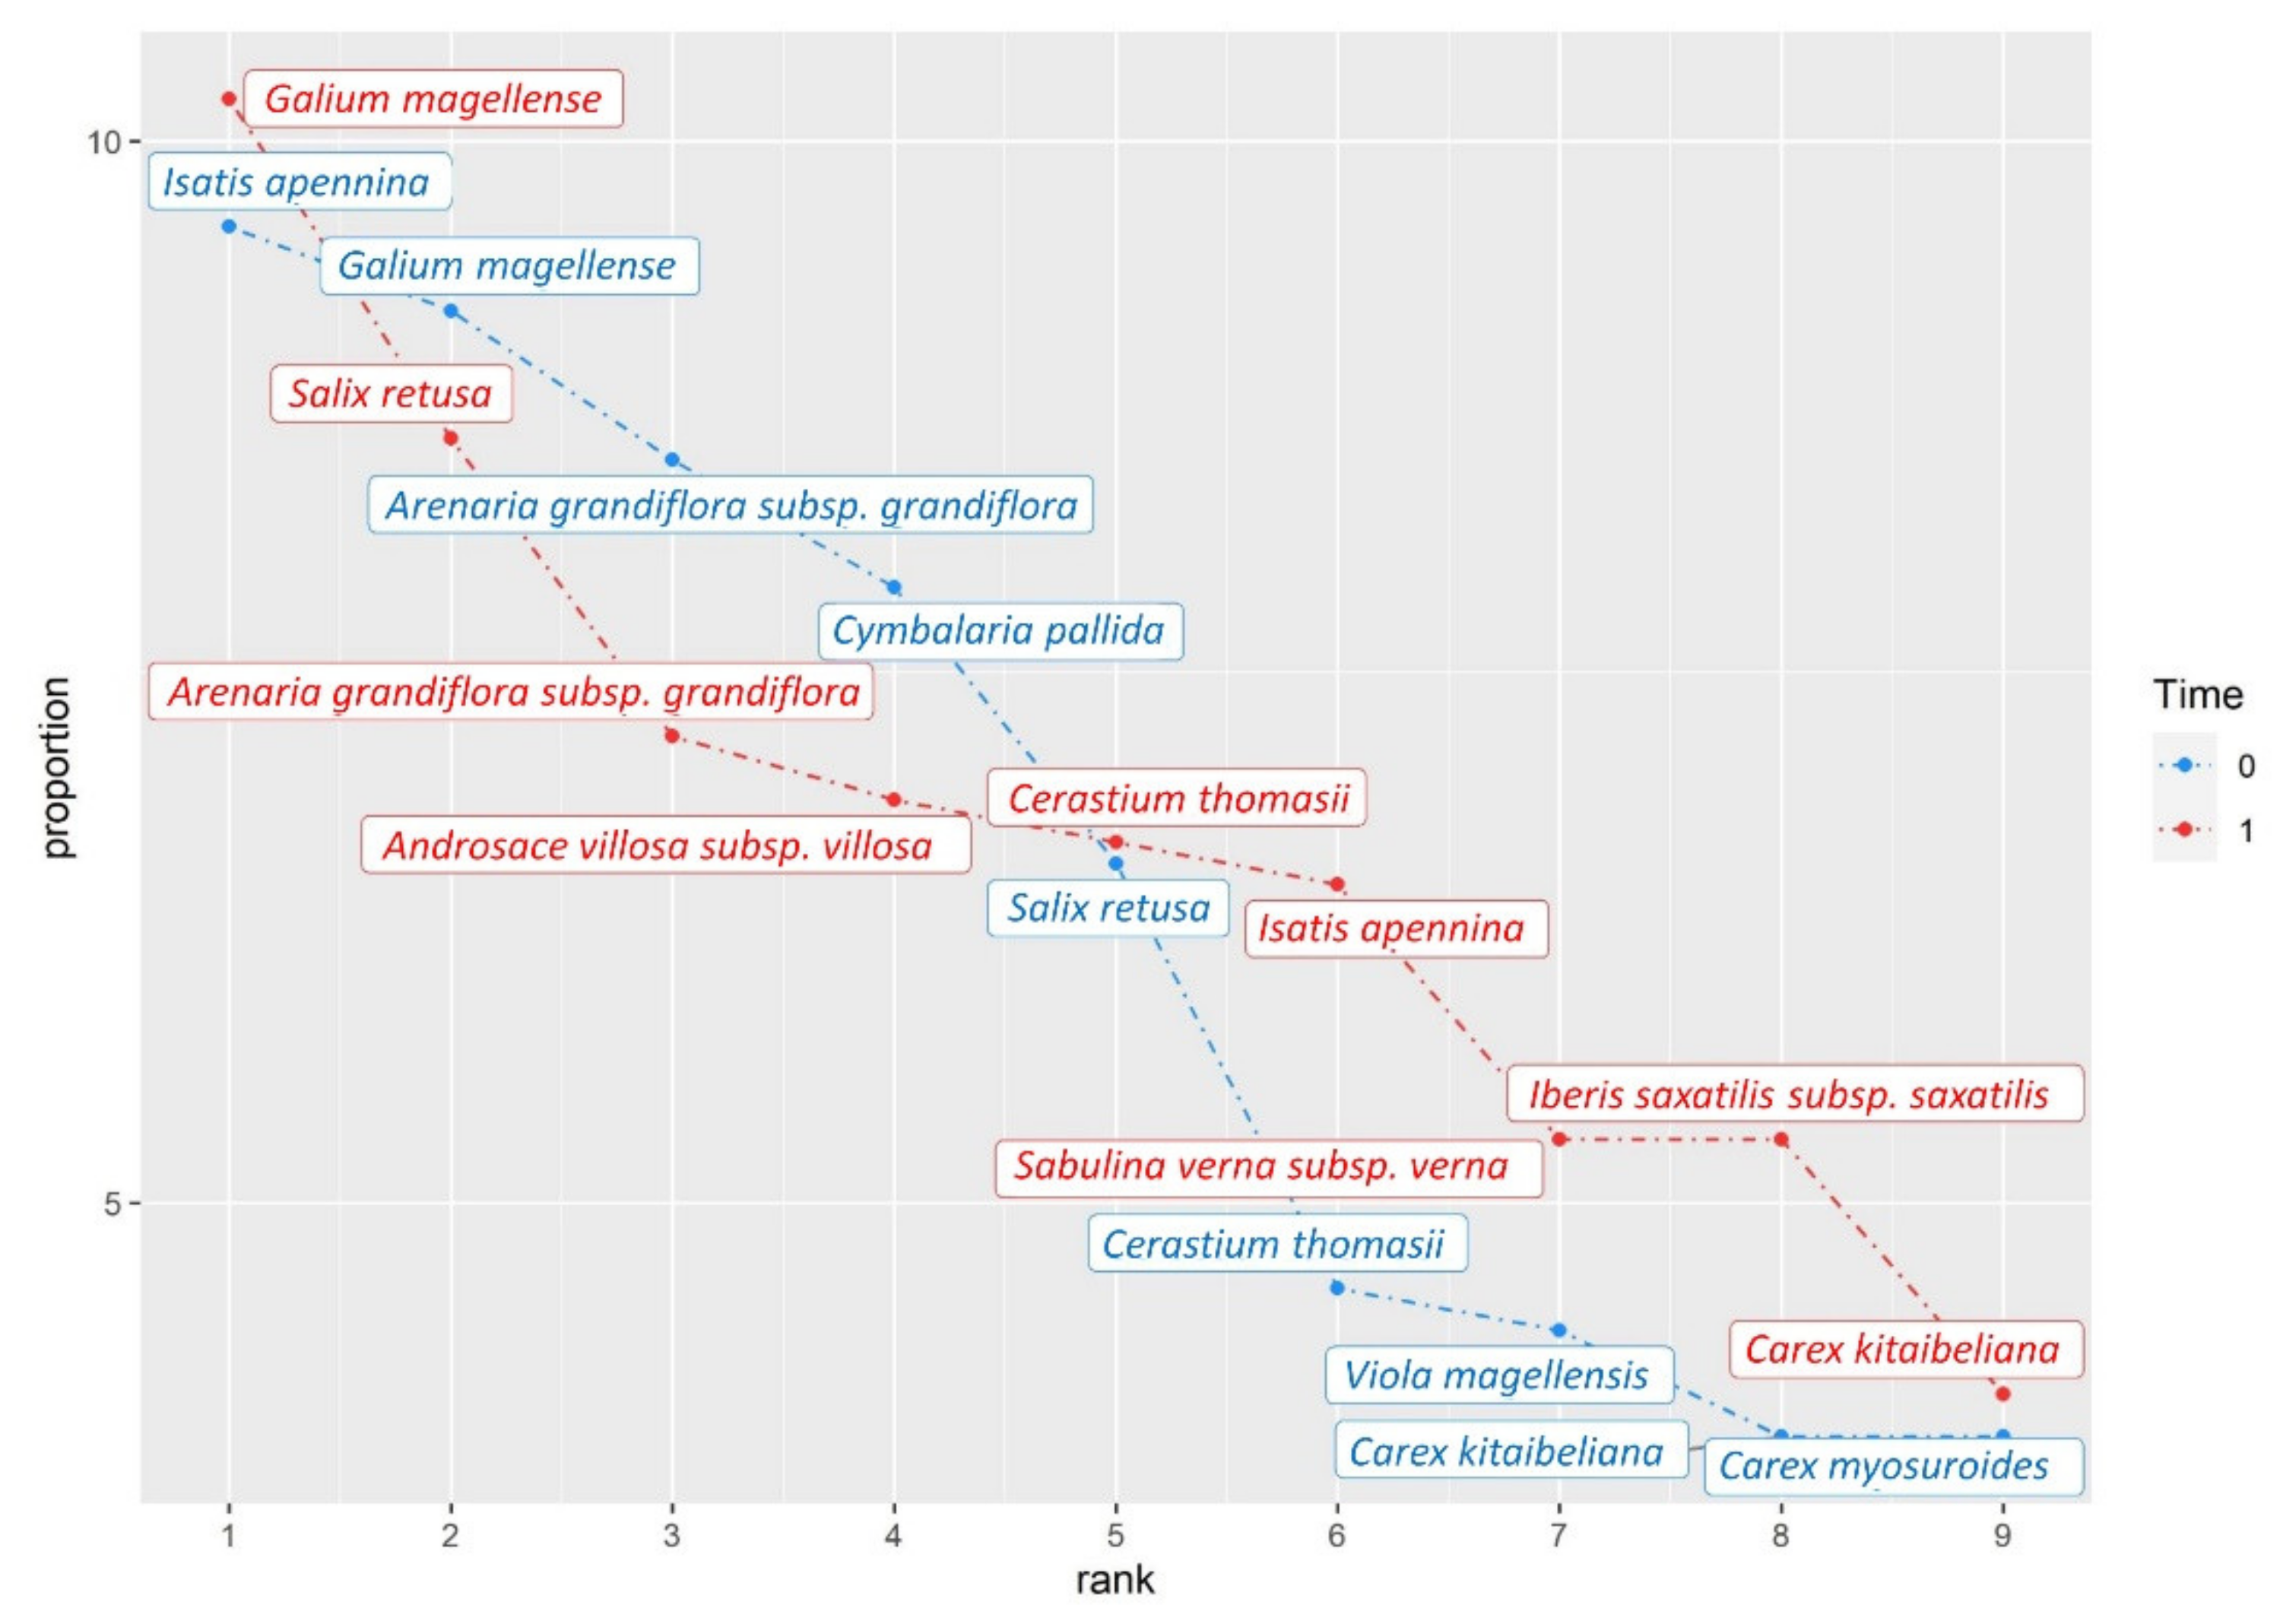
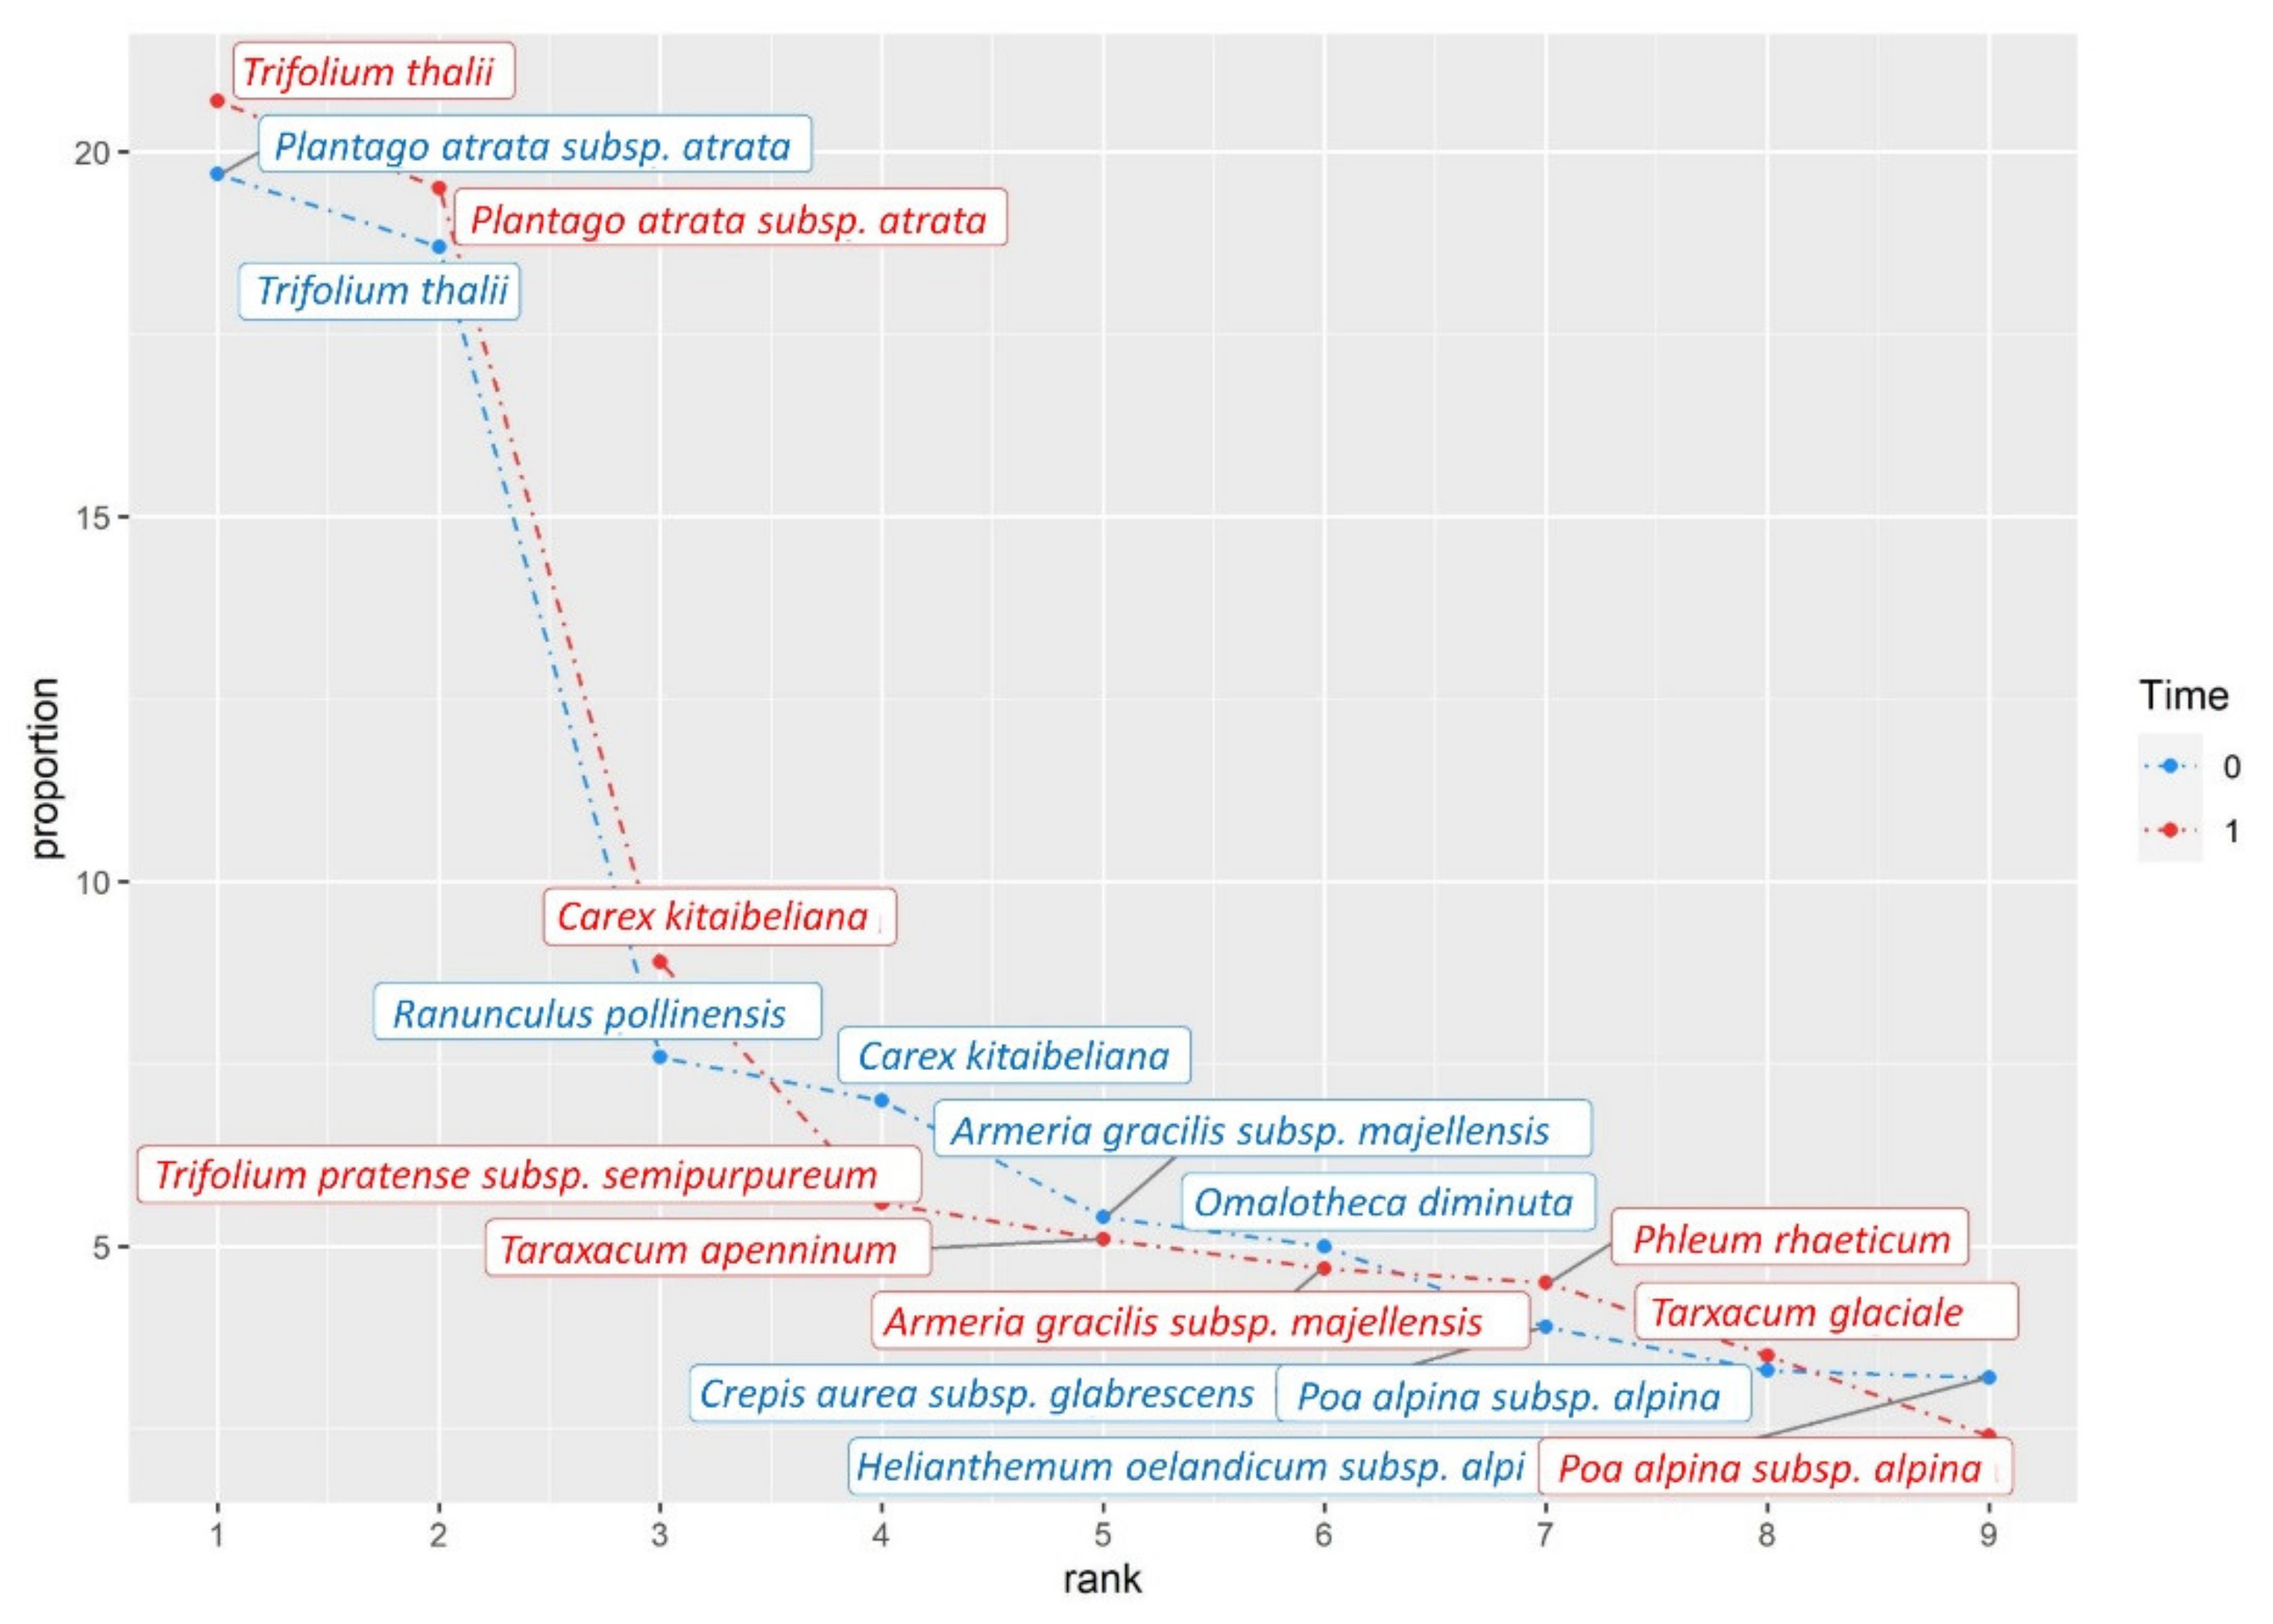
3. Results
4. Discussion
5. Conclusions
Author Contributions
Funding
Institutional Review Board Statement
Informed Consent Statement
Data Availability Statement
Acknowledgments
Conflicts of Interest
Appendix A

Appendix B

Appendix C

Appendix D

| TAXON | LGr | Family | % Cover T1 | % Cover T2 |
|---|---|---|---|---|
| Galium magellense Community(Screes) | ||||
| *d Achillea barrelieri subsp. barrelieri | H scap | Asteraceae | 0 | 0.13 |
| * Alyssum cuneifolium | CH suffr | Brassicaceae | 2.03 | 0.93 |
| Androsace villosa subsp. villosa | CH rept | Primulaceae | 2.23 | 4.2 |
| * Androsace vitaliana subsp. praetutiana | CH suffr | Primulaceae | 1.4 | 0.23 |
| Anthemis cretica | H scap | Asteraceae | 0 | 0.23 |
| Anthyllis vulneraria subsp. pulchella | H caesp | Fabaceae | 2 | 1.2 |
| Arabis alpina subsp. caucasica | H scap | Brassicaceae | 0.63 | 0.1 |
| *d Arenaria bertolonii | CH suffr | Caryophyllaceae | 0.2 | 0.07 |
| Arenaria grandiflora subsp. grandiflora | CH suffr | Caryophyllaceae | 5.4 | 4.37 |
| * Armeria gracilis subsp. majellensis | H ros | Plumbaginaceae | 0 | 0.2 |
| Aster alpinus subsp. alpinus | H scap | Asteraceae | 0.2 | 0.2 |
| Bistorta vivipara | G rhiz | Polygonaceae | 0.03 | 0.2 |
| dCampanula cochleariifolia | H scap | Campanulaceae | 0.2 | 1.04 |
| Campanula scheuchzeri subsp. scheuchzeri | H scap | Campanulaceae | 1 | 0 |
| dCarduus chrysacanthus | H scap | Asteraceae | 0 | 1 |
| Carex kitaibeliana | H caesp | Cyperaceae | 2.5 | 2.5 |
| Carex myosuroides | H caesp | Cyperaceae | 2.5 | 2.5 |
| * Cerastium thomasii | CH suffr | Caryophyllaceae | 2.9 | 4.07 |
| *d Cerastium tomentosum | CH suffr | Caryophyllaceae | 0.03 | 0.2 |
| * Crepis magellensis | H ros | Asteraceae | 0 | 0.2 |
| dCrepis pygmaea | G rhiz | Asteraceae | 0.23 | 0.23 |
| *d Cymbalaria pallida | H scap | Plantaginaceae | 5 | 1.2 |
| * Cynoglossum magellense | CH suffr | Boraginaceae | 0 | 0.2 |
| dDoronicum columnae | G rhiz | Asteraceae | 1 | 0.2 |
| Draba aizoides subsp. aizoides | H ros | Brassicaceae | 1 | 1 |
| Edraianthus graminifolius subsp. graminifolius | CH suffr | Campanulaceae | 1 | 1.03 |
| Erigeron epiroticus | H scap | Asteraceae | 0 | 0.03 |
| Euphrasia liburnica | T scap | Orobanchaceae | 0 | 0.2 |
| Festuca alfrediana | H caesp | Poaceae | 0 | 0.03 |
| * Festuca violacea subsp. italica | H caesp | Poaceae | 0 | 1.03 |
| *d Galium magellense | H scap | Rubiaceae | 5.8 | 6.2 |
| Getiana orbicularis | H ros | Gentianaceae | 0.03 | 0.03 |
| Helianthemum oelandicum subsp. alpestre | CH suffr | Cistaceae | 0 | 0.2 |
| * Helictochloa praetutiana subsp. praetutiana | H caesp | Poaceae | 0 | 0.07 |
| Iberis saxatilis subsp. saxatilis | CH suffr | Brassicaceae | 2.4 | 3.2 |
| dIsatis apennina | G rhiz | Brassicaceae | 6.1 | 3.93 |
| Leontopodium nivale | H scap | Asteraceae | 1.03 | 0.23 |
| dLeucopoa dimorpha | H caesp | Poaceae | 0.2 | 1.03 |
| Linaria alpina | H scap | Plantaginaceae | 0.07 | 0.31 |
| * Linaria purpurea | H scap | Plantaginaceae | 0 | 0.03 |
| Sabulina verna subsp. verna | CH suffr | Caryophyllaceae | 1.43 | 3.23 |
| * Myosotis graui | H scap | Boraginaceae | 0.23 | 0.5 |
| *d Noccaea stylosa | CH suffr | Brassicaceae | 0.2 | 0.07 |
| dPapaver alpinum subsp. alpinum | H scap | Papaveraceae | 0.53 | 0.37 |
| * Pedicularis elegans | H ros | Orobanchaceae | 0.03 | 0.2 |
| Phyteuma orbiculare | H scap | Campanulaceae | 0.2 | 0.03 |
| Poa alpina subsp. alpina | H caesp | Poaceae | 0.7 | 1.5 |
| Poa molinerii | H caesp | Poaceae | 0.03 | 0.2 |
| Potentilla crantzii | H scap | Rosaceae | 0.2 | 0.03 |
| Pulsatilla alpina subsp. millefoliata | H scap | Ranunculaceae | 0 | 0.23 |
| dRanunculus brevifolius | G rhiz | Ranunculaceae | 0 | 0.03 |
| Ranunculus seguieri subsp. seguieri | H scap | Ranunculaceae | 0.03 | 0.03 |
| Rumex nebroides | H scap | Polygonaceae | 0.2 | 0.03 |
| Salix retusa | CH frut | Salicaceae | 4.17 | 5.2 |
| * Saxifraga exarata subsp. ampullacea | H scap | Saxifragaceae | 0.03 | 0.07 |
| Saxifraga glabella | CH pulv | Saxifragaceae | 0.2 | 0 |
| *d Saxifraga oppositifolia subsp. speciosa | CH pulv | Saxifragaceae | 0.43 | 0.63 |
| *d Scorzoneroides montana subsp. breviscapa | H ros | Asteraceae | 0.43 | 0.17 |
| dSedum atratum | T scap | Crassulaceae | 0.03 | 0.07 |
| Senecio squalidus subsp. rupestris | H bienn | Asteraceae | 0.8 | 0.6 |
| Silene acaulis subsp. bryoides | CH pulv | Caryophyllaceae | 0.4 | 1.2 |
| * Taraxacum apenninum | H ros | Asteraceae | 0 | 0.2 |
| Thymus praecox subsp. polytrichus | CH rept | Lamiaceae | 0 | 0.23 |
| * Trifolium pratense subsp. semipurpureum | H scap | Fabaceae | 0 | 0.2 |
| Trinia dalechampii | H scap | Apiaceae | 1.23 | 0.23 |
| Valeriana montana | H scap | Caprifoliaceae | 1 | 0.23 |
| Valeriana saliunca | H scap | Caprifoliaceae | 0.6 | 0.63 |
| * Viola eugeniae subsp. eugeniae | H scap | Violaceae | 0.3 | 0 |
| *d Viola magellensis | H scap | Violaceae | 2.8 | 0.47 |
| Ziziphora granatensis subsp. alpina | CH suffr | Lamiaceae | 0 | 0.03 |
| Trifolium thalii community (Snowbeds) | ||||
| * Achillea barrelieri subsp. barrelieri | H scap | Asteraceae | 0.33 | 0.1 |
| Anthyllis vulneraria subsp. pulchella | H caesp | Fabaceae | 0.6 | 2.97 |
| Arabis alpina subsp. caucasica | H scap | Brassicaceae | 0.03 | 0 |
| Arabis surculosa | H scap | Brassicaceae | 0.87 | 0.5 |
| Arenaria grandiflora subsp. grandiflora | CH suffr | Caryophyllaceae | 0.03 | 0.03 |
| * Armeria gracilis subsp. majellensis | H ros | Plumbaginaceae | 8.57 | 8.2 |
| Astragalus depressus subsp. depressus | H ros | Fabaceae | 0.47 | 2.8 |
| Bellidiastrum michelii | H ros | Asteraceae | 0 | 0.03 |
| Bellis perennis | H Ros | Asteraceae | 0.1 | 0 |
| Bistorta vivipara | G rhiz | Polygonaceae | 0.2 | 0.03 |
| Botrychium lunaria | G rhiz | Ophioglossaceae | 0.33 | 0.2 |
| Campanula scheuchzeri subsp. scheuchzeri | H scap | Campanulaceae | 0.9 | 0.1 |
| Carduus chrysacanthus | H scap | Asteraceae | 1.47 | 1 |
| Carex kitaibeliana | H caesp | Cyperaceae | 11.23 | 15.6 |
| Cerastium arvense subsp. suffruticosum | H scap | Caryophyllaceae | 0.7 | 0.23 |
| Cerastium cerastoides | H scap | Caryophyllaceae | 0.03 | 0 |
| * Cerastium thomasii | CH suffr | Caryophyllaceae | 0.7 | 0.3 |
| * Cerastium tomentosum | CH suffr | Caryophyllaceae | 0 | 1 |
| dCrepis aurea subsp. glabrescens | H ros | Asteraceae | 6.2 | 1.47 |
| Crepis pygmaea | G rhiz | Asteraceae | 0.2 | 0 |
| dDraba aizoides subsp. aizoides | H ros | Brassicaceae | 0.47 | 0.1 |
| * Edraianthus graminifolius subsp. graminifolius | CH suffr | Campanulaceae | 0.23 | 0 |
| Erigeron epiroticus | H scap | Asteraceae | 0.1 | 0.17 |
| Euphrasia liburnica | T scap | Orobanchaceae | 2.5 | 2.83 |
| Euphrasia salisburgensis | T scap | Orobanchaceae | 0.07 | 0.2 |
| * Festuca violacea subsp. italica | H caesp | Poaceae | 0.5 | 1.6 |
| * Galium magellense | H scap | Rubiaceae | 0.3 | 0.07 |
| Gentiana orbicularis | H ros | Gentianaceae | 0 | 0.03 |
| Gentiana verna subsp. verna | H ros | Gentianaceae | 0.3 | 0.6 |
| * Gentianella columnae | H bienn | Gentianaceae | 0 | 0.03 |
| dHelianthemum oelandicum subsp. alpestre | CH suffr | Cistaceae | 5.07 | 1.24 |
| * Helictochloa praetutiana subsp. praetutiana | H caesp | Poaceae | 0.23 | 1.3 |
| Herniaria glabra subsp. nebrodensis | T scap | Caryophyllaceae | 1.27 | 0 |
| Hypericum richeri subsp. richeri | H scap | Hypericaceae | 0.2 | 0 |
| * Leucopoa dimorpha | H caesp | Poaceae | 0.2 | 0 |
| dLuzula spicata subsp. bulgarica | H caesp | Juncaceae | 0.43 | 1.07 |
| Sabulina verna subsp. verna | CH suffr | Caryophyllaceae | 2.07 | 1.23 |
| * Myosotis graui | H scap | Boraginaceae | 0.13 | 0.07 |
| * Noccaea stylosa | CH suffr | Brassicaceae | 0.27 | 0.01 |
| Omalotheca diminuta | H scap | Asteraceae | 7.97 | 2.7 |
| Oreojuncus monanthos | G rhiz | Juncaceae | 0.03 | 0.2 |
| Oxytropis campestris | H scap | Fabaceae | 0.03 | 0 |
| * Pedicularis elegans | H ros | Orobanchaceae | 0.03 | 0.1 |
| Phleum rhaeticum | H caesp | Poaceae | 3.37 | 7.93 |
| dPhyteuma orbiculare | H scap | Campanulaceae | 0.23 | 0 |
| Pilosella lactucella subsp. nana | H ros | Asteraceae | 1.23 | 0.5 |
| dPlantago atrata subsp. atrata | H ros | Plantaginaceae | 31.57 | 34.03 |
| Poa alpina subsp. alpina | H caesp | Poaceae | 5.33 | 4.23 |
| dPolygala alpestris subsp. angelisii | H scap | Polygonaceae | 0.03 | 0.07 |
| Potentilla crantzii | H scap | Rosaceae | 0.73 | 3.93 |
| dPulsatilla alpina subsp. millefoliata | H scap | Ranunculaceae | 0.2 | 0.07 |
| Ranunculus brevifolius | G rhiz | Ranunculaceae | 0.23 | 0.03 |
| *d Ranunculus pollinensis | H scap | Ranunculaceae | 12.1 | 3.63 |
| Rumex nebroides | H scap | Polygonaceae | 0.43 | 0.2 |
| dSagina glabra | H caesp | Caryophyllaceae | 0.7 | 0 |
| Salix retusa | CH frut | Salicaceae | 0.2 | 3.53 |
| Saxifraga adscendens subsp. adscendens | H bienn | Saxifragaceae | 0 | 0.07 |
| Saxifraga paniculata | H ros | Saxifragaceae | 0.03 | 0 |
| * Scorzoneroides montana subsp. breviscapa | H ros | Asteraceae | 0.83 | 0.4 |
| Sedum acre | CH succ | Crassulaceae | 0.47 | 0.6 |
| Sedum atratum | T scap | Crassulaceae | 0.17 | 0.15 |
| Senecio squalidus subsp. rupestris | H bienn | Asteraceae | 0.03 | 1.07 |
| Sibbaldia procumbens | H scap | Rosaceae | 0.03 | 0 |
| Silene acaulis subsp. bryoides | CH pulv | Caryophyllaceae | 0.63 | 1.5 |
| *d Taraxacum apenninum | H ros | Asteraceae | 1.93 | 8.9 |
| * Taraxacum glaciale | H ros | Asteraceae | 4 | 6.13 |
| Thesium parnassi | H scap | Thesiaceae | 0.23 | 0 |
| Thymus praecox subsp. polytrichus | CH rept | Lamiaceae | 2.7 | 0.43 |
| Trifolium noricum subsp. praetutianum | H caesp | Fabaceae | 0.2 | 1 |
| * Trifolium pratense subsp. semipurpureum | H scap | Fabaceae | 4.47 | 9.7 |
| Trifolium thalii | H caesp | Fabaceae | 29.97 | 36.07 |
| Trinia dalechampii | H scap | Apiaceae | 0.27 | 0.07 |
| * Viola eugeniae subsp. eugeniae | H scap | Violaceae | 1.33 | 0.27 |
| Ziziphora granatensis subsp. alpina | CH suffr | Lamiaceae | 0.9 | 1.9 |
References
- Winkler, M.; Lamprecht, A.; Steinbauer, K.; Hülber, K.; Theurillat, J.P.; Breiner, F.; Choler, P.; Ertl, S.; Gutiérrez Girón, A.; Rossi, G.; et al. The rich sides of mountain summits—A pan-European view on aspect preferences of alpine plants. J. Biogeogr. 2016, 43, 2261–2273. [Google Scholar] [CrossRef]
- Myers, N.; Mittermeler, R.A.; Mittermeler, C.G.; Da Fonseca, G.A.B.; Kent, J. Biodiversity hotspots for conservation priorities. Nature 2000, 403, 853–858. [Google Scholar] [CrossRef] [PubMed]
- Pauli, H.; Gottfried, M.; Dirnböck, T.; Dullinger, S.; Grabherr, G. Assessing the Long-Term Dynamics of Endemic Plants at Summit Habitats. Mediterr.-Type Ecosyst. 2003, 167, 195–207. [Google Scholar] [CrossRef]
- Rogora, M.; Frate, L.; Carranza, M.L.; Freppaz, M.; Stanisci, A.; Bertani, I.; Bottarin, R.; Brambilla, A.; Canullo, R.; Carbognani, M.; et al. Assessment of climate change effects on mountain ecosystems through a cross-site analysis in the Alps and Apennines. Sci. Total Environ. 2018, 624, 1429–1442. [Google Scholar] [CrossRef] [Green Version]
- Stanisci, A.; Carranza, M.L.; Pelino, G.; Chiarucci, A. Assessing the diversity pattern of cryophilous plant species in high elevation habitats. Plant Ecol. 2011, 212, 595–600. [Google Scholar] [CrossRef]
- Van Gils, H.; Conti, F.; Ciaschetti, G.; Westinga, E. Fine resolution distribution modelling of endemics in Majella National Park, Central Italy. Plant Biosyst. 2012, 146, 276–287. [Google Scholar] [CrossRef]
- Carlson, B.Z.; Randin, C.F.; Boulangeat, I.; Lavergne, S.; Thuiller, W.; Choler, P. Working toward integrated models of alpine plant distribution. Alp. Bot. 2013, 123, 41–53. [Google Scholar] [CrossRef] [PubMed] [Green Version]
- Lamprecht, A.; Pauli, H.; Fernández Calzado, M.R.; Lorite, J.; Molero Mesa, J.; Steinbauer, K.; Winkler, M. Changes in plant diversity in a water-limited and isolated high-mountain range (Sierra Nevada, Spain). Alp. Bot. 2021, 131, 27–39. [Google Scholar] [CrossRef]
- Grabherr, G.; Gottfried, M.; Pauli, H. Climate effects on mountain plants. Nature 1994, 369, 448. [Google Scholar] [CrossRef]
- Väre, H.; Lampinen, R.; Humphries, C.; Williams, P. Taxonomic diversity of vascular plants in the European alpine areas. In Alpine Biodiversity in Europe; Springer: Berlin, Germany, 2003; pp. 133–148. [Google Scholar]
- Thuiller, W.; Lavorel, S.; Araújo, M.B.; Sykes, M.T.; Prentice, I.C. Climate change threats to plant diversity in Europe. Proc. Natl. Acad. Sci. USA 2005, 102, 8245–8250. [Google Scholar] [CrossRef] [Green Version]
- Gottfried, M.; Pauli, H.; Futschik, A.; Akhalkatsi, M.; Barančok, P.; Benito Alonso, J.L.; Coldea, G.; Dick, J.; Erschbamer, B.; Fernández Calzado, M.R.; et al. Continent-wide response of mountain vegetation to climate change. Nat. Clim. Chang. 2012, 2, 111–115. [Google Scholar] [CrossRef]
- Frate, L.; Carranza, M.L.; Evangelista, A.; Stinca, A.; Schaminée, J.H.J.; Stanisci, A. Climate and land use change impacts on mediterranean high-mountain vegetation in the apennines since the 1950s. Plant Ecol. Divers. 2018, 11, 85–96. [Google Scholar] [CrossRef]
- Erschbamer, B.; Kiebacher, T.; Mallaun, M.; Unterluggauer, P. Short-term signals of climate change along an altitudinal gradient in the South Alps. Plant Ecol. 2009, 202, 79–89. [Google Scholar] [CrossRef]
- Pauli, H.; Gottfried, M.; Dullinger, S.; Abdaladze, O.; Akhalkatsi, M.; Alonso, J.L.B.; Coldea, G.; Dick, J.; Erschbamer, B.; Calzado, R.F.; et al. Recent plant diversity changes on Europe’s mountain summits. Science 2012, 336, 353–355. [Google Scholar] [CrossRef] [PubMed] [Green Version]
- Cannone, N.; Pignatti, S. Ecological responses of plant species and communities to climate warming: Upward shift or range filling processes? Clim. Chang. 2014, 123, 201–214. [Google Scholar] [CrossRef]
- Evangelista, A.; Frate, L.; Carranza, M.L.; Attorre, F.; Pelino, G.; Stanisci, A. Changes in composition, ecology and structure of high-mountain vegetation: A re-visitation study over 42 years. AoB Plants 2016, 8, 1–11. [Google Scholar] [CrossRef] [PubMed] [Green Version]
- Calabrese, V.; Carranza, M.L.; Evangelista, A.; Marchetti, M.; Stinca, A.; Stanisci, A. Long-term changes in the composition, ecology, and structure of Pinus mugo scrubs in the Apennines (Italy). Diversity 2018, 10, 70. [Google Scholar] [CrossRef] [Green Version]
- Myers-Smith, I.H.; Forbes, B.C.; Wilmking, M.; Hallinger, M.; Lantz, T.; Blok, D.; Tape, K.D.; MacIas-Fauria, M.; Sass-Klaassen, U.; Lévesque, E.; et al. Shrub expansion in tundra ecosystems: Dynamics, impacts and research priorities. Environ. Res. Lett. 2011, 6, 045509. [Google Scholar] [CrossRef] [Green Version]
- Matteodo, M.; Wipf, S.; Stöckli, V.; Rixen, C.; Vittoz, P. Elevation gradient of successful plant traits for colonizing alpine summits under climate change. Environ. Res. Lett. 2013, 8, 024043. [Google Scholar] [CrossRef]
- Jiménez-Alfaro, B.; Gavilán, R.G.; Escudero, A.; Iriondo, J.M.; Fernández-González, F. Decline of dry grassland specialists in Mediterranean high-mountain communities influenced by recent climate warming. J. Veg. Sci. 2014, 25, 1394–1404. [Google Scholar] [CrossRef]
- Venn, S.; Pickering, C.; Green, K. Spatial and temporal functional changes in alpine summit vegetation are driven by increases in shrubs and graminoids. AoB Plants 2014, 6, plu008. [Google Scholar] [CrossRef] [Green Version]
- Bjorkman, A.D.; Myers-Smith, I.H.; Elmendorf, S.C.; Normand, S.; Rüger, N.; Beck, P.S.A.; Blach-Overgaard, A.; Blok, D.; Cornelissen, J.H.C.; Forbes, B.C.; et al. Plant functional trait change across a warming tundra biome. Nature 2018, 562, 57–62. [Google Scholar] [CrossRef]
- Petriccione, B.; Bricca, A. Thirty years of ecological research at the Gran Sasso d’Italia LTER site: Climate change in action. Nat. Conserv. 2019, 34, 9–39. [Google Scholar] [CrossRef]
- Stanisci, A.; Acosta, A.T.R.; Carranza, M.L.; De Chiro, M.; Del Vecchio, S.; Di Martino, L.; Frattaroli, A.R.; Fusco, S.; Izzi, C.F.; Pirone, G. EU habitats monitoring along the coastal dunes of the LTER sites of Abruzzo and Molise (Italy). Plant Sociol. 2014, 51, 51–56. [Google Scholar]
- Kullman, L. Alpine flora dynamics—A critical review of responses to climate change in the Swedish Scandes since the early 1950s. Nord. J. Bot. 2010, 28, 398–408. [Google Scholar] [CrossRef]
- Gaston, K.J.; Jackson, S.F.; Nagy, A.; Cantú-Salazar, L.; Johnson, M. Protected areas in Europe: Principle and practice. Ann. N. Y. Acad. Sci. 2008, 1134, 97–119. [Google Scholar] [CrossRef]
- Louette, G.; Adriaens, D.; Paelinckx, D.; Hoffmann, M. Implementing the habitats directive: How science can support decision making. J. Nat. Conserv. 2015, 23, 27–34. [Google Scholar] [CrossRef]
- Council Directive 92/43/EEC of 21 May 1992 on the conservation of natural habitats and of wild fauna and flora. Off. J. Eur. Union 1992, 206, 7.
- Janssen, J.A.M.; Rodwell, J.S.; Criado, M.G.; Gubbay, S.; Haynes, T.; Nieto, A.; Sanders, N.; Calix, M. European Red List of Habitats; Publications Office of the European Union: Luxembourg, 2016; ISBN 9279615882. [Google Scholar]
- Gigante, D.; Acosta, A.T.R.; Agrillo, E.; Armiraglio, S.; Assini, S.; Attorre, F.; Bagella, S.; Buffa, G.; Casella, L.; Giancola, C.; et al. Habitat conservation in Italy: The state of the art in the light of the first European Red List of Terrestrial and Freshwater Habitats. Rend. Lincei 2018, 29, 251–265. [Google Scholar] [CrossRef]
- Pauli, H.; Gottfried, M.; Reiter, K.; Klettner, C.; Grabherr, G. Signals of range expansions and contractions of vascular plants in the high Alps: Observations (1994-2004) at the GLORIA *master site Schrankogel, Tyrol, Austria. Glob. Chang. Biol. 2007, 13, 147–156. [Google Scholar] [CrossRef]
- Păcurar, F.; Rotar, I.; Reif, A.; Vidican, R.; Stoian, V.; Gärtner, S.M.; Allen, R.B. Impact of climate on vegetation change in a mountain grassland—Succession and fluctuation. Not. Bot. Horti Agrobot. Cluj-Napoca 2014, 42, 347–356. [Google Scholar] [CrossRef] [Green Version]
- Stöckli, V.; Wipf, S.; Nilsson, C.; Rixen, C. Using historical plant surveys to track biodiversity on mountain summits. Plant Ecol. Divers. 2011, 4, 415–425. [Google Scholar] [CrossRef]
- Elmendorf, S.C.; Henry, G.H.R.; Hollister, R.D.; Björk, R.G.; Boulanger-Lapointe, N.; Cooper, E.J.; Cornelissen, J.H.C.; Day, T.A.; Dorrepaal, E.; Elumeeva, T.G. Plot-scale evidence of tundra vegetation change and links to recent summer warming. Nat. Clim. Chang. 2012, 2, 453–457. [Google Scholar] [CrossRef]
- Steinbauer, M.J.; Grytnes, J.-A.; Jurasinski, G.; Kulonen, A.; Lenoir, J.; Pauli, H.; Rixen, C.; Winkler, M.; Barni, M.B.-D.E.; Bjorkman, A.D.; et al. Mountain Summits Is Linked to Warming. Nature 2018, 556, 231–234. [Google Scholar] [CrossRef] [PubMed]
- Pauli, H.; Gottfried, M.; Lamprecht, A.; Niessner, S.; Rumpf, S.; Winkler, M.; Steinbauer, K.; Grabherr, G. The GLORIA Field Manual; Global Observation Research Initiative in Alpine Environments: Vienna, Austria, 2015. [Google Scholar] [CrossRef]
- Bürli, S.; Theurillat, J.P.; Winkler, M.; Lamprecht, A.; Pauli, H.; Rixen, C.; Steinbauer, K.; Wipf, S.; Abdaladze, O.; Andrews, C.; et al. A common soil temperature threshold for the upper limit of alpine grasslands in European mountains. Alp. Bot. 2021, 131, 41–52. [Google Scholar] [CrossRef]
- Haase, P.; Tonkin, J.D.; Stoll, S.; Burkhard, B.; Frenzel, M.; Geijzendorffer, I.R.; Häuser, C.; Klotz, S.; Kühn, I.; McDowell, W.H.; et al. The next generation of site-based long-term ecological monitoring: Linking essential biodiversity variables and ecosystem integrity. Sci. Total Environ. 2018, 613–614, 1376–1384. [Google Scholar] [CrossRef] [PubMed] [Green Version]
- Hoffmann, A.; Penner, J.; Vohland, K.; Cramer, W.; Doubleday, R.; Henle, K.; Kõljalg, U.; Kühn, I.; Kunin, W.E.; Negro, J.J.; et al. Improved access to integrated biodiversity data for science, practice, and policy—The European Biodiversity Observation Network (EU BON). Nat. Conserv. 2014, 6, 49–65. [Google Scholar] [CrossRef] [Green Version]
- Michener, W.K. Ecological data sharing. Ecol. Inform. 2015, 29, 33–44. [Google Scholar] [CrossRef] [Green Version]
- Magurran, A.E.; Baillie, S.R.; Buckland, S.T.; Dick, J.M.P.; Elston, D.A.; Scott, E.M.; Smith, R.I.; Somerfield, P.J.; Watt, A.D. Long-term datasets in biodiversity research and monitoring: Assessing change in ecological communities through time. Trends Ecol. Evol. 2010, 25, 574–582. [Google Scholar] [CrossRef]
- Chytrý, M.; Hennekens, S.M.; Jiménez-Alfaro, B.; Knollová, I.; Dengler, J.; Jansen, F.; Landucci, F.; Schaminée, J.H.J.; Aćić, S.; Agrillo, E.; et al. European Vegetation Archive (EVA): An integrated database of European vegetation plots. Appl. Veg. Sci. 2016, 19, 173–180. [Google Scholar] [CrossRef] [Green Version]
- Schaminée, J.H.J.; Janssen, J.A.M.; Hennekens, S.M.; Ozinga, W.A. Large vegetation databases and information systems: New instruments for ecological research, nature conservation, and policy making. Plant Biosyst. 2011, 145, 85–90. [Google Scholar] [CrossRef]
- Franklin, J.; Serra-Diaz, J.M.; Syphard, A.D.; Regan, H.M. Big data for forecasting the impacts of global change on plant communities. Glob. Ecol. Biogeogr. 2017, 26, 6–17. [Google Scholar] [CrossRef]
- Vittoz, P.; Bayfield, N.; Brooker, R.; Elston, D.A.; Duff, E.I.; Theurillat, J.P.; Guisan, A. Reproducibility of species lists, visual cover estimates and frequency methods for recording high-mountain vegetation. J. Veg. Sci. 2010, 21, 1035–1047. [Google Scholar] [CrossRef]
- Testolin, R.; Attorre, F.; Borchardt, P.; Brand, R.F.; Bruelheide, H.; Chytrý, M.; De Sanctis, M.; Dolezal, J.; Finckh, M.; Haider, S.; et al. Global patterns and drivers of alpine plant species richness. Glob. Ecol. Biogeogr. 2021, 30, 1218–1231. [Google Scholar] [CrossRef]
- Zamora, R.; Pérez-Luque, A.J.; Bonet, F.J. Monitoring global change in high mountains. In High Mountain Conservation in a Changing World; Advances in Global Change Research; Springer: Cham, Switzerland, 2017; Volume 62, pp. 385–413. [Google Scholar]
- Rocchini, D.; Andreini Butini, S.; Chiarucci, A. Maximizing plant species inventory efficiency by means of remotely sensed spectral distances. Glob. Ecol. Biogeogr. 2005, 14, 431–437. [Google Scholar] [CrossRef]
- Verrall, B.; Pickering, C.M. Alpine vegetation in the context of climate change: A global review of past research and future directions. Sci. Total Environ. 2020, 748, 141344. [Google Scholar] [CrossRef] [PubMed]
- Carranza, M.L.; Frate, L.; Paura, B. Structure, ecology and plant richness patterns in fragmented beech forests. Plant Ecol. Divers. 2012, 5, 541–551. [Google Scholar] [CrossRef]
- Kovač, M.; Kutnar, L.; Hladnik, D. Assessing biodiversity and conservation status of the Natura 2000 forest habitat types: Tools for designated forestlands stewardship. For. Ecol. Manag. 2016, 359, 256–267. [Google Scholar] [CrossRef]
- Nicod, C.; Leys, B.; Ferrez, Y.; Manneville, V.; Mouly, A.; Greffier, B.; Hennequin, C.; Bouton, Y.; Prévost-Bouré, N.C.; Gillet, F. Towards the assessment of biodiversity and management practices in mountain pastures using diagnostic species? Ecol. Indic. 2019, 107, 1–21. [Google Scholar] [CrossRef]
- Santoro, R.; Carboni, M.; Carranza, M.L.; Acosta, A.T.R. Focal species diversity patterns can provide diagnostic information on plant invasions. J. Nat. Conserv. 2012, 20, 85–91. [Google Scholar] [CrossRef]
- Angiolini, C.; Bonari, G.; Landi, M. Focal plant species and soil factors in Mediterranean coastal dunes: An undisclosed liaison? Estuar. Coast. Shelf Sci. 2018, 211, 248–258. [Google Scholar] [CrossRef]
- Chytrý, M.; Tichý, L. Diagnostic, Constant and Dominant Species of Vegetation Classes and Alliances of the Czech. Republic: A Statistical Revision; Masaryk University Brno: Brno, Czech Republic, 2003; Volume 108, ISBN 8021032219. [Google Scholar]
- Chiarucci, A.; Bacaro, G.; Rocchini, D. Quantifying plant species diversity in a Natura 2000 network: Old ideas and new proposals. Biol. Conserv. 2008, 141, 2608–2618. [Google Scholar] [CrossRef]
- Körner, C. Alpine Plant Life: Functional Plant Ecology of High Mountain Ecosystems; Springer Nature: Basingstoke, UK, 2021; ISBN 3030595382. [Google Scholar]
- Chytrý, M.; Tichý, L.; Hennekens, S.M.; Knollová, I.; Janssen, J.A.M.; Rodwell, J.S.; Peterka, T.; Marcenò, C.; Landucci, F.; Danihelka, J.; et al. EUNIS Habitat Classification: Expert system, characteristic species combinations and distribution maps of European habitats. Appl. Veg. Sci. 2020, 23, 648–675. [Google Scholar] [CrossRef]
- Stanisci, A.; Bricca, A.; Calabrese, V.; Cutini, M.; Pauli, H.; Steinbauer, K.; Carranza, M.L. Functional composition and diversity of leaf traits in subalpine versus alpine vegetation in the Apennines. AoB Plants 2020, 12, 1–11. [Google Scholar] [CrossRef] [PubMed] [Green Version]
- Lucchese, F.; Simone, M.D.E.; Tra, C.; Altitudine, F.D.; Appennino, N.; Metodi, C.; Rilevamento, D.I.; Risultati, E.; Di, A.; Caratterizzazione, U.N.A. Confronto tra flore d’altitudine nell’appennino centrale. Metodi di rilevamento, risultati e analisi di una caratterizzazione fitogeografica. Ann. Musei Civ. 2000, 14, 113–145. [Google Scholar]
- Birot, P. Géomorphologie des Abruzzes adriatiques de Jean Demangeot; Annales de Géographie: Paris, France, 1966; Volume 75, pp. 480–482. [Google Scholar]
- Jaurand, E. Les Heritages Glaciaire de l’Apennin. Ph.D. Thesis, Éditions de la Sorbonne Paris, Paris, France, 1994. [Google Scholar]
- Di Cecco, V.; Di Santo, M.; Di Musciano, M.; Manzi, A.; Di Cecco, M.; Ciaschetti, G.; Marcantonio, G.; Di Martino, L. The Majella national park: A case study for the conservation of plant biodiversity in the Italian apennines. Ital. Bot. 2020, 10, 1–24. [Google Scholar] [CrossRef]
- Conti, F.; Ciaschetti, G.; Di Martino, L.; Bartolucci, F. An Annotated Checklist of the Vascular Flora of Majella National Park (Central Italy). Phytotaxa 2019, 412, 1–90. [Google Scholar] [CrossRef]
- Conti, F.; Tinti, D. Data base della flora vascolare del Parco Nazionale della Majella. In Atti del Convegno “La Biodiversità Vegetale Nelle Aree Protette in Abruzzo: Studi ed Esperienze a Confronto”; Giovanni, R.S., Ed.; Ente Parco Nazionale della Majella: Pacentro, Italy, 2006; pp. 183–191. [Google Scholar]
- Cervellini, M.; Zannini, P.; Di Musciano, M.; Fattorini, S.; Jiménez-Alfaro, B.; Rocchini, D.; Field, R.; Vetaas, O.R.; Irl, S.D.H.; Beierkuhnlein, C.; et al. A grid-based map for the biogeographical regions of Europe. Biodivers. Data J. 2020, 8, e53720. [Google Scholar] [CrossRef]
- Blasi, C.; Di Pietro, R.; Pelino, G. The vegetation of alpine belt karst-tectonic basins in the central Apennines (Italy). Plant Biosyst. 2005, 139, 357–385. [Google Scholar] [CrossRef]
- Dai, L.; Palombo, C.; Van Gils, H.; Rossiter, D.G.; Tognetti, R.; Luo, G. Pinus mugo Krummholz Dynamics during Concomitant Change in Pastoralism and Climate in the Central Apennines. Mt. Res. Dev. 2017, 37, 75–86. [Google Scholar] [CrossRef]
- Palombo, C.; Chirici, G.; Marchetti, M.; Tognetti, R. Is land abandonment affecting forest dynamics at high elevation in Mediterranean mountains more than climate change? Plant Biosyst. 2013, 147, 1–11. [Google Scholar] [CrossRef]
- Antonucci, A.; Di Domenico, G.; Gentile, D.; Artese, C. Documento Operativo sulle Corrette Procedure per L’individuazione dei Nuclei di Camoscio Oggetto di Prelievo per le Immissioni in Natura. 2010, pp. 1–16. Available online: https://www.camoscioappenninico.it/camoscioappenninico.it/sites/camoscioappenninico.it/files/docs/5.pdf (accessed on 21 July 2021).
- Lovari, S.; Franceschi, S.; Chiatante, G.; Fattorini, L.; Fattorini, N.; Ferretti, F. Climatic changes and the fate of mountain herbivores. Clim. Chang. 2020, 162, 2319–2337. [Google Scholar] [CrossRef]
- Loison, A.; Toïgo, C.; Appolinaire, J.; Michallet, J. Demographic processes in colonizing populations of isard (Rupicapra pyrenaica) and ibex (Capra ibex). J. Zool. 2002, 256, 199–205. [Google Scholar] [CrossRef]
- Biondi, E.; Blasi, C.; Burrascano, S.; Casavecchia, S.; Copiz, R.; Del Vico, E.; Galdenzi, D.; Gigante, D.; Lasen, C.; Spampinato, G.; et al. Manuale Italiano di Interpretazione degli Habitat della Direttiva 92/43/CEE; Ministero dell’Ambiente e della Tutela del Territorio e del Mare, Direzione per la Protezione della Natura: Rome, Italy, 2009; pp. 1–16. [Google Scholar]
- European Commission. Interpretation Manual of European Union Habitats; Directorate-General for the Environment: Brussels, Belgium, 2013. [Google Scholar]
- Evangelista, A.; Frate, L.; Stinca, A.; Carranza, M.L.; Stanisci, A. VIOLA—The vegetation database of the central Apennines: Structure, current status and usefulness for monitoring Annex i EU habitats (92/43/EEC). Plant Sociol. 2016, 53, 47–58. [Google Scholar] [CrossRef]
- Stanisci, A.; Evangelista, A.; Frate, L.; Stinca, A.; Carranza, M.L. VIOLA—Database of high mountain vegetation of central apennines. Phytocoenologia 2016, 46, 231–232. [Google Scholar] [CrossRef]
- Pelino, G.; Carranza, M.L.; Stanisci, A. Specie rare nelle unità ambientali del piano alpino del Parco Nazionale della Majella. Informatore Botanico Italiano 2005, 37, 288–289. [Google Scholar]
- Braun-Blanquet, J. Pflanzensoziologie: Grundzüge der Vegetationskunde; Springer: Berlin, Germany, 2013; ISBN 3709140781. [Google Scholar]
- Westhoff, V.; Van Der Maarel, E. The braun-blanquet approach. In Classification of plant communities; Springer: Berlin/Heidelberg, Germany, 1978; pp. 287–399. [Google Scholar]
- Bartolucci, F.; Peruzzi, L.; Galasso, G.; Albano, A.; Alessandrini, A.; Ardenghi, N.M.G.; Astuti, G.; Bacchetta, G.; Ballelli, S.; Banfi, E.; et al. An updated checklist of the vascular flora native to Italy. Plant Biosyst. 2018, 152, 179–303. [Google Scholar] [CrossRef]
- Biondi, E.; Blasi, C.; Allegrezza, M.; Anzellotti, I.; Azzella, M.M.; Carli, E.; Casavecchia, S.; Copiz, R.; Del Vico, E.; Facioni, L.; et al. Plant communities of Italy: The Vegetation Prodrome. Plant Biosyst. 2014, 148, 728–814. [Google Scholar] [CrossRef] [Green Version]
- European Commission Interpretation Manual of European Union Habitats; Directorate-General for the Environment: Brussels, Belgium, 2007.
- Raunkiaer, C. The Life Forms of Plants and Statistical Plant Geography; Oxford University Press: Oxford, UK, 1934. [Google Scholar]
- Pignatti, S.; Guarino, R.; La Rosa, M. Flora d’Italia; Edagricole: Rome, Italy, 2017; Volume 1, ISBN 8850652429. [Google Scholar]
- Anderson, M.J. Distance-based tests for homogeneity of multivariate dispersions. Biometrics 2006, 62, 245–253. [Google Scholar] [CrossRef] [PubMed]
- Oksanen, A.J.; Blanchet, F.G.; Friendly, M.; Kindt, R.; Legendre, P.; Mcglinn, D.; Minchin, P.R.; Hara, R.B.O.; Simpson, G.L.; Solymos, P.; et al. Vegan Package 2020. Available online: https://github.com/vegandevs/vegan (accessed on 7 February 2021).
- Gotelli, N.J.; Colwell, R.K. Quantifying biodiversity: Procedures and pitfalls in the measurement and comparison of species richness. Ecol. Lett. 2001, 4, 379–391. [Google Scholar] [CrossRef] [Green Version]
- Colwell, R.K.; Mao, C.X.; Chang, J. Interpolating, extrapolating, and comparing incidence-based species accumulation curves. Ecology 2004, 85, 2717–2727. [Google Scholar] [CrossRef] [Green Version]
- Hill, M.O. Diversity and Evenness: A Unifying Notation and Its Consequences. Ecology 1973, 54, 427–432. [Google Scholar] [CrossRef] [Green Version]
- Tothmeresz, B. Comparison of Different Methods for Diversity Ordering. J. Veg. Sci. 1995, 6, 283–290. [Google Scholar] [CrossRef]
- R Core Team, R. A Language and Environment for Statistical Computing; R Foundation for Statistical Computing: Vienna, Austria, 2020; Available online: http://www.r-project.org/index.html (accessed on 7 February 2021).
- Thouverai, E.; Pavoine, S.; Tordini, E.; Rocchini, D.; Ricotta, C.; Chiarucci, A.; Bacaro, G. Rarefy Package: Rarefaction Methods 2021. Available online: https://cran.r-project.org/web/packages/Rarefy/Rarefy.pdf (accessed on 10 June 2021).
- Kindt, R.; Coe, R. Tree Diversity Analysis; World Agroforestry Centre: Nairobi, Kenya, 2005. [Google Scholar]
- Hammer, Ø.; Harper, D.A.T.; Ryan, P.D. Past Palaeontological Statistics, Ver. 1.79. 2001. pp. 1–88. Available online: https://palaeo-electronica.org/2001_1/past/issue1_01.htm#:~:text=The%20program%2C%20called%20PAST%20(PAleontological,plotting%2C%20and%20simple%20phylogenetic%20analysis (accessed on 10 June 2021).
- Rényi, A. Some fundamental questions of information theory, MTA III Oszt. Közl. 10 251; 1960 On measures of information and entropy. In Proceedings of the Fourth Berkeley Symposium on Mathematics, Statistics and Probability, Berkeley, CA, USA, 20 June–30 July 1960; Berkeley University Press: Berkeley, CA, USA, 1970. [Google Scholar]
- Shannon, C.E.; Weaver, W. The Mathematical Theory of Communication. In Urbana and Chicago; University of Illinois Press: Champaign, IL, USA, 1949. [Google Scholar]
- Simpson, G.L. Measurement of diversity. Nature 1949, 163, 688. [Google Scholar] [CrossRef]
- Berger, W.H.; Parker, F.L. Diversity of planktonic foraminifera in deep-sea sediments. Science 1970, 168, 1345–1347. [Google Scholar] [CrossRef]
- Patil, G.P.; Taillie, C. Diversity as a concept and its measurement. J. Am. Stat. Assoc. 1982, 77, 548–561. [Google Scholar] [CrossRef]
- Cannone, N.; Gerdol, R. Vegetation as an Ecological Indicator of Surface Instability in Rock Glaciers. Arctic, Antarct. Alp. Res. 2003, 35, 384–390. [Google Scholar] [CrossRef] [Green Version]
- Rixen, C.; Wipf, S. Non-equilibrium in alpine plant assemblages: Shifts in Europe’s summit floras. In High Mountain Conservation in a Changing World; Springer: Cham, Switzerland, 2017; pp. 285–303. [Google Scholar]
- Gavazov, K.S. Dynamics of alpine plant litter decomposition in a changing climate. Plant Soil 2010, 337, 19–32. [Google Scholar] [CrossRef] [Green Version]
- Gong, S.; Guo, R.; Zhang, T.; Guo, J. Warming and nitrogen addition increase litter decomposition in a temperate meadow ecosystem. PLoS ONE 2015, 10, 1–14. [Google Scholar] [CrossRef] [PubMed]
- Chersich, S.; Rejšek, K.; Vranová, V.; Bordoni, M.; Meisina, C. Climate change impacts on the Alpine ecosystem: An overview with focus on the soil—A review. J. For. Sci. 2015, 61, 496–514. [Google Scholar] [CrossRef]
- Gillet, F.; Mauchamp, L.; Badot, P.M.; Mouly, A. Recent changes in mountain grasslands: A vegetation resampling study. Ecol. Evol. 2016, 6, 2333–2345. [Google Scholar] [CrossRef] [Green Version]
- López-i-Gelats, F.; Rivera-Ferre, M.G.; Madruga-Andreu, C.; Bartolomé-Filella, J. Is multifunctionality the future of mountain pastoralism? Lessons from the management of semi-natural grasslands in the Pyrenees. Spanish J. Agric. Res. 2015, 13. [Google Scholar] [CrossRef] [Green Version]
- Ferrari, C.; Rossi, G.; Cavani, C. Summer food habits and quality of female, kid and subadult Apennine chamois, Rupicapra pyrenaica ornata Neumann, 1899 (Artiodactyla, Bovidae). Z. Säugetierkd. 1988, 53, 170–177. [Google Scholar]
- Cannone, N.; Sgorbati, S.; Guglielmin, M. Unexpected impacts of climate change on alpine vegetation. Front. Ecol. Environ. 2007, 5, 360–364. [Google Scholar] [CrossRef] [Green Version]
- Bolton, D.K.; Coops, N.C.; Hermosilla, T.; Wulder, M.A.; White, J.C. Evidence of vegetation greening at alpine treeline ecotones: Three decades of landsat spectral trends informed by lidar-derived vertical structure. Environ. Res. Lett. 2018, 13, 84022. [Google Scholar] [CrossRef]
- Carlson, B.Z.; Corona, M.C.; Dentant, C.; Bonet, R.; Thuiller, W.; Choler, P. Observed long-term greening of alpine vegetation—A case study in the French Alps. Environ. Res. Lett. 2017, 12, 114006. [Google Scholar] [CrossRef]
- Evju, M.; Austrheim, G.; Halvorsen, R.; Mysterud, A. Grazing responses in herbs in relation to herbivore selectivity and plant traits in an alpine ecosystem. Oecologia 2009, 161, 77–85. [Google Scholar] [CrossRef] [PubMed]
- Catorci, A.; Ottaviani, G.; Ballelli, S.; Cesaretti, S. Functional differentiation of central apennine grasslands under mowing and grazing disturbance regimes. Pol. J. Ecol. 2011, 59, 115–128. [Google Scholar]
- Mayer, R.; Erschbamer, B. Long-term effects of grazing on subalpine and alpine grasslands in the Central Alps, Austria. Basic Appl. Ecol. 2017, 24, 9–18. [Google Scholar] [CrossRef]


| Galium magellense Community (Screes) | Trifolium thalii Community (Snowbeds) | ||
|---|---|---|---|
| TAXON | LGr | TAXON | LGr |
| * Achillea barrelieri subsp. barrelieri | H scap | Crepis aurea subsp. glabrescens | H ros |
| * Arenaria bertolonii | CH suffr | Draba aizoides subsp. aizoides | H ros |
| Campanula cochleariifolia | H scap | Helianthemum oelandicum subsp. alpestre | CH suffr |
| Carduus chrysacanthus | H scap | Luzula spicata subsp. bulgarica | H caesp |
| * Cerastium tomentosum | CH suffr | Phyteuma orbiculare | H scap |
| Crepis pygmaea | G rhiz | Plantago atrata subsp. atrata | H ros |
| * Cymbalaria pallida | H scap | * Polygala alpestris subsp. angelisii | H scap |
| Doronicum columnae | G rhiz | Pulsatilla alpina subsp. millefoliata | H scap |
| * Galium magellense | H scap | * Ranunculus pollinensis | H scap |
| Isatis apennina | G rhiz | Sagina glabra | H caesp |
| Leucopoa dimorpha | H caesp | * Taraxacum apenninum | H ros |
| * Linaria purpurea | H scap | ||
| * Noccaea stylosa | CH suffr | ||
| Papaver alpinum subsp. alpinum | H scap | ||
| Ranunculus brevifolius | G rhiz | ||
| * Saxifraga oppositifolia subsp. speciosa | CH pulv | ||
| * Scorzoneroides montana subsp. breviscapa | H ros | ||
| Sedum atratum | T scap | ||
| * Viola magellensis | H scap | ||
| Galium magellense Community | Trifolium thalii Community | |||
|---|---|---|---|---|
| T1 | T2 | T1 | T2 | |
| M | 15 | 15 | 15 | 15 |
| Sall species | 51 | 67 | 70 | 60 |
| Sdiagnostics | 15 | 19 | 11 | 9 |
| Galium magellense Community (Scree) | Trifolium thalii Community (Snowbeds) | |||||||||||
|---|---|---|---|---|---|---|---|---|---|---|---|---|
| T1 | Lower | Upper | T2 | Lower | Upper | T1 | Lower | Upper | T2 | Lower | Upper | |
| Overall Species | Overall Species | |||||||||||
| RMaoTao | 51 | 50.28 | 50.72 | 67 | 66.22 | 67.78 | 70 | 69.03 | 70.97 | 60 | 59.12 | 60.88 |
| HMaoTao | 3.649 | 3.574 | 3.668 | 3.916 | 3.845 | 3.931 | 3.932 | 3.888 | 3.946 | 3.814 | 3.772 | 3.828 |
| SMaoTao | 0.9676 | 0.9641 | 0.9689 | 0.9743 | 0.9714 | 0.9753 | 0.976 | 0.9745 | 0.9766 | 0.9739 | 0.9724 | 0.9745 |
| BPMaoTao | 0.0655 | 0.0568 | 0.08188 | 0.05565 | 0.05233 | 0.07143 | 0.04312 | 0.04226 | 0.05304 | 0.04458 | 0.04325 | 0.05484 |
| Diagnostic Species | Diagnostic Species | |||||||||||
| RMaoTao | 15 | 14.59 | 15.41 | 19 | 18.6 | 19.4 | 11 | 10.62 | 11.38 | 9 | 8.75 | 9.25 |
| HMaoTao | 2.404 | 2.292 | 2.46 | 2.709 | 2.615 | 2.75 | 2.109 | 2.033 | 2.157 | 1.921 | 1.841 | 1.975 |
| SMaoTao | 0.8885 | 0.8714 | 0.8979 | 0.9187 | 0.9059 | 0.9251 | 0.8567 | 0.8417 | 0.8663 | 0.826 | 0.8067 | 0.8392 |
| BPMaoTao | 0.1797 | 0.1559 | 0.2237 | 0.1701 | 0.1345 | 0.2081 | 0.2169 | 0.1952 | 0.256 | 0.2584 | 0.2274 | 0.3023 |
Publisher’s Note: MDPI stays neutral with regard to jurisdictional claims in published maps and institutional affiliations. |
© 2021 by the authors. Licensee MDPI, Basel, Switzerland. This article is an open access article distributed under the terms and conditions of the Creative Commons Attribution (CC BY) license (https://creativecommons.org/licenses/by/4.0/).
Share and Cite
Varricchione, M.; Di Cecco, V.; Santoianni, L.A.; Stanisci, A.; Di Febbraro, M.; Di Martino, L.; Carranza, M.L. Diagnostic Species Diversity Pattern Can Provide Key Information on Vegetation Change: An Insight into High Mountain Habitats in Central Apennines. J. Zool. Bot. Gard. 2021, 2, 453-472. https://doi.org/10.3390/jzbg2030033
Varricchione M, Di Cecco V, Santoianni LA, Stanisci A, Di Febbraro M, Di Martino L, Carranza ML. Diagnostic Species Diversity Pattern Can Provide Key Information on Vegetation Change: An Insight into High Mountain Habitats in Central Apennines. Journal of Zoological and Botanical Gardens. 2021; 2(3):453-472. https://doi.org/10.3390/jzbg2030033
Chicago/Turabian StyleVarricchione, Marco, Valter Di Cecco, Lucia A. Santoianni, Angela Stanisci, Mirko Di Febbraro, Luciano Di Martino, and Maria Laura Carranza. 2021. "Diagnostic Species Diversity Pattern Can Provide Key Information on Vegetation Change: An Insight into High Mountain Habitats in Central Apennines" Journal of Zoological and Botanical Gardens 2, no. 3: 453-472. https://doi.org/10.3390/jzbg2030033