
Improved Personalised Neuroendocrine Tumours’ Diagnosis Predictive Power by New Receptor Somatostatin Image Processing Quantification

 , , ,
, , ,
Abstract
:
1. Introduction
2. Materials and Methods
2.1. Participants
2.2. Data Acquisition
2.3. Image and Data Analysis
2.4. Statistical Analysis
3. Results
4. Discussion
5. Conclusions
Author Contributions
Funding
Institutional Review Board Statement
Informed Consent Statement
Data Availability Statement
Acknowledgments
Conflicts of Interest
References
- Herrera-Martínez, A.D.; Hofland, J.; Hofland, L.J.; Brabander, T.; Eskens, F.A.L.M.; Moreno, M.A.G.; Luque, R.M.; Castaño, J.P.; De Herder, W.W.; Feelders, R.A. Targeted Systemic Treatment of Neuroendocrine Tumors: Current Options and Future Perspectives. Drugs 2019, 79, 21–42. [Google Scholar] [CrossRef] [Green Version]
- Pedraza-Arévalo, S.; Gahete, M.D.; Alors-Pérez, E.; Luque, R.M.; Castaño, J.P. Multilayered heterogeneity as an intrinsic hallmark of neuroendocrine tumors. Rev. Endocr. Metab. Disord. 2018, 19, 179–192. [Google Scholar] [CrossRef] [PubMed]
- Bodei, L.; Kidd, M.; Gilardi, L.; Volterrani, D.; Paganelli, G.; Grana, C.M.; Modlin, I.M. Diagnostic applications of nuclear medicine: Neuroendocrine tumors. In Nuclear Oncology; Strauss, H.W., Mariani, G., Volterrani, D., Larson, S.M., Eds.; Springer International Publishing: New York, NY, USA, 2017; pp. 799–838. [Google Scholar]
- Alevroudis, E.; Spei, M.-E.; Chatziioannou, S.; Tsoli, M.; Wallin, G.; Kaltsas, G.; Daskalakis, K. Clinical Utility of 18F-FDG PET in Neuroendocrine Tumors Prior to Peptide Receptor Radionuclide Therapy: A Systematic Review and Meta-Analysis. Cancers 2021, 13, 1813. [Google Scholar] [CrossRef] [PubMed]
- Jahn, U.; Ilan, E.; Sandström, M.; Lubberink, M.; Garske-Román, U.; Sundin, A. Peptide Receptor Radionuclide Therapy (PRRT) with 177Lu-DOTATATE; Differences in Tumor Dosimetry, Vascularity and Lesion Metrics in Pancreatic and Small Intestinal Neuroendocrine Neoplasms. Cancers 2021, 13, 962. [Google Scholar] [CrossRef] [PubMed]
- Ilan, E.; Velikyan, I.; Sandström, M.; Sundin, A.; Lubberink, M. Tumor-to-Blood Ratio for Assessment of Somatostatin Receptor Density in Neuroendocrine Tumors Using 68 Ga-DOTATOC and 68 Ga-DOTATATE. J. Nucl. Med. 2020, 61, 217–221. [Google Scholar] [CrossRef] [PubMed] [Green Version]
- Xu, J.; Li, Y.; Xu, X.; Zhang, J.; Zhang, Y.; Yu, X.; Huang, D. Clinical application of 99mTc-HYNIC-TOC SPECT/CT in diagnosing and monitoring of pancreatic neuroendocrine neoplasms. Ann. Nucl. Med. 2018, 32, 446–452. [Google Scholar] [CrossRef]
- La Salvia, A.; Espinosa-Olarte, P.; Riesco-Martinez, M.D.C.; Anton-Pascual, B.; Garcia-Carbonero, R. Targeted Cancer Therapy: What’s New in the Field of Neuroendocrine Neoplasms? Cancers 2021, 13, 1701. [Google Scholar] [CrossRef] [PubMed]
- Taïeb, D.; Garrigue, P.; Bardiès, M.; Abdullah, A.E.; Pacak, K. Application and Dosimetric Requirements for Gallium-68–labeled Somatostatin Analogues in Targeted Radionuclide Therapy for Gastroenteropancreatic Neuroendocrine Tumors. PET Clin. 2015, 10, 477–486. [Google Scholar] [CrossRef] [Green Version]
- Vesterinen, T.; Leijon, H.; Mustonen, H.; Remes, S.; Knuuttila, A.; Salmenkivi, K.; Vainio, P.; Arola, J.; Haglund, C. Somatostatin Receptor Expression Is Associated with Metastasis and Patient Outcome in Pulmonary Carcinoid Tumors. J. Clin. Endocrinol. Metab. 2019, 104, 2083–2093. [Google Scholar] [CrossRef] [Green Version]
- Baldelli, R.; Barnabei, A.; Rizza, L.; Isidori, A.; Rota, F.; Di Giacinto, P.; Paoloni, A.; Torino, F.; Corsello, S.M.; Lenzi, A.; et al. Somatostatin Analogs Therapy in Gastroenteropancreatic Neuroendocrine Tumors: Current Aspects and New Perspectives. Front. Endocrinol. 2014, 5, 7. [Google Scholar] [CrossRef] [Green Version]
- Waldmann, C.M.; Stuparu, A.D.; Van Dam, R.M.; Slavik, R. The Search for an Alternative to [68Ga]Ga-DOTA-TATE in Neuroendocrine Tumor Theranostics: Current State of 18F-labeled Somatostatin Analog Development. Theranostics 2019, 9, 1336–1347. [Google Scholar] [CrossRef]
- Graf, J.; Pape, U.-F.; Jann, H.; Denecke, T.; Arsenic, R.; Brenner, W.; Pavel, M.; Prasad, V. Prognostic Significance of Somatostatin Receptor Heterogeneity in Progressive Neuroendocrine Tumor Treated with Lu-177 DOTATOC or Lu-177 DOTATATE. Eur. J. Nucl. Med. Mol. Imaging 2020, 47, 881–894. [Google Scholar] [CrossRef]
- Eychenne, R.; Bouvry, C.; Bourgeois, M.; Loyer, P.; Benoist, E.; Lepareur, N. Overview of Radiolabeled Somatostatin Analogs for Cancer Imaging and Therapy. Molecules 2020, 25, 4012. [Google Scholar] [CrossRef]
- Stolniceanu, C.R.; Nistor, I.; Bilha, S.C.; Constantin, V.; Simona, V.; Matovic, M.; Stefanescu, C.; Covic, A. Nephrotoxicity/renal failure after therapy with 90Yttrium- And 177Lutetium-radiolabeled somatostatin analogs in different types of neuroendocrine tumors: A systematic review. Nucl. Med. Commun. 2020, 41, 601–617. [Google Scholar] [CrossRef] [PubMed]
- Opalińska, M.; Hubalewska-Dydejczyk, A.; Sowa-Staszczak, A.; Stefańska, A. NEN—The role of somatostatin receptor scintigraphy in clinical setting. Nucl. Med. Rev. Cent. East. Eur. 2016, 19, 118–125. [Google Scholar] [CrossRef] [PubMed] [Green Version]
- Hubalewska-Dydejczyk, A.; Fröss-Baron, K.; Mikołajczak, R.; Maecke, H.R.; Huszno, B.; Pach, D.; Sowa-Staszczak, A.; Janota, B.; Szybiński, P.; Kulig, J. 99mTc-EDDA/HYNIC-octreotate scintigraphy, an efficient method for the detection and staging of carcinoid tumours: Results of 3 years’ experience. Eur. J. Nucl. Med. Mol. Imaging 2006, 33, 1123–1133. [Google Scholar] [CrossRef] [PubMed]
- Groshar, D.; Bernstine, H.; Goldberg, N.; Nidam, M.; Stein, D.; Abadi-Korek, I.; Domachevsky, L. Reproducibility and repeatability of same-day two sequential FDG PET/MR and PET/CT. Cancer Imaging 2017, 17, 11. [Google Scholar] [CrossRef] [Green Version]
- García-Figueiras, R.; Baleato-González, S.; Padhani, A.; Luna-Alcalá, A.; Vallejo-Casas, J.A.; Sala, E.; Vilanova, J.C.; Koh, D.-M.; Herranz-Carnero, M.; Vargas, H.A. How clinical imaging can assess cancer biology. Insights Imaging 2019, 10, 28. [Google Scholar] [CrossRef]
- Yordanova, A.; Biersack, H.-J.; Ahmadzadehfar, H. Advances in Molecular Imaging and Radionuclide Therapy of Neuroendocrine Tumors. J. Clin. Med. 2020, 9, 3679. [Google Scholar] [CrossRef]
- Buckler, A.J.; Bresolin, L.; Dunnick, N.R.; Sullivan, D.C. For the Group Quantitative Imaging Test Approval and Biomarker Qualification: Interrelated but Distinct Activities. Radiology 2011, 259, 875–884. [Google Scholar] [CrossRef] [Green Version]
- Sheikh, A. Evolution of Quantification in Clinical Nuclear Medicine: A Brief Overview of Salient Uses and Upcoming Trends. J. Nucl. Med. Radiat. Ther. 2018, 9, 5. [Google Scholar] [CrossRef]
- Decristoforo, C.; Mather, S.J.; Cholewinski, W.; Donnemiller, E.; Riccabona, G.; Moncayo, R. 99mTc-EDDA/HYNIC-TOC: A new 99mTc-labelled radiopharmaceutical for imaging somatostatin receptor-positive tumours: First clinical results and intra-patient comparison with 111In-labelled octreotide derivatives. Eur. J. Nucl. Med. 2000, 27, 1318–1325. [Google Scholar] [CrossRef]
- Cwikla, J.B.; Mikolajczak, R.; Pawlak, D.; Buscombe, J.R.; Nasierowska-Guttmejer, A.; Bator, A.; Maecke, H.R.; Walecki, J. Initial Direct Comparison of 99mTc-TOC and 99mTc-TATE in Identifying Sites of Disease in Patients with Proven GEP NETs. J. Nucl. Med. 2008, 49, 1060–1065. [Google Scholar] [CrossRef] [Green Version]
- Briganti, V.; Cuccurullo, V.; Berti, V.; Di Stasio, G.D.; Linguanti, F.; Mungai, F.; Mansi, L. 99mTc-EDDA/HYNIC-TOC is a new opportunity in Neuroendocrine Tumors of the Lung (and in other malignant and benign pulmonary diseases). Curr. Radi-Opharm. 2019, 13, 166–176. [Google Scholar] [CrossRef]
- Gabriel, M.; Decristoforo, C.; Donnemiller, E.; Ulmer, H.; Watfah Rychlinski, C.; Mather, S.J.; Moncayo, R. An intra-patient comparison of 99mTc-EDDA/HYNIC-TOC with 111In-DTPA-octreotide for diagnosis of somatostatin receptor-expressing tumors. J. Nucl. Med. 2003, 44, 708–716. [Google Scholar] [PubMed]
- Deveci, E.K.; Ocak, M.; Bozkurt, M.F.; Türker, S.; Kabasakal, L.; Uğur, Ö. The Diagnostic Efficiency of 99mTc-EDDA/HYNIC-Octreotate SPECT-CT in Comparison with 111In-Pentetrotide in the Detection of Neuroendocrine Tumours. Mol. Imaging Radionucl. Ther. 2013, 22, 76–84. [Google Scholar] [CrossRef] [PubMed]
- Kubota, K.; Okasaki, M.; Minamimoto, R.; Miyata, Y.; Morooka, M.; Nakajima, K.; Sato, T. Lesion-based analysis of 18F-FDG uptake and 111In-Pentetreotide uptake by neuroendocrine tumors. Ann. Nucl. Med. 2014, 28, 1004–1010. [Google Scholar] [CrossRef] [PubMed] [Green Version]
- Chougnet, C.N.; Leboulleux, S.; Caramella, C.; Lumbroso, J.; Borget, I.; Déandreis, D.; Duvillard, P.; Elias, D.; De Baere, T.; Vélayoudom-Céphise, F.-L.; et al. Frequency and characterization of gastro–entero–pancreatic neuroendocrine tumor patients with high-grade of uptake at somatostatin receptor scintigraphy. Endocr. Relat. Cancer 2013, 20, 229–239. [Google Scholar] [CrossRef] [PubMed] [Green Version]
- International Atomic Energy Agency. Quantitative Nuclear Medicine Imaging: Concepts, Requirements and Methods; Human Health Reports No. 9; IAEA: Vienna, Austria, 2014. [Google Scholar]
- Frey, E.C.; Humm, J.L.; Ljungberg, M. Accuracy and Precision of Radioactivity Quantification in Nuclear Medicine Images. Semin. Nucl. Med. 2012, 42, 208–218. [Google Scholar] [CrossRef] [Green Version]
- Cobzeanu, M.D.; Cobzeanu, B.M.; Costan, V.V.; Danciu, M.; Pasca, A.-S.; Sulea, D.; Ungureanu, L.B.; Moscalu, M.; Popescu, E. Environmental factors involved in genesis of retromolar—Oropharynx junction cancer. Environ. Eng. Manag. J. 2017, 16, 1101–1106. [Google Scholar] [CrossRef]
- Wahl, R.L.; Jacene, H.; Kasamon, Y.; Lodge, M.A. From RECIST to PERCIST: Evolving Considerations for PET Response Criteria in Solid Tumors. J. Nucl. Med. 2009, 50, 122S–150S. [Google Scholar] [CrossRef] [Green Version]
- Desouza, N.M.; Radiology, E.S.O.; Achten, E.; Alberich-Bayarri, A.; Bamberg, F.; Boellaard, R.; Clément, O.; Fournier, L.; Gallagher, F.; Golay, X.; et al. Validated imaging biomarkers as decision-making tools in clinical trials and routine practice: Current status and recommendations from the EIBALL* subcommittee of the European Society of Radiology (ESR). Insights Imaging 2019, 10, 87. [Google Scholar] [CrossRef] [PubMed] [Green Version]
- McDonald, J.E.; Kessler, M.M.; Gardner, M.W.; Buros, A.F.; Ntambi, J.A.; Waheed, S.; Van Rhee, F.; Zangari, M.; Heuck, C.J.; Petty, N.; et al. Assessment of Total Lesion Glycolysis by 18F FDG PET/CT Significantly Improves Prognostic Value of GEP and ISS in Myeloma. Clin. Cancer Res. 2017, 23, 1981–1987. [Google Scholar] [CrossRef] [Green Version]
- Boellaard, R.; O’Doherty, M.J.; Weber, W.A.; Mottaghy, F.M.; Lonsdale, M.N.; Stroobants, S.G.; Oyen, W.J.; Kotzerke, J.; Hoekstra, O.S.; Pruim, J.; et al. FDG PET and PET/CT: EANM procedure guidelines for tumour PET imaging: Version 1.0. Eur. J. Nucl. Med. Mol. Imaging 2010, 37, 181–200. [Google Scholar] [CrossRef] [PubMed] [Green Version]
- Kaalep, A.; Sera, T.; Rijnsdorp, S.; Yaqub, M.; Talsma, A.; Lodge, M.A.; Boellaard, R. Feasibility of state of the art PET/CT systems performance harmonisation. Eur. J. Nucl. Med. Mol. Imaging 2018, 45, 1344–1361. [Google Scholar] [CrossRef] [PubMed] [Green Version]
- Răileanu, I.; Rusu, V.; Stefănescu, C.; Cinotti, L.; Hountis, D. 18F FDG PET-Applications in Oncology. Rev. Med. Chir. Soc. Med. Nat. Iasi 2002, 106, 14–23. [Google Scholar] [PubMed]


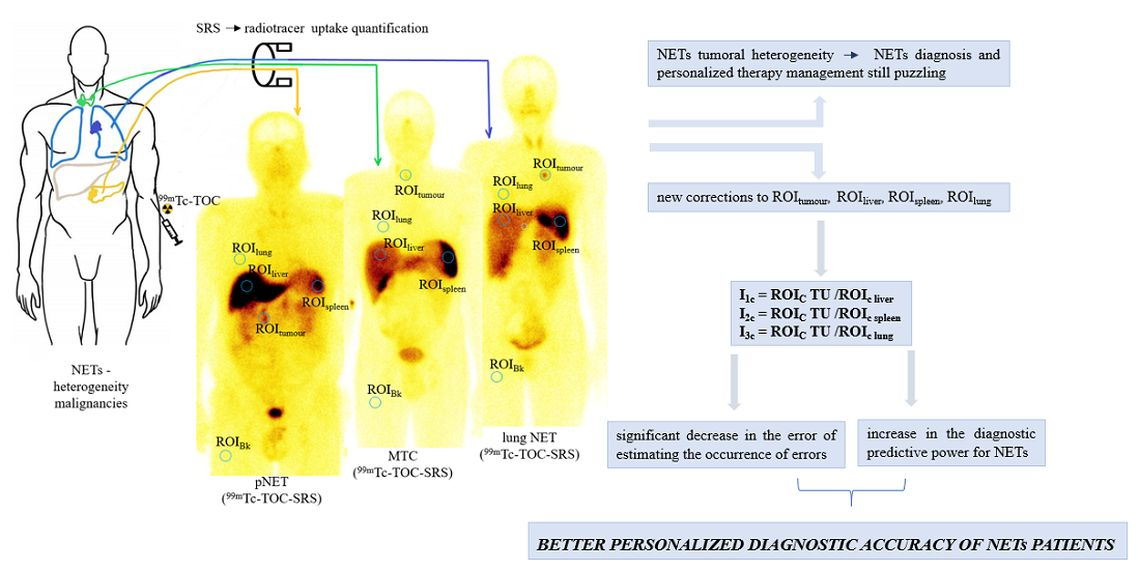
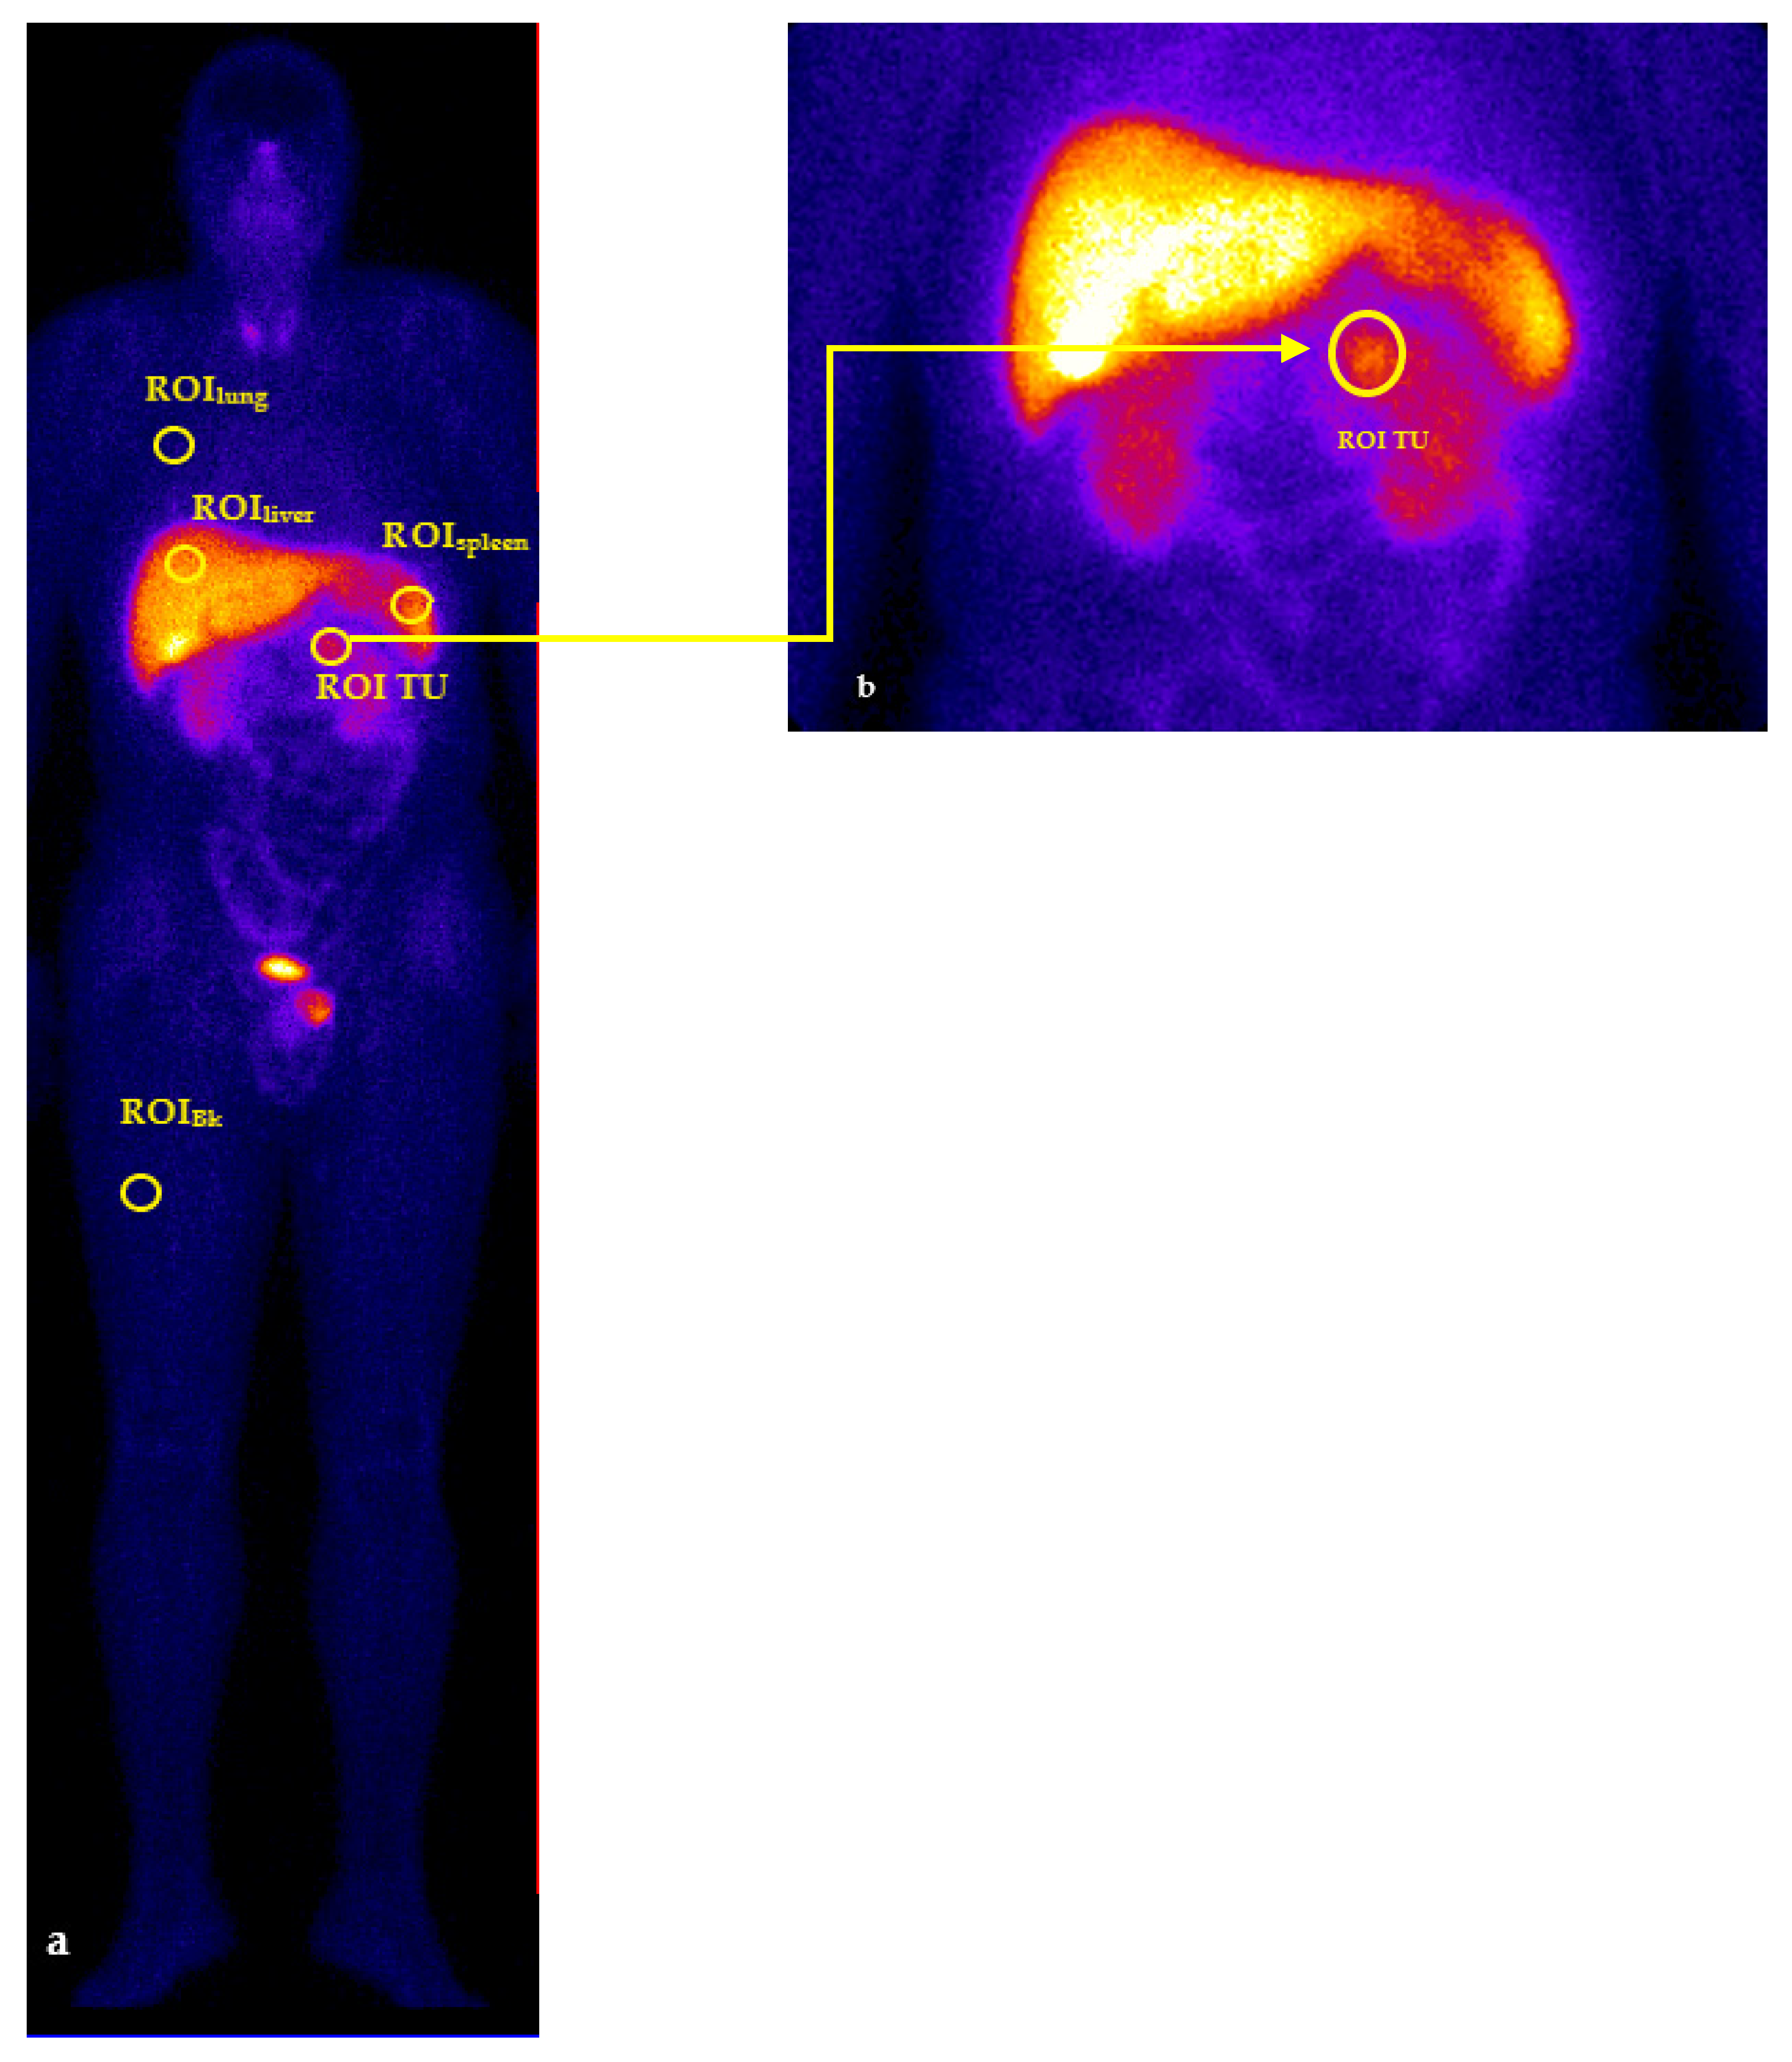
| Corrected activity related to the background | Corrected calculation formula | (ROI TU—ROIBk)/ROIBk = ROIc TU |
| for TU liver localization | (ROI TUliver—ROIliver)/ROIBk = ROIc TU | |
| ROI calculated for normal tissue | (ROIliver—ROIBk)/ROIBk = ROIc liver | |
| (ROIspleen—ROIBk)/ROIBk = ROIc spleen | ||
| (ROIlung—ROIBk)/ROIBk = ROIc lung |
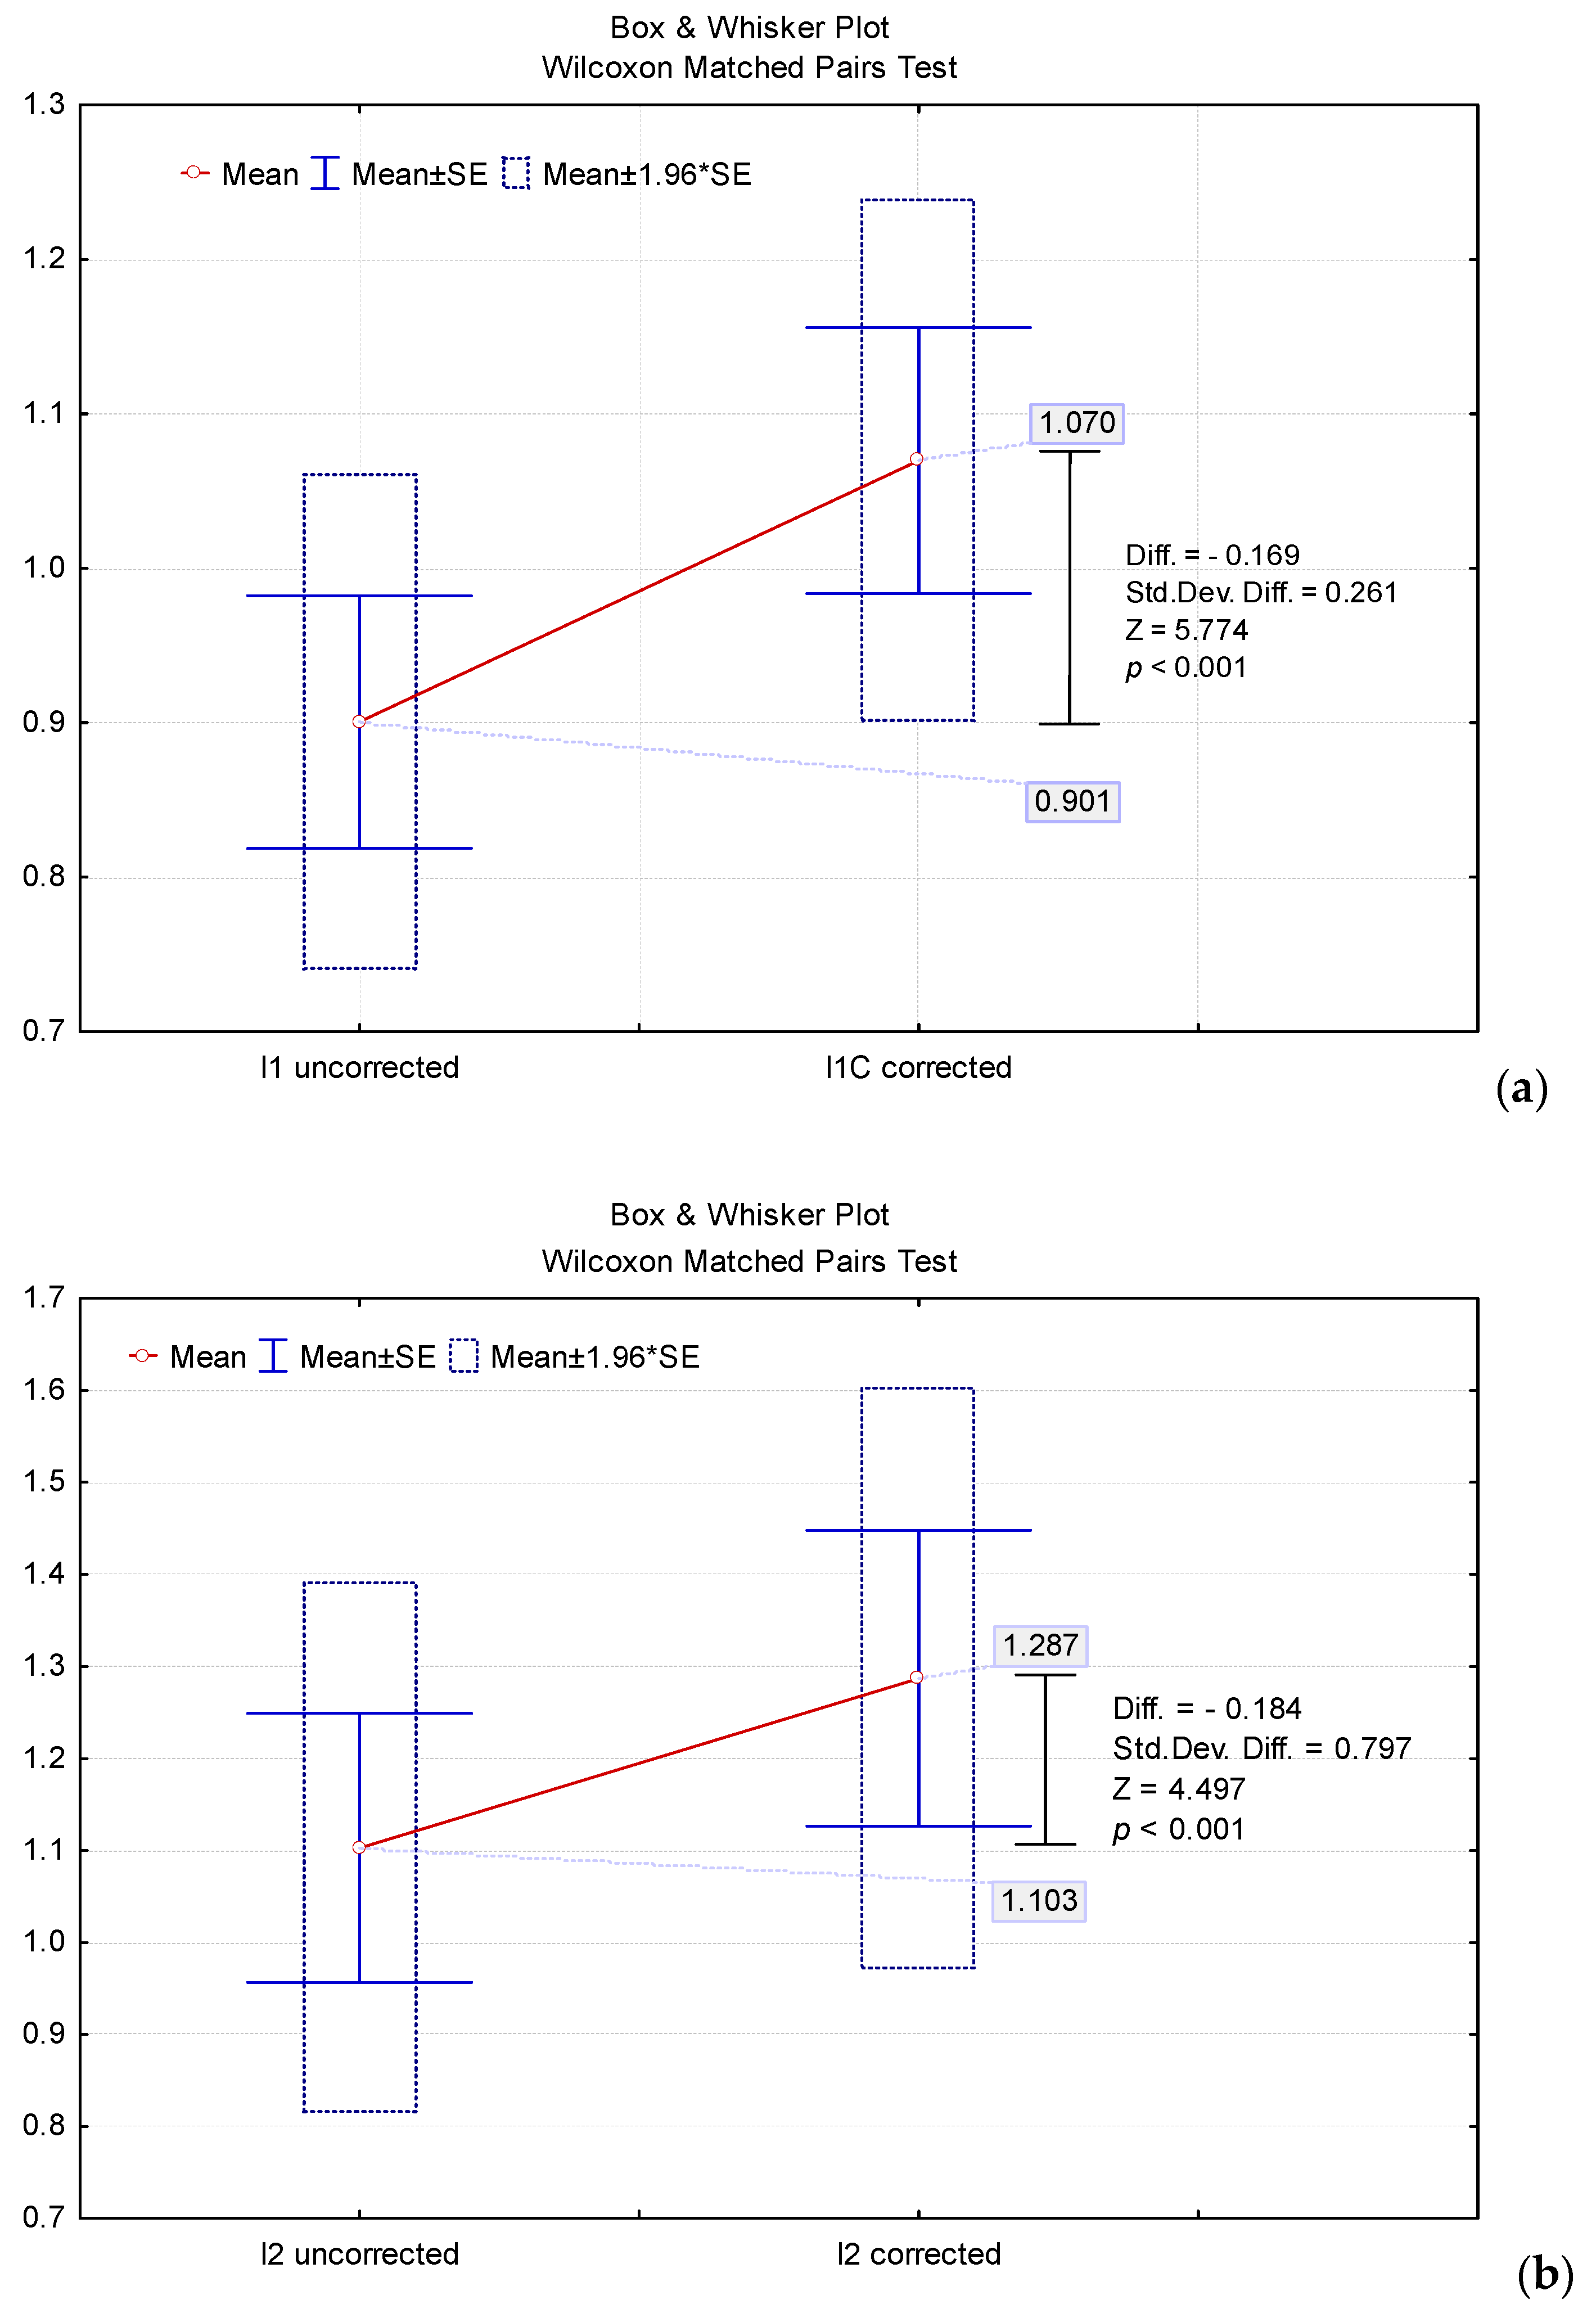
| Indices | Uncorrected Indices | Corrected Indices |
|---|---|---|
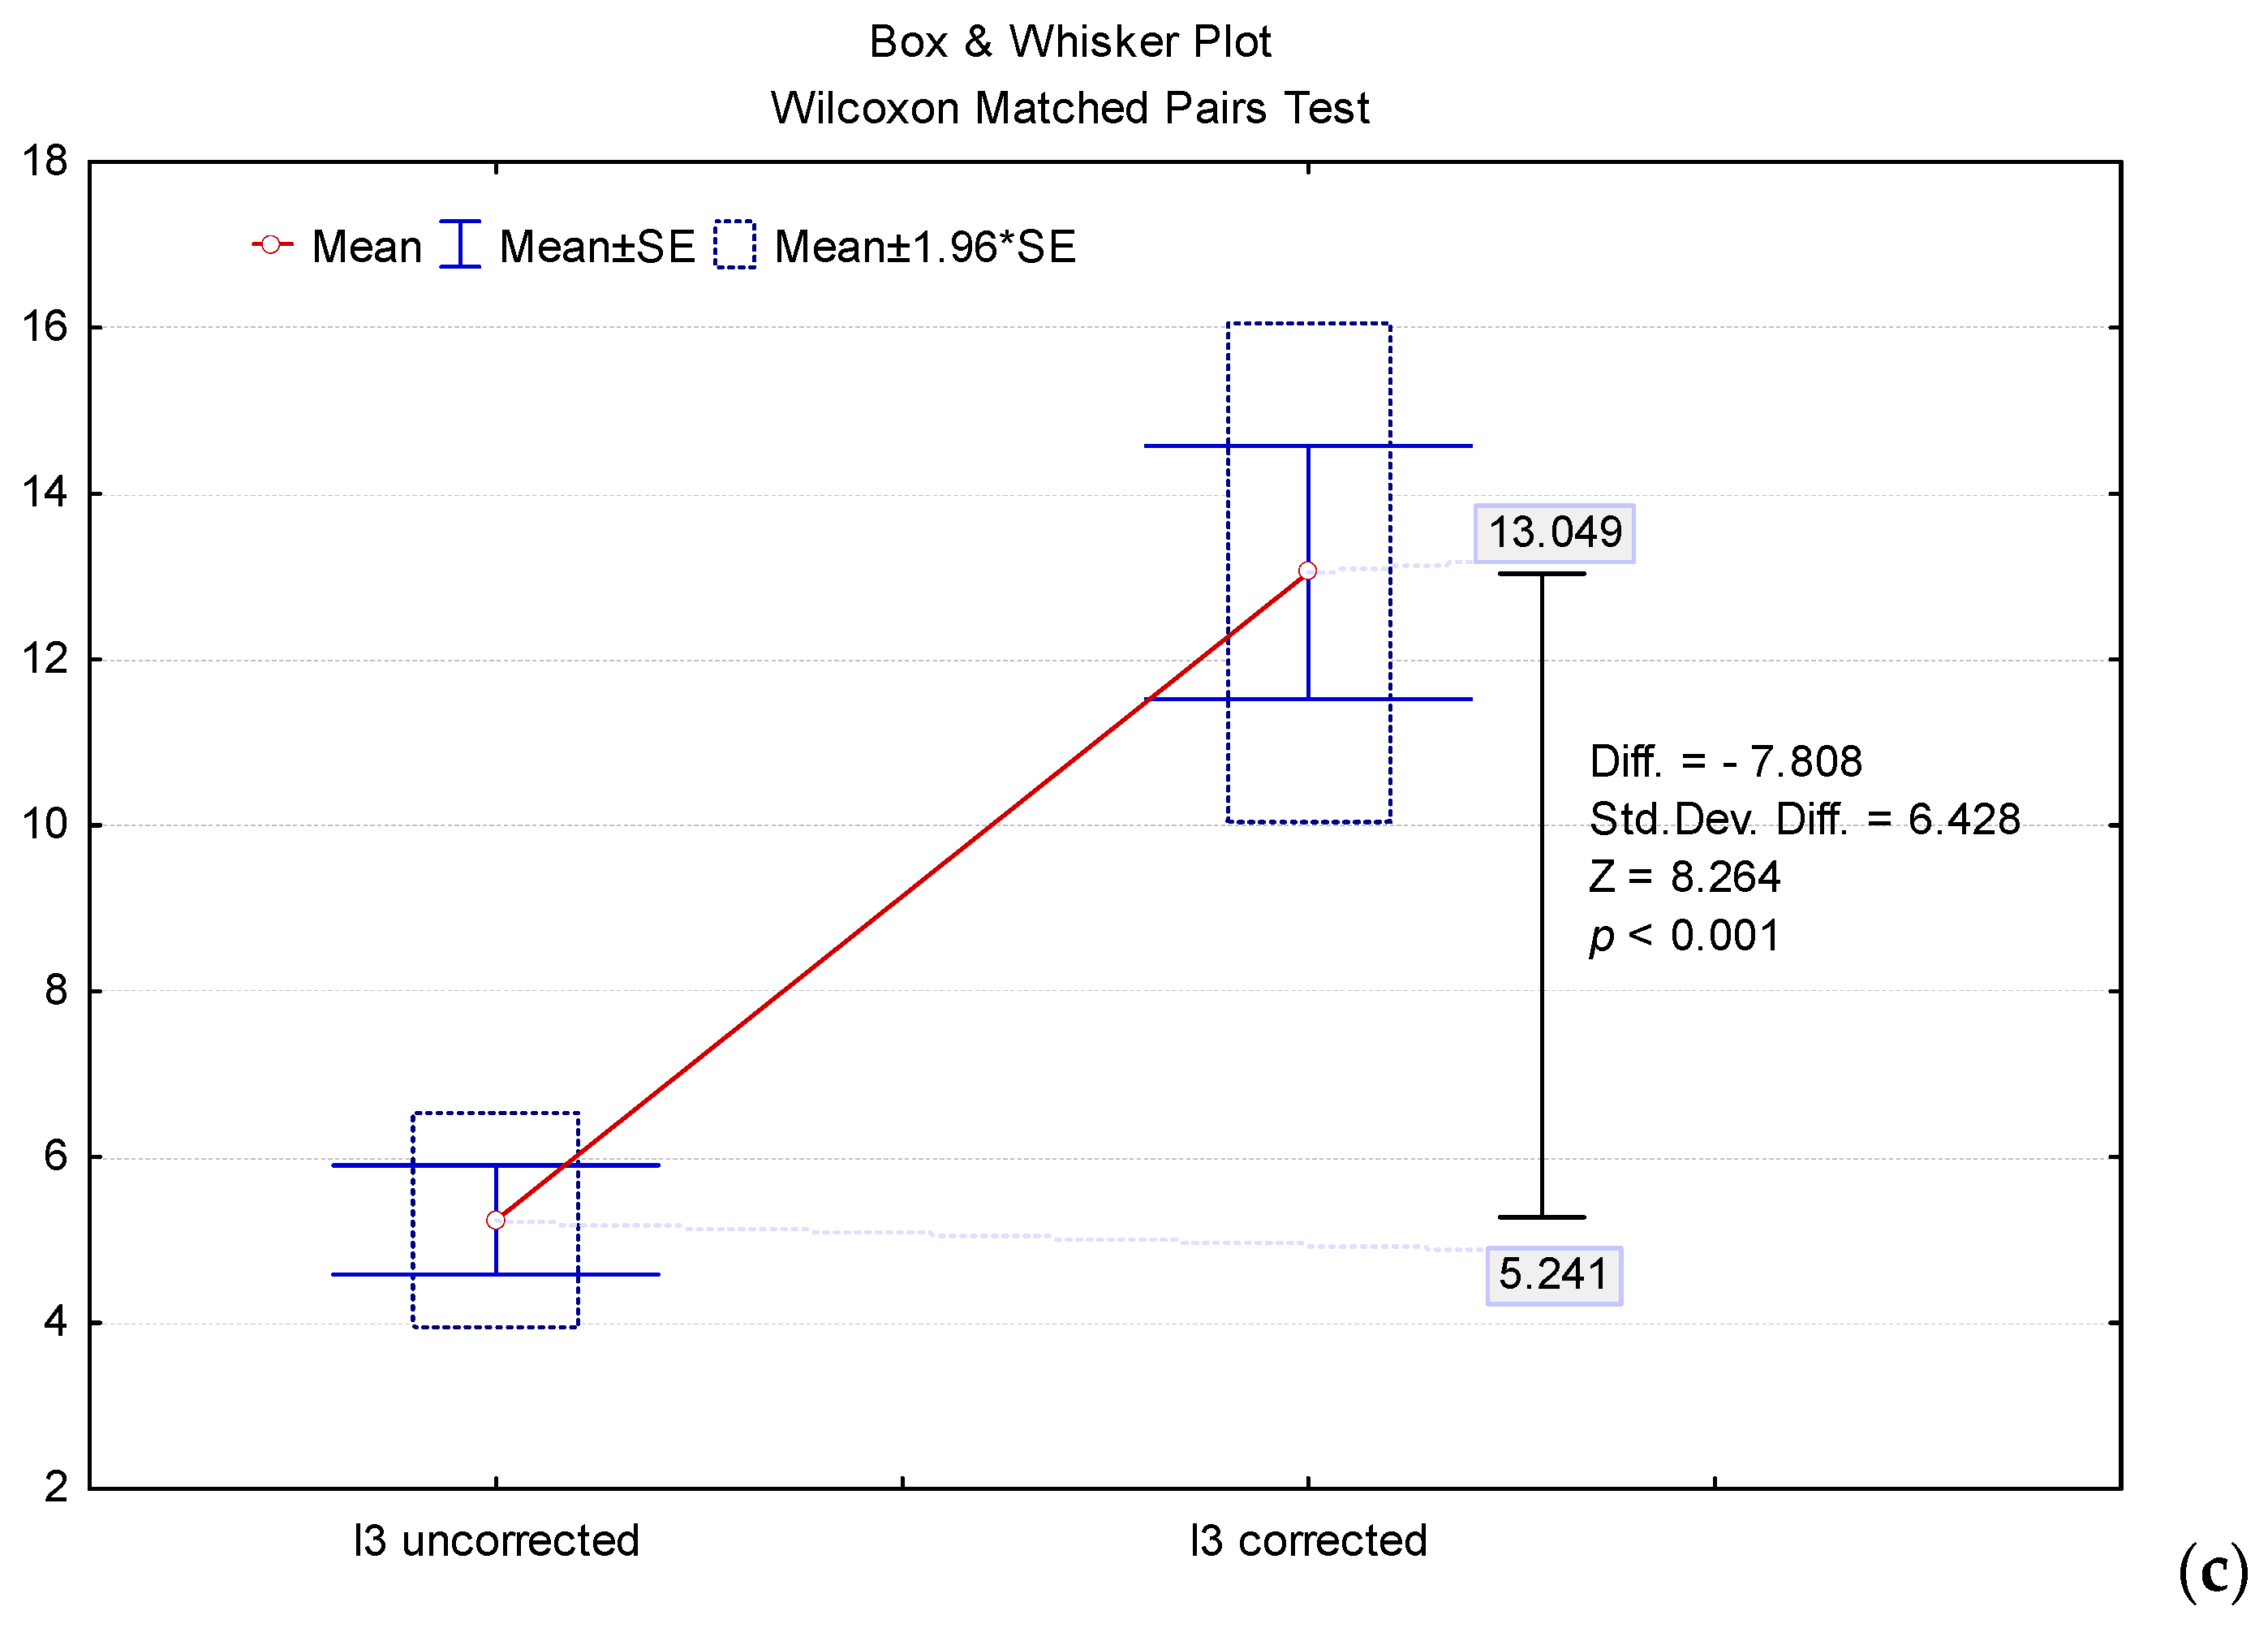
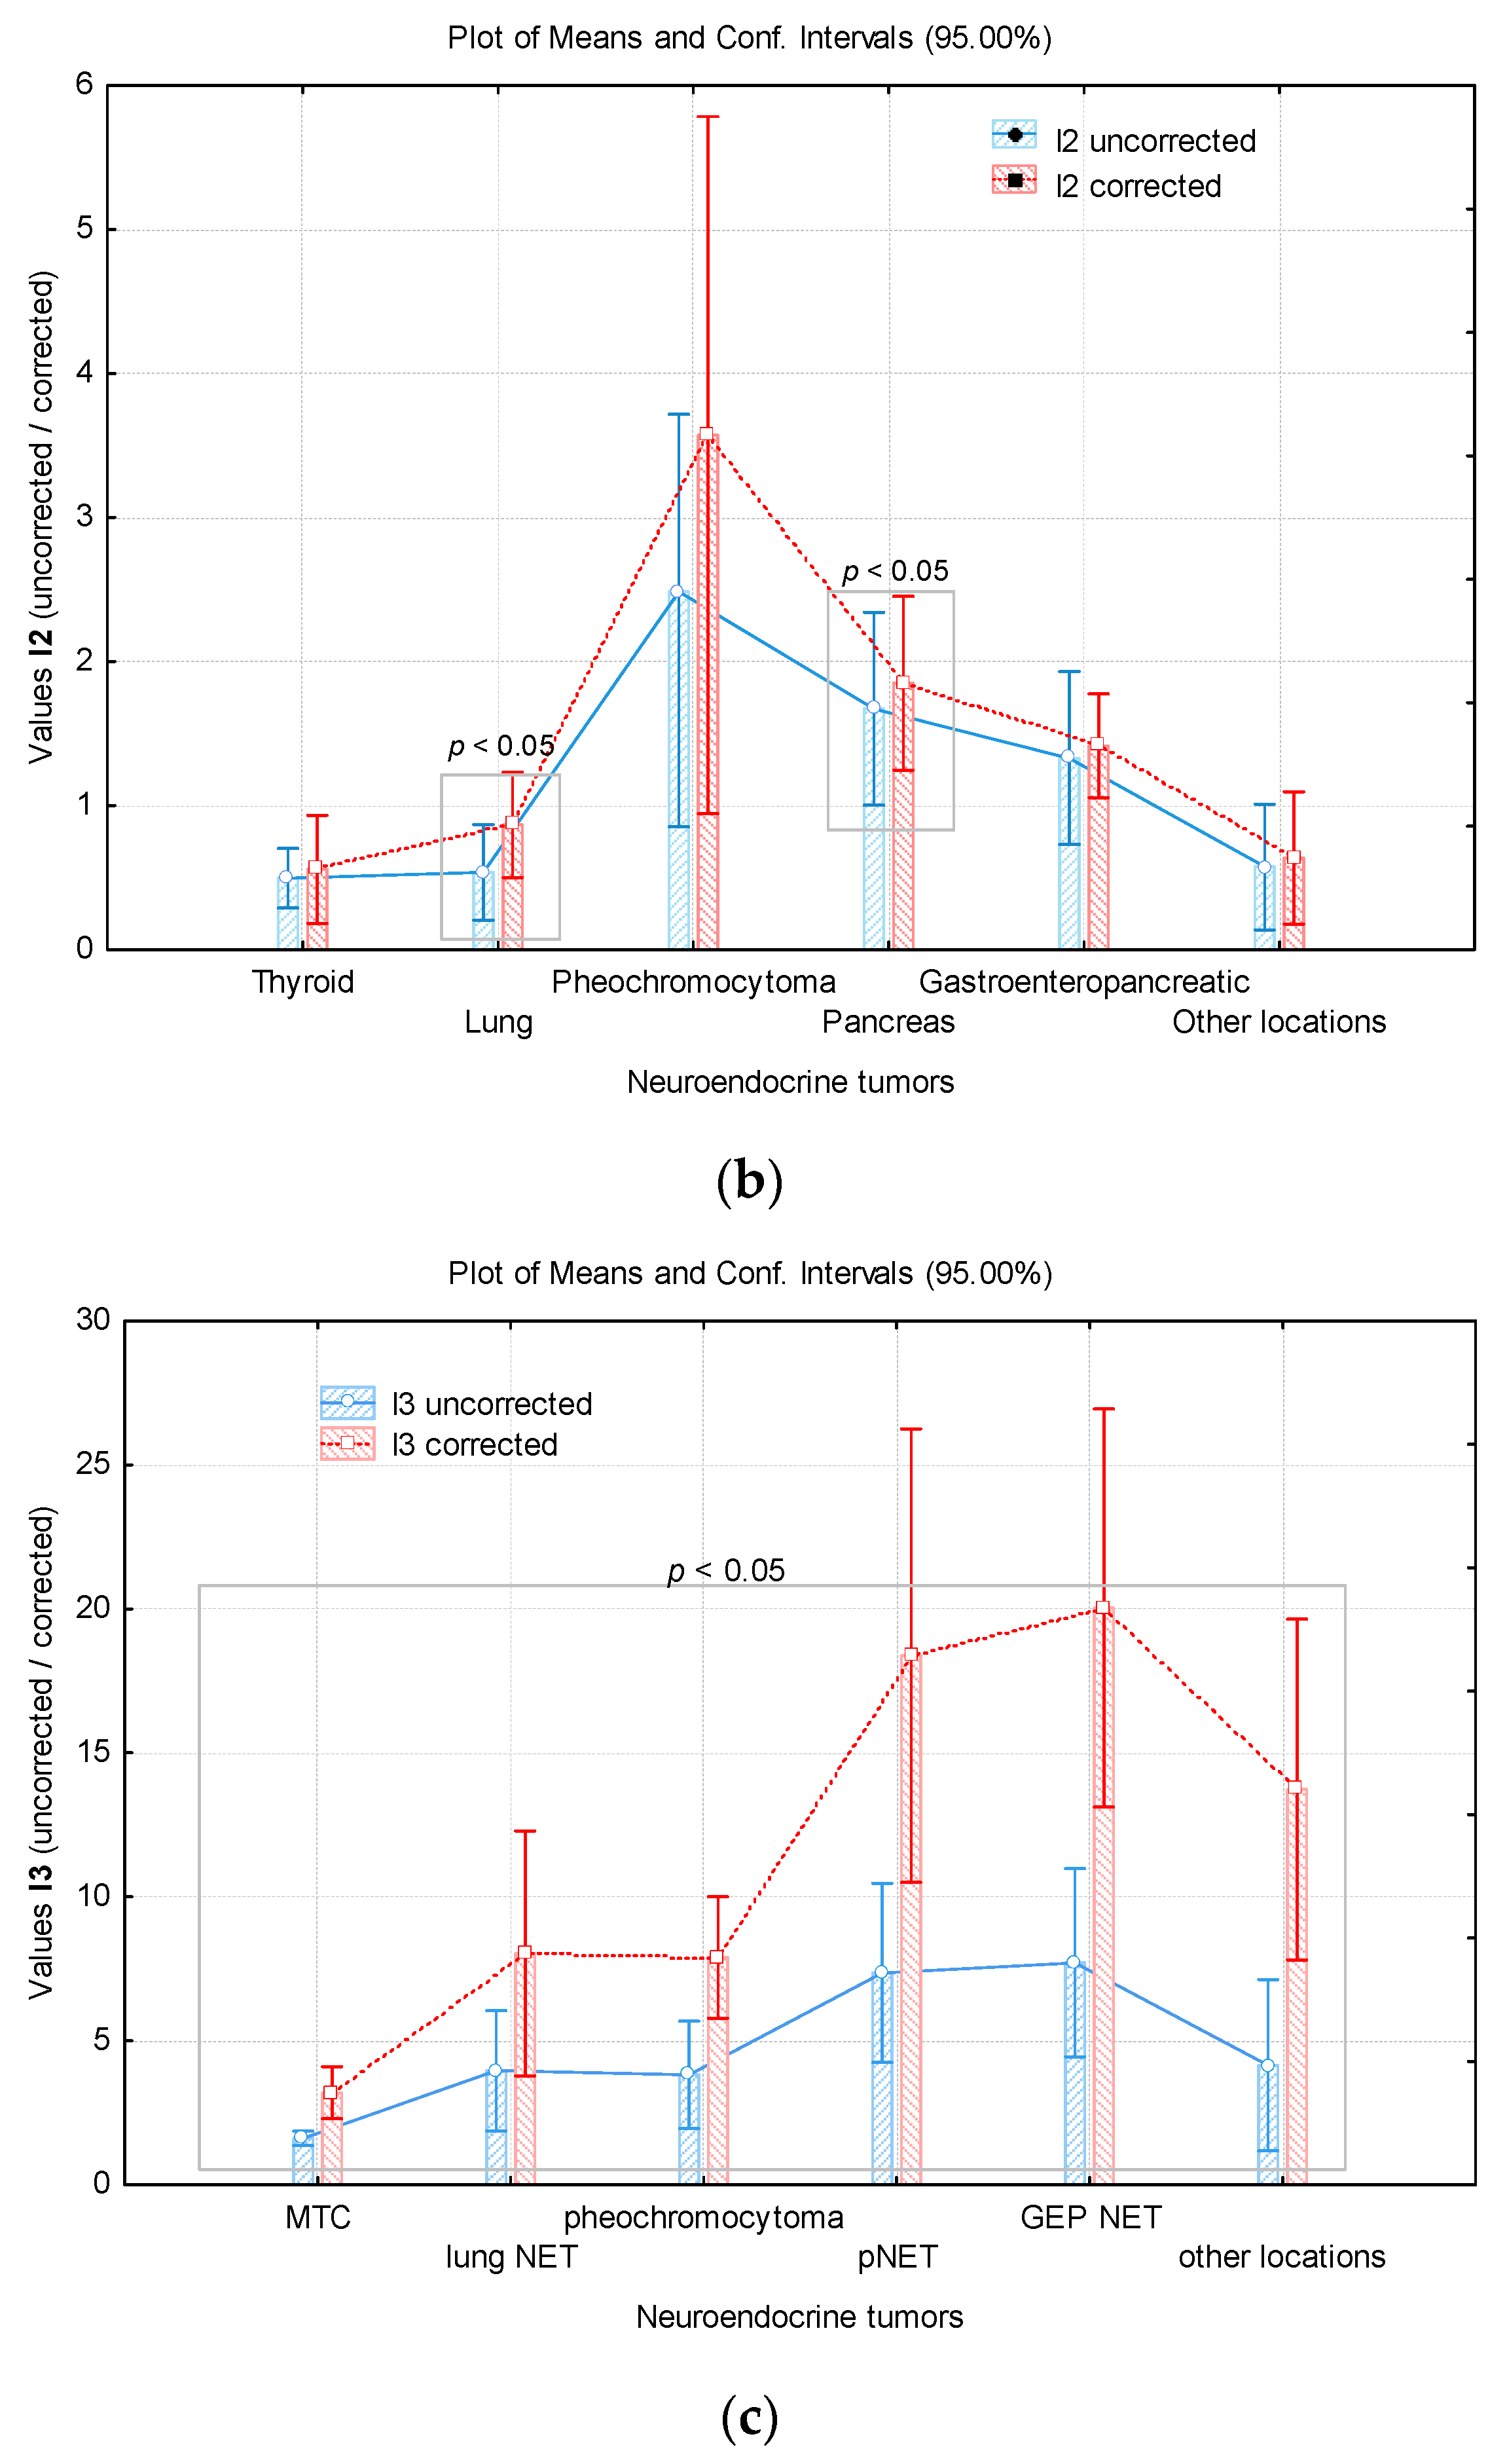
| I1 | I1unc = ROI TU/ROIliver | I1c = ROIC TU/ROIc liver |
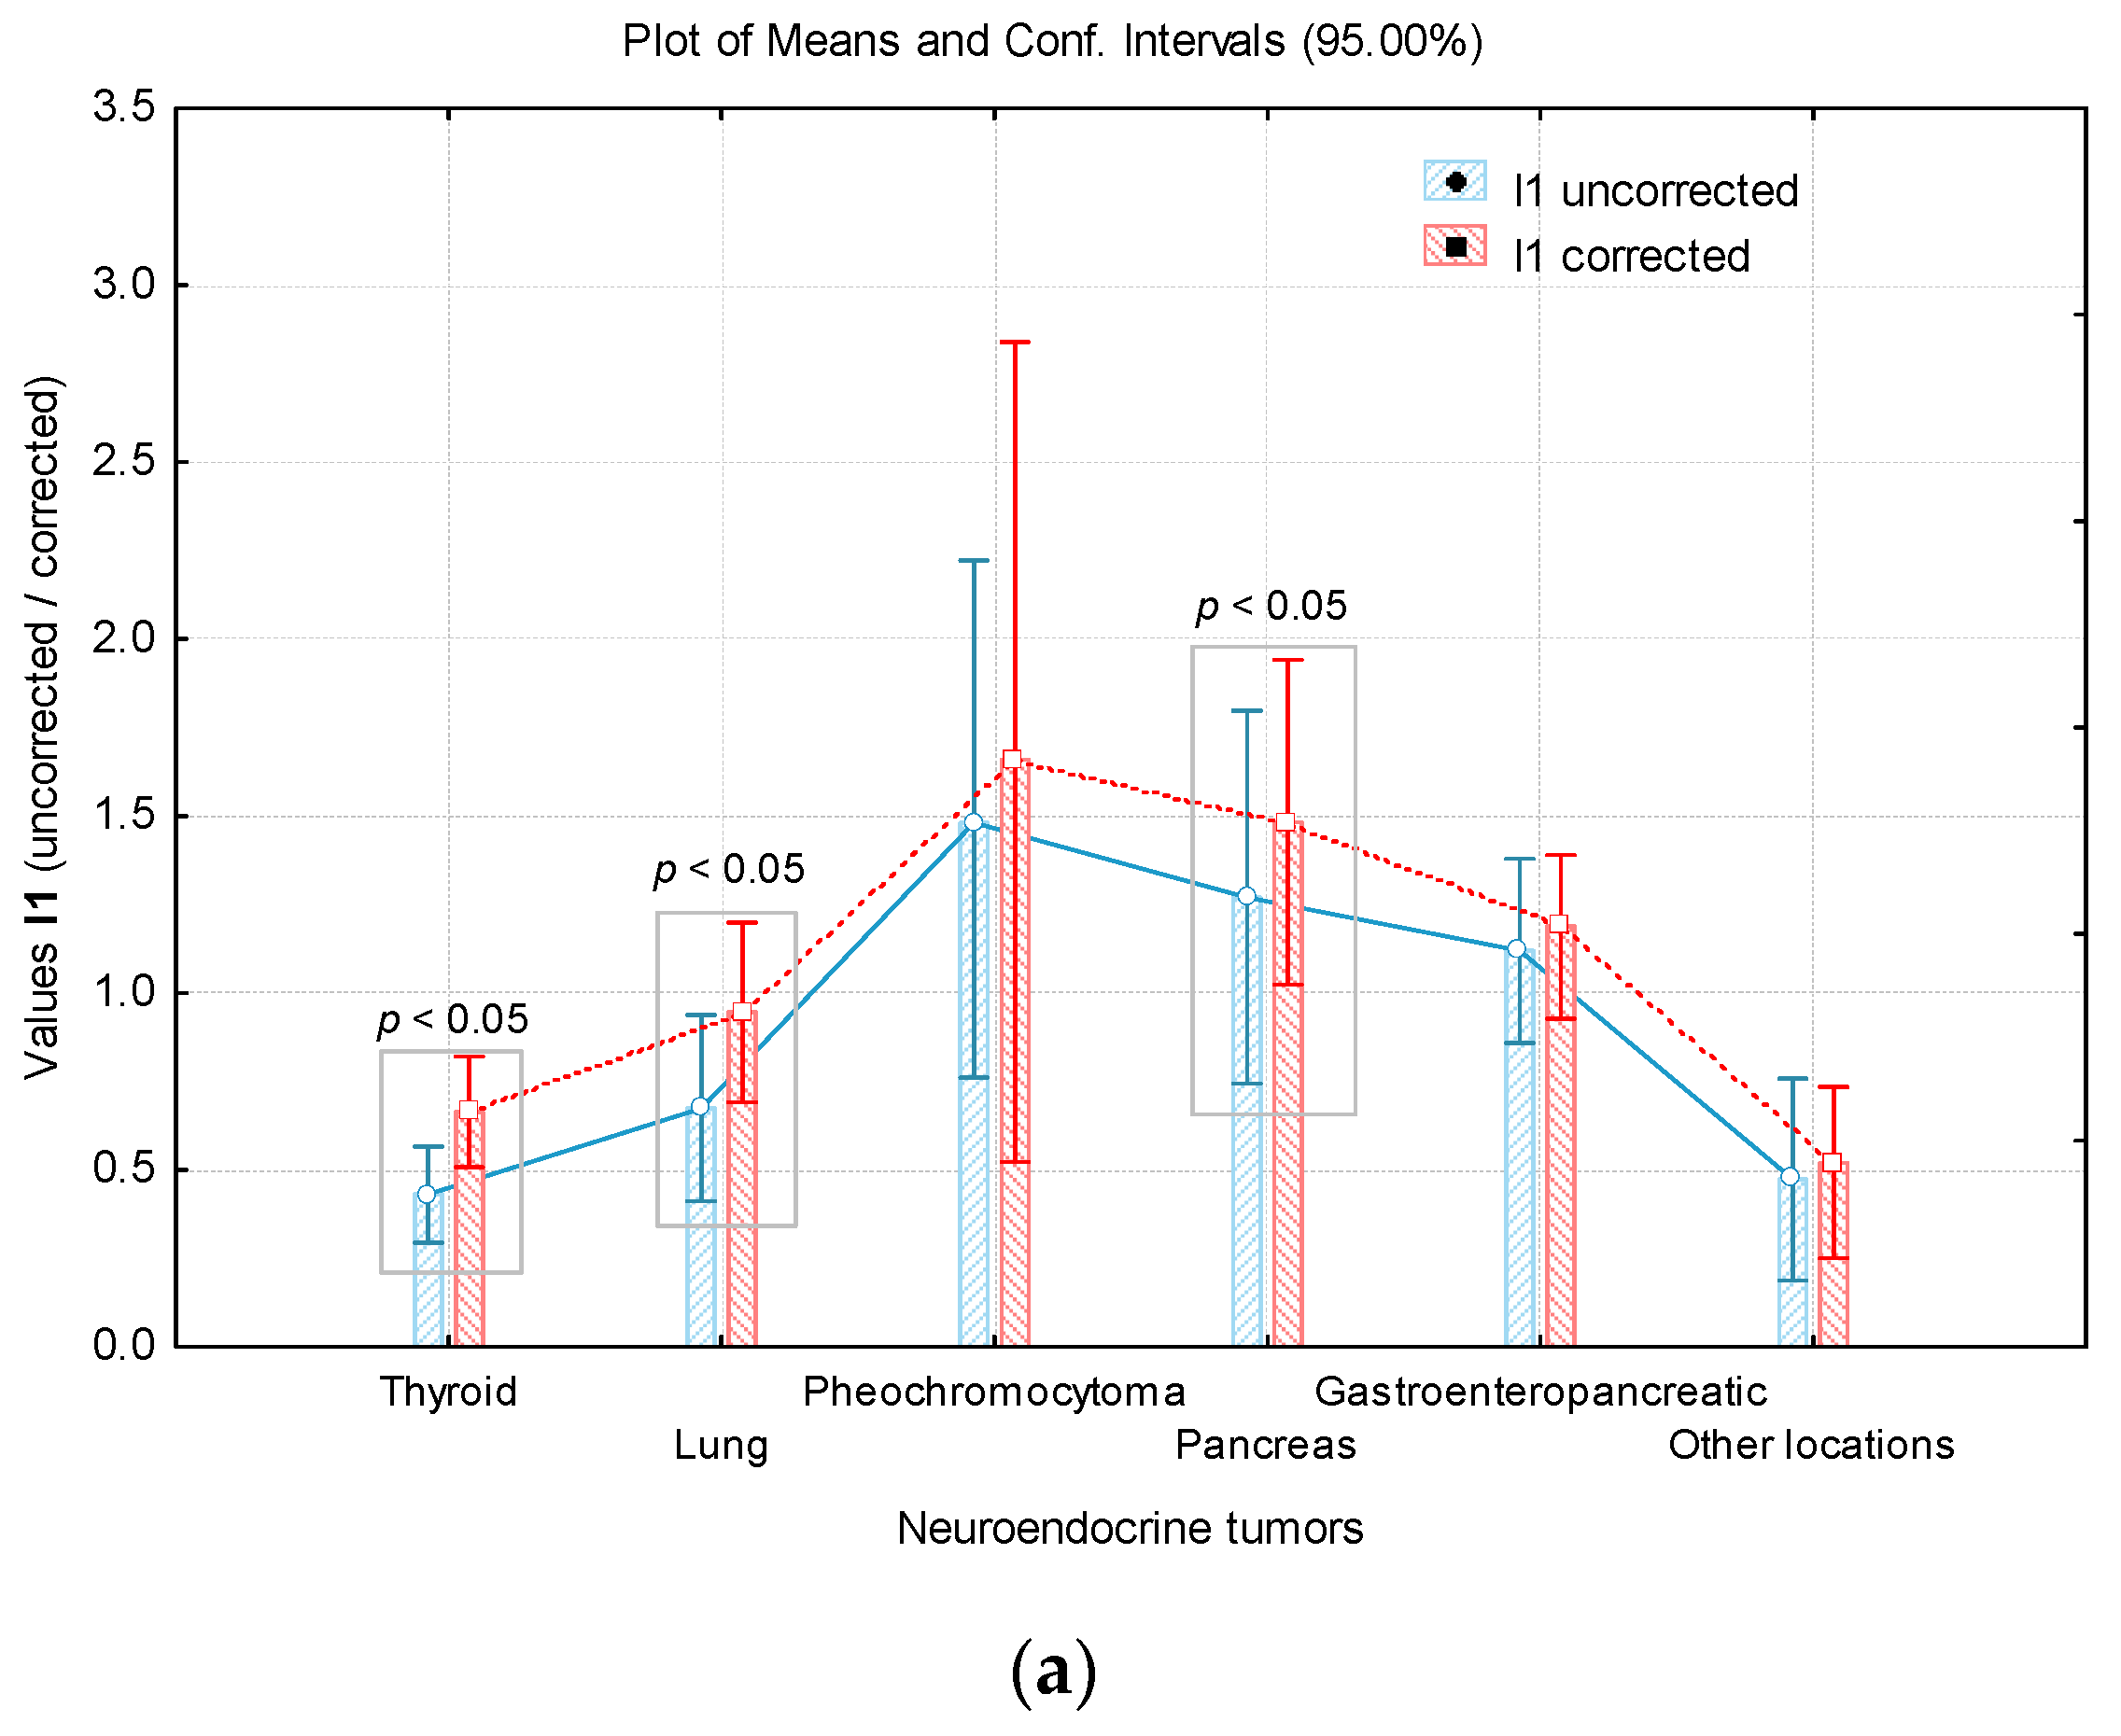
| I2 | I2unc = ROI TU/ROIspleen | I2c = ROIC TU/ROIc spleen |
| I3 | I3unc = ROI TU/ROIlung | I3c = ROIC TU/ROIc lung |
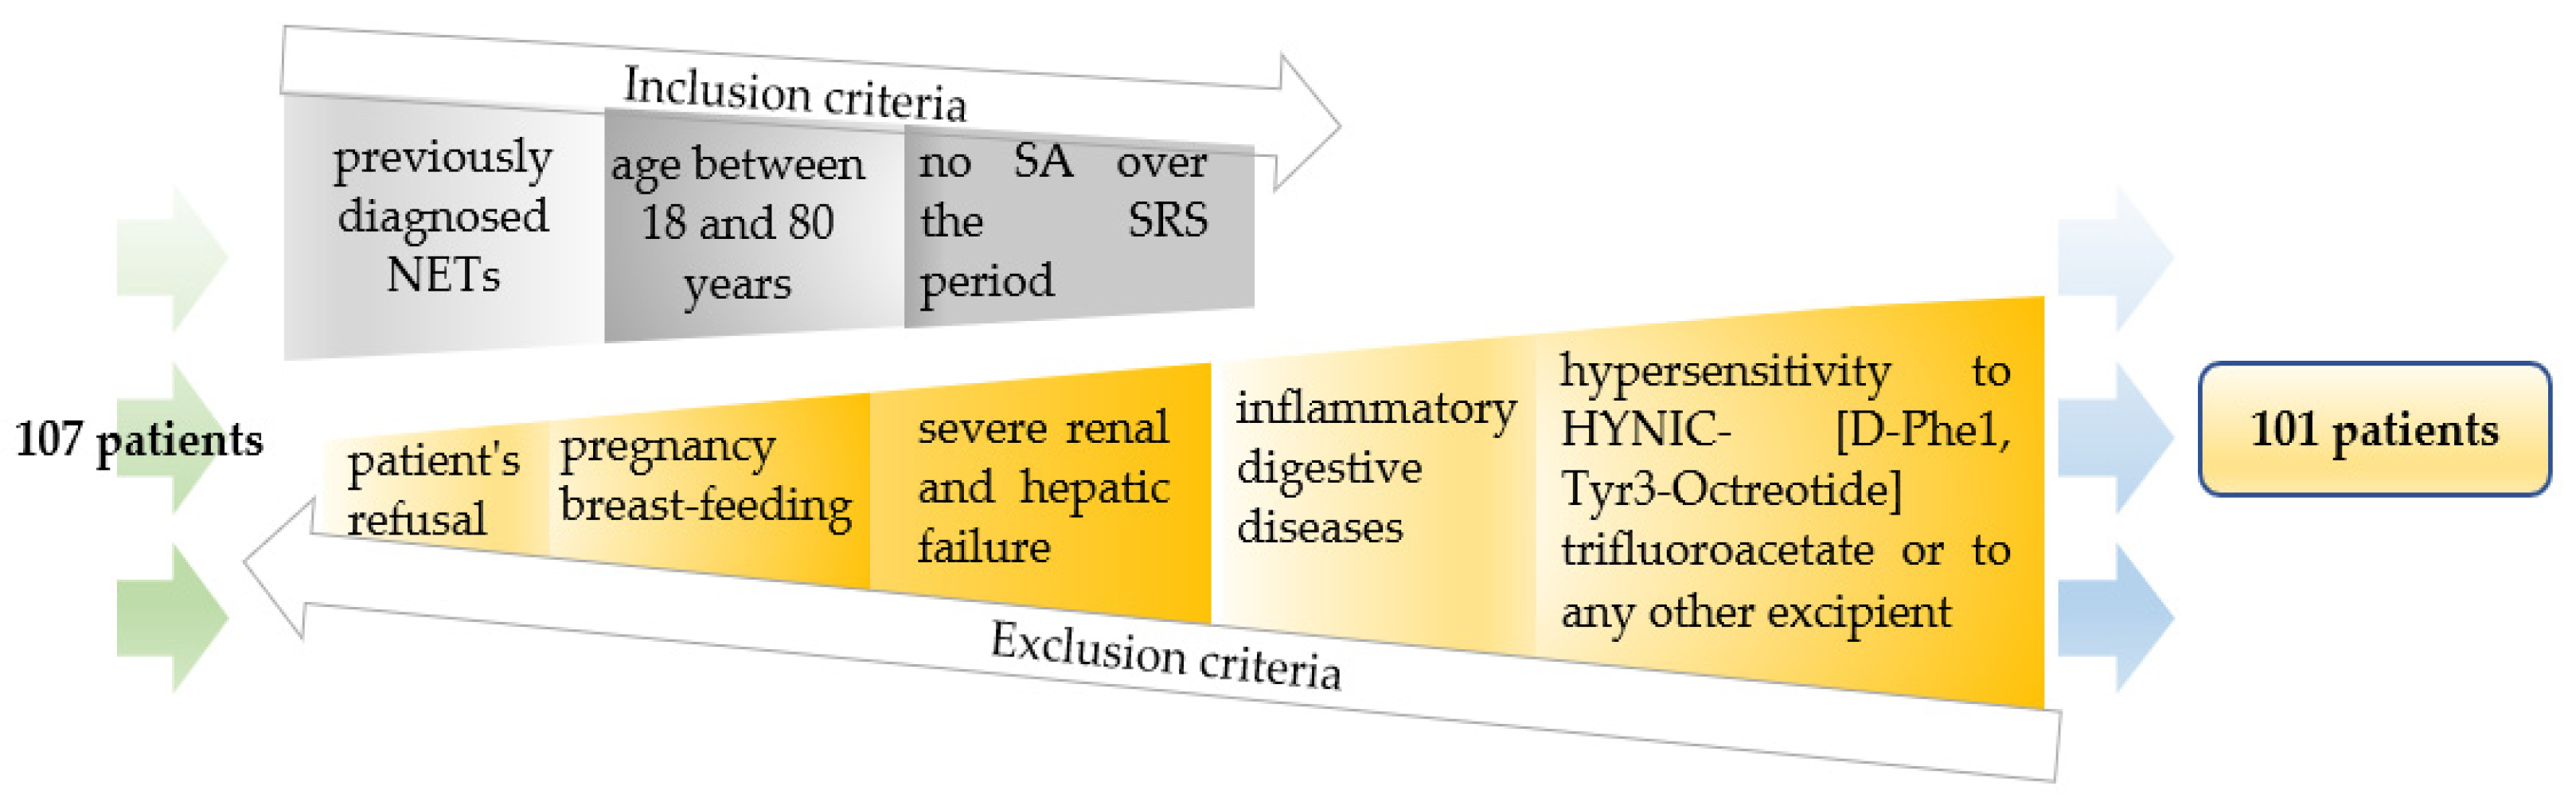
| Baseline Characteristics | Patients with Neuroendocrine Tumours (n = 101) | |
|---|---|---|
| Age: years, mean ± SD | 55.7 ± 12.1 | Std. Err.: 1.2 |
| Gender, (male/female), n (%) | 51/50 (50.5%/49.5%) | |
| Neuroendocrine tumours (NETs) localization, n (%) thyroid lung pheochromocytoma pancreas gastroenteropancreatic other locations | 24 (23.8) 13 (12.9) 6 (5.9) 17 (16.8) 34 (33.7) 7 (6.9) | − |
| Grade, n (%) G1 G2 G3 Unknown | 20 (19.8) 35 (34.7) 9 (8.9) 37 (36.6) | − |
| Ki67%, mean ± SD | 13.4 ± 13.8 | Std. Err.: 1.8 |
| Metastasis (Yes/No), n (%) | 65/36 (64.4/35.6) | |
| Neuroendocrine Tumours(localization) | I Uncorrected | I Corrected | |
|---|---|---|---|
| I1 = ROI TU/ROI Liver(Mean ± Standard Deviation) | |||
| I1 | I1c | p‒Value § | |
| Thyroid | 0.43 ± 0.32 | 0.66 ± 0.37 | <0.001 * |
| Lung | 0.67 ± 0.43 | 0.95 ± 0.42 | 0.0008 * |
| Pheochromocytoma | 1.48 ± 0.65 | 1.66 ± 0.08 | 0.3483 |
| Pancreas | 1.27 ± 1.03 | 1.48 ± 0.79 | 0.0069 * |
| Gastrointestinal | 1.12 ± 0.74 | 1.19 ± 0.67 | 0.0944 |
| Other locations | 0.47 ± 0.27 | 0.52 ± 0.37 | 0.2193 |
| I1 = ROI TU/ROI spleen(mean ± standard deviation) | |||
| I2 | I2c | ||
| Thyroid | 0.49 ± 0.31 | 0.56 ± 0.39 | 0.4799 |
| Lung | 0.53 ± 0.24 | 0.87 ± 0.41 | 0.0002 * |
| Pheochromocytoma | 2.48 ± 1.08 | 3.57 ± 1.96 | 0.2205 |
| Pancreas | 1.67 ± 0.93 | 1.85 ± 0.92 | 0.0161 * |
| Gastrointestinal | 1.32 ± 0.72 | 1.41 ± 0.34 | 0.6251 |
| Other locations | 0.57 ± 0.27 | 0.64 ± 0.29 | 0.1027 |
| I1 = ROI TU/ROI lung(mean ± standard deviation) | |||
| I3 | I3c | ||
| Thyroid | 1.61 ± 0.59 | 3.19 ± 0.97 | <0.001 * |
| Lung | 3.95 ± 1.45 | 8.03 ± 2.03 | 0.0440 * |
| Pheochromocytoma | 3.81 ± 0.78 | 7.90 ± 2.01 | 0.0016 * |
| Pancreas | 7.35 ± 1.03 | 18.38 ± 6.32 | 0.0022 * |
| Gastrointestinal | 7.71 ± 3.37 | 20.03 ± 8.81 | <0.0001 * |
| Other locations | 4.14 ± 1.21 | 13.73 ± 4.96 | 0.0364 * |
| NETs (Localization) | Uptake Indices | Area under the Curve AUC (95%CI) | Std. Error | p-Value |
|---|---|---|---|---|
| Thyroid | I1 uncorrected | 0.714 (0.606–0.823) | 0.055 | 0.002 * |
| I1 corrected | 0.808 (0.707–0.909) | 0.052 | <0.001 * | |
| I2 uncorrected | 0.723 (0.605–0.841) | 0.060 | 0.001 * | |
| I2 corrected | 0.817 (0.695–0.938) | 0.062 | <0.001 * | |
| I3 uncorrected | 0.75 (0.674–0.926) | 0.039 | 0.002 * | |
| I3 corrected | 0.887 (0.822–0.953) | 0.034 | <0.001 * | |
| Lung | I1 uncorrected | 0.632 (0.774–0.926) | 0.039 | 0.043 * |
| I1 corrected | 0.829 (0.822–0.953) | 0.034 | <0.001 * | |
| I2 uncorrected | 0.663 (0.419–0.707) | 0.073 | 0.032 * | |
| I2 corrected | 0.776 (0.505–0.848) | 0.088 | 0.041 * | |
| I3 uncorrected | 0.692 (0.371–0.731) | 0.092 | 0.003 * | |
| I3 corrected | 0.891 (0.413–0.769) | 0.091 | 0.001 * | |
| Pheochromocytoma | I1 uncorrected | 0.496 (0.21–0.783) | 0.046 | 0.977 |
| I1 corrected | 0.614 (0.398–0.83) | 0.010 | 0.350 | |
| I2 uncorrected | 0.642 (0.401–0.883) | 0.023 | 0.245 | |
| I2 corrected | 0.728 (0.694–0.892) | 0.084 | 0.031 * | |
| I3 uncorrected | 0.653 (0.324–0.736) | 0.054 | 0.074 | |
| I3 corrected | 0.768 (0.435–0.702) | 0.068 | 0.027 * | |
| Pancreas | I1 uncorrected | 0.631 (0.556–0.807) | 0.064 | 0.079 |
| I1 corrected | 0.689 (0.625–0.853) | 0.058 | 0.062 | |
| I2 uncorrected | 0.645 (0.61–0.859) | 0.063 | 0.062 | |
| I2 corrected | 0.696 (0.647–0.853) | 0.052 | 0.051 | |
| I3 uncorrected | 0.794 (0.576–0.812) | 0.060 | 0.012 * | |
| I3 corrected | 0.915 (0.875–0.986) | 0.051 | <0.001 * | |
| Gastrointestinal | I1 uncorrected | 0.576 (0.355–0.798) | 0.062 | 0.211 |
| I1 corrected | 0.689 (0.486–0.891) | 0.052 | 0.072 | |
| I2 uncorrected | 0.599 (0.488–0.711) | 0.057 | 0.104 | |
| I2 corrected | 0.642 (0.336–0.749) | 0.054 | 0.080 | |
| I3 uncorrected | 0.672 (0.567–0.757) | 0.054 | 0.041 * | |
| I3 corrected | 0.908 (0.785–0.982) | 0.053 | <0.001 * | |
| Other locations | I1 uncorrected | 0.579 (0.49–0.868) | 0.096 | 0.115 |
| I1 corrected | 0.59 (0.448–0.893) | 0.088 | 0.053 | |
| I2 uncorrected | 0.519 (0.416–0.821) | 0.103 | 0.297 | |
| I2 corrected | 0.56 (0.467–0.853) | 0.098 | 0.160 | |
| I3 uncorrected | 0.706 (0.279–0.772) | 0.036 | 0.028 * | |
| I3 corrected | 0.872 (0.794–0.98) | 0.029 | 0.001 * |
Publisher’s Note: MDPI stays neutral with regard to jurisdictional claims in published maps and institutional affiliations. |
© 2021 by the authors. Licensee MDPI, Basel, Switzerland. This article is an open access article distributed under the terms and conditions of the Creative Commons Attribution (CC BY) license (https://creativecommons.org/licenses/by/4.0/).
Share and Cite
Stolniceanu, C.R.; Moscalu, M.; Azoicai, D.; Tamba, B.; Volovat, C.; Grierosu, I.; Ionescu, T.; Jalloul, W.; Ghizdovat, V.; Gherasim, R.; et al. Improved Personalised Neuroendocrine Tumours’ Diagnosis Predictive Power by New Receptor Somatostatin Image Processing Quantification. J. Pers. Med. 2021, 11, 1042. https://doi.org/10.3390/jpm11101042
Stolniceanu CR, Moscalu M, Azoicai D, Tamba B, Volovat C, Grierosu I, Ionescu T, Jalloul W, Ghizdovat V, Gherasim R, et al. Improved Personalised Neuroendocrine Tumours’ Diagnosis Predictive Power by New Receptor Somatostatin Image Processing Quantification. Journal of Personalized Medicine. 2021; 11(10):1042. https://doi.org/10.3390/jpm11101042
Chicago/Turabian StyleStolniceanu, Cati Raluca, Mihaela Moscalu, Doina Azoicai, Bogdan Tamba, Constantin Volovat, Irena Grierosu, Teodor Ionescu, Wael Jalloul, Vlad Ghizdovat, Roxana Gherasim, and et al. 2021. "Improved Personalised Neuroendocrine Tumours’ Diagnosis Predictive Power by New Receptor Somatostatin Image Processing Quantification" Journal of Personalized Medicine 11, no. 10: 1042. https://doi.org/10.3390/jpm11101042