
Telomere Length Dynamics and Chromosomal Instability for Predicting Individual Radiosensitivity and Risk via Machine Learning

 and
and 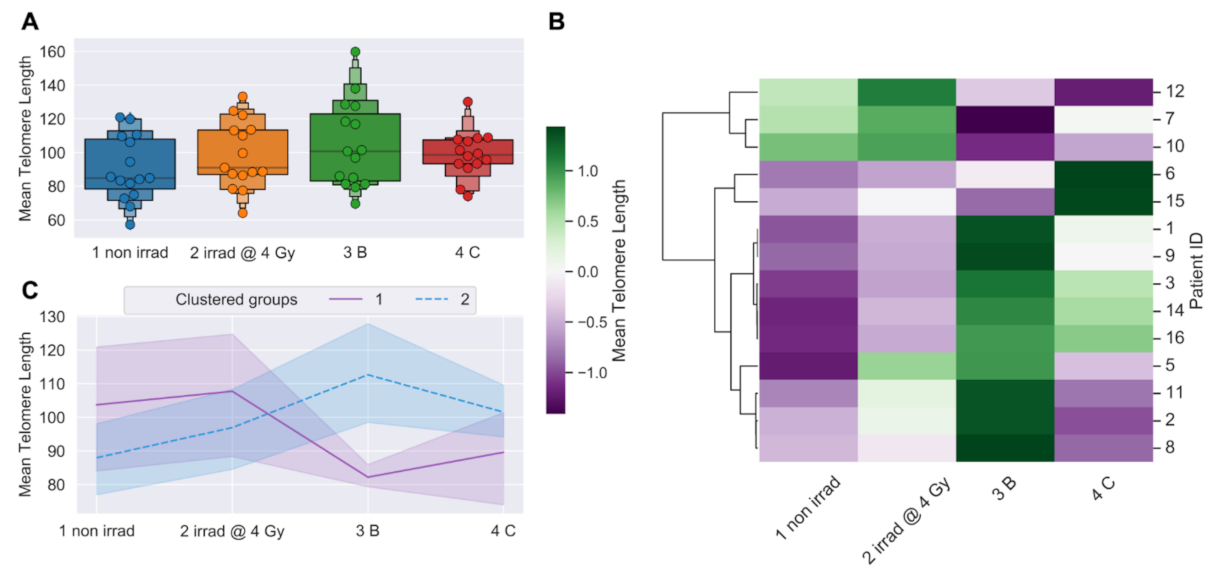
Abstract
:1. Introduction
2. Materials and Methods
2.1. Patient Consent, IMRT Therapy Information
2.2. Sample Collection and Processing for Telo-FISH and dGH
2.3. Telomere Fluorescence In Situ Hybridization (Telo-FISH), Imaging, Quantifications
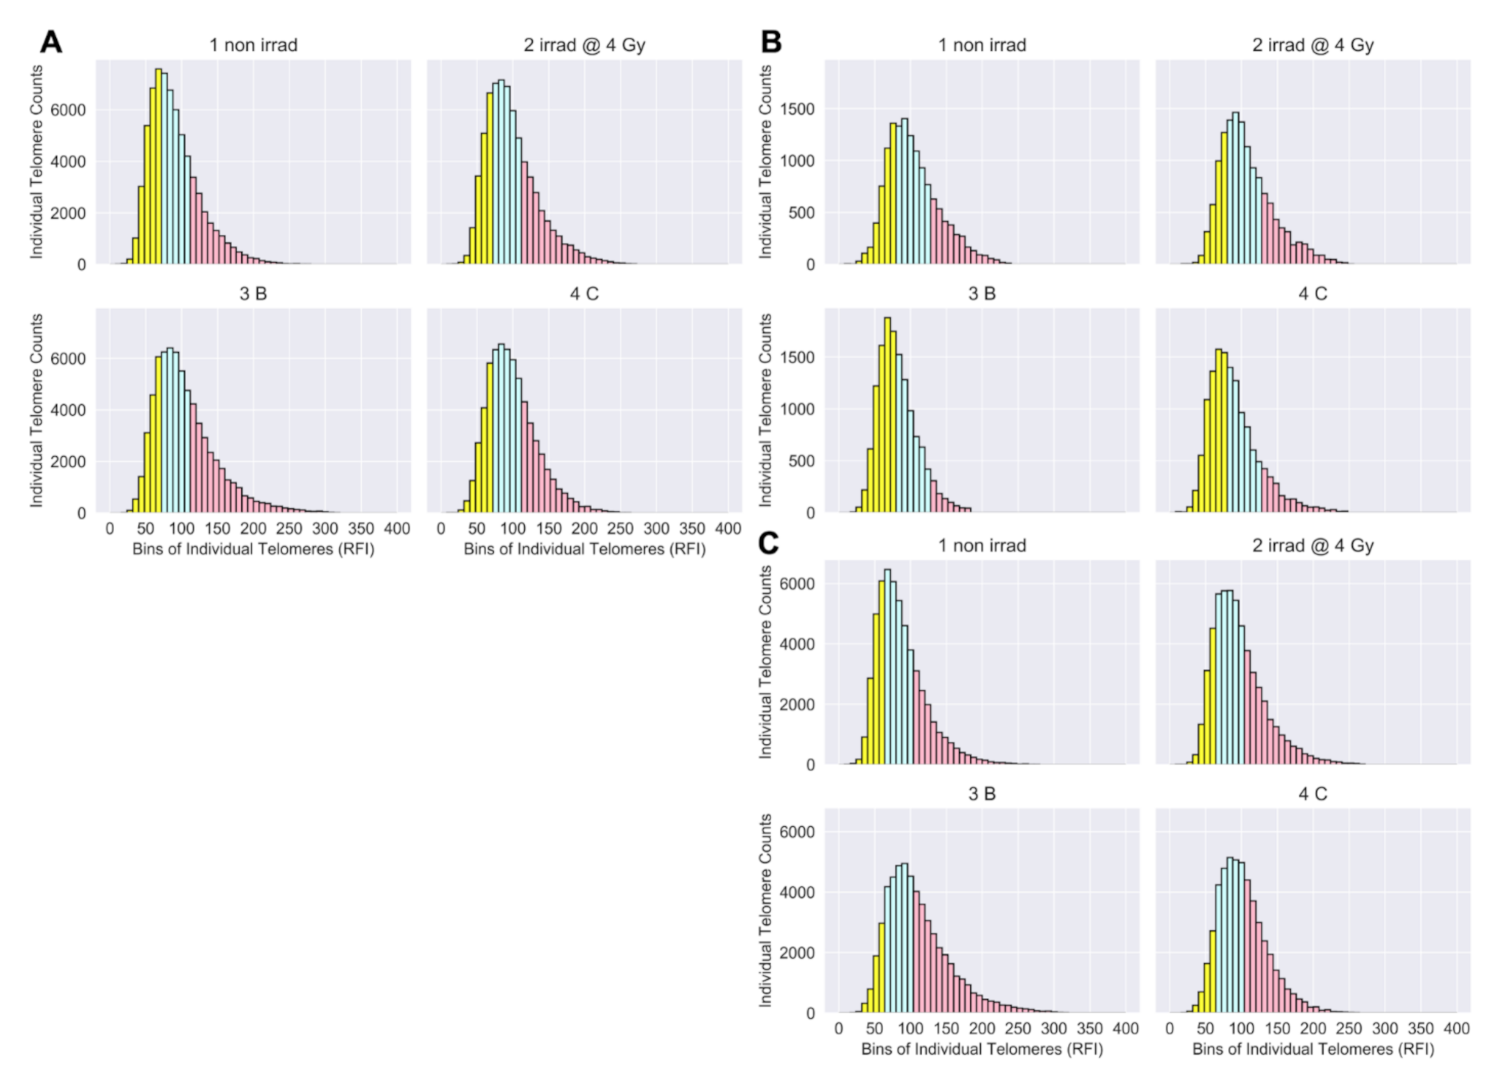
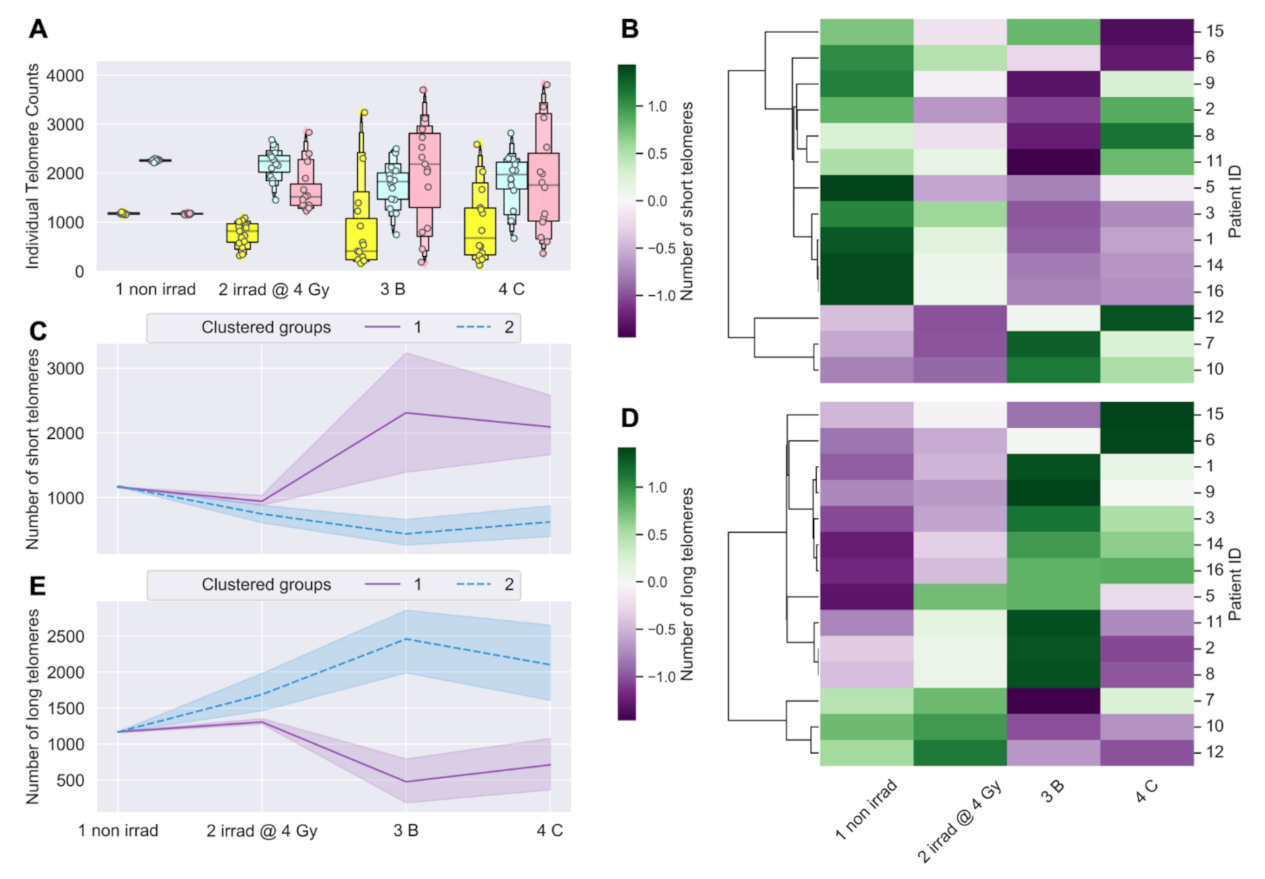
2.4. Telo-FISH Data Processing, Feature Engineering of Short and Long Telomeres
2.5. Statistical and Clustering Analyses of Telo-FISH Data
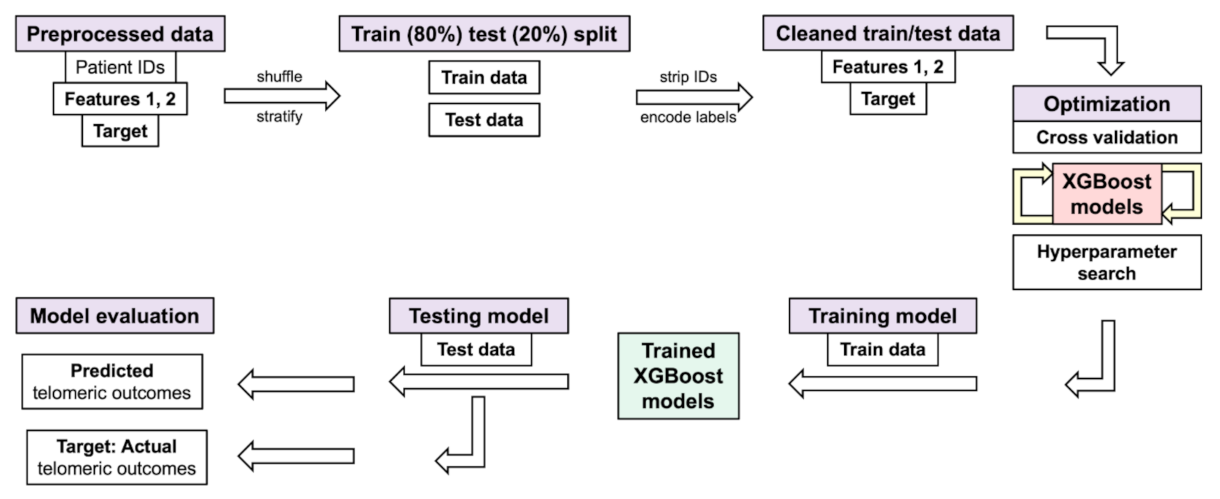
2.6. XGBoost Models with Individual Telomere Length Data, Randomized Hyperparameter Search, Cross Validation
2.7. Directional Genomic Hybridization (dGH), Image Acquisition, Data Processing
2.8. Statistical and Clustering Analyses of Chromosome Aberrations (dGH)
2.9. XGBoost Model Design with Chromosome Aberrations
3. Results
3.1. Longitudinal Analyses of Telomere Length Associated with Radiation Therapy
3.2. Telomere Length Dynamics Revealed Individual Differences in Radiation Response
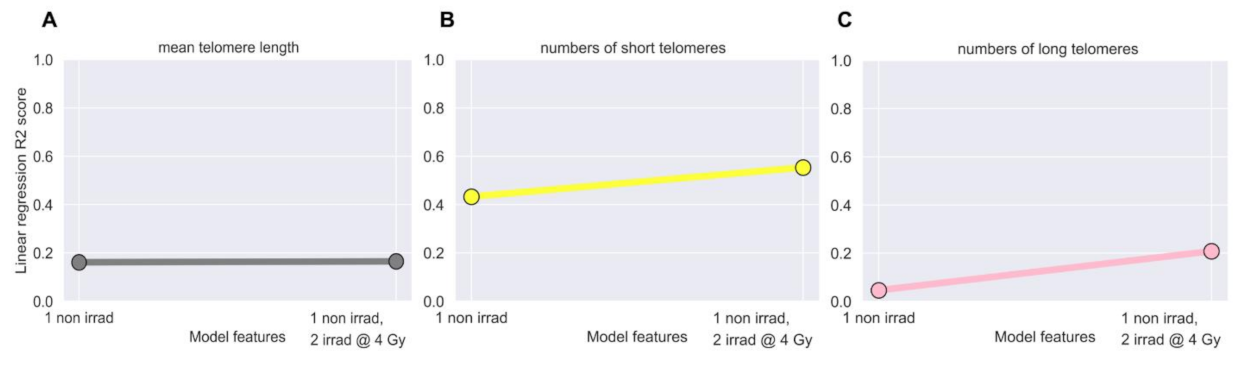
3.3. Linear Regression Failed to Predict Post-IMRT Telomeric Outcomes
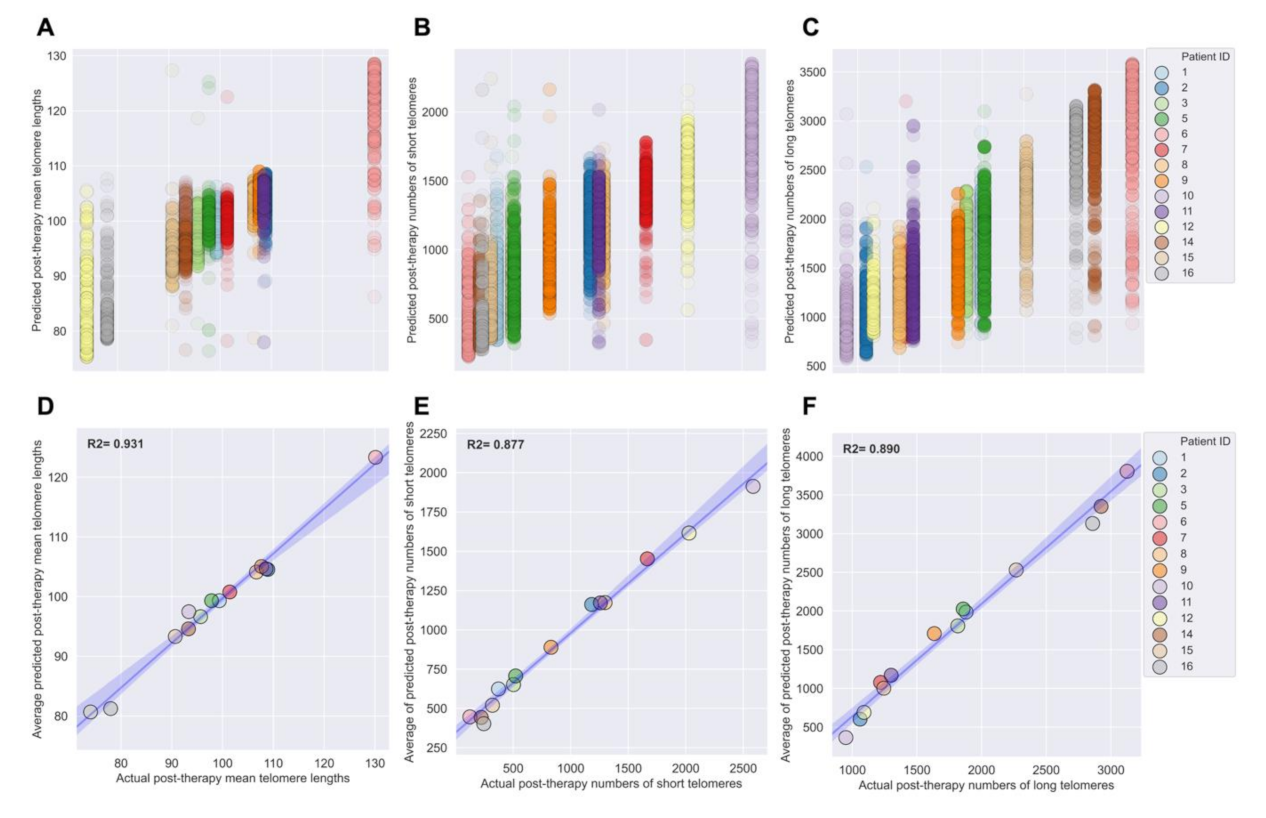
3.4. Development of XGBoost Machine Learning Models for Accurate Prediction of Post-IMRT Telomeric Outcomes
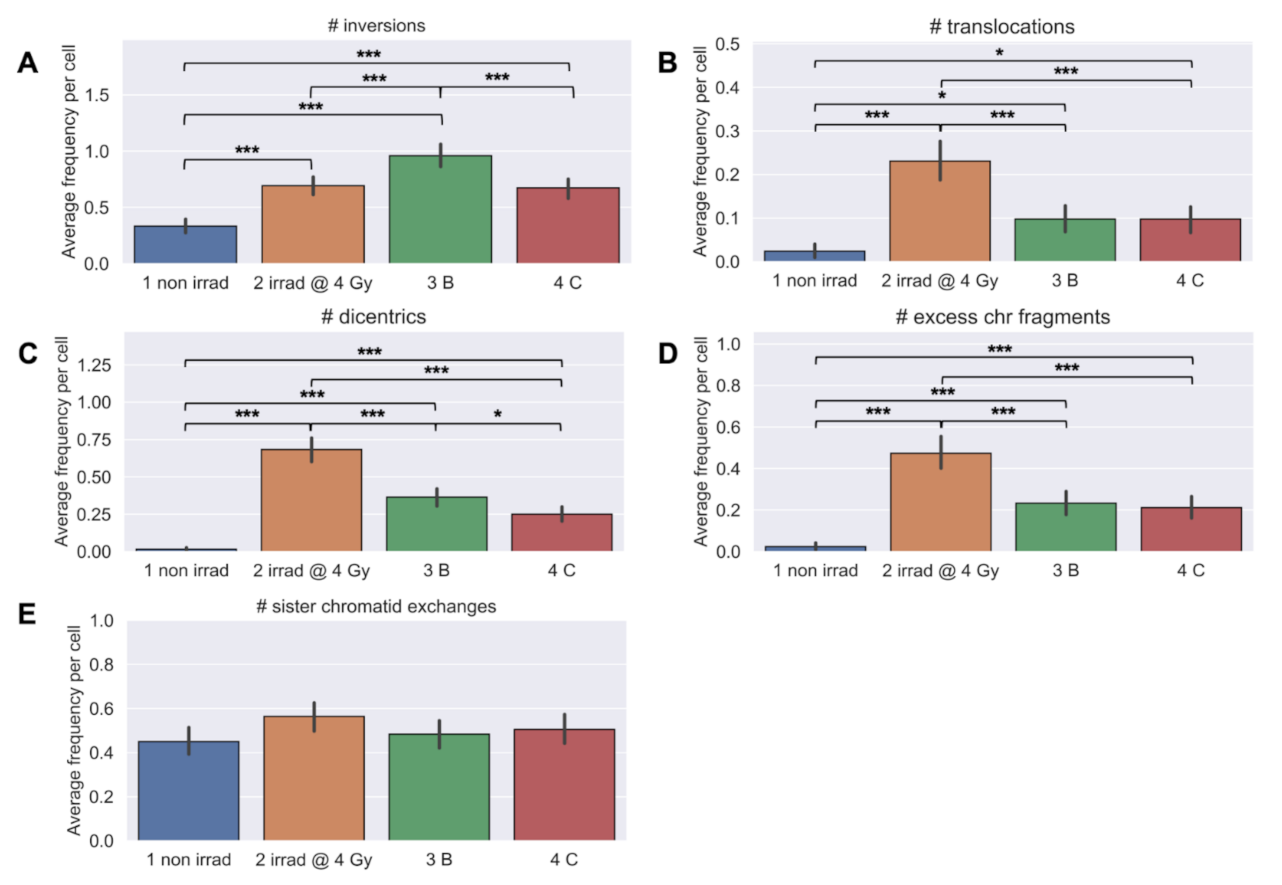
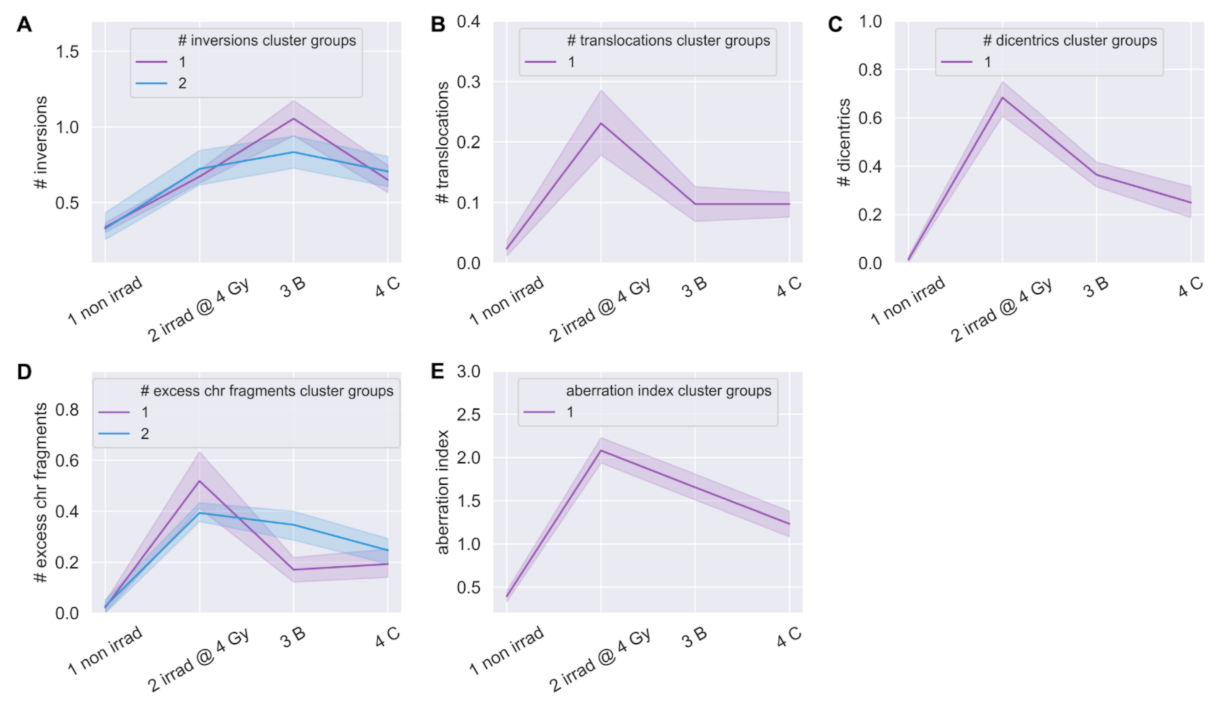
3.5. Longitudinal Analyses of Chromosomal Instability Associated with Radiation Therapy
3.6. Linear Regression Poorly Predicted Radiation-Induced Chromosomal Instability
3.7. XGBoost Machine Learning Models Poorly Predicted Radiation-Induced Chromosomal Instability
4. Discussion
Supplementary Materials
Author Contributions
Funding
Institutional Review Board Statement
Informed Consent Statement
Data Availability Statement
Conflicts of Interest
References
- Barnett, G.C.; West, C.M.L.; Dunning, A.M.; Elliott, R.M.; Coles, C.E.; Pharoah, P.D.P.; Burnet, N.G. Normal Tissue Reactions to Radiotherapy. Nat. Rev. Cancer 2009, 9, 134–142. [Google Scholar] [CrossRef] [Green Version]
- Bentzen, S.M. Preventing or Reducing Late Side Effects of Radiation Therapy: Radiobiology Meets Molecular Pathology. Nat. Rev. Cancer 2006, 6, 702–713. [Google Scholar] [CrossRef]
- Yusuf, S.W.; Venkatesulu, B.P.; Mahadevan, L.S.; Krishnan, S. Radiation-Induced Cardiovascular Disease: A Clinical Perspective. Front. Cardiovasc. Med. 2017, 4. [Google Scholar] [CrossRef] [Green Version]
- Carver, J.R.; Shapiro, C.L.; Ng, A.; Jacobs, L.; Schwartz, C.; Virgo, K.S.; Hagerty, K.L.; Somerfield, M.R.; Vaughn, D.J.; ASCO Cancer Survivorship Expert Panel. American Society of Clinical Oncology Clinical Evidence Review on the Ongoing Care of Adult Cancer Survivors: Cardiac and Pulmonary Late Effects. J. Clin. Oncol. 2007, 25, 3991–4008. [Google Scholar] [CrossRef] [Green Version]
- Greene-Schloesser, D.; Robbins, M.E. Radiation-Induced Cognitive Impairment-from Bench to Bedside. Neuro Oncol. 2012, 14, iv37–iv44. [Google Scholar] [CrossRef] [Green Version]
- Yaprak, G.; Gemici, C.; Temizkan, S.; Ozdemir, S.; Dogan, B.C.; Seseogullari, O.O. Osteoporosis Development and Vertebral Fractures after Abdominal Irradiation in Patients with Gastric Cancer. BMC Cancer 2018, 18, 972. [Google Scholar] [CrossRef]
- Suit, H.; Goldberg, S.; Niemierko, A.; Ancukiewicz, M.; Hall, E.; Goitein, M.; Wong, W.; Paganetti, H. Secondary Carcinogenesis in Patients Treated with Radiation: A Review of Data on Radiation-Induced Cancers in Human, Non-Human Primate, Canine and Rodent Subjects. Radiat. Res. 2007, 167, 12–42. [Google Scholar] [CrossRef]
- Armstrong, G.T.; Stovall, M.; Robison, L.L. Long-Term Effects of Radiation Exposure among Adult Survivors of Childhood Cancer: Results from the Childhood Cancer Survivor Study. Radiat. Res. 2010, 174, 840–850. [Google Scholar] [CrossRef] [Green Version]
- Rajaraman, P.; Hauptmann, M.; Bouffler, S.; Wojcik, A. Human Individual Radiation Sensitivity and Prospects for Prediction. Ann. ICRP 2018, 47, 126–141. [Google Scholar] [CrossRef]
- Habash, M.; Bohorquez, L.C.; Kyriakou, E.; Kron, T.; Martin, O.A.; Blyth, B.J. Clinical and Functional Assays of Radiosensitivity and Radiation-Induced Second Cancer. Cancers 2017, 9, 147. [Google Scholar] [CrossRef] [Green Version]
- Banáth, J.P.; MacPhail, S.H.; Olive, P.L. Radiation Sensitivity, H2AX Phosphorylation, and Kinetics of Repair of DNA Strand Breaks in Irradiated Cervical Cancer Cell Lines. Cancer Res. 2004, 64, 7144–7149. [Google Scholar] [CrossRef] [PubMed] [Green Version]
- Redon, C.E.; Dickey, J.S.; Bonner, W.M.; Sedelnikova, O.A. γ-H2AX as a Biomarker of DNA Damage Induced by Ionizing Radiation in Human Peripheral Blood Lymphocytes and Artificial Skin. Adv. Space Res. 2009, 43, 1171–1178. [Google Scholar] [CrossRef] [Green Version]
- Schmitz, A.; Bayer, J.; Dechamps, N.; Goldin, L.; Thomas, G. Heritability of Susceptibility to Ionizing Radiation-Induced Apoptosis of Human Lymphocyte Subpopulations. Int. J. Radiat. Oncol. Biol. Phys. 2007, 68, 1169–1177. [Google Scholar] [CrossRef] [Green Version]
- Baeyens, A.; Thierens, H.; Claes, K.; Poppe, B.; Messiaen, L.; De Ridder, L.; Vral, A. Chromosomal Radiosensitivity in Breast Cancer Patients with a Known or Putative Genetic Predisposition. Br. J. Cancer 2002, 87, 1379–1385. [Google Scholar] [CrossRef] [PubMed] [Green Version]
- Baria, K.; Warren, C.; Roberts, S.A.; West, C.M.; Scott, D. Chromosomal Radiosensitivity as a Marker of Predisposition to Common Cancers? Br. J. Cancer 2001, 84, 892–896. [Google Scholar] [CrossRef] [PubMed]
- Huber, R.; Braselmann, H.; Geinitz, H.; Jaehnert, I.; Baumgartner, A.; Thamm, R.; Figel, M.; Molls, M.; Zitzelsberger, H. Chromosomal Radiosensitivity and Acute Radiation Side Effects after Radiotherapy in Tumour Patients—A Follow-up Study. Radiat. Oncol. 2011, 6, 32. [Google Scholar] [CrossRef] [Green Version]
- Kerns, S.L.; Dorling, L.; Fachal, L.; Bentzen, S.; Pharoah, P.D.P.; Barnes, D.R.; Gómez-Caamaño, A.; Carballo, A.M.; Dearnaley, D.P.; Peleteiro, P.; et al. Meta-Analysis of Genome Wide Association Studies Identifies Genetic Markers of Late Toxicity Following Radiotherapy for Prostate Cancer. EBioMedicine 2016, 10, 150–163. [Google Scholar] [CrossRef] [Green Version]
- Kerns, S.L.; Ostrer, H.; Stock, R.; Li, W.; Moore, J.; Pearlman, A.; Campbell, C.; Shao, Y.; Stone, N.; Kusnetz, L.; et al. Genome-Wide Association Study to Identify Single Nucleotide Polymorphisms (SNPs) Associated with the Development of Erectile Dysfunction in African-American Men after Radiotherapy for Prostate Cancer. Int. J. Radiat. Oncol. Biol. Phys. 2010, 78, 1292–1300. [Google Scholar] [CrossRef]
- Young, A.; Berry, R.; Holloway, A.F.; Blackburn, N.B.; Dickinson, J.L.; Skala, M.; Phillips, J.L.; Brettingham-Moore, K.H. RNA-Seq Profiling of a Radiation Resistant and Radiation Sensitive Prostate Cancer Cell Line Highlights Opposing Regulation of DNA Repair and Targets for Radiosensitization. BMC Cancer 2014, 14. [Google Scholar] [CrossRef] [Green Version]
- Bodalal, Z.; Trebeschi, S.; Nguyen-Kim, T.D.L.; Schats, W.; Beets-Tan, R. Radiogenomics: Bridging Imaging and Genomics. Abdom. Radiol. 2019, 44, 1960–1984. [Google Scholar] [CrossRef] [Green Version]
- Mirjolet, C.; Boidot, R.; Saliques, S.; Ghiringhelli, F.; Maingon, P.; Créhange, G. The Role of Telomeres in Predicting Individual Radiosensitivity of Patients with Cancer in the Era of Personalized Radiotherapy. Cancer Treat. Rev. 2015, 41, 354–360. [Google Scholar] [CrossRef]
- De Lange, T. How Telomeres Solve the End-Protection Problem. Science 2009, 326, 948. [Google Scholar] [CrossRef] [Green Version]
- Moyzis, R.K.; Buckingham, J.M.; Cram, L.S.; Dani, M.; Deaven, L.L.; Jones, M.D.; Meyne, J.; Ratliff, R.L.; Wu, J.R. A Highly Conserved Repetitive DNA Sequence, (TTAGGG)n, Present at the Telomeres of Human Chromosomes. Proc. Natl. Acad. Sci. USA 1988, 85, 6622–6626. [Google Scholar] [CrossRef] [Green Version]
- Von Zglinicki, T. Role of Oxidative Stress in Telomere Length Regulation and Replicative Senescence. Ann. N. Y. Acad. Sci. 2000, 908, 99–110. [Google Scholar] [CrossRef]
- Aubert, G.; Lansdorp, P.M. Telomeres and Aging. Physiol. Rev. 2008, 88, 557–579. [Google Scholar] [CrossRef]
- Vidaček, N.Š.; Nanić, L.; Ravlić, S.; Sopta, M.; Gerić, M.; Gajski, G.; Garaj-Vrhovac, V.; Rubelj, I. Telomeres, Nutrition, and Longevity: Can We Really Navigate Our Aging? J. Gerontol. Ser. A 2017. [Google Scholar] [CrossRef] [Green Version]
- Arsenis, N.C.; You, T.; Ogawa, E.F.; Tinsley, G.M.; Zuo, L. Physical Activity and Telomere Length: Impact of Aging and Potential Mechanisms of Action. Oncotarget 2017, 8, 45008–45019. [Google Scholar] [CrossRef] [PubMed] [Green Version]
- Epel, E.S.; Blackburn, E.H.; Lin, J.; Dhabhar, F.S.; Adler, N.E.; Morrow, J.D.; Cawthon, R.M. Accelerated Telomere Shortening in Response to Life Stress. Proc. Natl. Acad. Sci. USA 2004, 101, 17312–17315. [Google Scholar] [CrossRef] [Green Version]
- Miri, M.; Nazarzadeh, M.; Alahabadi, A.; Ehrampoush, M.H.; Rad, A.; Lotfi, M.H.; Sheikhha, M.H.; Sakhvidi, M.J.Z.; Nawrot, T.S.; Dadvand, P. Air Pollution and Telomere Length in Adults: A Systematic Review and Meta-Analysis of Observational Studies. Environ. Pollut. 2019, 244, 636–647. [Google Scholar] [CrossRef]
- Stout, G.J.; Blasco, M.A. Telomere Length and Telomerase Activity Impact the UV Sensitivity Syndrome Xeroderma Pigmentosum C. Cancer Res. 2013, 73, 1844–1854. [Google Scholar] [CrossRef] [Green Version]
- Broer, L.; Codd, V.; Nyholt, D.R.; Deelen, J.; Mangino, M.; Willemsen, G.; Albrecht, E.; Amin, N.; Beekman, M.; De Geus, E.J.C.; et al. Meta-Analysis of Telomere Length in 19 713 Subjects Reveals High Heritability, Stronger Maternal Inheritance and a Paternal Age Effect. Eur. J. Hum. Genet. 2013, 21, 1163–1168. [Google Scholar] [CrossRef] [Green Version]
- Delgado, D.A.; Zhang, C.; Gleason, K.; Demanelis, K.; Chen, L.S.; Gao, J.; Roy, S.; Shinkle, J.; Sabarinathan, M.; Argos, M.; et al. The Contribution of Parent-to-Offspring Transmission of Telomeres to the Heritability of Telomere Length in Humans. Hum. Genet. 2019, 138, 49–60. [Google Scholar] [CrossRef] [PubMed]
- Honig, L.S.; Kang, M.S.; Cheng, R.; Eckfeldt, J.H.; Thyagarajan, B.; Leiendecker-Foster, C.; Province, M.A.; Sanders, J.L.; Perls, T.; Christensen, K.; et al. Heritability of Telomere Length in a Study of Long-Lived Families. Neurobiol. Aging 2015, 36, 2785–2790. [Google Scholar] [CrossRef] [PubMed] [Green Version]
- Weng, Q.; Du, J.; Yu, F.; Huang, T.; Chen, M.; Lv, H.; Ma, H.; Hu, Z.; Jin, G.; Hu, Y.; et al. The Known Genetic Loci for Telomere Length May Be Involved in the Modification of Telomeres Length after Birth. Sci. Rep. 2016, 6, 1–7. [Google Scholar] [CrossRef] [Green Version]
- Ayouaz, A.; Raynaud, C.; Heride, C.; Revaud, D.; Sabatier, L. Telomeres: Hallmarks of Radiosensitivity. Biochimie 2008, 90, 60–72. [Google Scholar] [CrossRef]
- Berardinelli, F.; Antoccia, A.; Buonsante, R.; Gerardi, S.; Cherubini, R.; Nadal, V.D.; Tanzarella, C.; Sgura, A. The Role of Telomere Length Modulation in Delayed Chromosome Instability Induced by Ionizing Radiation in Human Primary Fibroblasts. Environ. Mol. Mutagenesis 2013, 54, 172–179. [Google Scholar] [CrossRef]
- Maeda, T.; Nakamura, K.; Atsumi, K.; Hirakawa, M.; Ueda, Y.; Makino, N. Radiation-Associated Changes in the Length of Telomeres in Peripheral Leukocytes from Inpatients with Cancer. Int. J. Radiat. Biol. 2013, 89, 106–109. [Google Scholar] [CrossRef]
- Sgura, A.; Antoccia, A.; Berardinelli, F.; Cherubini, R.; Gerardi, S.; Zilio, C.; Tanzarella, C. Telomere Length in Mammalian Cells Exposed to Low- and High-LET Radiations. Radiat. Prot. Dosim. 2006, 122, 176–179. [Google Scholar] [CrossRef]
- Telomeres Mendelian Randomization Collaboration; Haycock, P.C.; Burgess, S.; Nounu, A.; Zheng, J.; Okoli, G.N.; Bowden, J.; Wade, K.H.; Timpson, N.J.; Evans, D.M.; et al. Association Between Telomere Length and Risk of Cancer and Non-Neoplastic Diseases: A Mendelian Randomization Study. JAMA Oncol. 2017, 3, 636–651. [Google Scholar] [CrossRef] [PubMed]
- Protsenko, E.; Rehkopf, D.; Prather, A.A.; Epel, E.; Lin, J. Are Long Telomeres Better than Short? Relative Contributions of Genetically Predicted Telomere Length to Neoplastic and Non-Neoplastic Disease Risk and Population Health Burden. PLoS ONE 2020, 15, e0240185. [Google Scholar] [CrossRef] [PubMed]
- Stone, R.C.; Horvath, K.; Kark, J.D.; Susser, E.; Tishkoff, S.A.; Aviv, A. Telomere Length and the Cancer–Atherosclerosis Trade-Off. PLoS Genet. 2016, 12, e1006144. [Google Scholar] [CrossRef]
- Armanios, M.; Blackburn, E.H. The Telomere Syndromes. Nat. Rev. Genet. 2012, 13, 693–704. [Google Scholar] [CrossRef]
- Martínez, P.; Blasco, M.A. Heart-Breaking Telomeres. Circ. Res. 2018, 123, 787–802. [Google Scholar] [CrossRef]
- Calado, R.T.; Cooper, J.N.; Padilla-Nash, H.M.; Sloand, E.M.; Wu, C.O.; Scheinberg, P.; Ried, T.; Young, N.S. Short Telomeres Result in Chromosomal Instability in Hematopoietic Cells and Precede Malignant Evolution in Human Aplastic Anemia. Leukemia 2012, 26, 700–707. [Google Scholar] [CrossRef] [Green Version]
- Adams, M.J.; Hardenbergh, P.H.; Constine, L.S.; Lipshultz, S.E. Radiation-Associated Cardiovascular Disease. Crit. Rev. Oncol. Hematol. 2003, 45, 55–75. [Google Scholar] [CrossRef]
- Green, D.E.; Rubin, C.T. Consequences of Irradiation on Bone and Marrow Phenotypes, and Its Relation to Disruption of Hematopoietic Precursors. Bone 2014, 0, 87–94. [Google Scholar] [CrossRef] [Green Version]
- Tsoutsou, P.G.; Koukourakis, M.I. Radiation Pneumonitis and Fibrosis: Mechanisms Underlying Its Pathogenesis and Implications for Future Research. Int. J. Radiation Oncol.* Biol.* Phys. 2006, 66, 1281–1293. [Google Scholar] [CrossRef]
- McNally, E.J.; Luncsford, P.J.; Armanios, M. Long Telomeres and Cancer Risk: The Price of Cellular Immortality. J. Clin. Investig. 2019, 129, 3474–3481. [Google Scholar] [CrossRef] [Green Version]
- Dracham, C.B.; Shankar, A.; Madan, R. Radiation Induced Secondary Malignancies: A Review Article. Radiat. Oncol. J. 2018, 36, 85–94. [Google Scholar] [CrossRef]
- Bains, S.K.; Chapman, K.; Bright, S.; Senan, A.; Kadhim, M.; Slijepcevic, P. Effects of Ionizing Radiation on Telomere Length and Telomerase Activity in Cultured Human Lens Epithelium Cells. Int. J. Radiat. Biol. 2019, 95, 54–63. [Google Scholar] [CrossRef] [Green Version]
- Berardinelli, F.; Sgura, A.; Di Masi, A.; Leone, S.; Cirrone, G.A.P.; Romano, F.; Tanzarella, C.; Antoccia, A. Radiation-Induced Telomere Length Variations in Normal and in Nijmegen Breakage Syndrome Cells. Int. J. Radiat. Biol. 2014, 90, 45–52. [Google Scholar] [CrossRef]
- De Vitis, M.; Berardinelli, F.; Coluzzi, E.; Marinaccio, J.; O’Sullivan, R.J.; Sgura, A. X-Rays Activate Telomeric Homologous Recombination Mediated Repair in Primary Cells. Cells 2019, 8, 708. [Google Scholar] [CrossRef] [Green Version]
- Alsner, J.; Rødningen, O.K.; Overgaard, J. Differential Gene Expression before and after Ionizing Radiation of Subcutaneous Fibroblasts Identifies Breast Cancer Patients Resistant to Radiation-Induced Fibrosis. Radiother. Oncol. 2007, 83, 261–266. [Google Scholar] [CrossRef]
- Andreassen, C.N.; Overgaard, J.; Alsner, J. Independent Prospective Validation of a Predictive Test for Risk of Radiation Induced Fibrosis Based on the Gene Expression Pattern in Fibroblasts Irradiated in Vitro. Radiother. Oncol. 2013, 108, 469–472. [Google Scholar] [CrossRef]
- Borgmann, K.; Hoeller, U.; Nowack, S.; Bernhard, M.; Röper, B.; Brackrock, S.; Petersen, C.; Szymczak, S.; Ziegler, A.; Feyer, P.; et al. Individual Radiosensitivity Measured with Lymphocytes May Predict the Risk of Acute Reaction after Radiotherapy. Int. J. Radiat. Oncol. Biol. Phys. 2008, 71, 256–264. [Google Scholar] [CrossRef]
- Paul, S.; Barker, C.A.; Turner, H.C.; McLane, A.; Wolden, S.L.; Amundson, S.A. Prediction of In Vivo Radiation Dose Status in Radiotherapy Patients Using Ex Vivo and In Vivo Gene Expression Signatures. Radiat. Res. 2011, 175, 257–265. [Google Scholar] [CrossRef] [PubMed] [Green Version]
- Huang, L.; Snyder, A.R.; Morgan, W.F. Radiation-Induced Genomic Instability and Its Implications for Radiation Carcinogenesis. Oncogene 2003, 22, 5848–5854. [Google Scholar] [CrossRef] [Green Version]
- Willis, N.A.; Rass, E.; Scully, R. Deciphering the Code of the Cancer Genome: Mechanisms of Chromosome Rearrangement. Trends Cancer 2015, 1, 217–230. [Google Scholar] [CrossRef] [PubMed] [Green Version]
- Ward, J.F. DNA Damage Produced by Ionizing Radiation in Mammalian Cells: Identities, Mechanisms of Formation, and Reparability. In Progress in Nucleic Acid Research and Molecular Biology; Cohn, W.E., Moldave, K., Eds.; Academic Press: Cambridge, MA, USA, 1988; Volume 35, pp. 95–125. [Google Scholar]
- Behjati, S.; Gundem, G.; Wedge, D.C.; Roberts, N.D.; Tarpey, P.S.; Cooke, S.L.; Van Loo, P.; Alexandrov, L.B.; Ramakrishna, M.; Davies, H.; et al. Mutational Signatures of Ionizing Radiation in Second Malignancies. Nat. Commun. 2016, 7. [Google Scholar] [CrossRef] [Green Version]
- Mosesso, P.; Cinelli, S. In Vitro Cytogenetic Assays: Chromosomal Aberrations and Micronucleus Tests. In Genotoxicity Assessment: Methods and Protocols; Dhawan, A., Bajpayee, M., Eds.; Methods in Molecular Biology; Springer: New York, NY, USA, 2019; pp. 79–104. ISBN 978-1-4939-9646-9. [Google Scholar]
- Ray, F.A.; Zimmerman, E.; Robinson, B.; Cornforth, M.N.; Bedford, J.S.; Goodwin, E.H.; Bailey, S.M. Directional Genomic Hybridization for Chromosomal Inversion Discovery and Detection. Chromosome Res. 2013, 21, 165–174. [Google Scholar] [CrossRef] [Green Version]
- Pella, A.; Cambria, R.; Riboldi, M.; Jereczek-Fossa, B.A.; Fodor, C.; Zerini, D.; Torshabi, A.E.; Cattani, F.; Garibaldi, C.; Pedroli, G.; et al. Use of Machine Learning Methods for Prediction of Acute Toxicity in Organs at Risk Following Prostate Radiotherapy. Med. Phys. 2011, 38, 2859–2867. [Google Scholar] [CrossRef] [PubMed]
- Fan, J.; Wang, J.; Chen, Z.; Hu, C.; Zhang, Z.; Hu, W. Automatic Treatment Planning Based on Three-Dimensional Dose Distribution Predicted from Deep Learning Technique. Med. Phys. 2019, 46, 370–381. [Google Scholar] [CrossRef]
- Lee, S.; Liang, X.; Woods, M.; Reiner, A.S.; Concannon, P.; Bernstein, L.; Lynch, C.F.; Boice, J.D.; Deasy, J.O.; Bernstein, J.L.; et al. Machine Learning on Genome-Wide Association Studies to Predict the Risk of Radiation-Associated Contralateral Breast Cancer in the WECARE Study. PLoS ONE 2020, 15, e0226157. [Google Scholar] [CrossRef]
- Chen, T.; Guestrin, C. XGBoost: A Scalable Tree Boosting System. In Proceedings of the 22nd ACM SIGKDD International Conference on Knowledge Discovery and Data Mining—KDD ’16, San Francisco, CA, USA, 13–17 August 2016; pp. 785–794. [Google Scholar] [CrossRef] [Green Version]
- Taninaga, J.; Nishiyama, Y.; Fujibayashi, K.; Gunji, T.; Sasabe, N.; Iijima, K.; Naito, T. Prediction of Future Gastric Cancer Risk Using a Machine Learning Algorithm and Comprehensive Medical Check-up Data: A Case-Control Study. Sci. Rep. 2019, 9, 1–9. [Google Scholar] [CrossRef] [Green Version]
- Yu, D.; Liu, Z.; Su, C.; Han, Y.; Duan, X.; Zhang, R.; Liu, X.; Yang, Y.; Xu, S. Copy Number Variation in Plasma as a Tool for Lung Cancer Prediction Using Extreme Gradient Boosting (XGBoost) Classifier. Thorac. Cancer 2020, 11, 95–102. [Google Scholar] [CrossRef]
- Wang, J.; Yang, P.; Zhao, Y.; Elhalawani, H.; Liu, R.; Zhu, H.; Mohamed, A.S.; Fuller, C.D.; Zhu, H. A Predictive Model of Radiation-Related Fibrosis Based on Radiomic Features of Magnetic Resonance Imaging. Int. J. Radiat. Oncol. Biol. Phys. 2019, 105, E599. [Google Scholar] [CrossRef]
- Poon, S.S.S.; Lansdorp, P.M. Quantitative Fluorescence In Situ Hybridization (Q-FISH). Curr. Protoc. Cell Biol. 2001, 12, 18.4.1–18.4.21. [Google Scholar] [CrossRef]
- Howe, B.; Umrigar, A.; Tsien, F. Chromosome Preparation From Cultured Cells. J. Vis. Exp. 2014. [Google Scholar] [CrossRef] [Green Version]
- Williams, E.S.; Bailey, S.M. Chromosome Orientation Fluorescence in Situ Hybridization (CO-FISH). Cold Spring Harb. Protoc. 2009, 2009, pdb.prot5269. [Google Scholar] [CrossRef]
- Schneider, C.A.; Rasband, W.S.; Eliceiri, K.W. NIH Image to ImageJ: 25 Years of Image Analysis. Nat. Methods 2012, 9, 671–675. [Google Scholar] [CrossRef]
- Wong, H.-P.; Slijepcevic, P. Telomere Length Measurement in Mouse Chromosomes by a Modified Q-FISH Method. CGR 2004, 105, 464–470. [Google Scholar] [CrossRef]
- Seabold, S.; Perktold, J. Statsmodels: Econometric and Statistical Modeling with Python. In Proceedings of the 9th Python in Science Conference, Austin, TX, USA, 9–15 July 2010; pp. 92–96. [Google Scholar]
- Virtanen, P.; Gommers, R.; Oliphant, T.E.; Haberland, M.; Reddy, T.; Cournapeau, D.; Burovski, E.; Peterson, P.; Weckesser, W.; Bright, J.; et al. SciPy 1.0: Fundamental Algorithms for Scientific Computing in Python. Nat. Methods 2020, 17, 261–272. [Google Scholar] [CrossRef] [Green Version]
- Pedregosa, F.; Varoquaux, G.; Gramfort, A.; Michel, V.; Thirion, B.; Grisel, O.; Blondel, M.; Müller, A.; Nothman, J.; Louppe, G.; et al. Scikit-Learn: Machine Learning in Python. arXiv 2018, arXiv:1201.0490. [Google Scholar]
- Garrett-Bakelman, F.E.; Darshi, M.; Green, S.J.; Gur, R.C.; Lin, L.; Macias, B.R.; McKenna, M.J.; Meydan, C.; Mishra, T.; Nasrini, J.; et al. The NASA Twins Study: A Multidimensional Analysis of a Year-Long Human Spaceflight. Science 2019, 364. [Google Scholar] [CrossRef]
- Luxton, J.J.; McKenna, M.J.; Lewis, A.; Taylor, L.E.; George, K.A.; Dixit, S.M.; Moniz, M.; Benegas, W.; Mackay, M.J.; Mozsary, C.; et al. Telomere Length Dynamics and DNA Damage Responses Associated with Long-Duration Spaceflight. Cell Rep. 2020, 33, 108457. [Google Scholar] [CrossRef]
- Bergstra, J.; Bengio, Y. Random Search for Hyper-Parameter Optimization. J. Mach. Learn. Res. 2012, 13, 281–305. [Google Scholar]
- Stone, M. Cross-Validatory Choice and Assessment of Statistical Predictions. J. R. Stat. Soc. Ser. B (Methodol.) 1974, 36, 111–133. [Google Scholar] [CrossRef]
- Cornforth, M.N.; Anur, P.; Wang, N.; Robinson, E.; Ray, F.A.; Bedford, J.S.; Loucas, B.D.; Williams, E.S.; Peto, M.; Spellman, P.; et al. Molecular Cytogenetics Guides Massively Parallel Sequencing of a Radiation-Induced Chromosome Translocation in Human Cells. Radiat. Res. 2018, 190, 88–97. [Google Scholar] [CrossRef]
- Littlefield, L.G.; Colyer, S.P.; Joiner, E.E.; DuFrain, R.J. Sister Chromatid Exchanges in Human Lymphocytes Exposed to Ionizing Radiation during G0. Radiat. Res. 1979, 78, 514–521. [Google Scholar] [CrossRef]
- Morgan, W.F.; Crossen, P.E. X Irradiation and Sister Chromatid Exchange in Cultured Human Lymphocytes. Environ. Mutagen. 1980, 2, 149–155. [Google Scholar] [CrossRef]
- Ballarini, F.; Altieri, S.; Bortolussi, S.; Carante, M.; Giroletti, E.; Protti, N. The Role of DNA Cluster Damage and Chromosome Aberrations in Radiation-Induced Cell Killing: A Theoretical Approach. Radiat. Prot. Dosim. 2015, 166, 75–79. [Google Scholar] [CrossRef] [PubMed]
- Carrano, A.V. Chromosome Aberrations and Radiation-Induced Cell Death: II. Predicted and Observed Cell Survival. Mutat. Res./Fundam. Mol. Mech. Mutagen. 1973, 17, 355–366. [Google Scholar] [CrossRef]


Publisher’s Note: MDPI stays neutral with regard to jurisdictional claims in published maps and institutional affiliations. |
© 2021 by the authors. Licensee MDPI, Basel, Switzerland. This article is an open access article distributed under the terms and conditions of the Creative Commons Attribution (CC BY) license (http://creativecommons.org/licenses/by/4.0/).
Share and Cite
Luxton, J.J.; McKenna, M.J.; Lewis, A.M.; Taylor, L.E.; Jhavar, S.G.; Swanson, G.P.; Bailey, S.M. Telomere Length Dynamics and Chromosomal Instability for Predicting Individual Radiosensitivity and Risk via Machine Learning. J. Pers. Med. 2021, 11, 188. https://doi.org/10.3390/jpm11030188
Luxton JJ, McKenna MJ, Lewis AM, Taylor LE, Jhavar SG, Swanson GP, Bailey SM. Telomere Length Dynamics and Chromosomal Instability for Predicting Individual Radiosensitivity and Risk via Machine Learning. Journal of Personalized Medicine. 2021; 11(3):188. https://doi.org/10.3390/jpm11030188
Chicago/Turabian StyleLuxton, Jared J., Miles J. McKenna, Aidan M. Lewis, Lynn E. Taylor, Sameer G. Jhavar, Gregory P. Swanson, and Susan M. Bailey. 2021. "Telomere Length Dynamics and Chromosomal Instability for Predicting Individual Radiosensitivity and Risk via Machine Learning" Journal of Personalized Medicine 11, no. 3: 188. https://doi.org/10.3390/jpm11030188