Article

Farmed Salmon Show No Pathological Alterations When Exposed to Acoustic Treatment for Sea Lice Infestation

1
Laboratory of Applied Bioacoustics, Technical University of Catalonia-Barcelona TECH, 08800 Barcelona, Spain
2
Fish Diseases Diagnostic Service, Veterinary School, Universitat Autònoma de Barcelona, 08193 Barcelona, Spain
3
Institut de Ciències del Mar, Spanish National Research Council (CSIC), 08003 Barcelona, Spain
*
Authors to whom correspondence should be addressed.
J. Mar. Sci. Eng. 2021, 9(10), 1114; https://doi.org/10.3390/jmse9101114
Submission received: 21 September 2021 / Revised: 8 October 2021 / Accepted: 11 October 2021 / Published: 14 October 2021
(This article belongs to the Special Issue Ocean Noise: From Science to Management)

Abstract

:
The use of bioacoustic methods to address sea lice infestation in salmonid farming is a promising innovative method but implies an exposure to sound that could affect the fish. An assessment of the effects of these techniques related to the salmon’s welfare is presented here. The fish were repeatedly exposed to 350 Hz and 500 Hz tones in three- to four-hour exposure sessions, reaching received sound pressure levels of 140 to 150 dB re 1 µPa2, with the goal of reaching total sound exposure levels above 190 dB re 1 µPa2 s. Gross pathology and histopathological analysis performed on exposed salmons’ organs did not reveal any lesions that could be associated to sound exposure. The analysis of their otoliths through electron microscopy imaging confirmed that the sound dose that was used to impair the lice had no effects on the fish auditory organs.

1. Introduction

Sea lice infection is still one of the most devastating diseases in the salmon industry [1] and many different methodologies and strategies to prevent or reduce the impact of the disease have been developed [2]. The efficiency of these strategies in the field has been shown to be variable due to different environmental and husbandry factors but, together with these treatments, salmon welfare in response to the use of certain preventive and delousing methods has become more relevant. This is the reason why nowadays the implementation of these strategies must be based on good efficacy scores but also well-balanced safety procedures. Recent findings on the use of acoustic treatments have demonstrated the potential of this approach to address lice infestation [3] but, together with these very encouraging results, it was also necessary to conduct studies to ensure that the risk to the acoustically treated salmon was negligible.
Fishes are indeed able to detect and respond to a wide range of sounds. Experimental studies can investigate the range of frequencies that a fish could detect, and then determine the lowest levels of the detected sound at each frequency (the ‘threshold’, or lowest signal that an animal will detect in some statistically determined percentage of signal presentations—most often 50%). However, for most commercial species there is no audiogram available in the literature to assess their sensitivity to noise. Salmo salar audiograms based on mean (±SE) minimum received levels (dB re 1 μPa) that elicited a characteristic auditory evoked potential (electrical response that is produced anytime a sound is perceived and that can be recorded out of the brain from electrodes) revealed that salmon are most sensitive to 200 Hz frequency sounds [4].
As most fish can hear sounds, a series of published experiments and studies have looked at the effects of intense sound sources on the otolith organ that is responsible for sound reception. Nine months of exposure to broadband noise in an aquaculture facility did not induce hearing loss in two species of fish (Nile tilapia, Oreochromis niloticus and bluegill sunfish, Lepomis macrochirus) [5]. Other studies showed that salmonids did not trigger temporary threshold shifts (equivalent to a temporary acoustic trauma), whereas northern pike (Esox lucius) and sandbar shark (Carcharhinus plumbeus) suffered from hearing loss that recovered within 24 h after exposure [6,7]. Several animals examined after a post-exposure period up to 52 days showed 2–7% sensory cell loss after sound exposure [8]. Other studies analysed the relationship between auditory hair cell damage and hearing loss [9,10].
Experimental studies have examined the effects of pile driving and airguns on fish. Although the associated source levels did not lead to mortality in any of the exposed animals, and despite no effects being found on external and internal anatomy or damage on sensory hair cells of the otolith organs [11,12], more recent studies suggest that damage to the sensory hairs of fish inner ear tissues are likely to occur at levels considerably higher than those inducing other physiological effects, such as swim bladder ruptures [13].
Teleost fishes present an inner ear that contains three calcareous structures (otoliths), overlaying the sensory epithelia that enable their capacity for hearing and balance. The sagitta, the largest otholith, is usually composed of calcium carbonate crystals in the form of aragonite. A deformity, extremely common in farmed fish, where the aragonite is replaced by vaterite (a clearer crystallised form of the calcium carbonate), heavily affects the farmed salmon [14].
Some studies looked at the effects of anthropogenic sounds on the fish behaviour, sowing minor behavioural and startle responses of fish maintained in cages at the start of the air-gun exposure, responses which appeared to decline at subsequent air-gun emissions, but this sound level did not appear to elicit a decline in catch [15,16,17,18]. In addition there were no permanent changes in the behaviour of the fish or invertebrates throughout the course of the studies, and animals did not appear to leave the exposed area [16]. Contrary to these findings, more recent studies reported alarm responses, flight reactions, aggressive behaviours, changes in antipredator defence behaviour and reproduction related behaviour (courtship vocal activity, spawning), alterations on schooling behaviour [19] and, in some cases, effects in larval development in addition to these behavioural changes [20].
Fish physiological responses to noise exposure, like stress, were also measured. Complementary to other health indicators, corticosteroid levels are considered a measure of stress. Several studies that looked at stress levels in different fish species concluded they were not influenced by noise exposure [5,21]. Nevertheless, it is fair to mention that these experimental approaches were undertaken in cages where fish could not avoid the exposed areas, making it difficult to definitively conclude on the short- and long-term physiological impact of noise exposure [22].
In the context of a project that aimed at addressing the problem of sea lice Lepeophtheirus salmonis infestation on salmon (Salmo salar) by using acoustic and bioacoustic techniques (SEASEL SOLUTIONS AS. Project: An acoustic and bioacoustic solution to sea lice infestation on salmon- P.O.BOX 93 N-6282 BRATTVÅG. Norway, [3]) and given the inconclusive results of previous studies, an evaluation of the possible effects on salmon after sound exposure was necessary. Here, we proceeded with a series of controlled exposure experiments to determine the salmon sensitivity to the sounds that would be used in our method against lice infestation, under laboratory and field conditions. Given the industrial nature of this project, this assessment was absolutely necessary in order to ensure that the risk for the commercial caged salmon was negligible and would not result in an economic burden for the companies using the method.

2. Methods

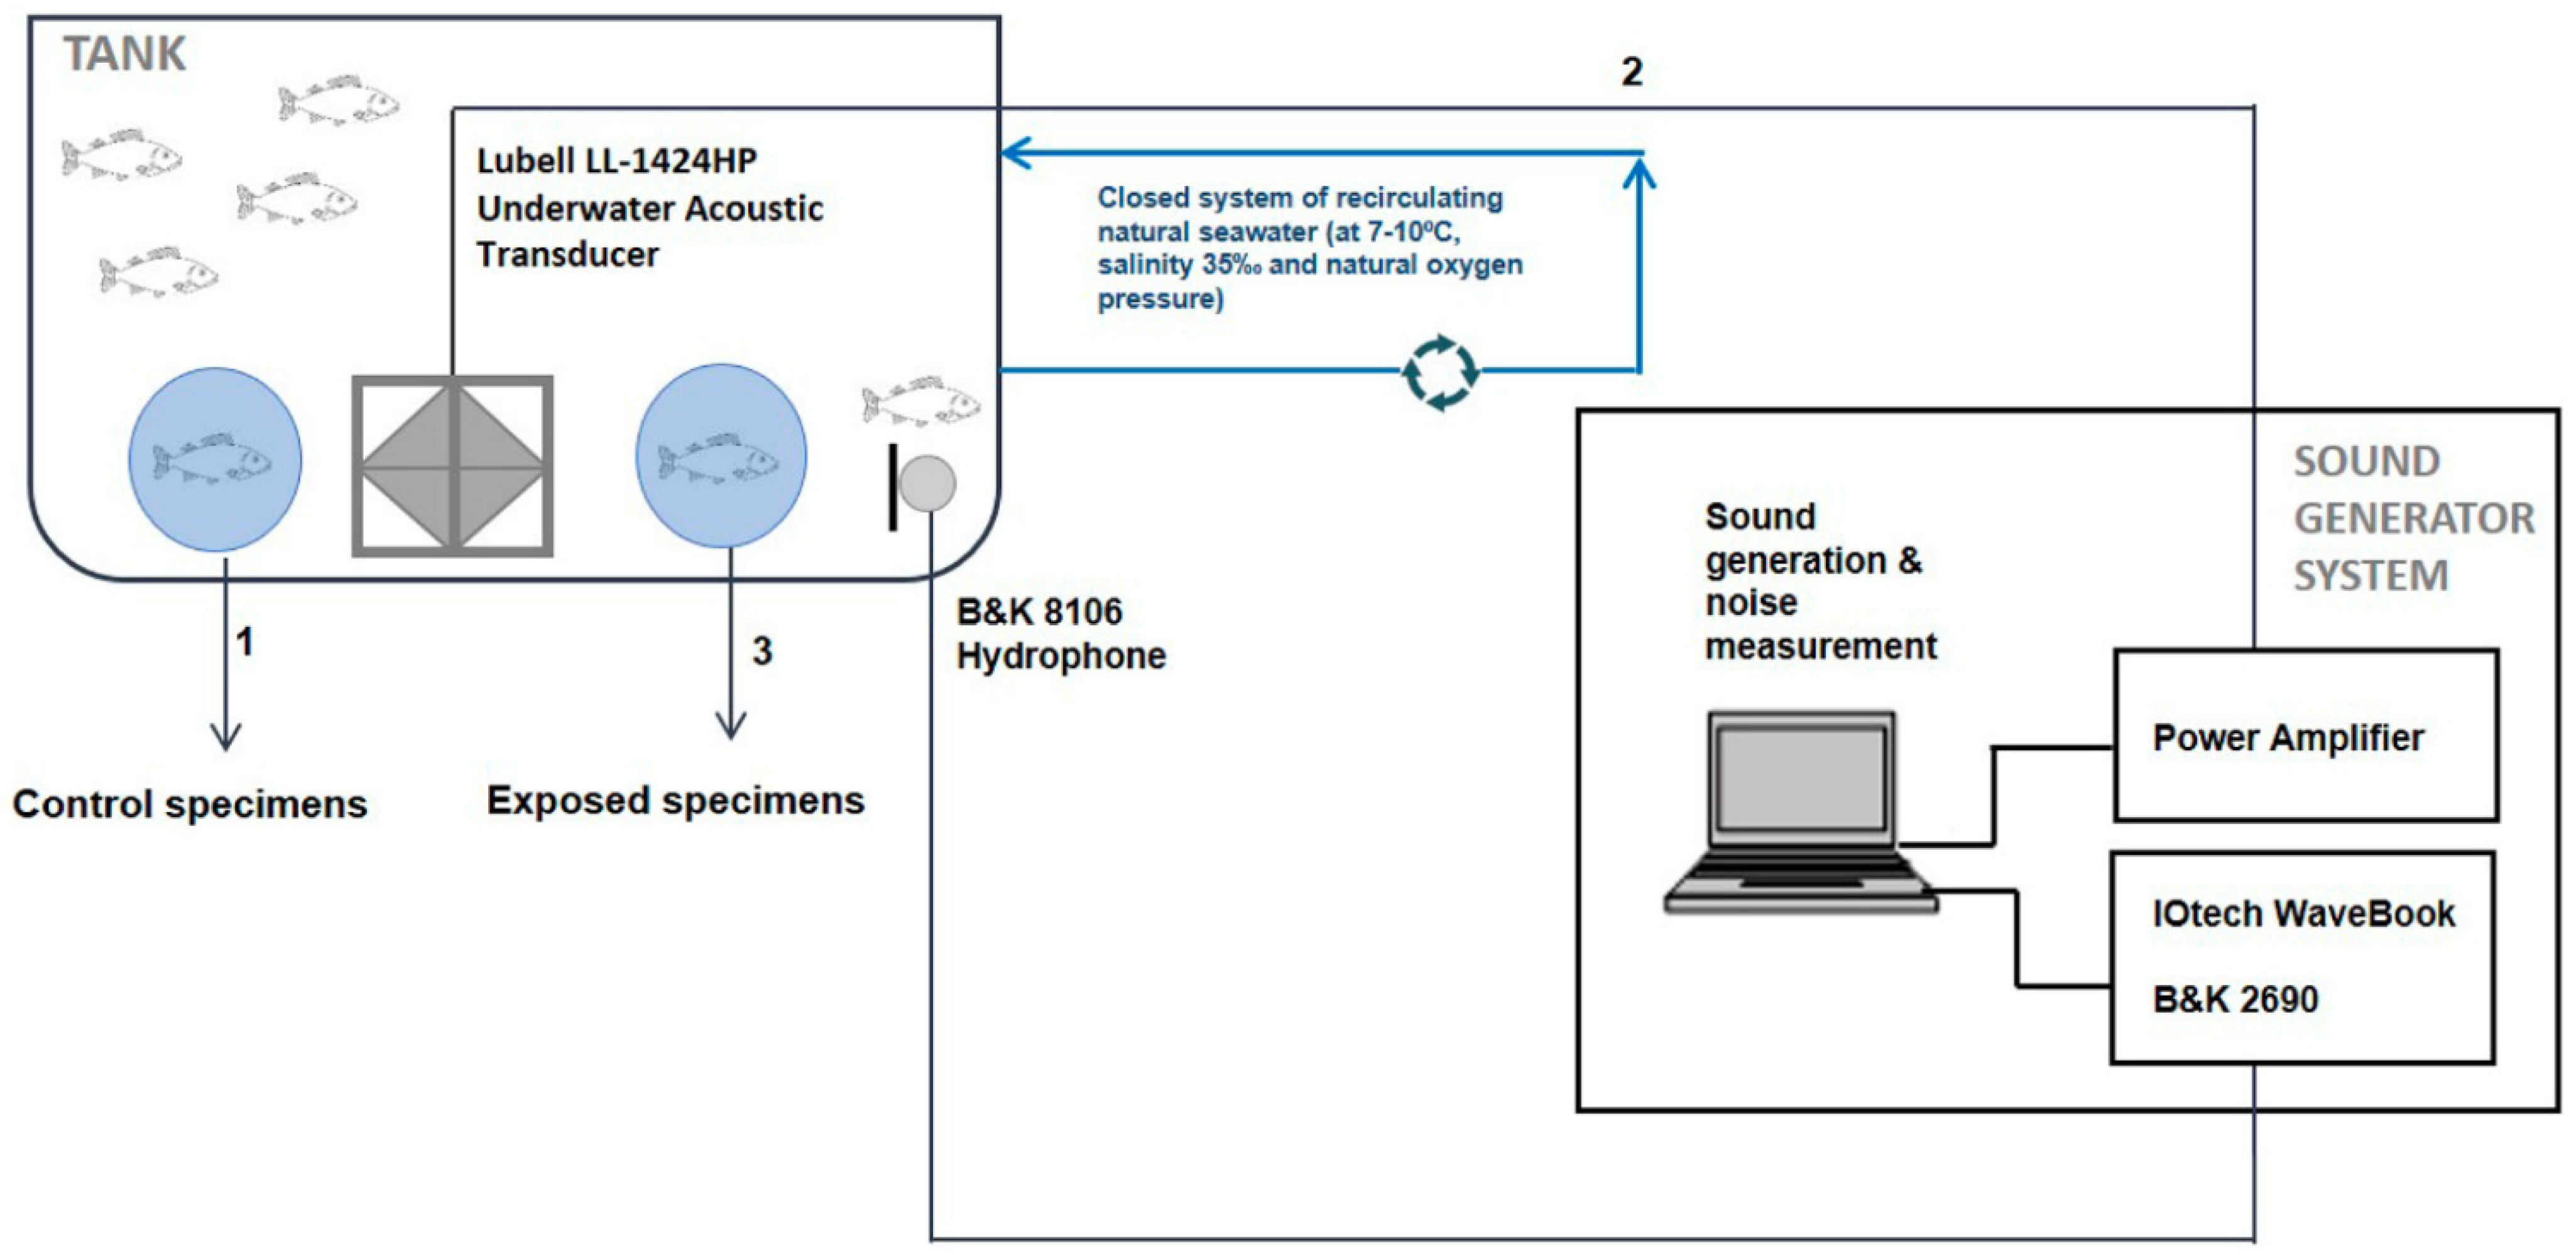
2.1. Laboratory Experiments

After determining the effective combination of sound parameters (frequency, time of exposure and amplitude) on the sea lice L. salmonis through controlled exposure experiments (CEE) [3], we repeated these experiments on salmon in the same configuration and assessed the potential alterations and lesions that the method could induce with respect to behavioural levels, the vestibular system, the lateral line and also in the fish organs after sound exposure.

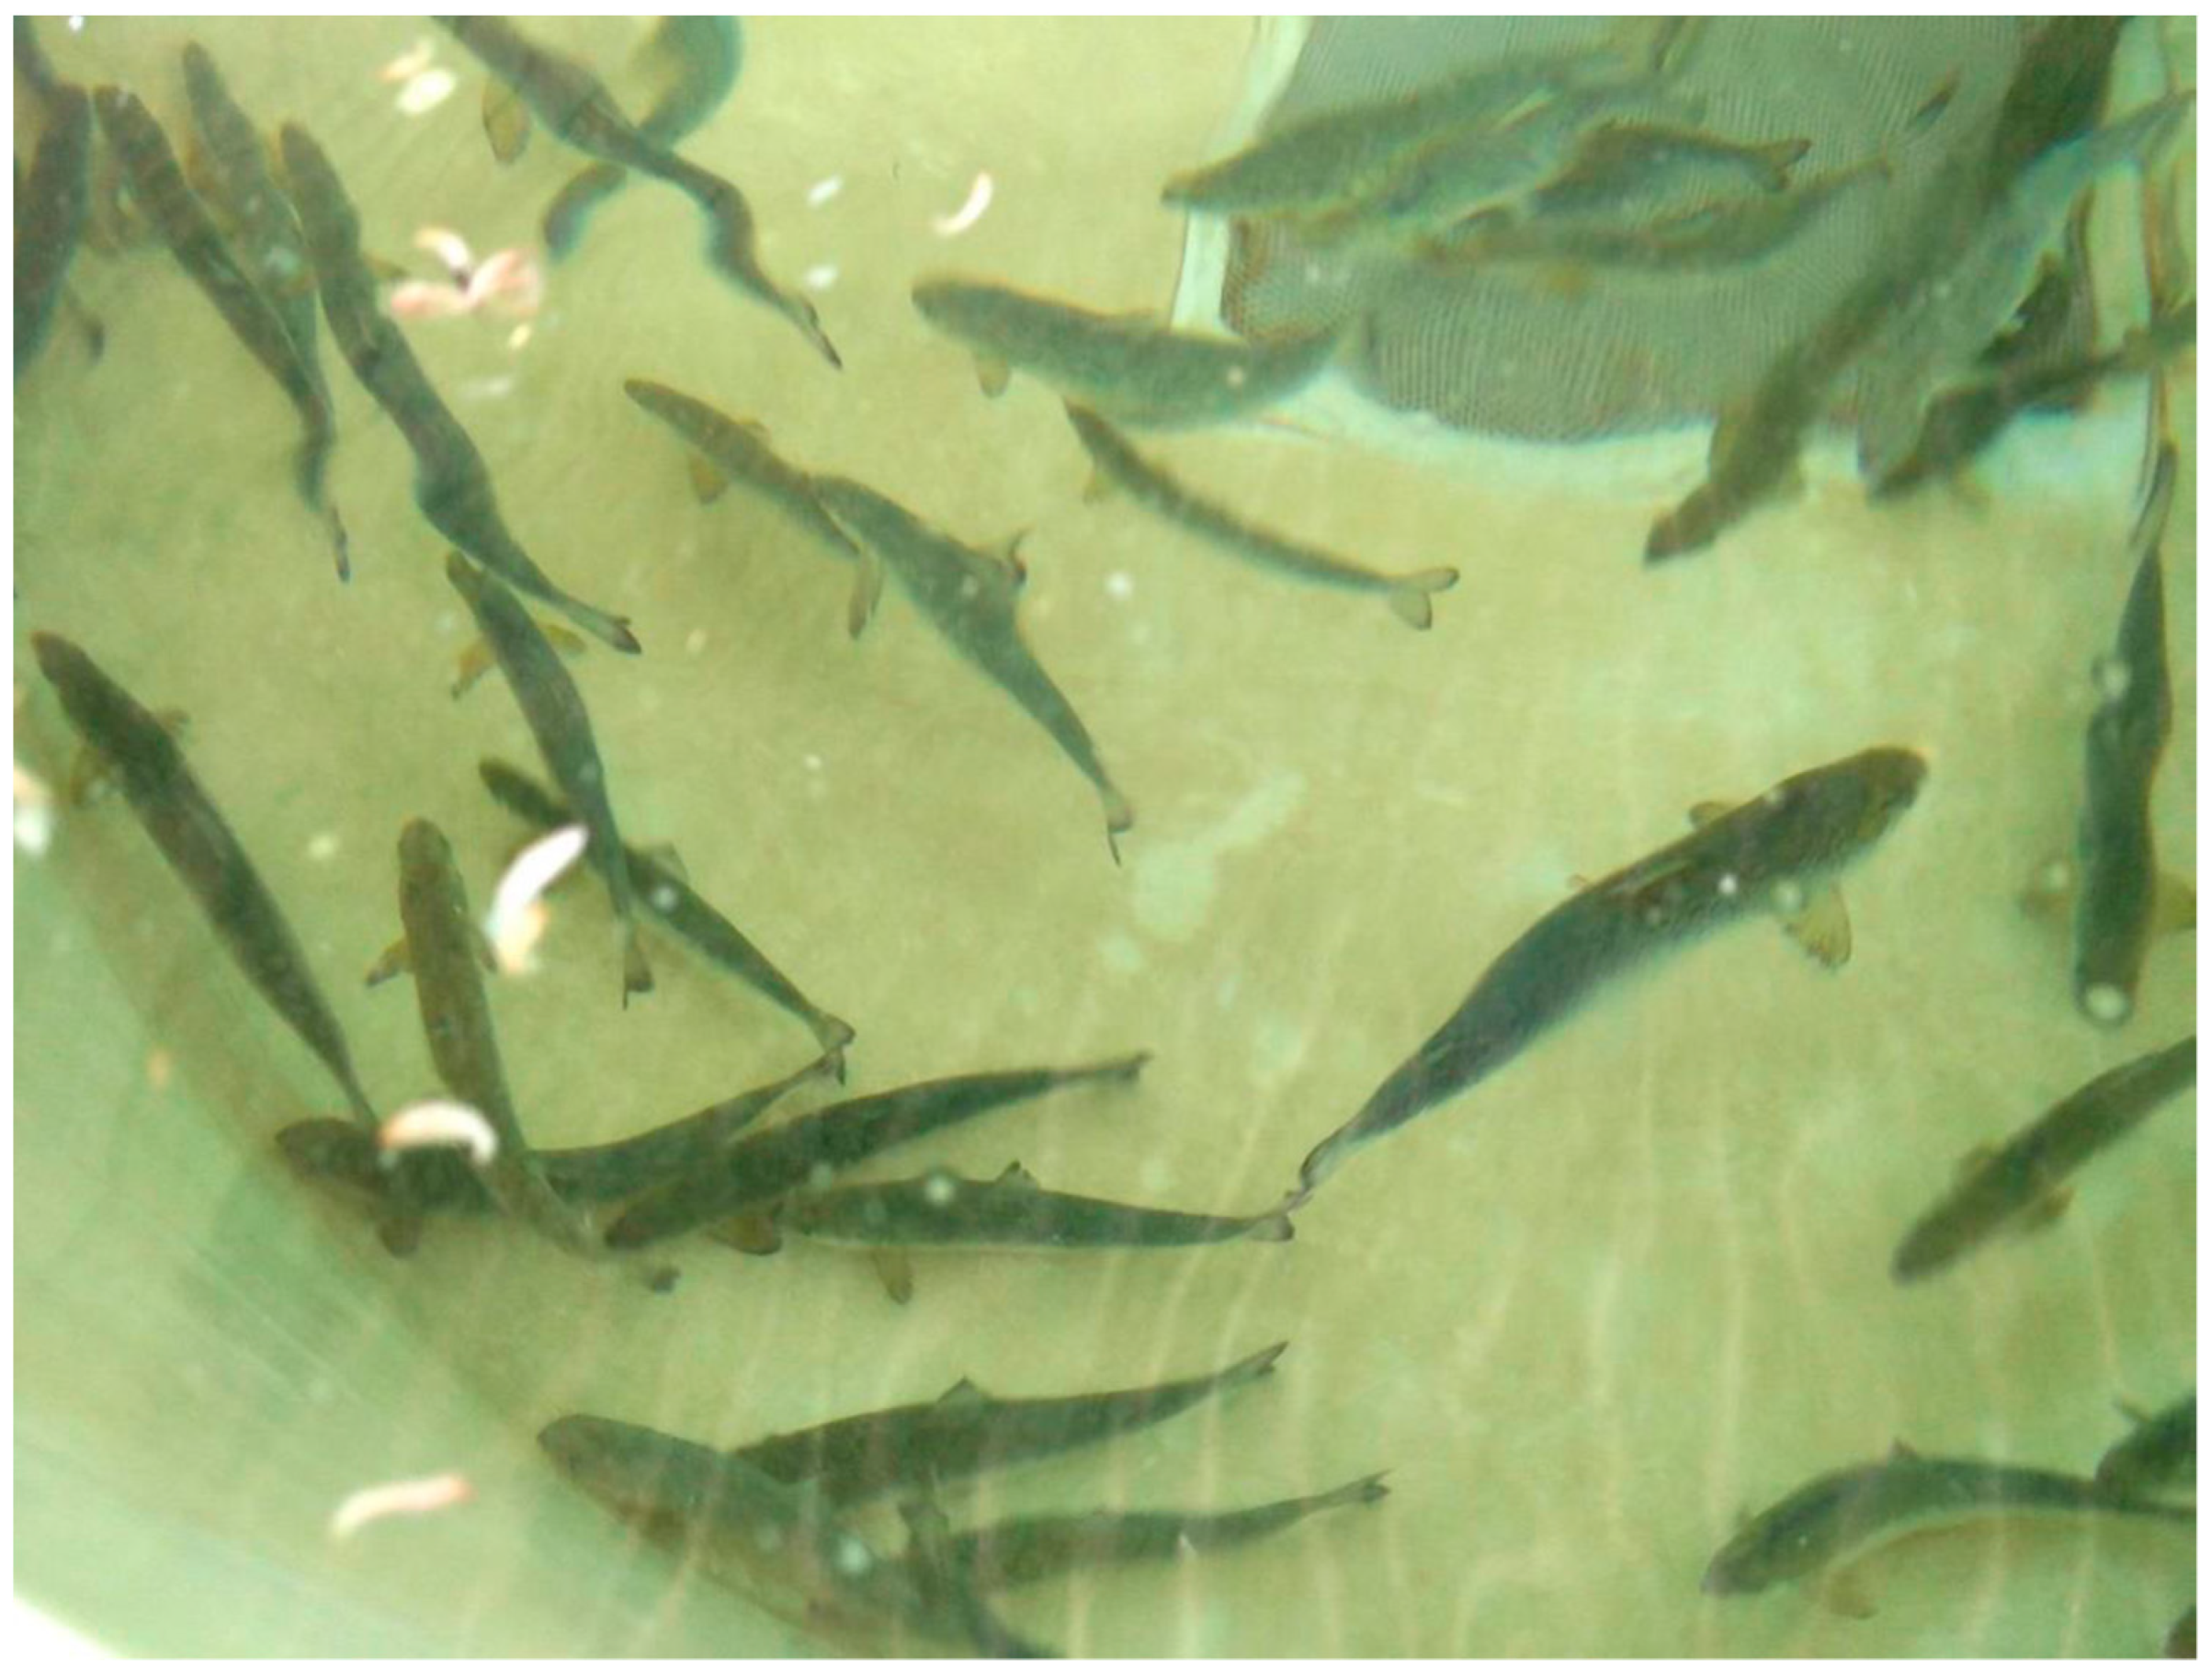
2.1.1. Salmon Specimens Maintenance and Health Assessment

A set of salmon (S. salar) (n = 50; weight 204.6 ± 25.5 g; total length 26.6 ± 2.5 cm), was received and kept in continuous observation at the LAB infrastructure in a closed system of recirculating natural seawater (at 7–10 °C, salinity 35‰ and natural oxygenation) consisting of two mechanically filtered (physicochemical self-filtration system with activated carbon and sand, driven by a circulation pump and refrigeration system) fiberglass-reinforced plastic tanks with a capacity of 2000 L each and connected to each other (Figure S1, Supplemental Material). The fish stock was then progressively acclimatised to the test conditions for two weeks. Fish were regularly fed ad libitum with commercial food and feeding rates were also monitored. After these two weeks, 10 fish were sampled in order to proceed with a complete histopathological examination to guarantee an adequate health status for the test. These fish were taken as controls and sampled and processed in the same way as fish exposed to sound (Figure 1).

2.1.2. Sound Controlled Exposure Experiment (CEE) Protocol

A set of 40 salmon were exposed daily to sounds during 4 weeks (Figure 1). The CEE protocol consisted of a cycle of 350 Hz (65 V-2 h) and 500 Hz (65 V-2 h) exposure, twice daily with a 2 h period of rest in between the two cycles, during the first three weeks (see [3] for the description of the selection of these sound exposure levels in concurrence with the sea lice exposure experiments). In the last week of the experiments we added another cycle of exposure (i.e., three times 4 h exposure a day) to increase the sound dose received by the fish.
The transducer used was the Lubell LL-1424HP with the capacity to reach levels of at least 180 dB re 1 µPa at the frequencies of interest, although it was driven at 65 vrms, well below its maximum rating. The transducer was driven by a Monacor PA-12040. The sound production system was calibrated as a whole and for each individual frequency. A calibrated hydrophone (B&K 8106 with Nexus signal conditioner and IOtech WaveBook/516 ADC) was used to make spot measurements in the exposure and control tanks to verify the levels and then further used to monitor the exposure experiments. The hydrophone system was arranged to provide its digitized data to a sound exposure control system that was driving the transducer.
The received sound pressure levels were estimated to be 152 dB re 1 µPa2 at 350 Hz and 155 dB re 1 µPa2 at 500 Hz. With the animals moving around the tank the levels would vary. The exposure target was to reach a sound exposure level dose of at least 190 dB re 1 µPa2 s. The estimated SEL for the frequency and duration combination used above was 195 dB re 1 µPa2 s.

2.1.3. Sample Collection

Ten exposed salmon were euthanised by bath immersion in 2-phenoxyethanol (2-PE) each week during 4 weeks. All salmon (both control and exposed individuals) were equally treated: samples from otoliths, inner ear and internal organs were processed for histopathological and SEM analysis.

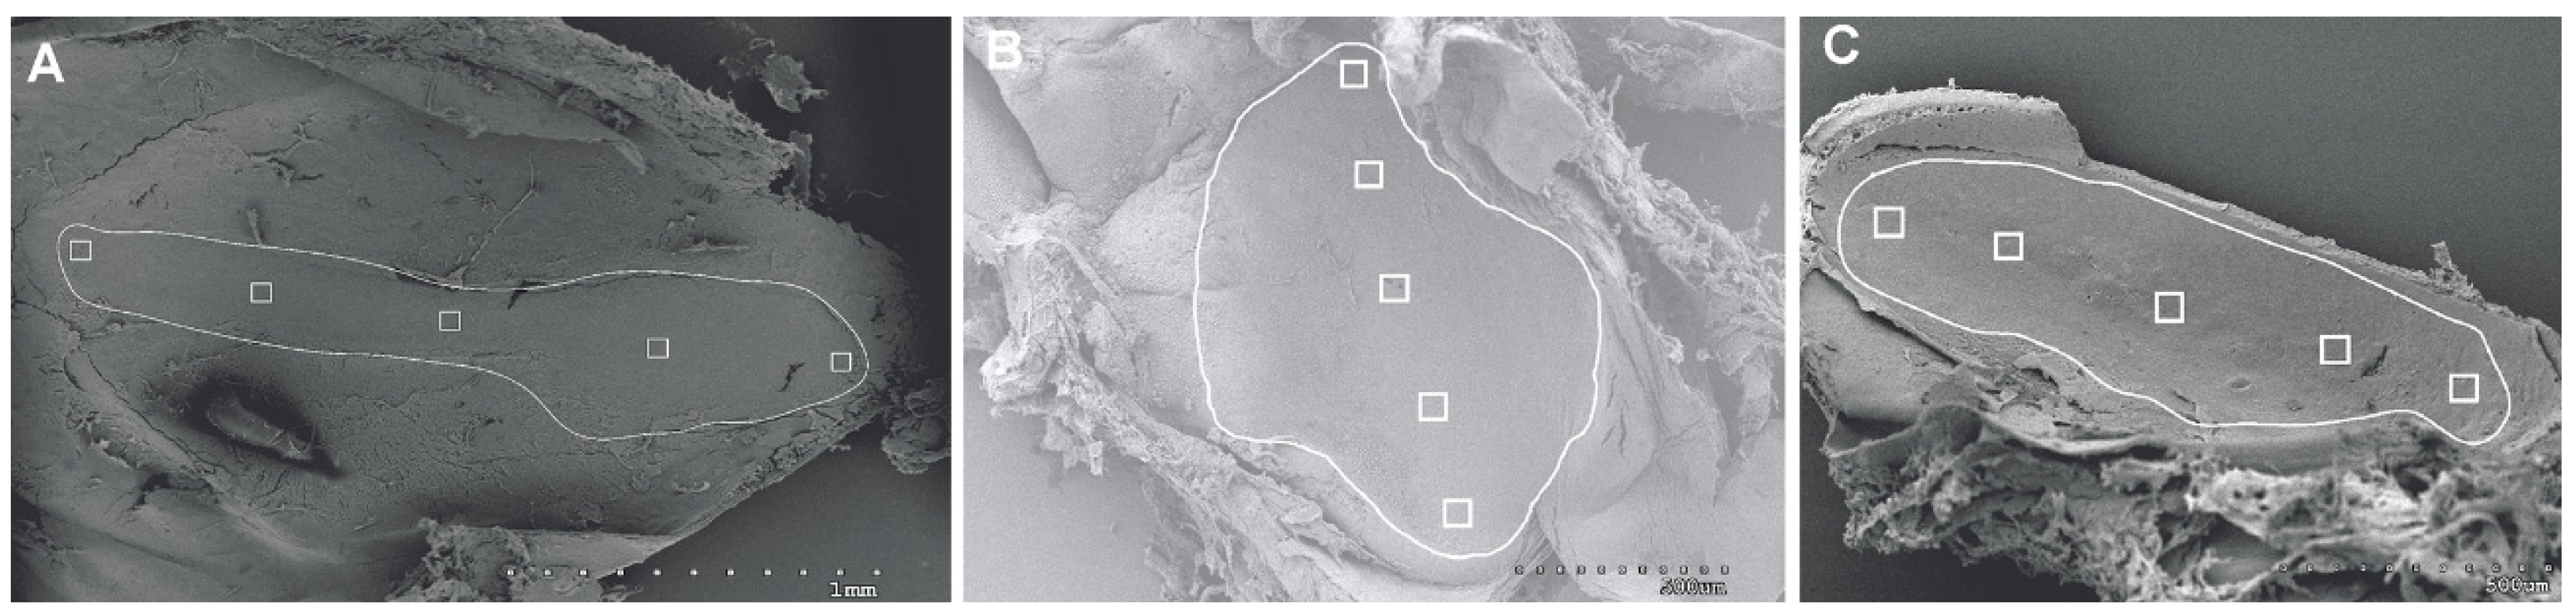
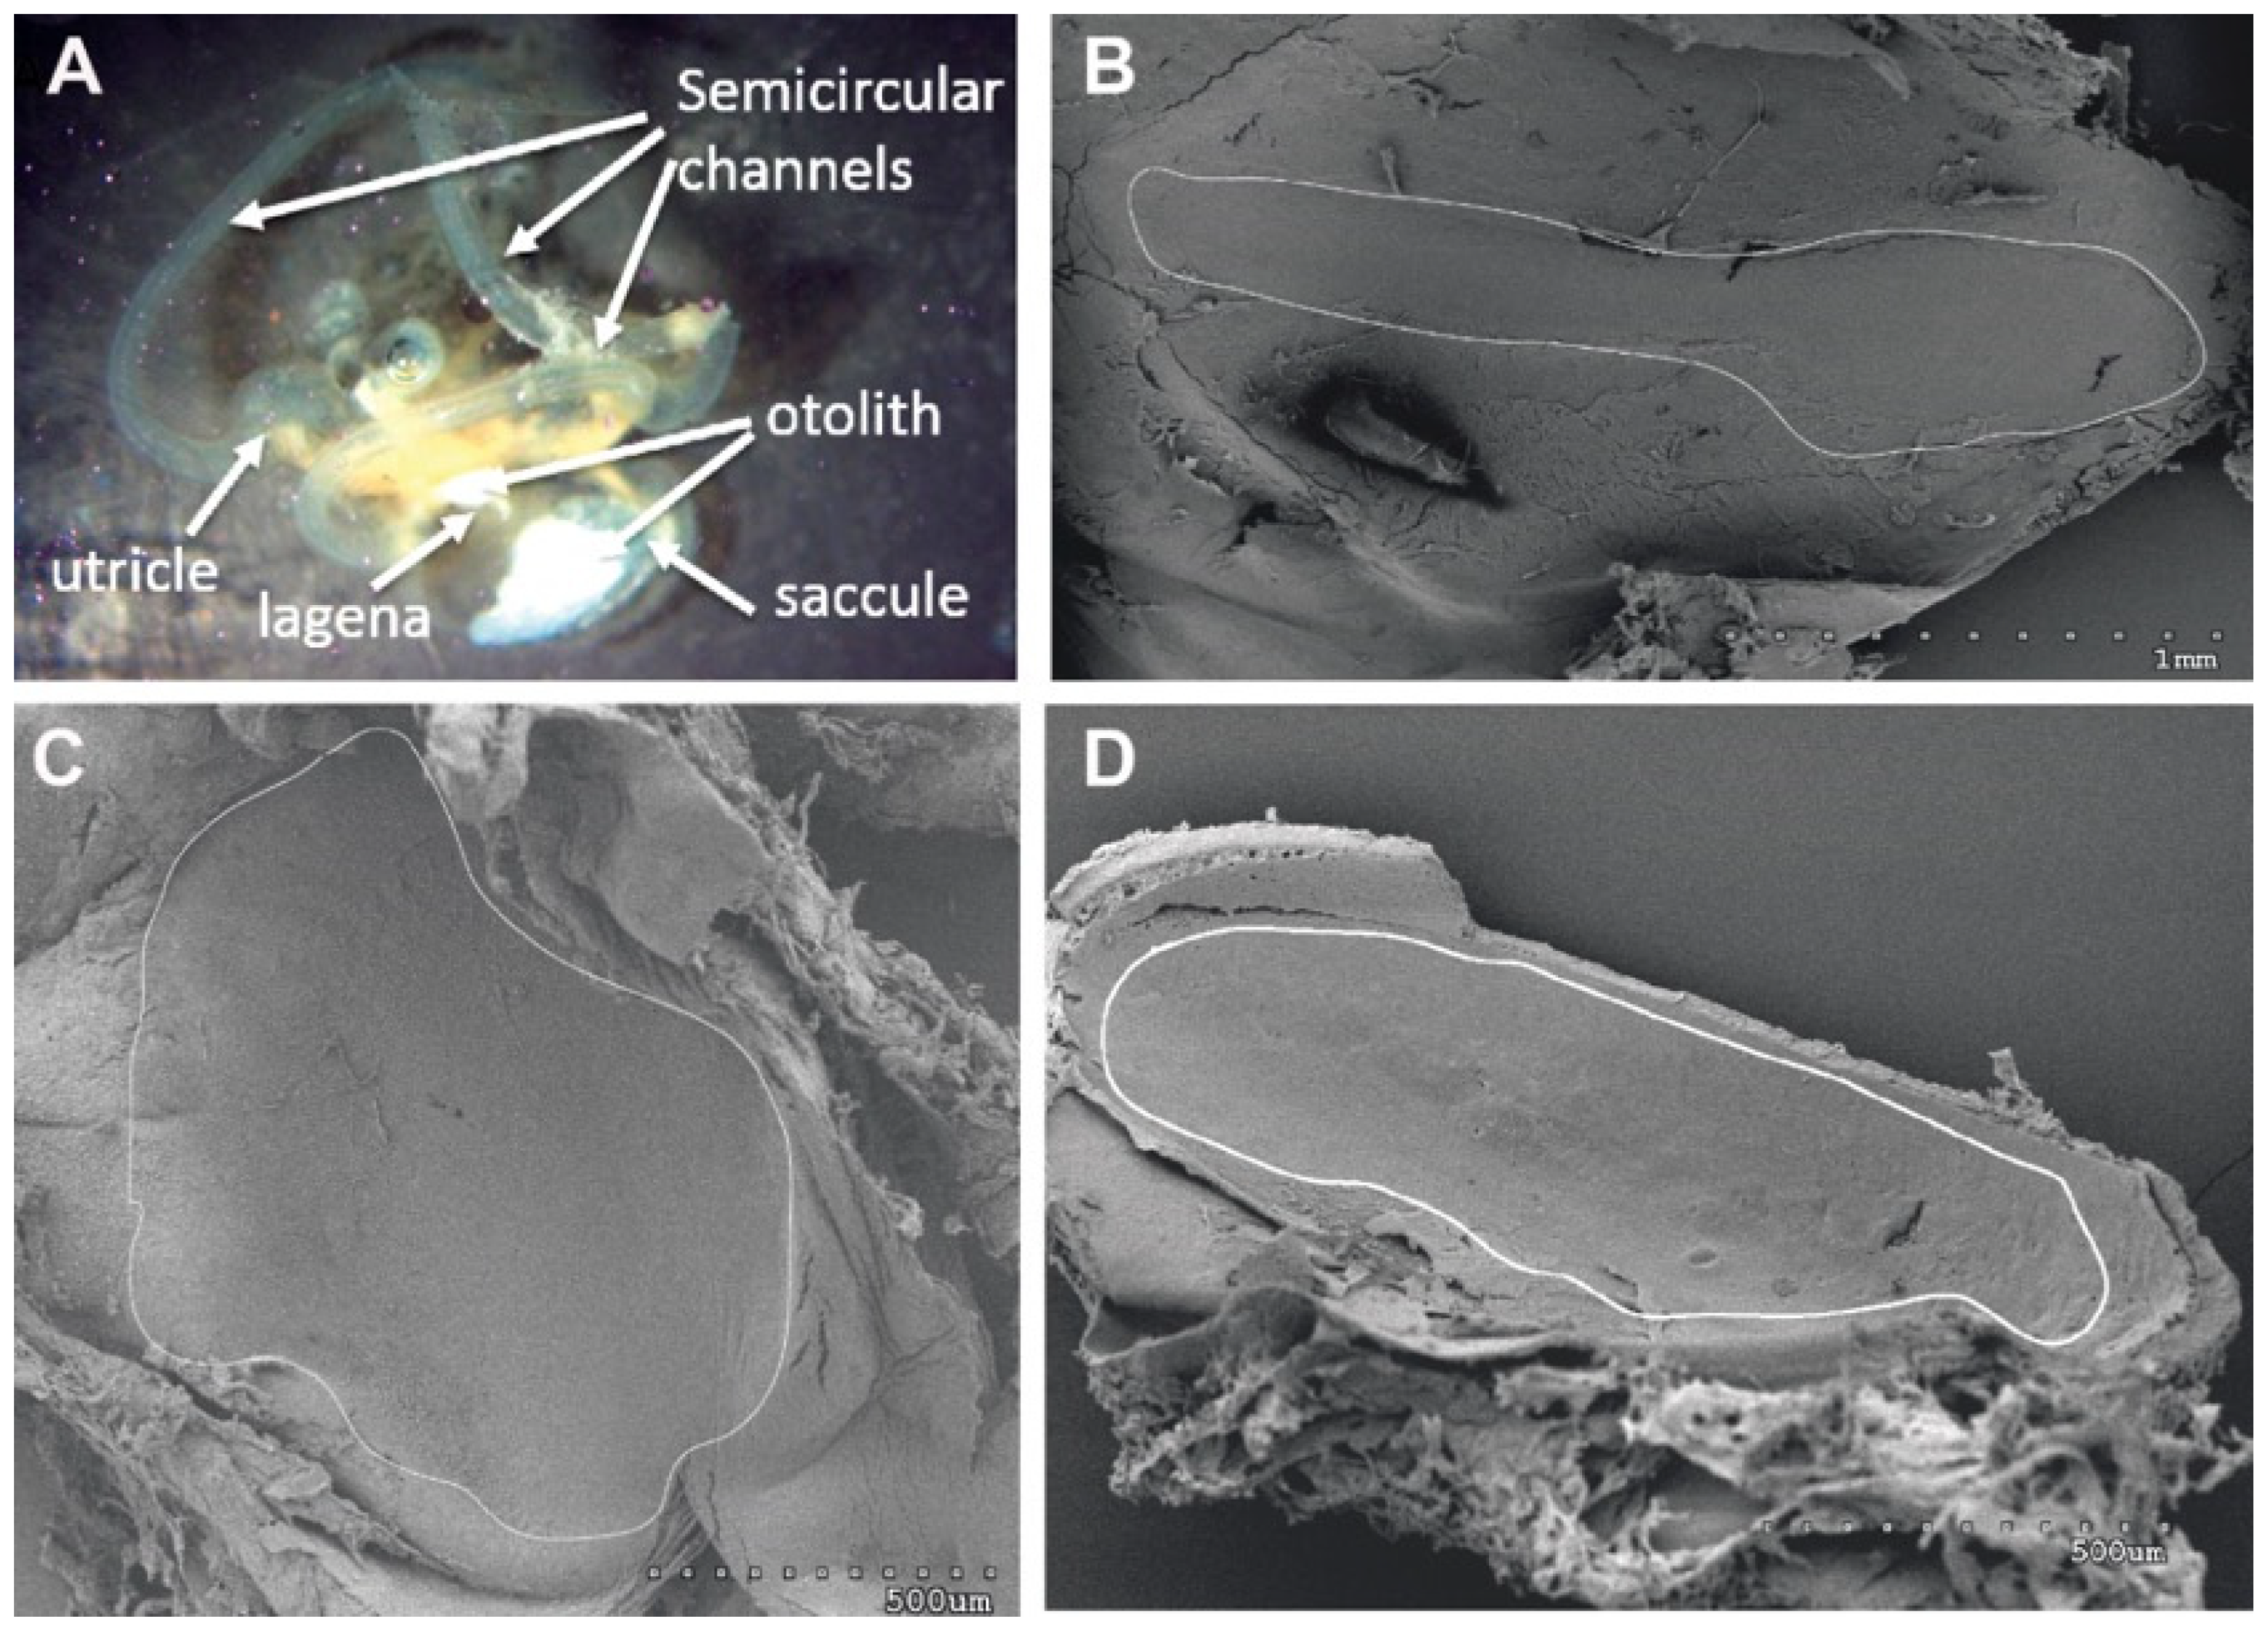
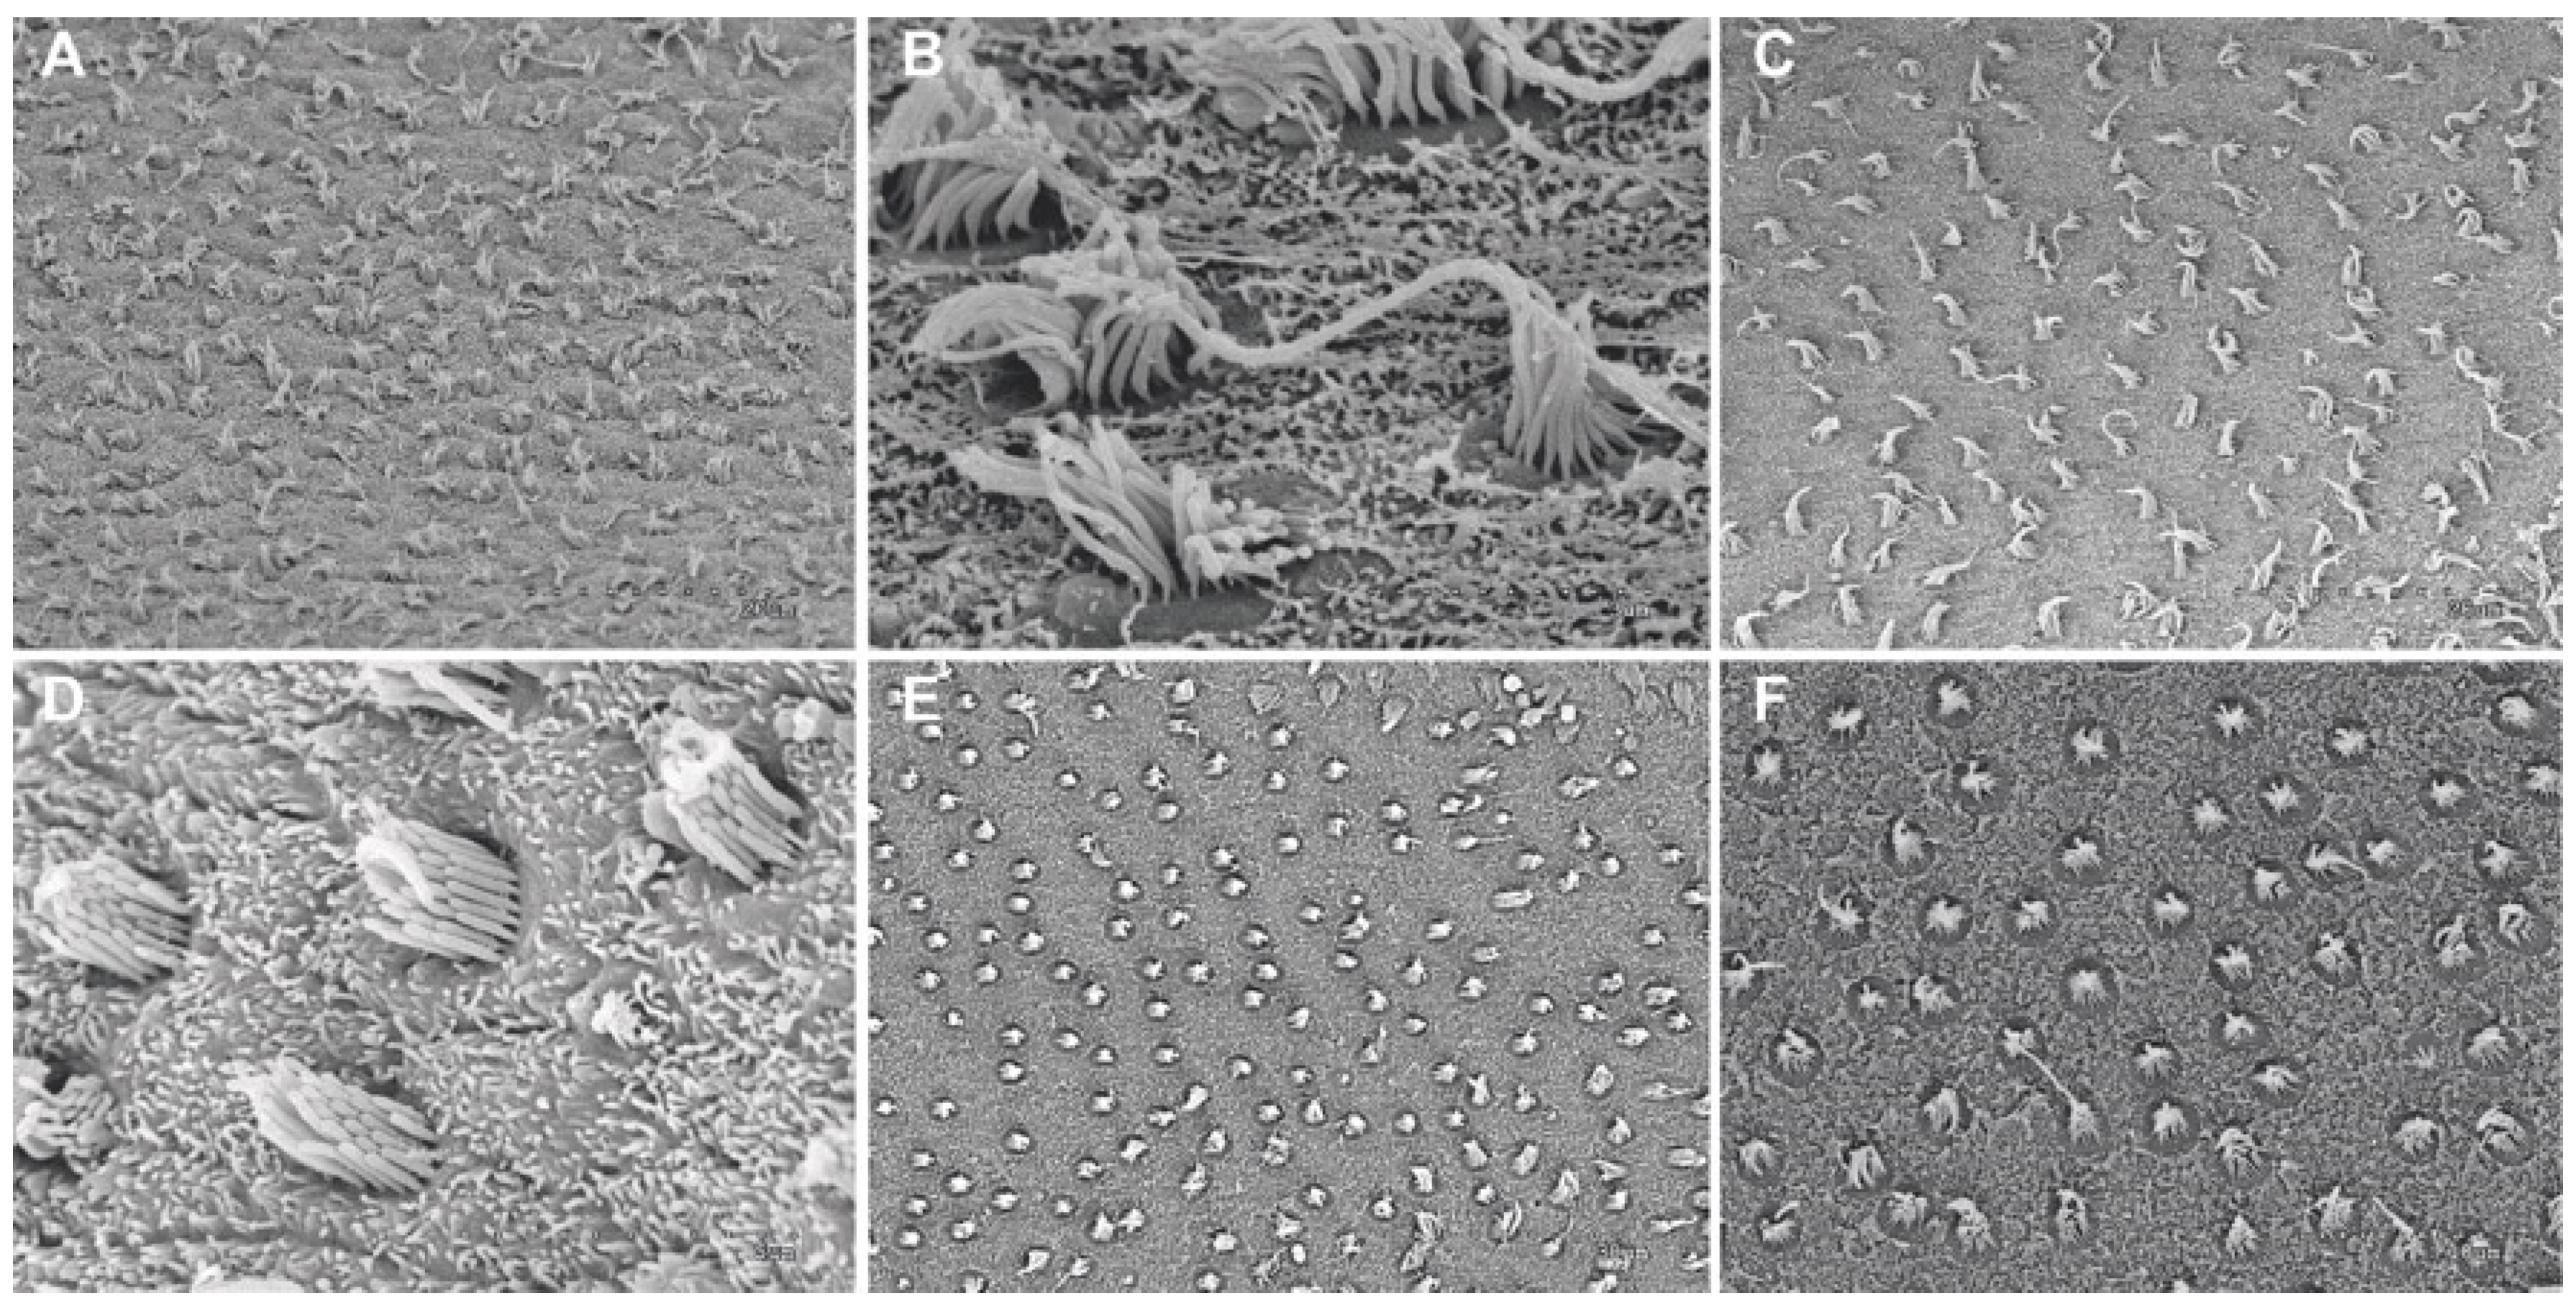
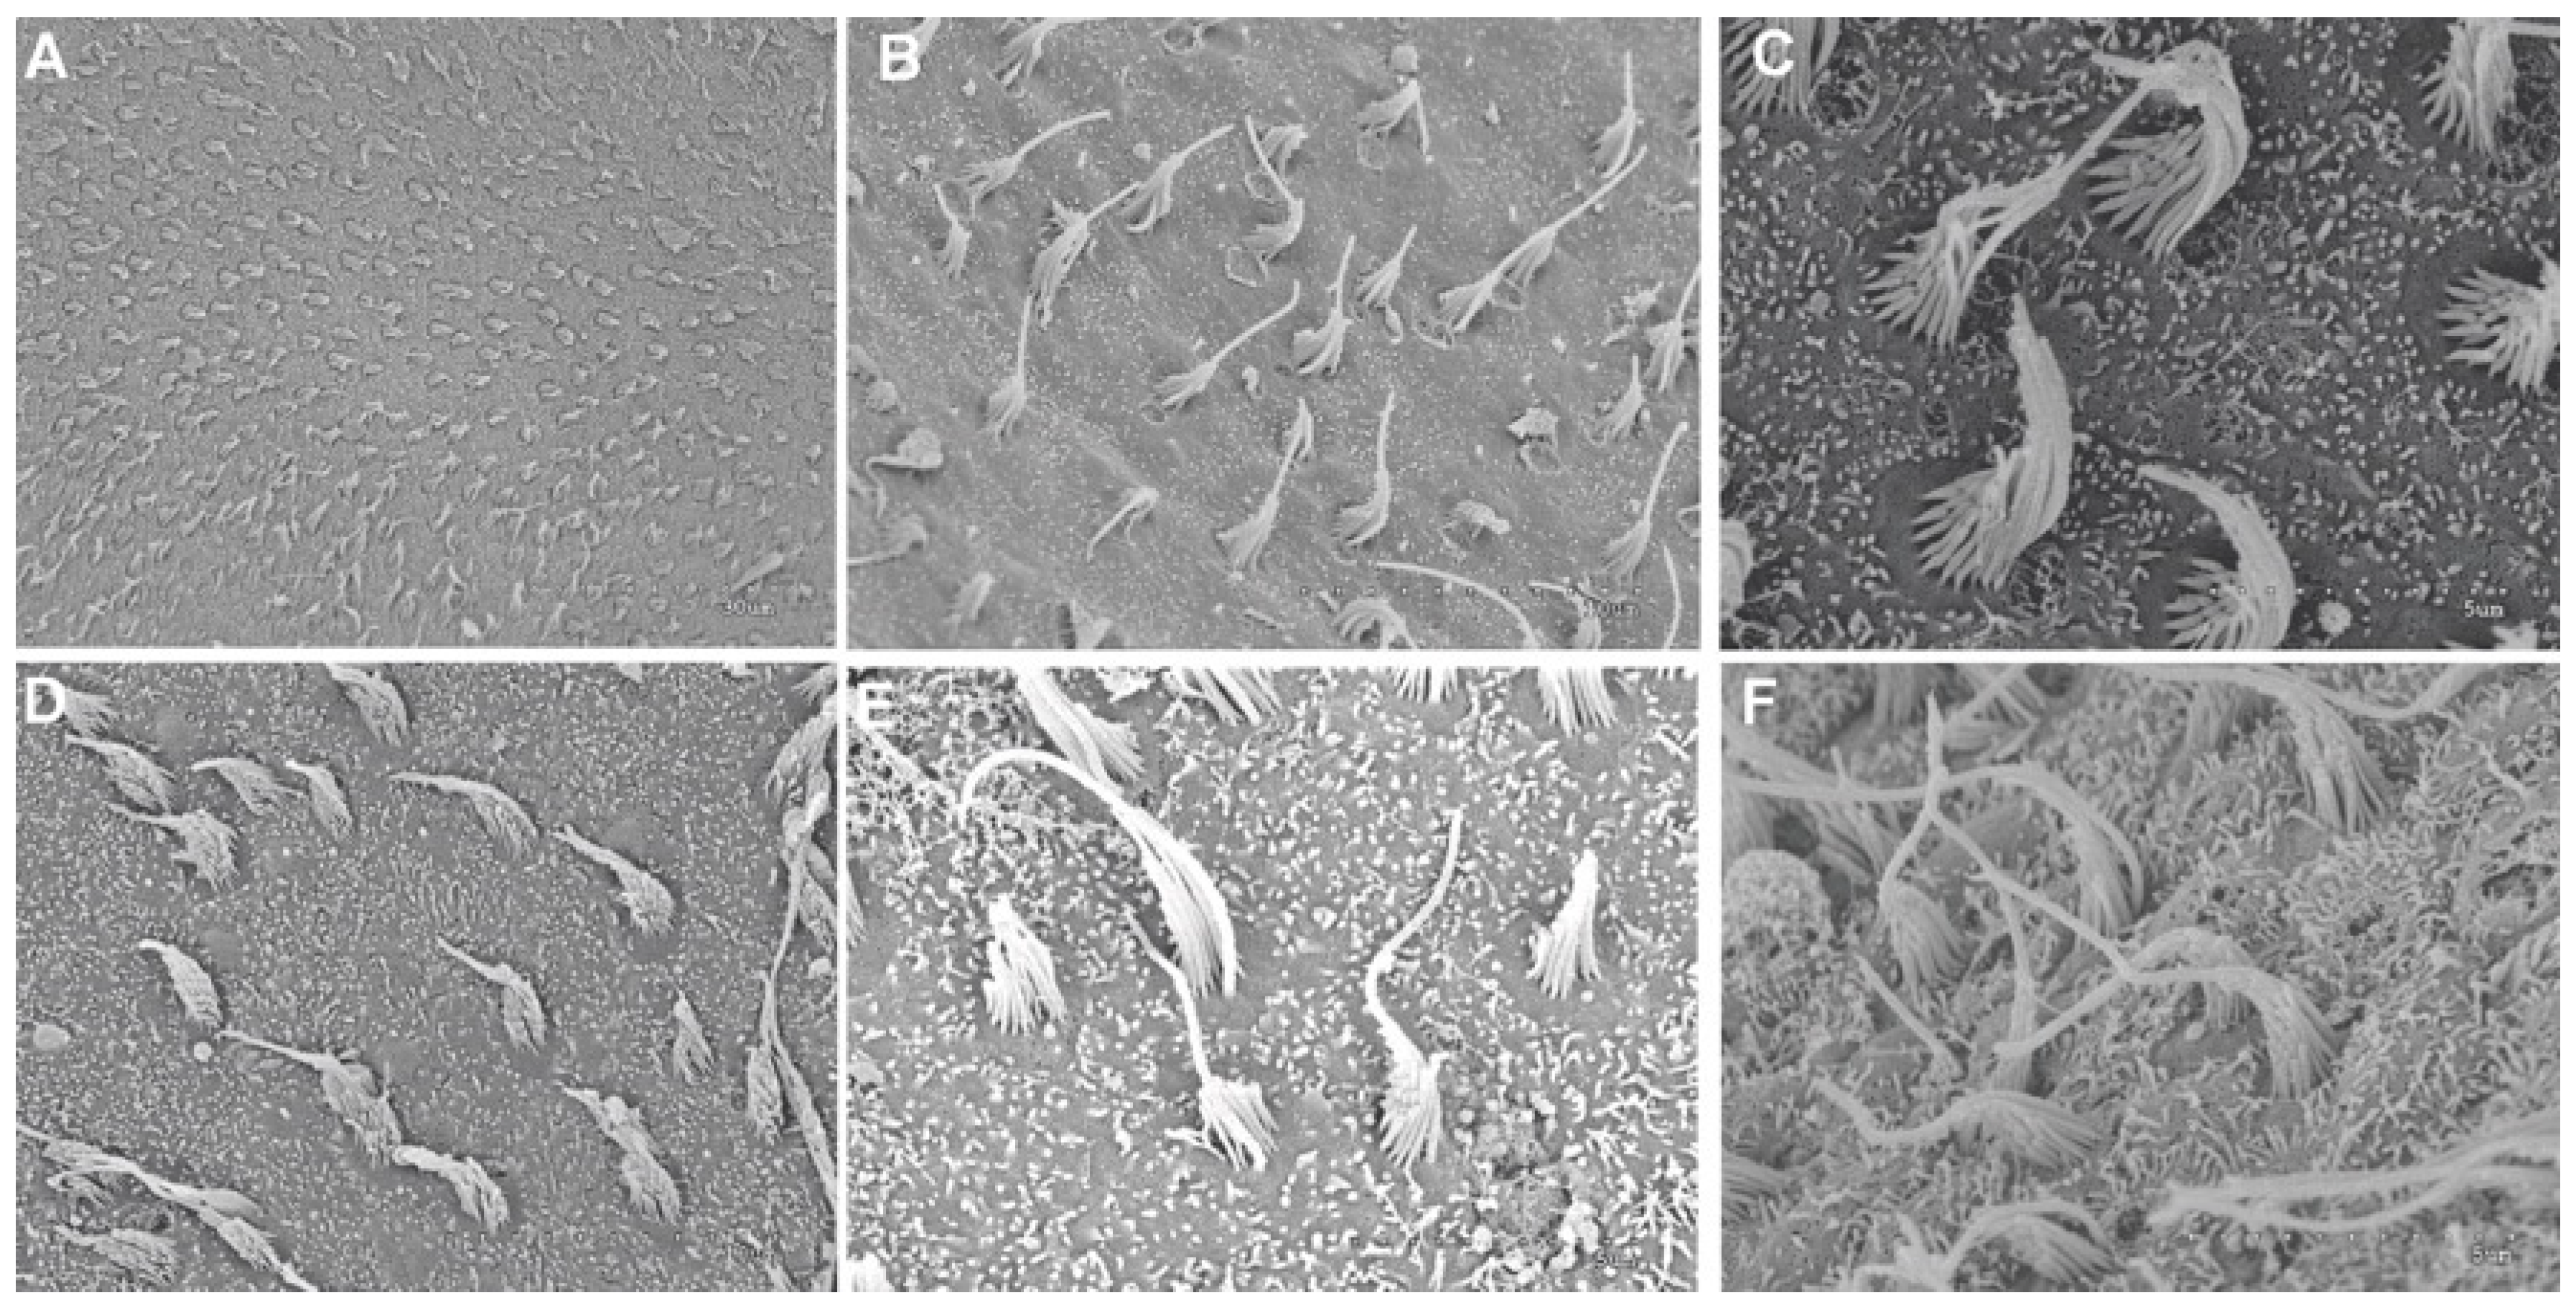
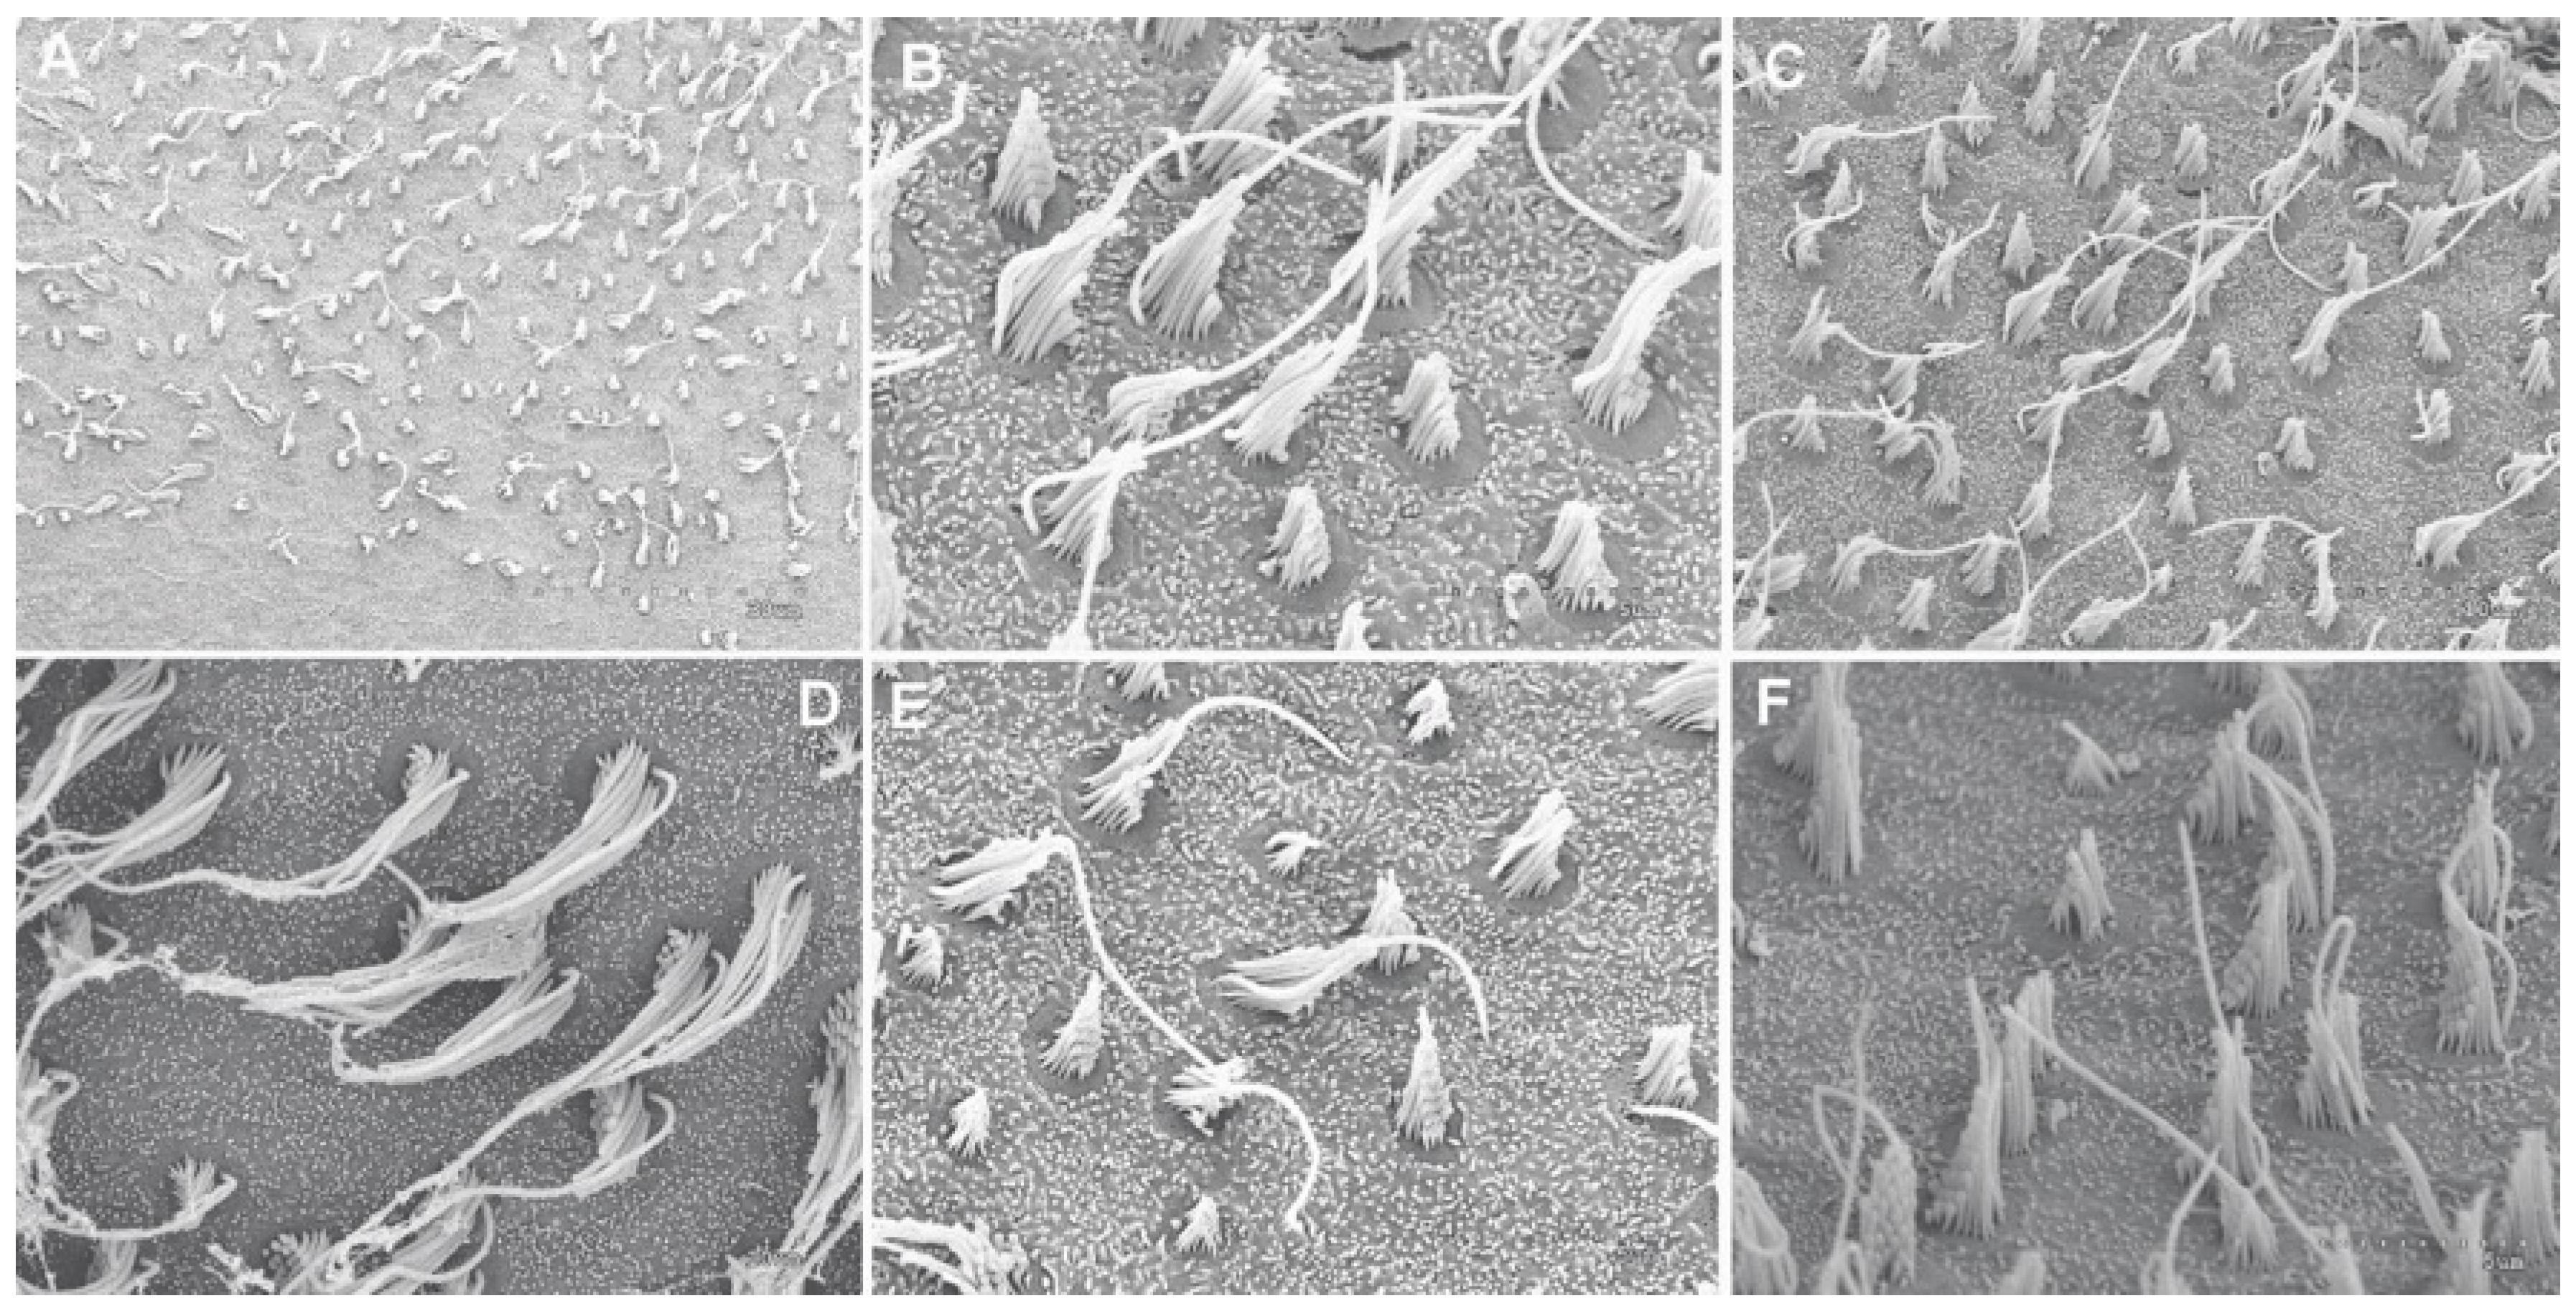
2.1.4. Analysis of Salmon Otolith Organs by Scanning Electron Microscopy

Otolith organs epithelia from individual fishes were inspected with SEM imaging techniques to detect any possible alteration of the sensory epithelia. The samples were processed with routine SEM procedures.
Fixation was performed in glutaraldehyde 2.5% for 24–48 h at 4 °C. Samples were dehydrated in graded ethanol solutions and critical-point dried with liquid carbon dioxide in a Bal-Tec CPD030 unit (Leica Mycrosystems, Vienna, Austria). The dried specimens were mounted on specimen stubs with double-sided tape. The mounted samples were gold coated with a Quorum Q150R S sputter coated unit (Quorum Technologies, Laughton, East Sussex, UK) and viewed with a variable pressure Hitachi S-3500N scanning electron microscope (Hitachi High-Technologies Co., Tokyo, Japan) at an accelerating voltage of 5 kV in the Institute of Marine Sciences of the Spanish Research Council (CSIC) facilities.

2.1.5. Quantification and Data Analysis

For quantification of lesions, the region comprising the whole sensory area of the saccule, utricle and lagena was considered. The length of the sensory epithelium areas comprising hair cells was determined for each sample, and 2500 μm2 (50 μm × 50 μm) sampling squares were placed along the centre length of the area at 5%, 25%, 50%, 75% and 95% of the length axe of the macula statica princeps (Figure 2). Numbers of hair cell bundles were counted in sampling squares of both saccules, utricles and lagenas of each fish. In order to identify whether there were lesions due to the acoustic exposure the samples were treated as follows:
  • All controls taken at different times were grouped together into a single control group.
  • The two samples that were taken for each animal were combined by summing both the intact hair cells and the extruded or missing hair cells over the samples.
  • The hair cells were summed over all the regions, obtaining a single intact hair cells count and single extruded/missing count per animal.
  • The extruded/missing count was divided by the intact hair cell count.
For each experiment this resulted in a series or damaged hair cell ratios for the control group (10) and each sampled group over time (after weeks 1, 2 and 3 in the LAB with 10 samples each), and for each organ that was analysed (lagena, saccule, utricle). A Kruskal–Wallis test was performed for each organ and each experiment to identify if there was a difference in median hair cell damage between the control group and any of the time-sampled groups. All calculations were performed with Matlab R2019a.

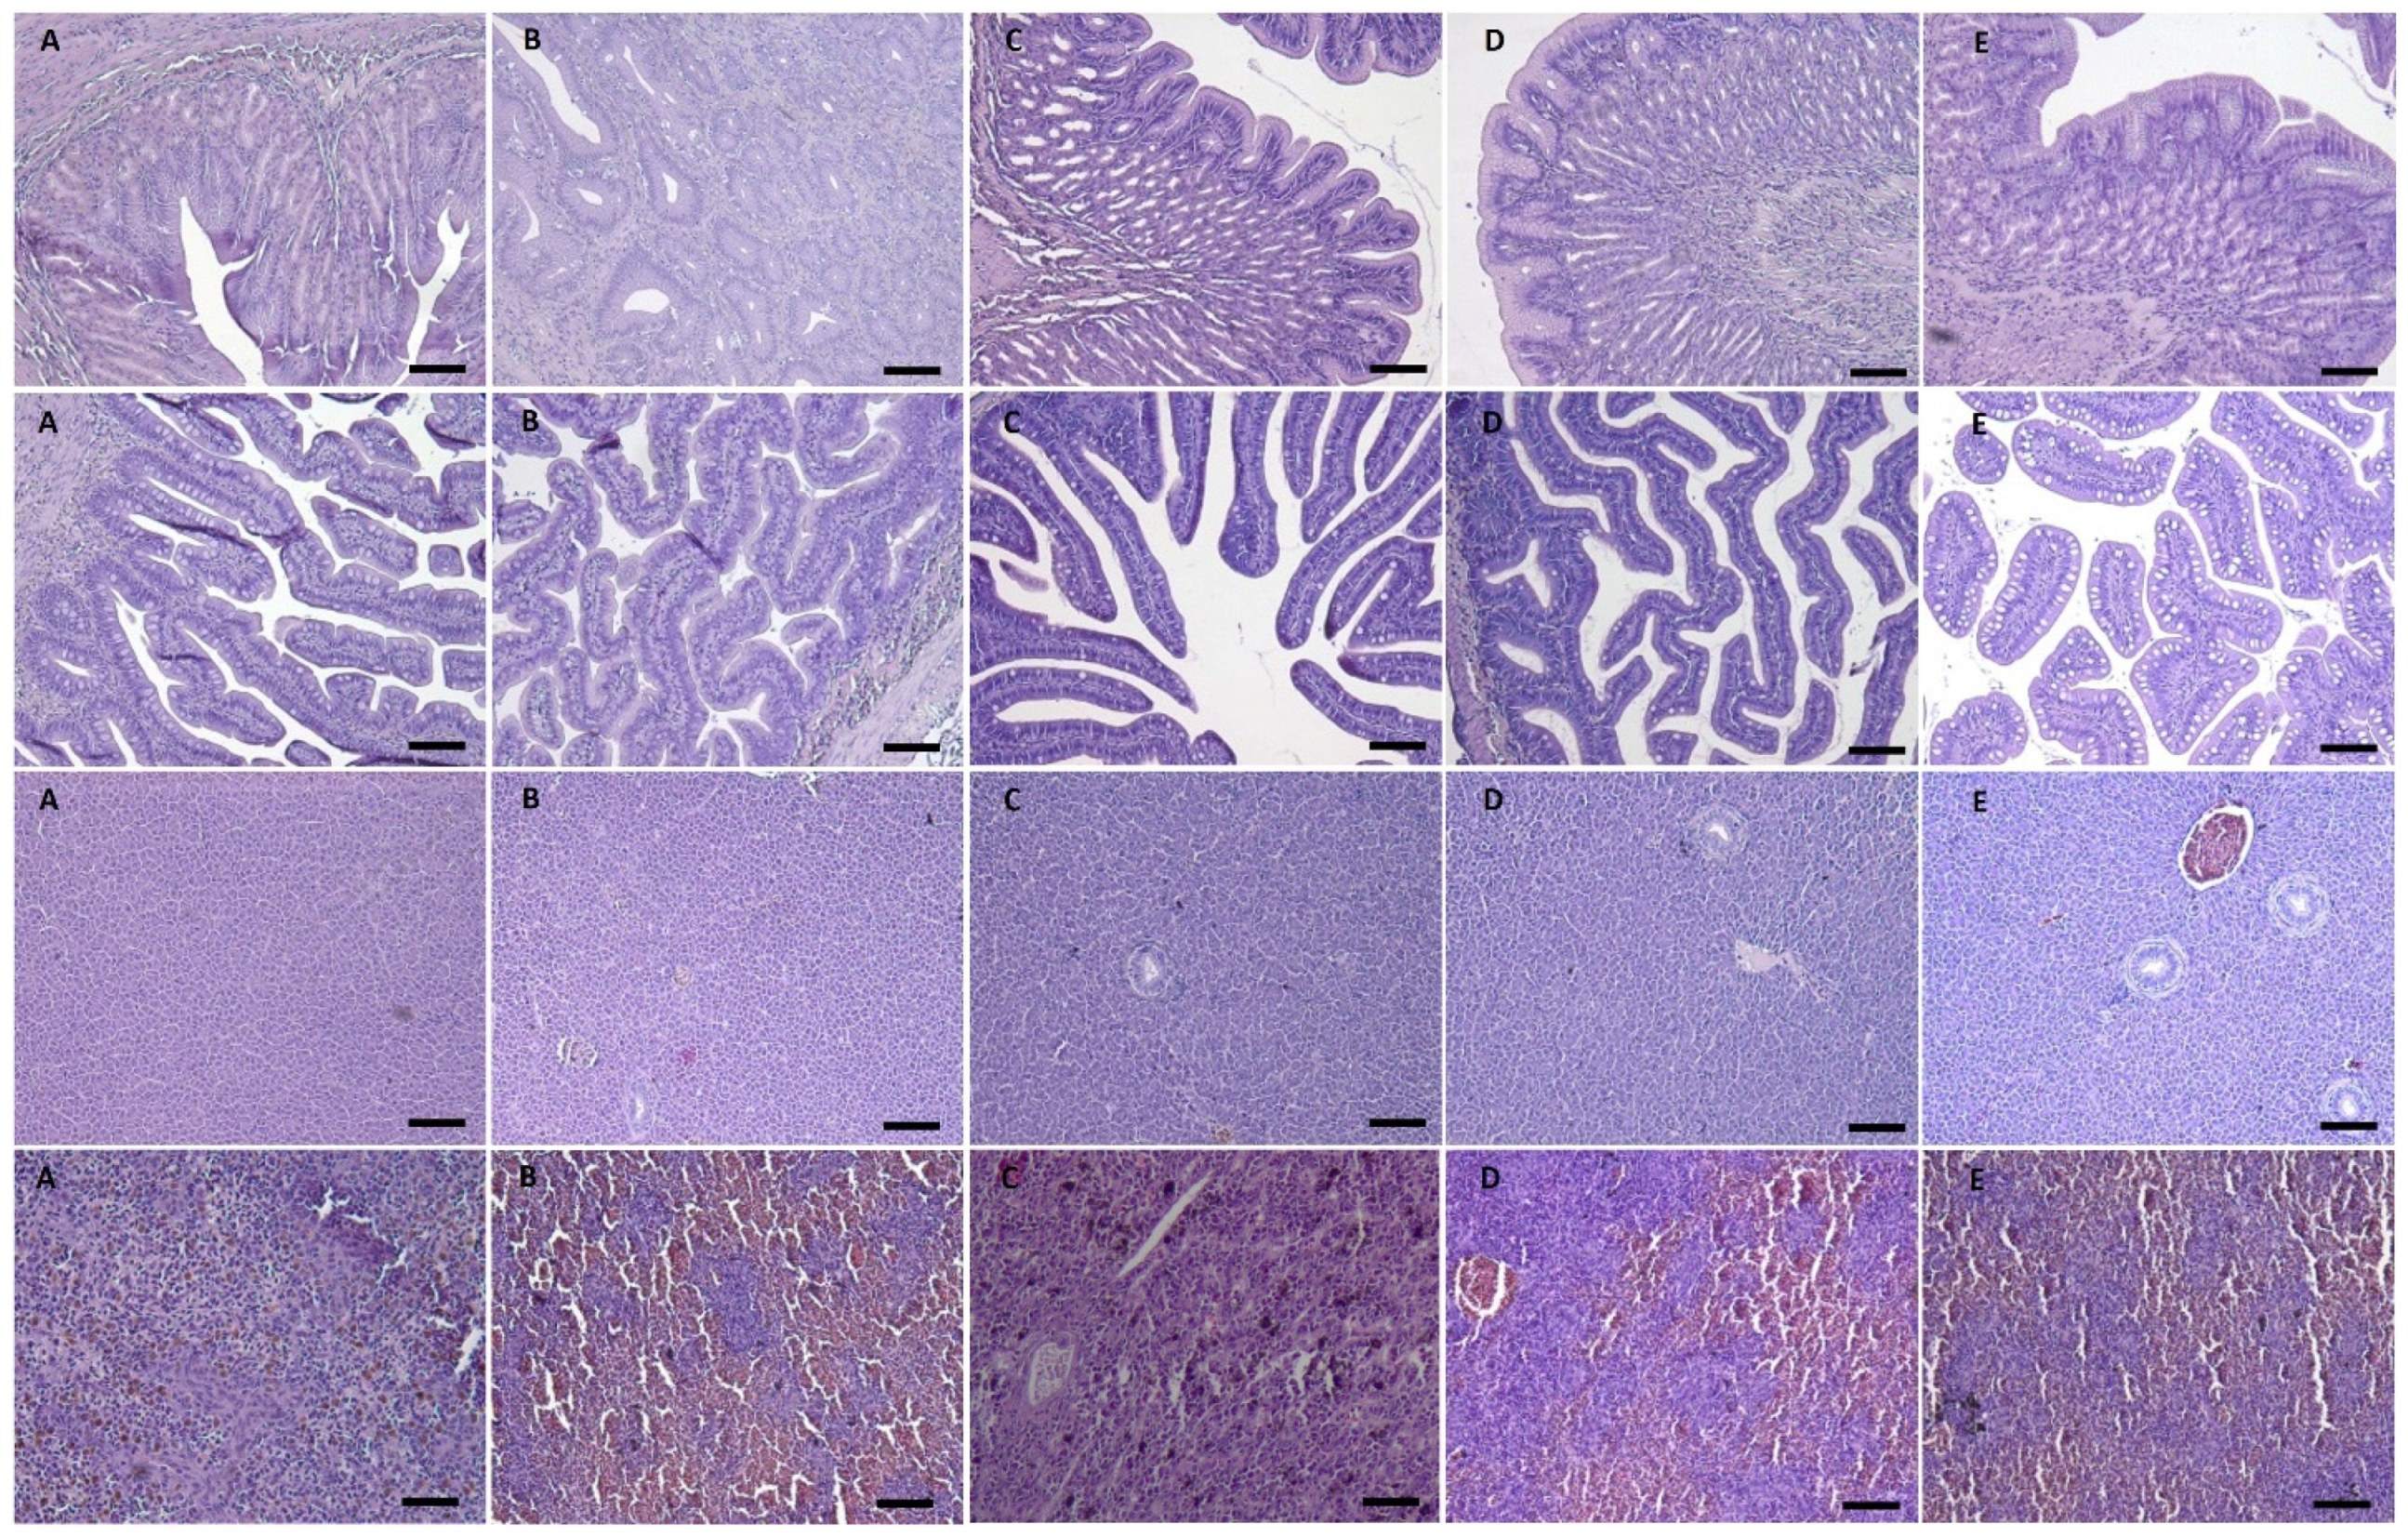
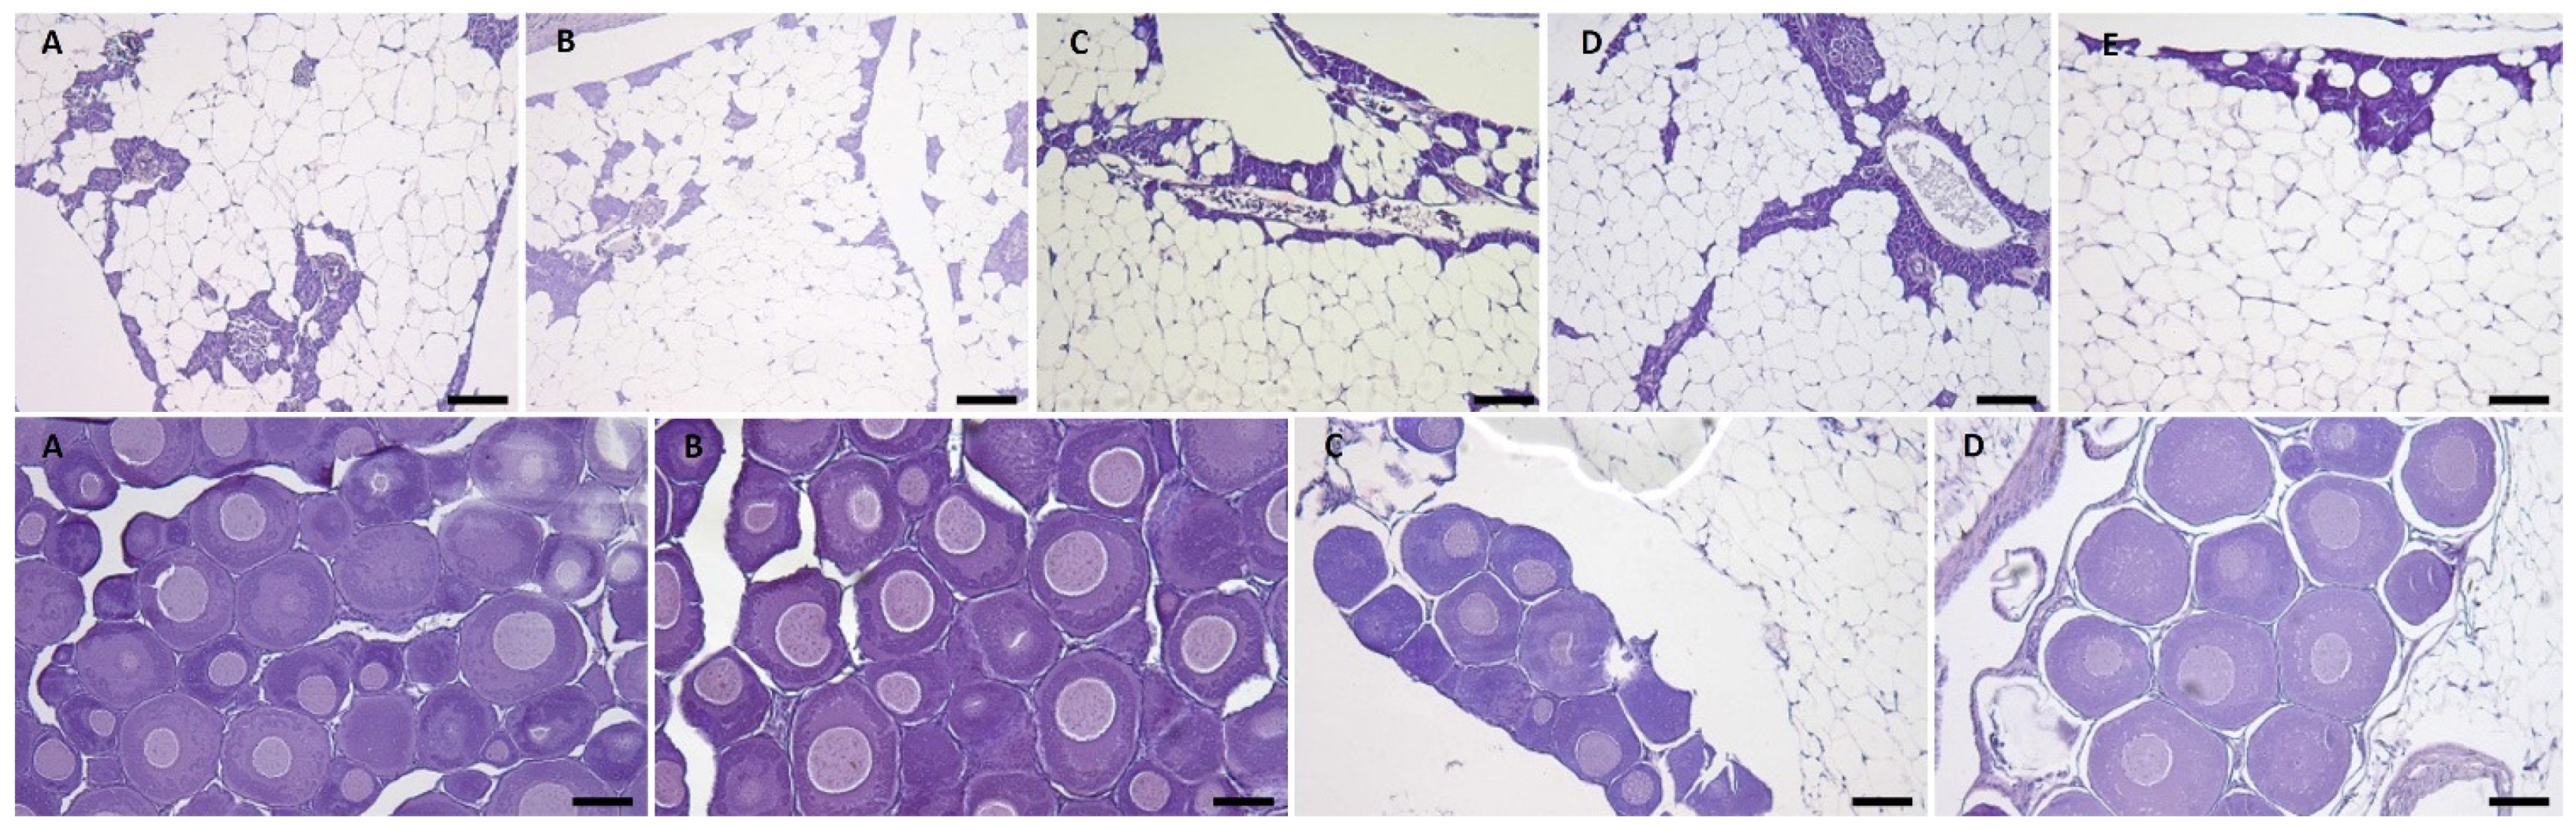
2.1.6. Salmon Gross Pathology and Histopathological Analysis

Salmon were anaesthetised and sacrificed with an overdose of 2-phenoxyethanol and spinal severance and were subjected to a gross pathology examination after a standardised necropsy procedure in order to identify potential external lesions or alterations. Particular attention was paid to identify lesions such as haemorrhages or other vascular disturbances, and mainly in the swim bladder, as these are the most frequently described lesions in previously papers.
Immediately after examination, samples of different tissues (liver, digestive system, swim bladder, spleen, kidney, gonads and skeletal musculature) were fixed in 10% buffered formalin. Fixed samples were processed for routine histological studies by progressive dehydration, clearing, embedding in paraffin, block sectioning, staining with haematoxylin and eosin (H/E) and examined under the microscope.

2.1.7. Behavioural Observations

Salmon behaviour was monitored before, during and after the sound exposure, for a period of 10 min each time, in order to determine behavioural alterations (expected behavioural reactions were jumps, rolls and twitches). Jumps were defined as fast accelerations in swimming speeds that ended in a jump, rolls involved turning 90° in the horizontal or vertical plane, and twitches were defined as rapid spasmodic contractions of the body of the salmon.

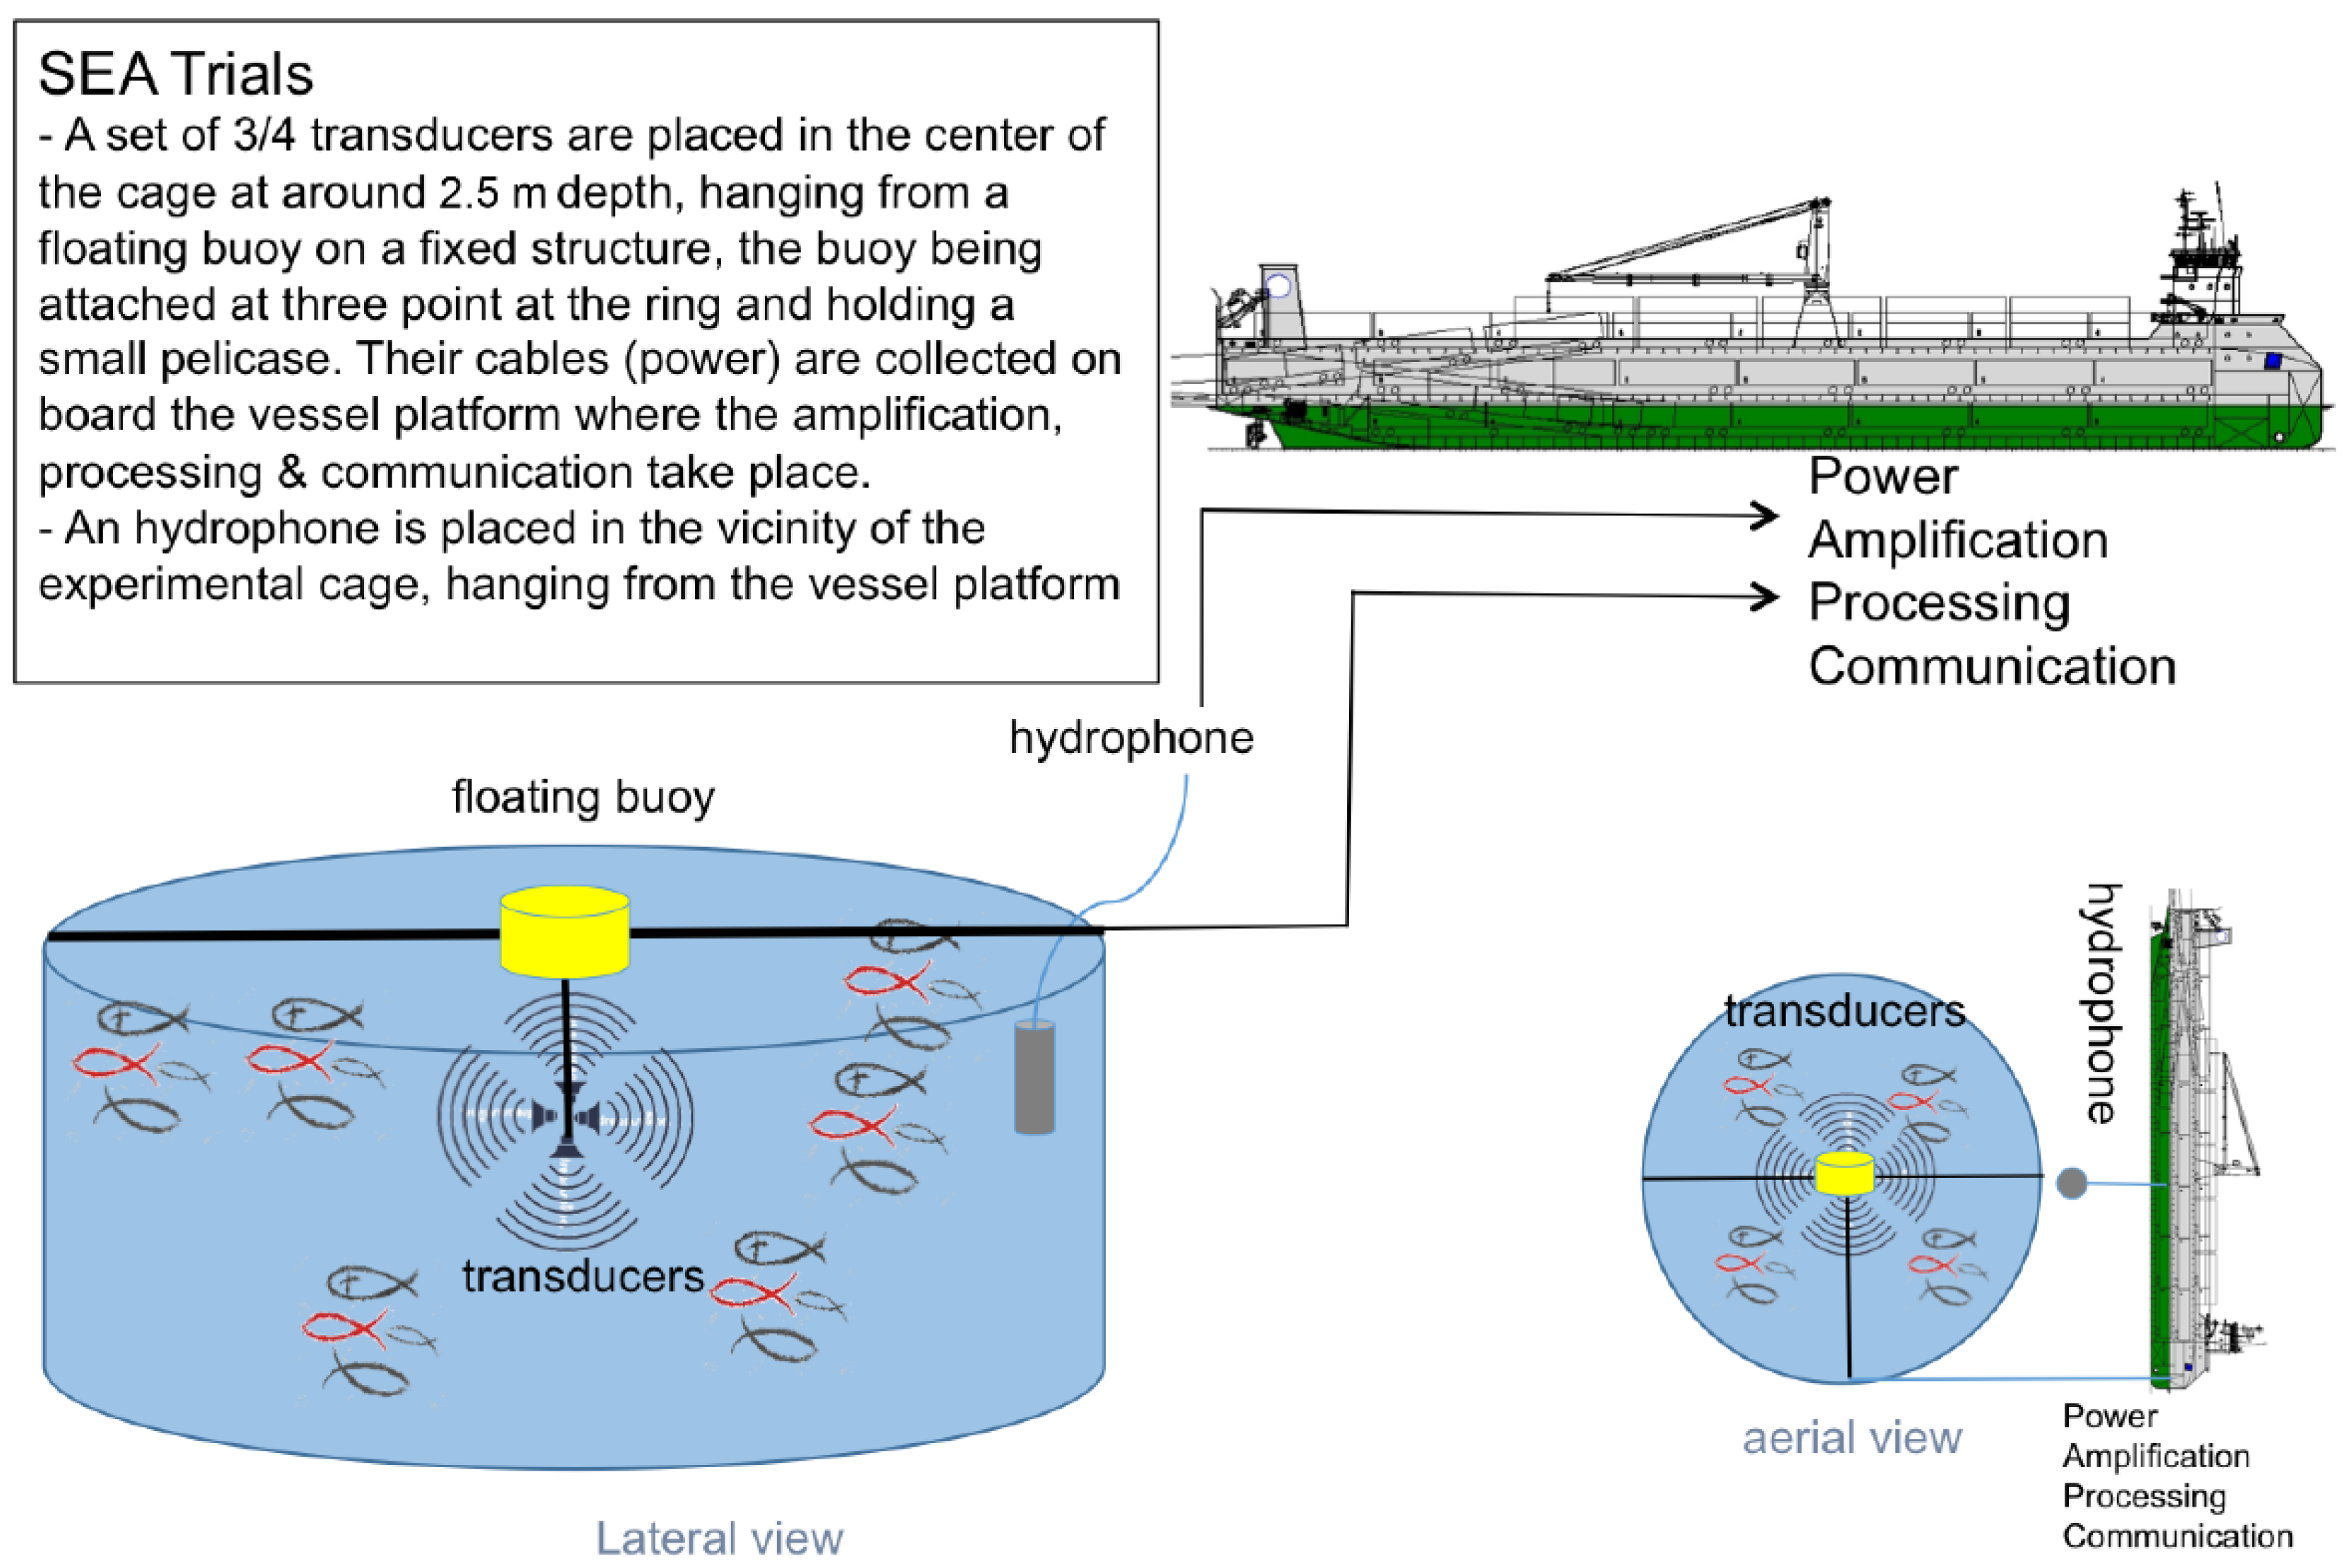
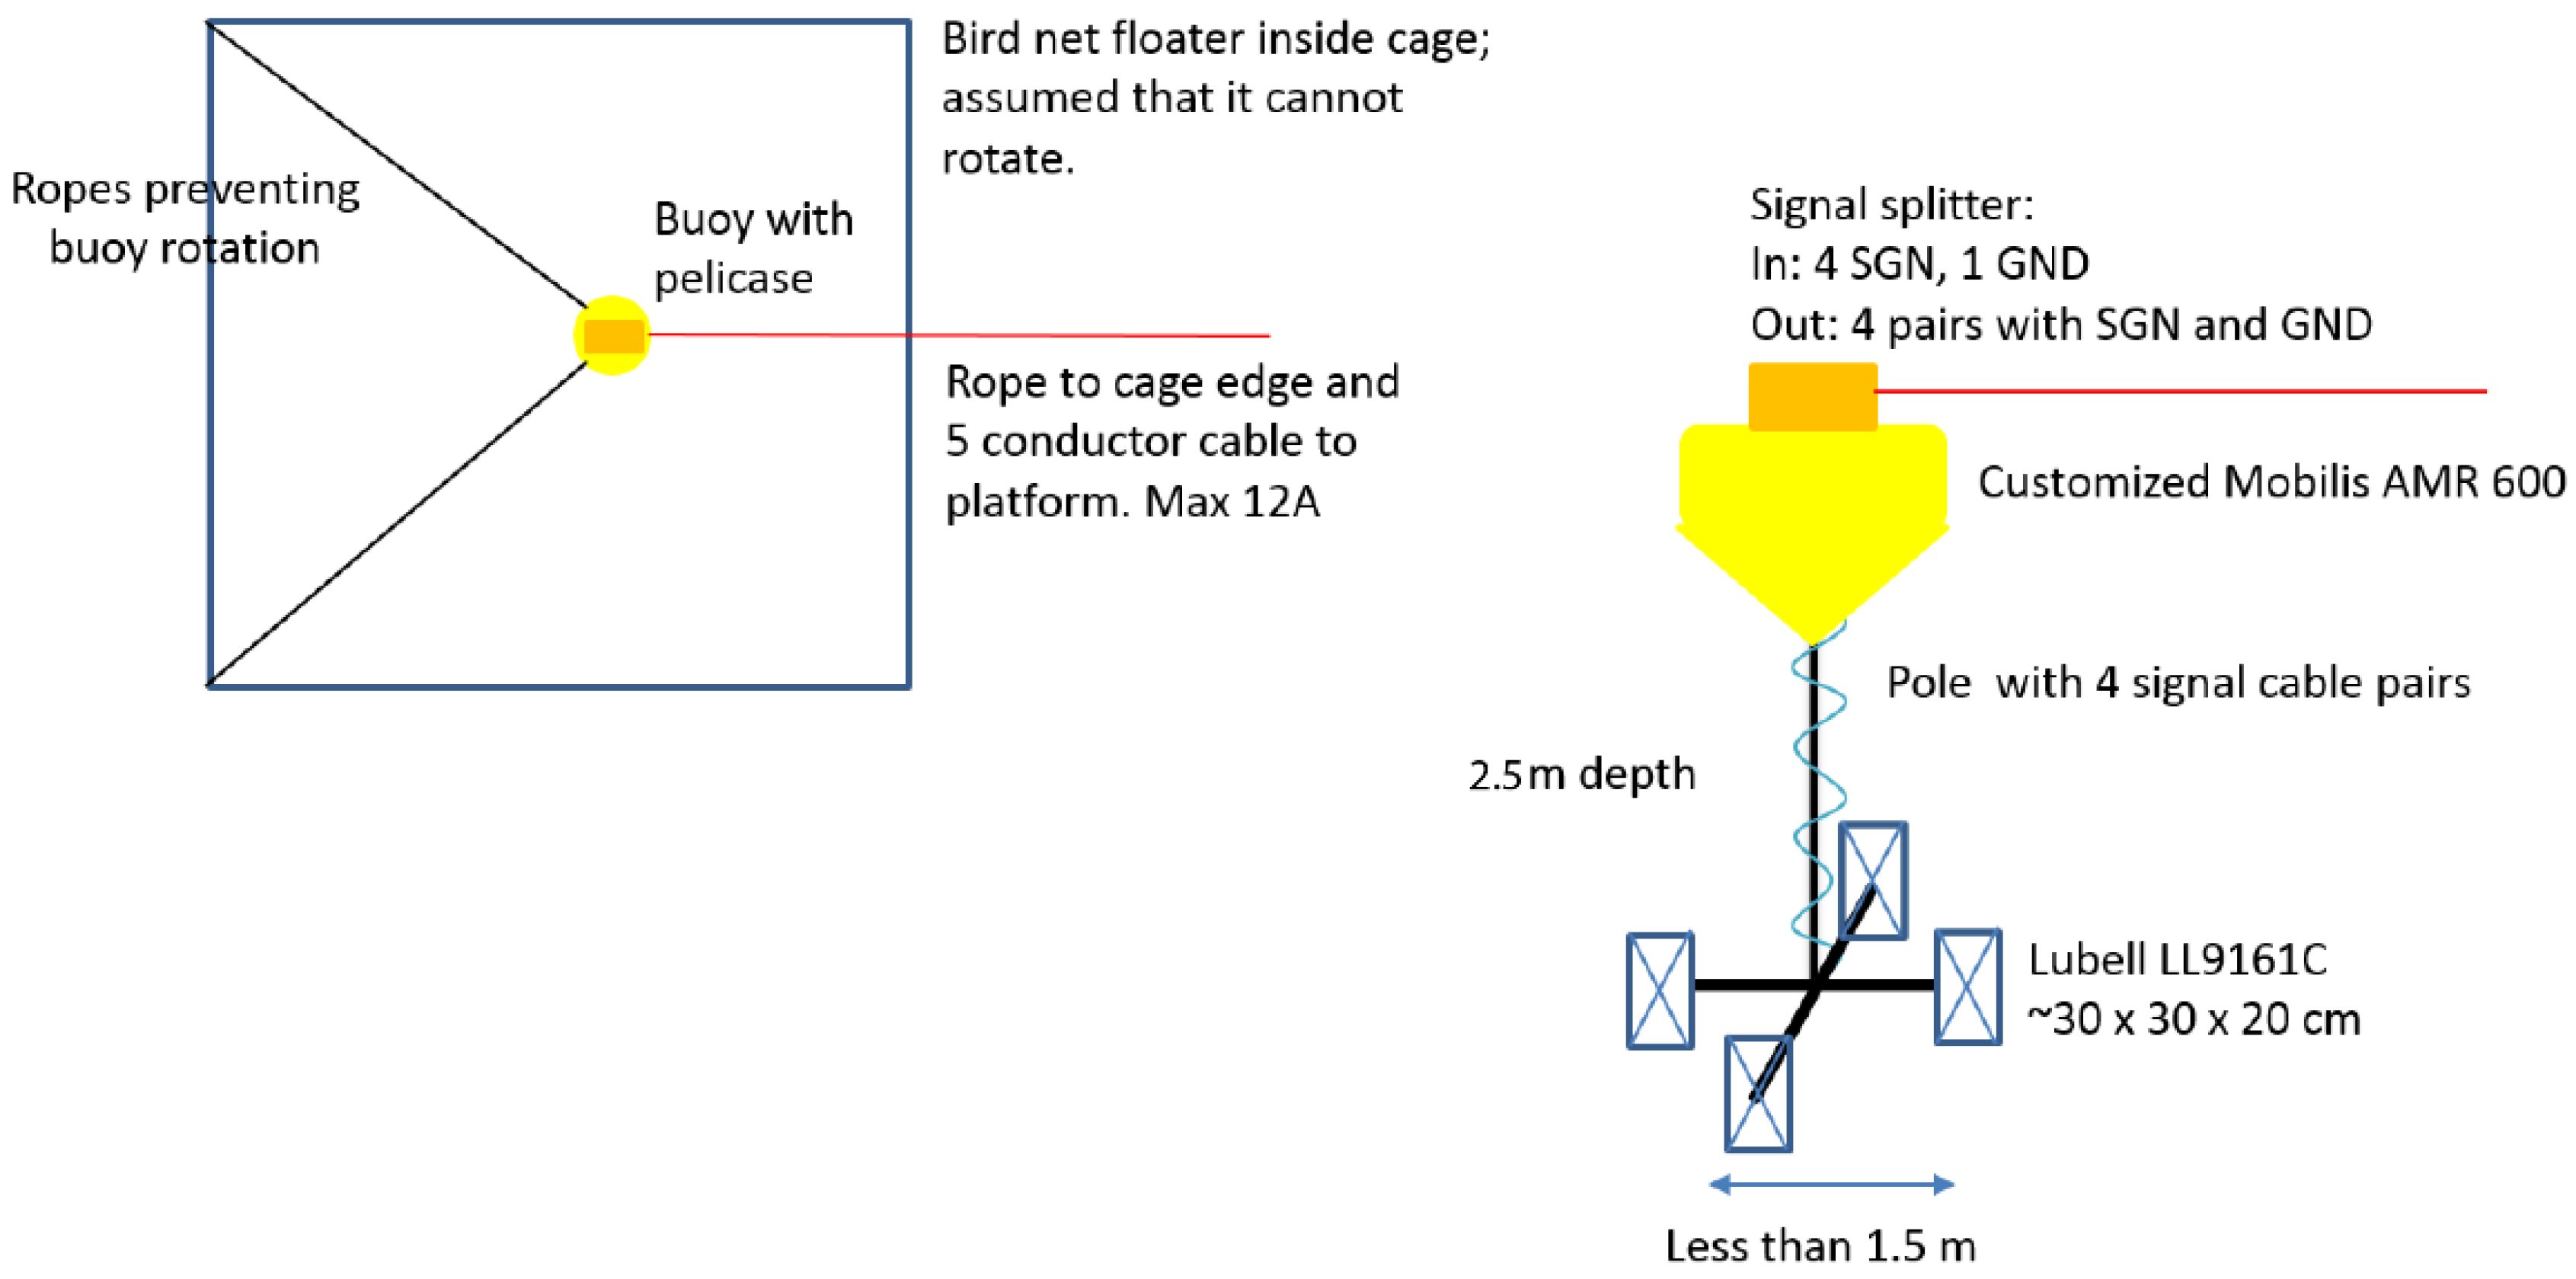
2.2. Sea Trial Experiments

2.2.1. Sound Exposure

Hardware. Under the sea trial protocol (Figure 3 and Figure 4; see complete description in [3]), the system and method included producing the sounds using calibrated transducers capable of reproducing sound covering from 300 Hz to 600 Hz. The transducers used were Lubell LL916C projectors, installed at the centre of each cage. They were driven by a Monacor PA-12040. A control system consisting of an HTI-99-HF hydrophone connected to an MCCDAQ USB-1608G which was connected to a Raspberry Pi monitored correct functioning of the system, the exposure time periods, and the accumulated sound exposure levels.
Acoustic and time parameters: salmon were exposed to continuous exposure (Figure 3 and Figure 4; see complete description in [3]), to individual 350 Hz and 500 Hz signals during, respectively, a cumulative cycle of 1 h and 2 h, and this combination was initially played back every 4 h. The received sound pressure levels were estimated conservatively (as the measurement point was fixed while the cages provided a lot of space for the fish to move around) to be 139 dB re 1 µPa2 at 350 Hz and 142 dB re 1 µPa2 at 500 Hz. The received levels at the monitoring hydrophone could vary by 5 dB between exposure windows. The estimated SEL for the frequency and duration combination used above and one 3-h exposure session was 179 dB re 1 µPa2 s. In order to be able to more rapidly reach a target SEL similar to those obtained during the laboratory experiments (195 dB re 1 µPa2 s) it was decided to increase the received level by 10 dB for both frequencies at one of the cages, playing both frequencies for 2 h each continuously.

2.2.2. Sample Collection

Every 3 weeks (in weeks 3, 6, 9 and 12 after sound exposure) samples from salmon were collected:
  • Week 3 and week 6: three salmon from each cage (taken from the two exposed cages and from the four control cages). Total: six exposed individuals and 12 control individuals per week.
  • Week 9 and week 12: three salmon (from the two exposed cages and from the two control cages). Total: six exposed individuals and six control individuals per week.
All collected salmon were used to assess salmon health status. External surfaces, mouth and internal organs of each individual were checked macroscopically for gross pathologies. Then, an anterior and a posterior body wedge, which included skeletal muscle (including white and red muscle), head and trunk kidney, swimbladder, stomach, intestine, liver, perivisceral fat (with pancreatic tissue) and gonads were extracted and processed for histological analysis at the Pathological Diagnostic Service in Fish (SDPP) of the Autonomous University of Barcelona (UAB). A portion of the body containing lateral lines as well as the whole head of the salmon were taken and processed to assess possible lesions in the inner ear structures (otolith organ) and lateral lines at the LAB (Laboratory of Applied Bioacoustics).

2.2.3. Analysis of Salmon Otolith Organs by Scanning Electron Microscopy

Otolith organs epithelia from individual fishes were observed by SEM imaging techniques to detect any possible alteration of the sensory epithelia. The samples were processed by routine SEM procedures.
Fixation was performed in glutaraldehyde 2.5% for 24–48 h at 4 °C. Samples were dehydrated in graded ethanol solutions and critical-point dried with liquid carbon dioxide in a Bal-Tec CPD030 unit (Leica Mycrosystems, Vienna, Austria). The dried specimens were mounted on specimen stubs with double-sided tape. The mounted samples were gold coated with a Quorum Q150R S sputter coated unit (Quorum Technologies, Laughton, East Sussex, UK) and viewed with a variable pressure Hitachi S-3500N scanning electron microscope (Hitachi High-Technologies Co., Tokyo, Japan) at an accelerating voltage of 5 kV in the Institute of Marine Sciences of the Spanish Research Council (CSIC) facilities.

2.2.4. Quantification and Data Analysis

We considered for the quantification the region comprising the whole sensory area of the saccule, utricle and lagena. The length of the sensory epithelium areas comprising hair cells was determined for each sample, and 2500 μm2 (50 × 50 μm) sampling squares were placed along the centre length of the area at 5, 25, 50, 75 and 95% of the length axe of the macula statica princeps (Figure 2). Numbers of hair cell bundles were counted in sampling squares of both saccules, utricles and lagenas of each fish. In order to identify whether there were lesions due to the acoustic exposure, the samples were treated as follows:
  • All controls taken at different times were grouped together into a single control group.
  • The two samples that were taken for each animal were combined by summing both the intact hair cells and the extruded or missing hair cells over the samples.
  • The hair cells were summed over all the regions, obtaining a single intact hair cells count and single extruded/missing count per animal.
  • The extruded/missing count was divided by the intact hair cell count.
For each experiment this resulted in a series of damaged hair cell ratios for the control group (12) and each sampled group over time (after weeks 3, 6, and 12 with six samples each), and for each organ that was analysed (lagena, saccule, utricle). A Kruskal–Wallis test was performed for each organ and each experiment to identify if there was a difference in median hair cell damage between the control group and any of the time-sampled groups. All calculations were performed with Matlab R2019a.

2.2.5. Analysis of Presence of Vaterite in Salmon Otolith

Sagittal otoliths are primary hearing structures in the inner ear of all teleost (bony) fishes and are normally composed of aragonite, though abnormal vaterite replacement is sometimes seen. Additional to the analysis of salmon otolith epithelia by scanning electron microscopy, the evaluation and quantification of the presence of vaterite in otoliths were performed by optic microscopy. The proportion of otoliths presenting vaterite was quantified.

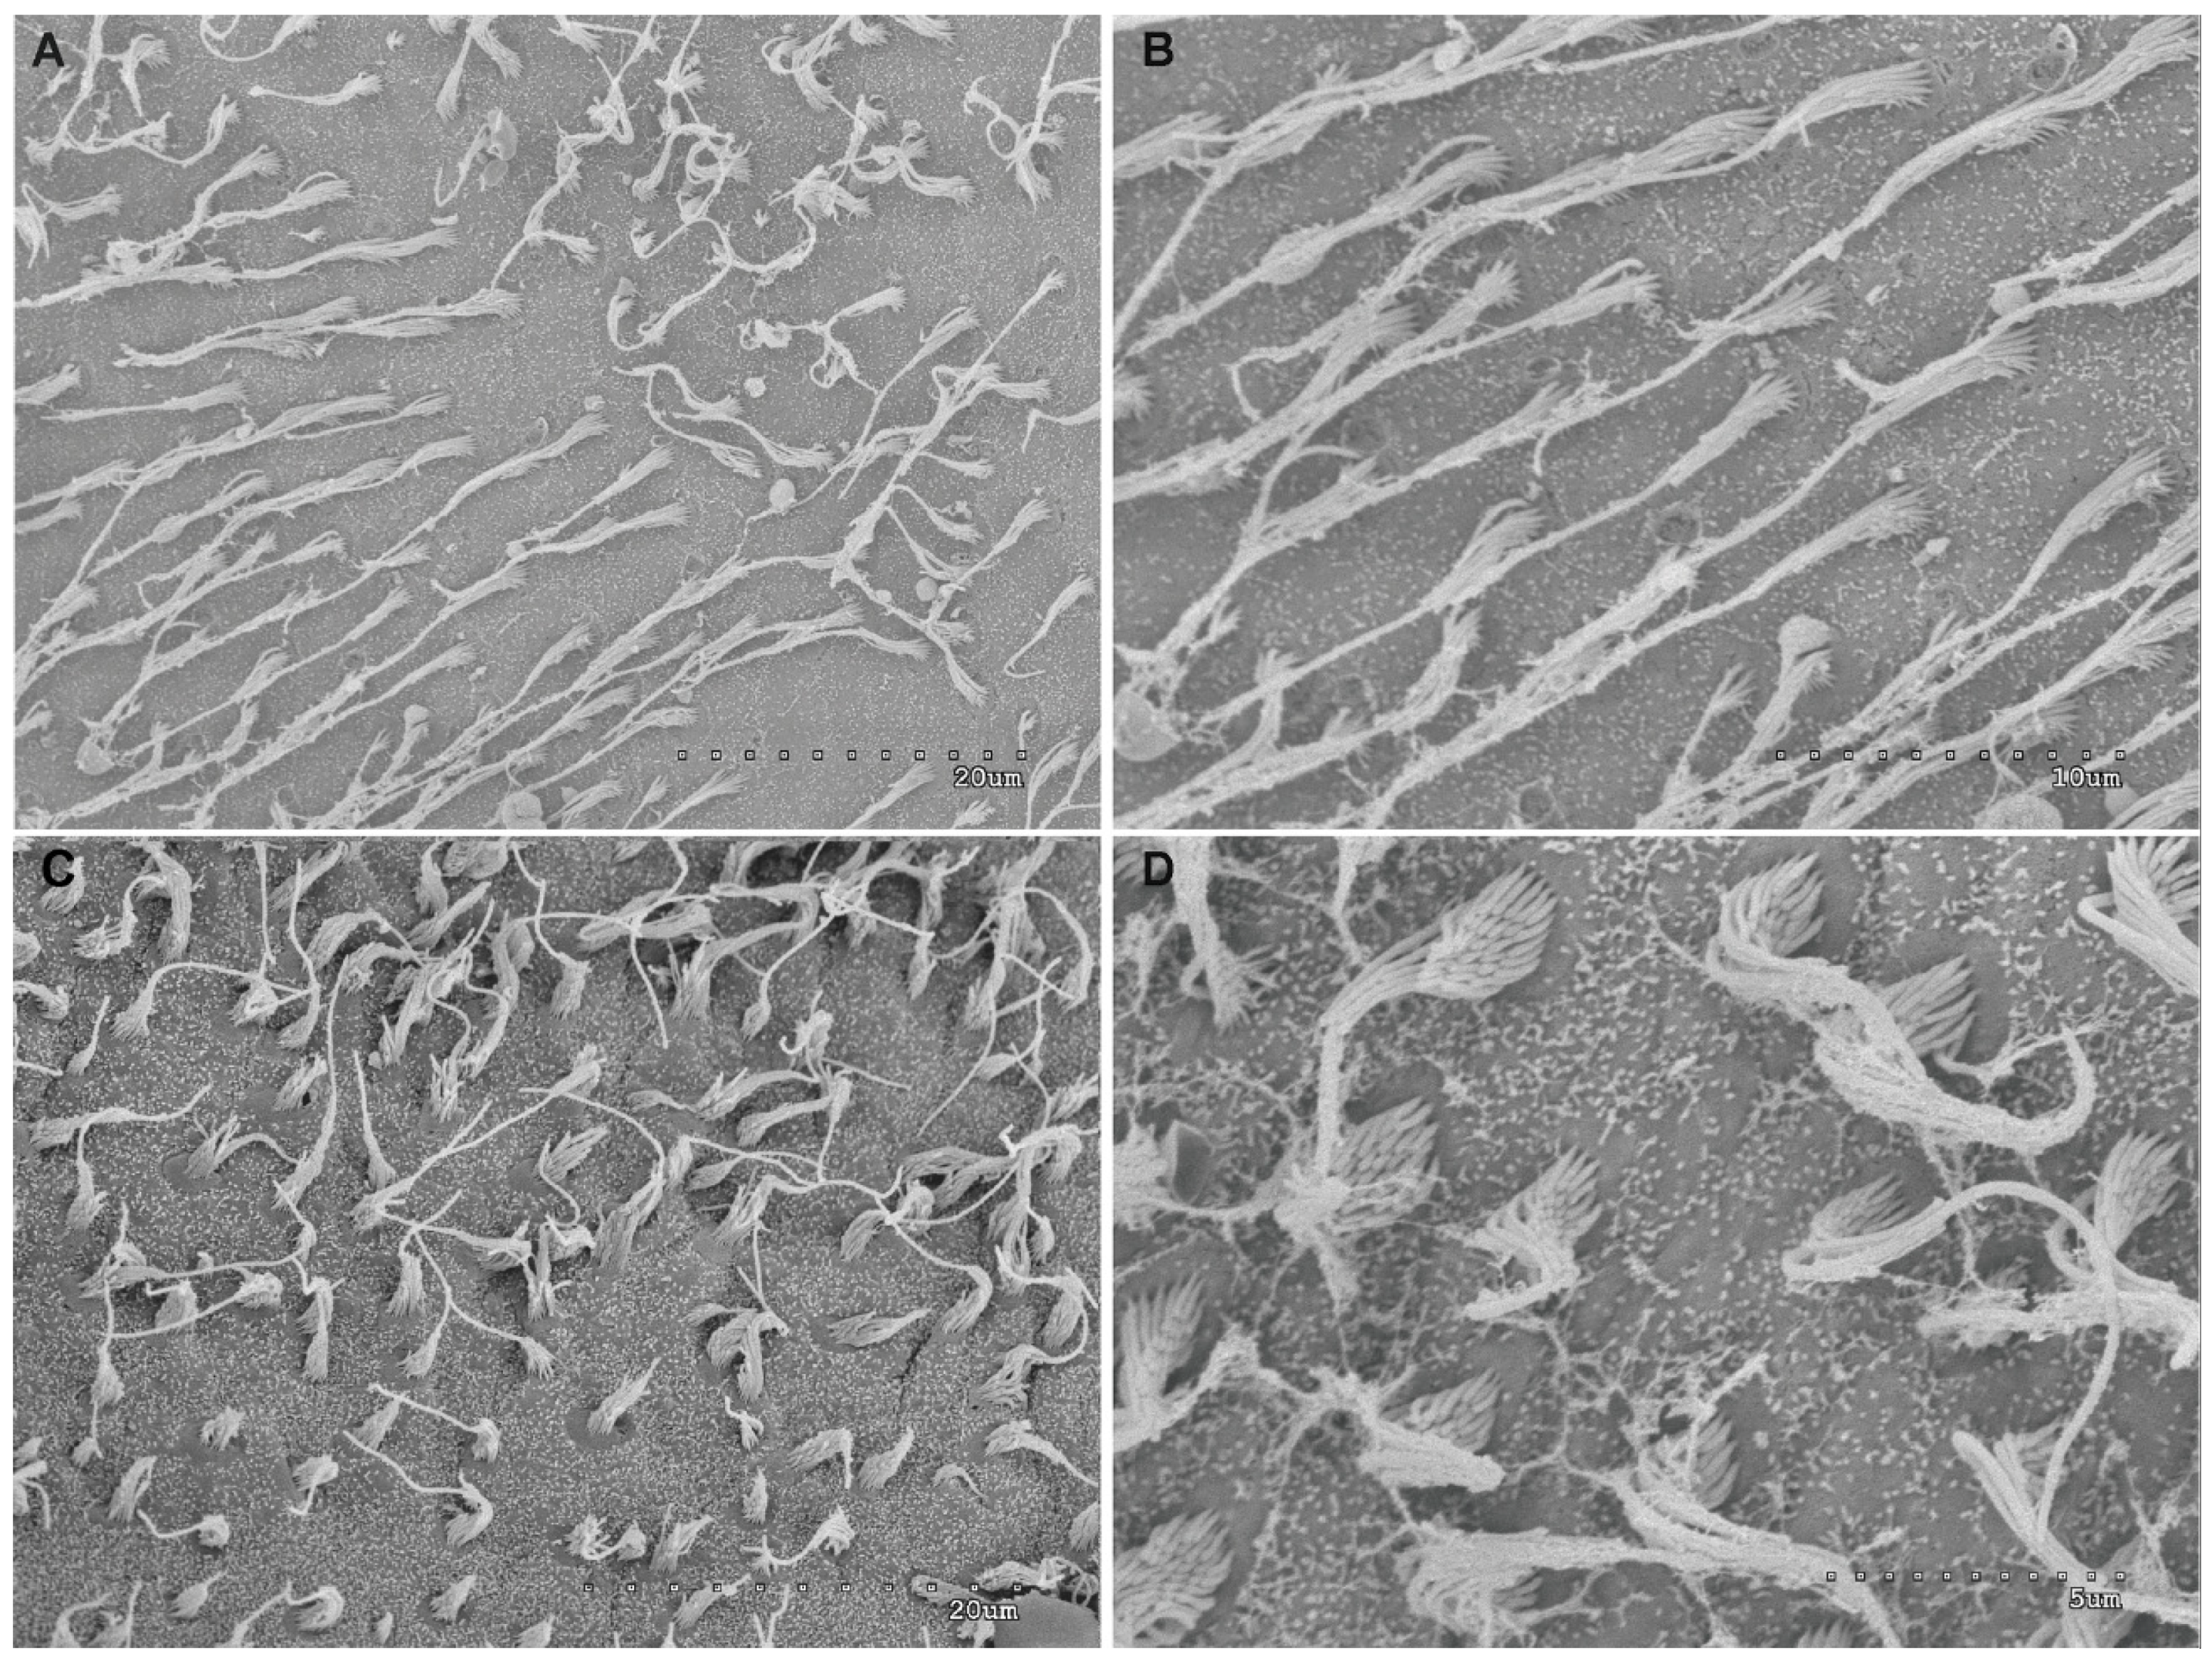
2.2.6. Analysis of Superficial Neuromasts of the Salmon Lateral Line by Scanning Electron Microscopy

A portion of the body containing lateral lines of all the fishes (48, control and exposed) were collected during the three weeks of sampling. Superficial neuromasts of the lateral line from individual fishes were observed by SEM imaging techniques to detect any possible alteration of the sensory epithelia. The samples were processed by routine SEM procedures.
Fixation was performed in glutaraldehyde 2.5% for 24–48 h at 4 °C. Samples were dehydrated in graded ethanol solutions and critical-point dried with liquid carbon dioxide in a Bal-Tec CPD030 unit (Leica Mycrosystems, Vienna, Austria). The dried specimens were mounted on specimen stubs with double-sided tape. The mounted samples were gold coated with a Quorum Q150R S sputter coated unit (Quorum Technologies, Laughton, East Sussex, UK) and viewed with a variable pressure Hitachi S-3500N scanning electron microscope (Hitachi High-Technologies Co., Tokio, Japan) at an accelerating voltage of 5 kV in the Institute of Marine Sciences of the Spanish Research Council (CSIC) facilities.

2.2.7. Salmon Gross Pathology and Histopathological Analysis

The salmon were subjected to a gross pathology and histological analysis to assess possible lesions in internal organs. The same procedure as in LAB experiments was followed to collect and analyse of the samples.
Salmon were anaesthetised and sacrificed with an overdose of 2-phenoxyethanol and spinal severance and were subjected to a gross pathology examination after a standardised necropsy procedure in order to identify potential external lesions or alterations. Particular attention was paid to identify lesions such as haemorrhages or other vascular disturbances and mainly in the swim bladder as these were the most frequently described lesions in previous papers.
Immediately after examination, samples of different tissues (liver, digestive system, swim bladder, spleen, kidney, gonads and skeletal musculature) were fixed in 10% buffered formalin. Fixed samples were processed for routine histological studies by progressive dehydration, clearing, embedding in paraffin, block sectioning, staining with haematoxylin and eosin (H/E) and examined under the microscope.

3. Results

3.1. Laboratory Experiments

3.1.1. Analysis of Salmon Otolith Organs by Scanning Electron Microscopy

The fish basic inner ear structure consists of three semicircular canals and their sensory epithelia, the cristae and three otolithic end organs (utricle, saccule, lagena) including their maculae with respective sensory epithelia, the macula saccule, the macula utricle and the macula lagena (Figure 5).
Otolith organs epithelia from individual fishes were observed through SEM imaging techniques to detect any possible alteration of the sensory epithelia. No effects were detected in any of the exposed animals nor in control animals. Figure 6, Figure 7 and Figure 8 show a healthy aspect of hair cells on the three epithelia from the different times of sample collection.

3.1.2. Quantification and Data Analysis

No significant differences were found between hair cell assessment in control and exposed animals during LAB experiments (Kruskal-Wallis test) (Figure 9).

3.1.3. Gross Pathology and Histological Analysis

The gross morphological (Figure 10) and histopathological analysis (Figure 11, Figure 12, Figure 13 and Figure 14) on sampled salmon did not show any lesions that could be associated to sound exposure. All dissected salmon were presenting a completely normal aspect.

3.1.4. Behavioural Observations

No behavioural reaction was observed before, during and after the sound exposure. No jumps, rolls and twitches were observed during the 10 min of observation on each period of analysis. A major proportion of salmon acquired a perpendicular position near to the transducer when it was placed in the tank and maintained this position during the entire experiment. The rest of the fishes placed themselves counter current in the tank while the sound exposure was performed. All salmon were observed eating consistently over the whole experimental period (Figure 15).

3.2. Sea Trial Experiments

3.2.1. Analysis of Salmon Otolith Organs by Scanning Electron Microscopy

Otolith organs observed by SEM imaging techniques did not show any alteration on the sensory epithelia. Figure 16, Figure 17 and Figure 18 show a healthy aspect of hair cells on the three epithelia at different times of sample collection at sea trials.

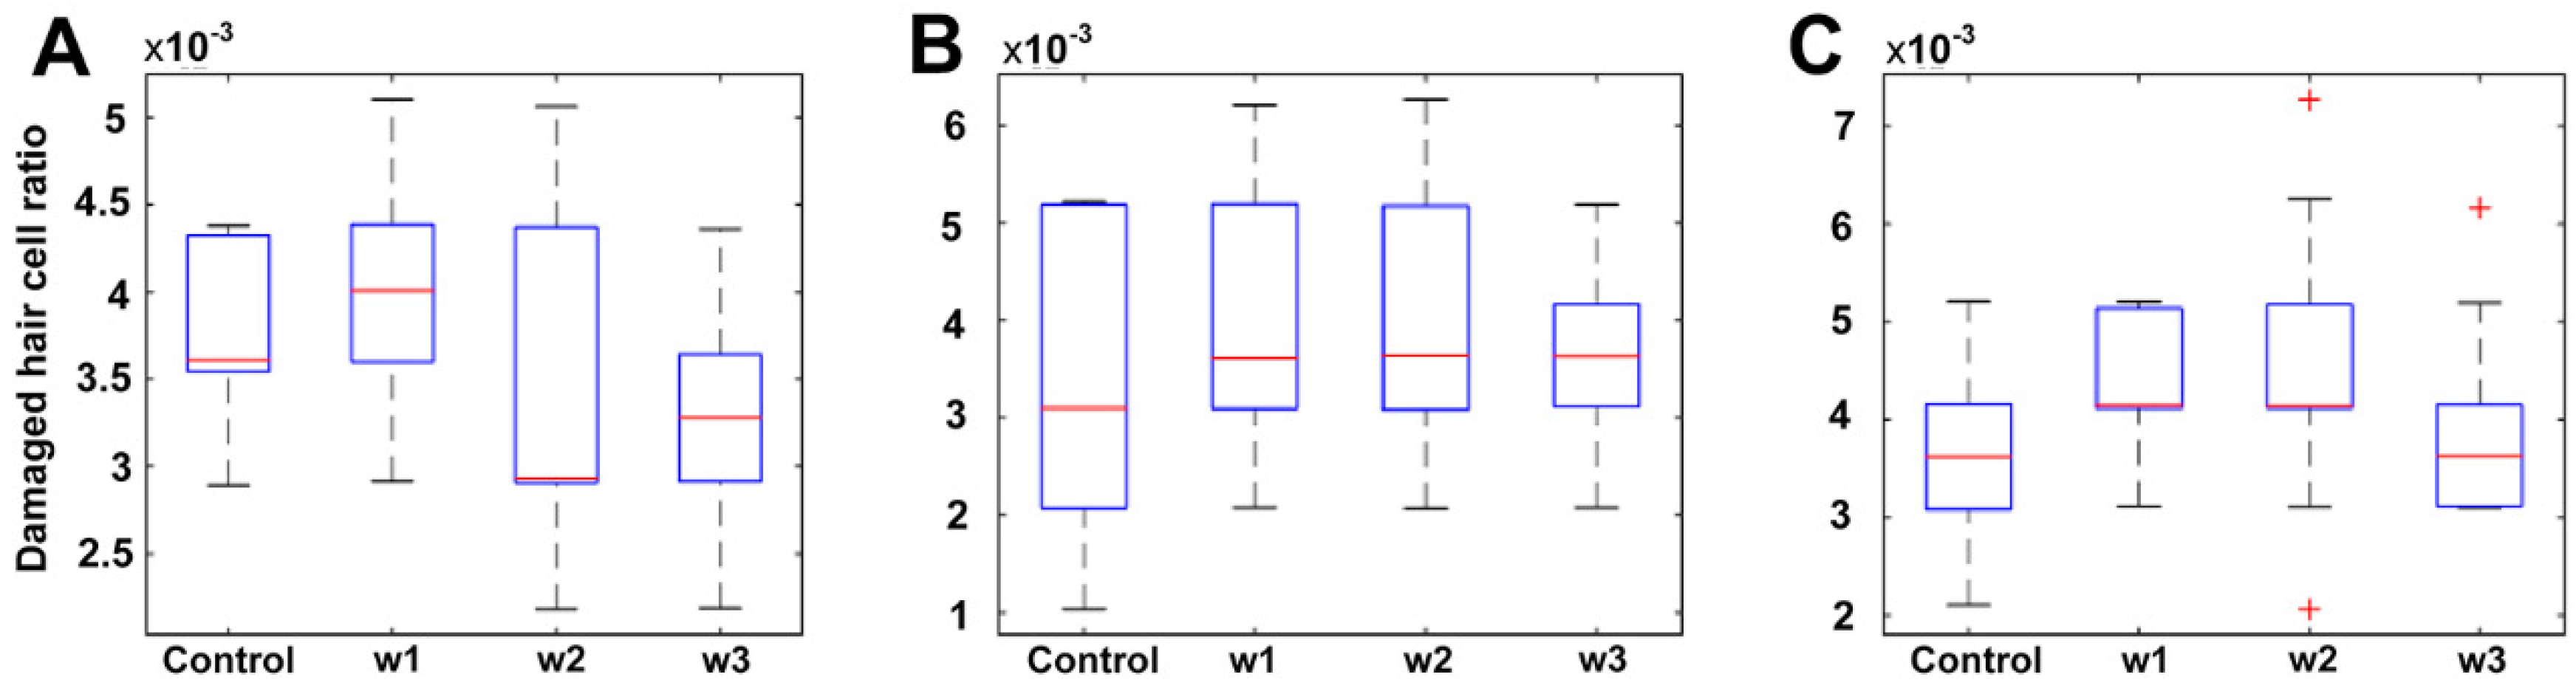
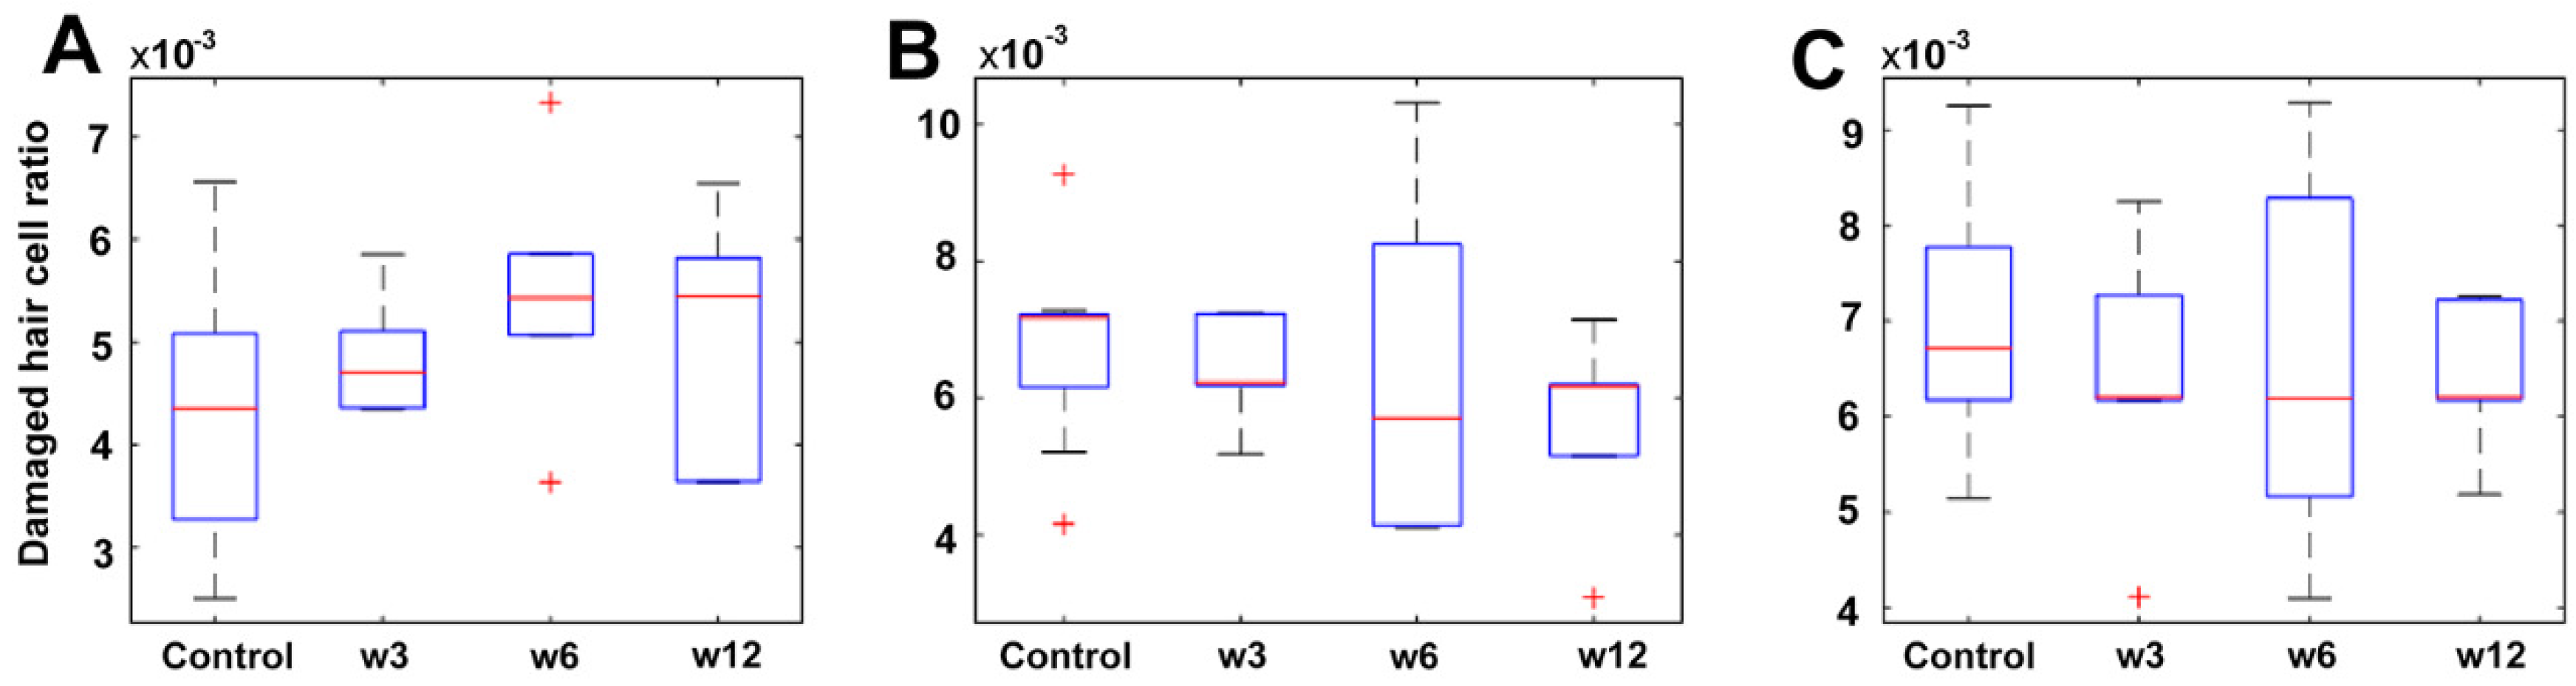
3.2.2. Quantification and Data Analysis

No significant differences were found between hair cell assessment during control and exposed animals at sea trial experiments (Kruskal–Wallis test). (Figure 19).

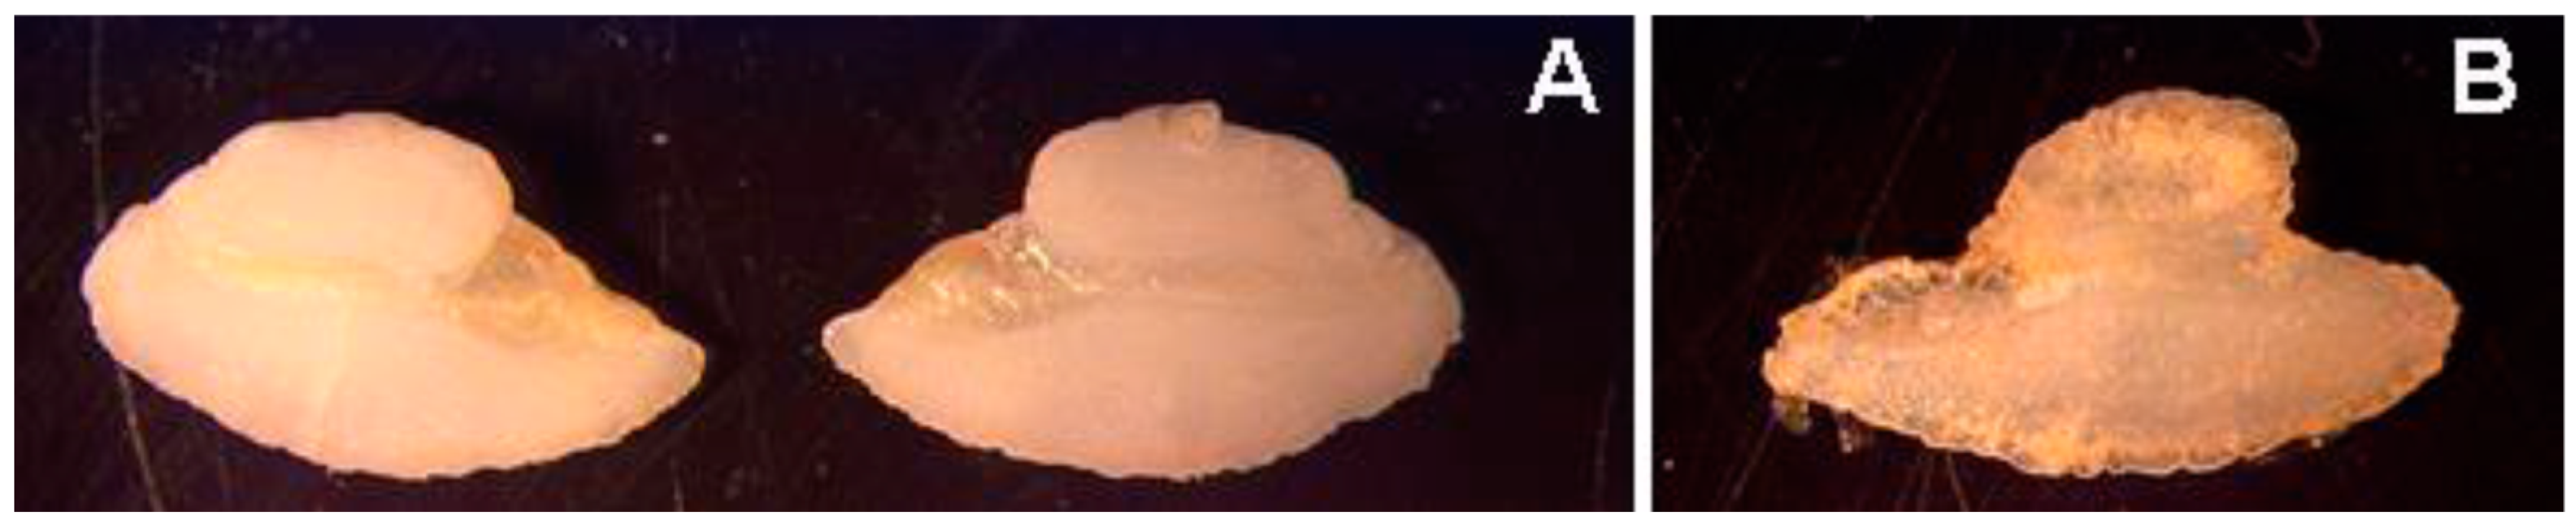
3.2.3. Analysis of Salmon Otolith

Vaterite incidence on salmon otoliths (Figure 20) did not present a linear pattern over time (Table 1). The percentage of fish affected increased in week 3 (75%) and week 6 (83, 3%), and decreased in the week 12 (16, 6%) (Figure S2A,B, Supplemental Material). Considering the total incidence of vaterite in the sampled fishes, there were more otoliths affected (65, 6%) than otoliths with no vaterite (34, 3%) (Figure S2C). Right otoliths were more likely to be vateritic than left otoliths, with 52% and 48% of otoliths showing vaterite formation. Out of all fish sampled, 9, 4% had two vateritic otoliths (Figure S2D,E). Considering the total incidence of vaterite on the sampled fishes, the proportion otolith affected by vaterite in control cages (75%) was higher than in exposed cages (50%) (Figure S2F). The analysis of the vaterite presence in otoliths was not related to sound exposure, but to a deficiency in nutrition associated to captivity (Table 1).

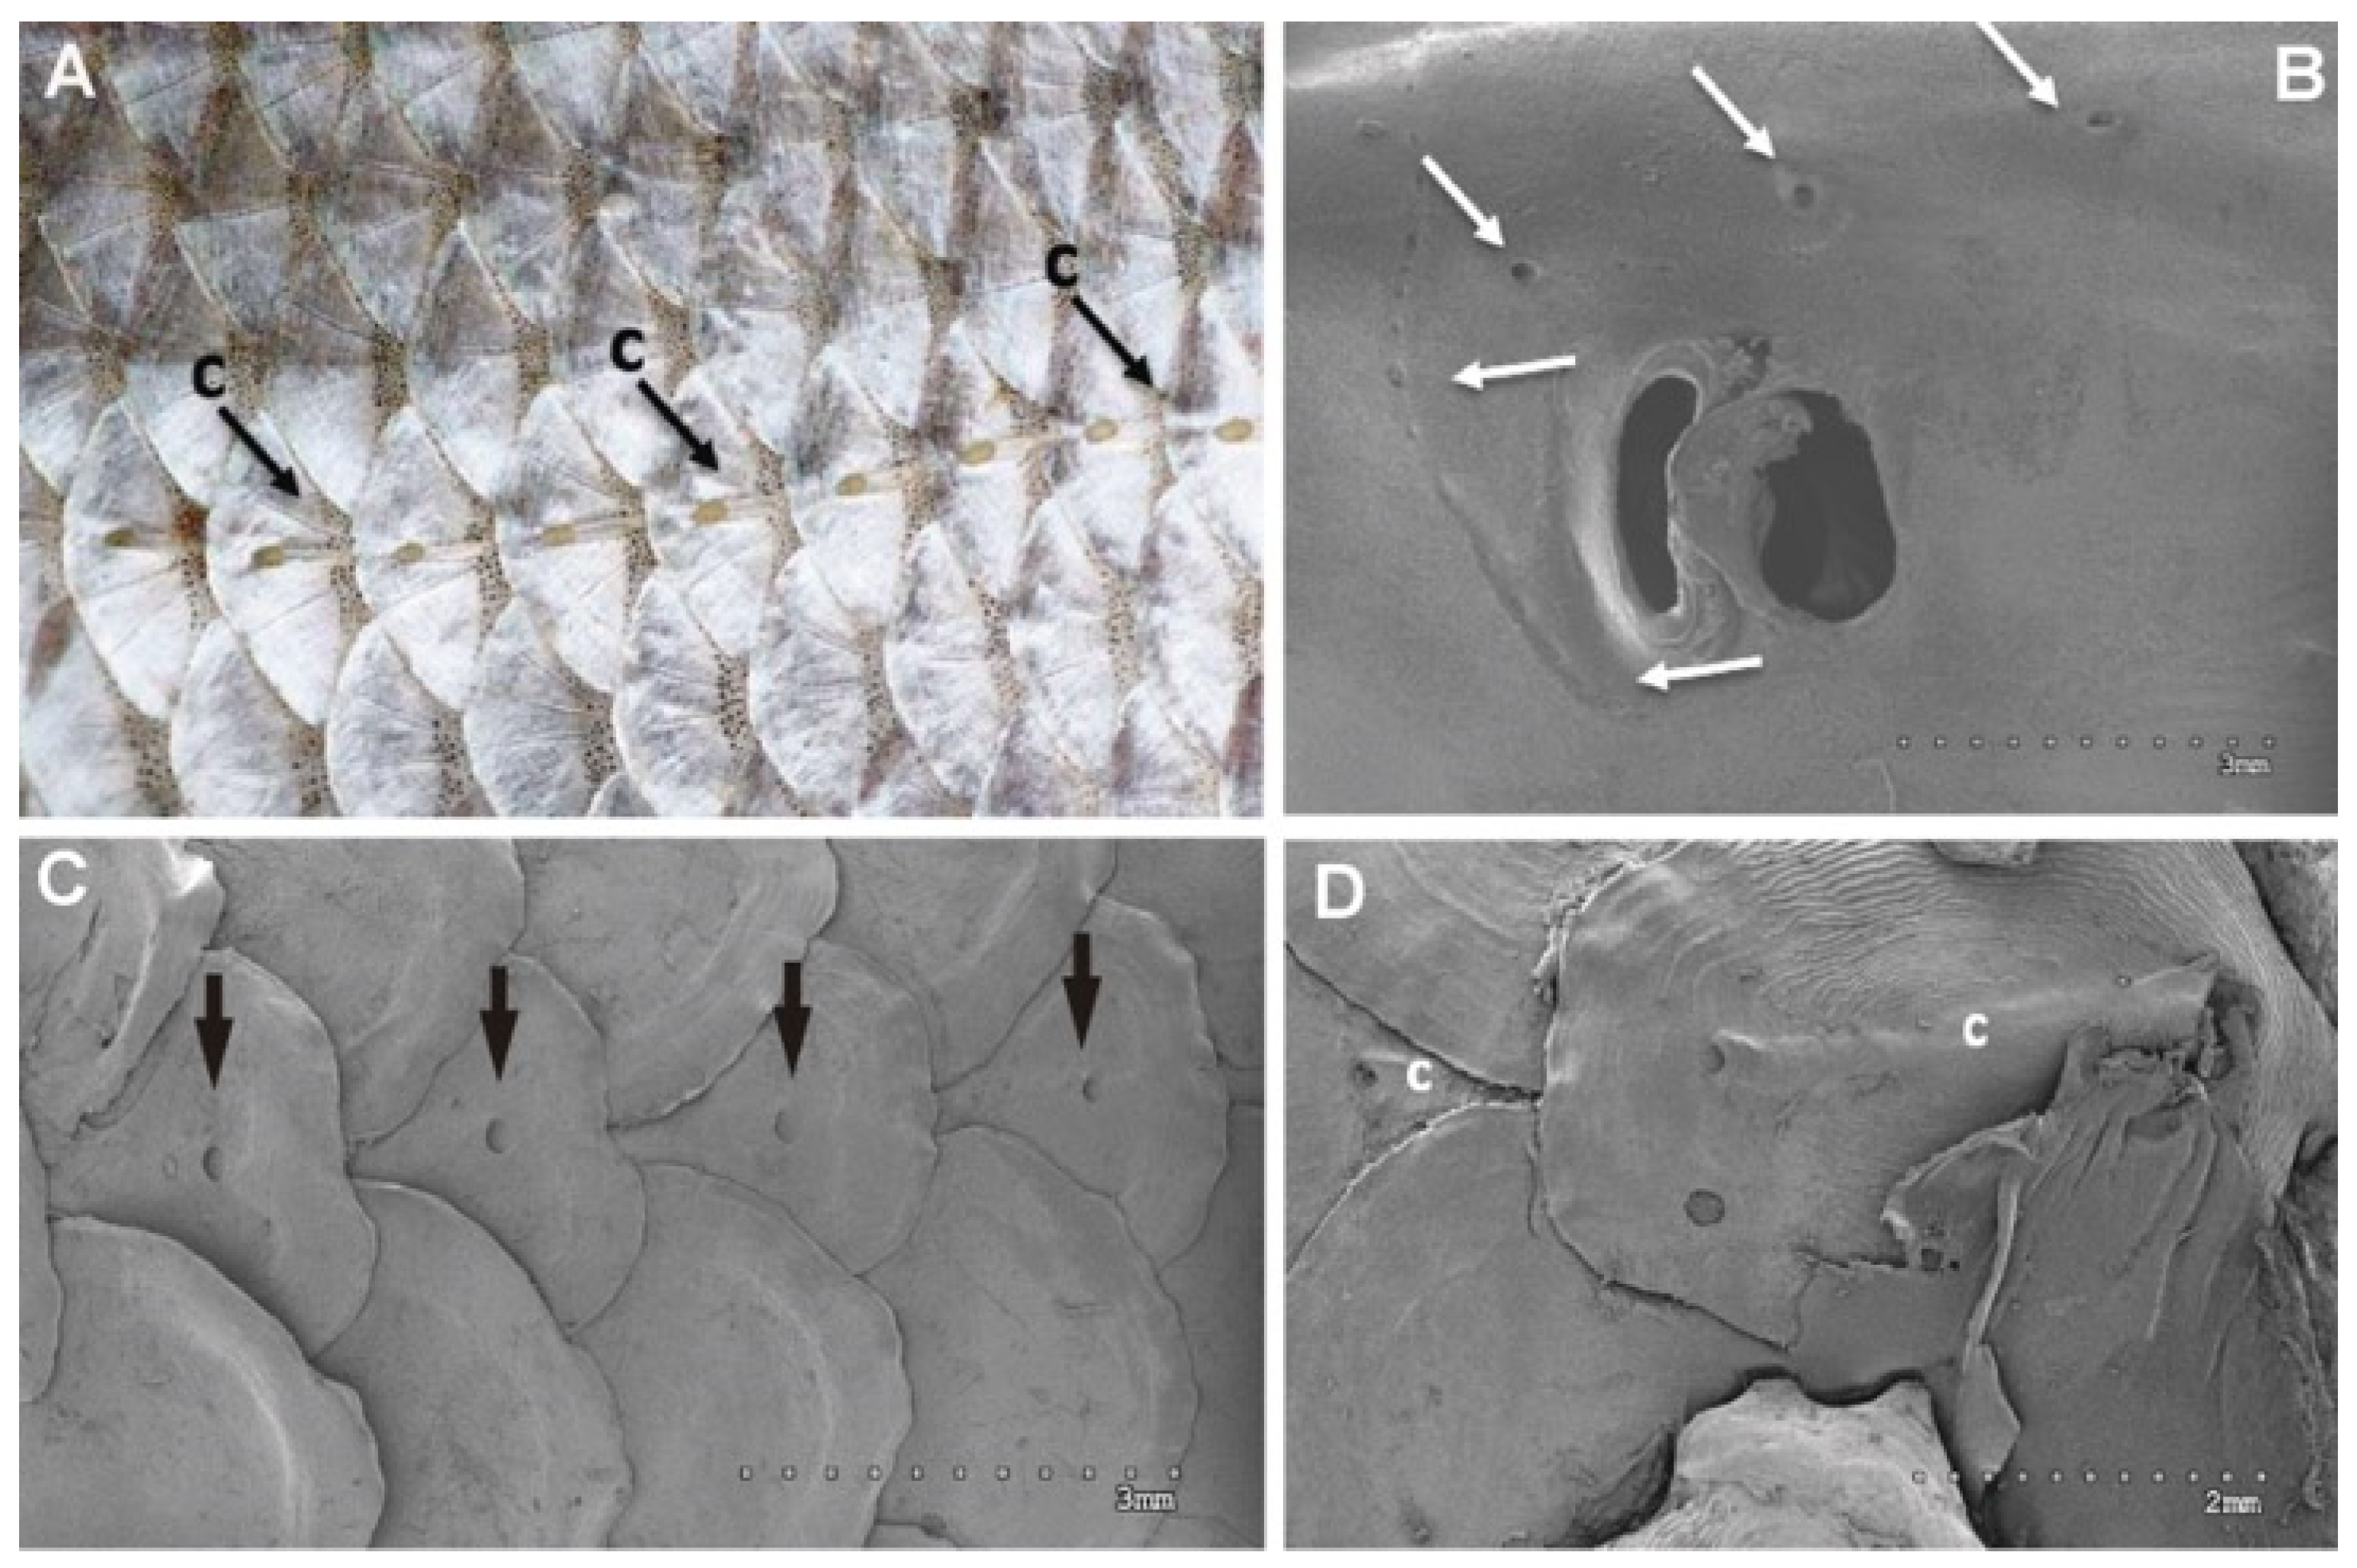
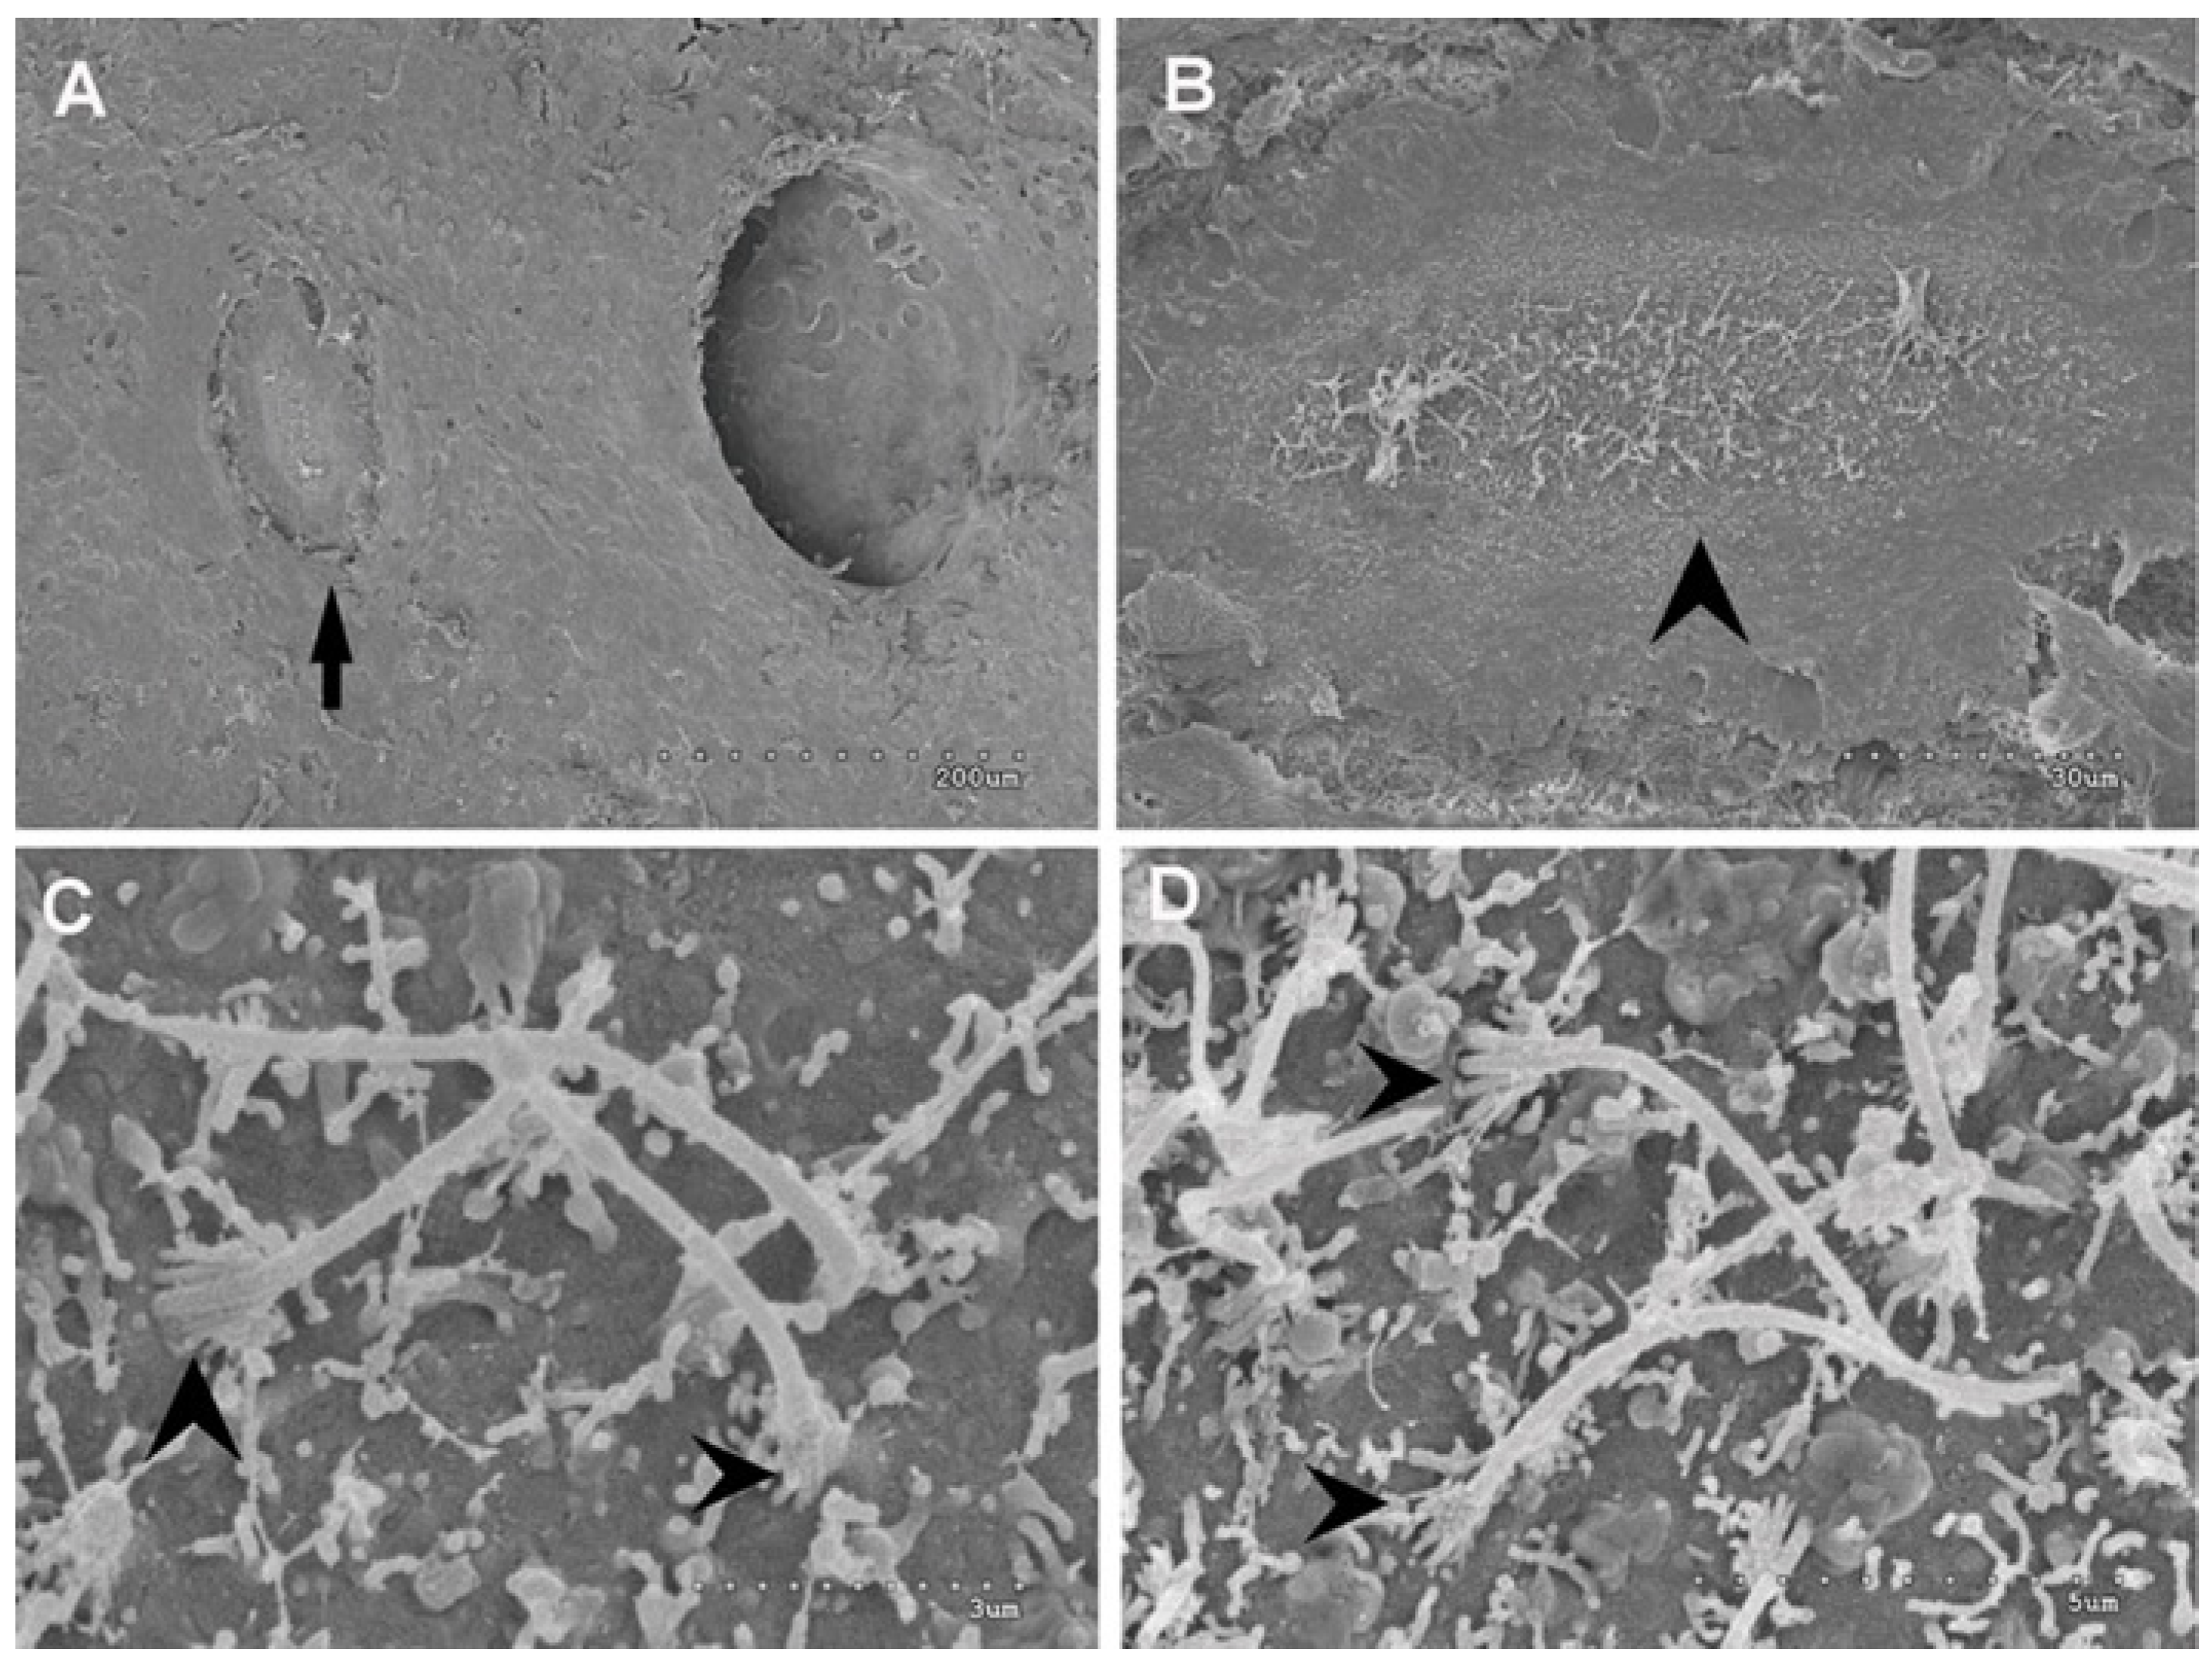
3.2.4. Analysis of Superficial Neuromast of the Salmon Lateral Line by Scanning Electron Microscopy

Neuromasts are either contained in canals or are located on the epithelium of the head, trunk and tail. Each lateral line scale has a single canal neuromast and three groups of superficial neuromasts (Figure 21). In comparison with control animals the lateral line superficial neuromasts observed by SEM imaging techniques did not show any alteration of the sensory epithelia (Figure 22) in exposed salmon.

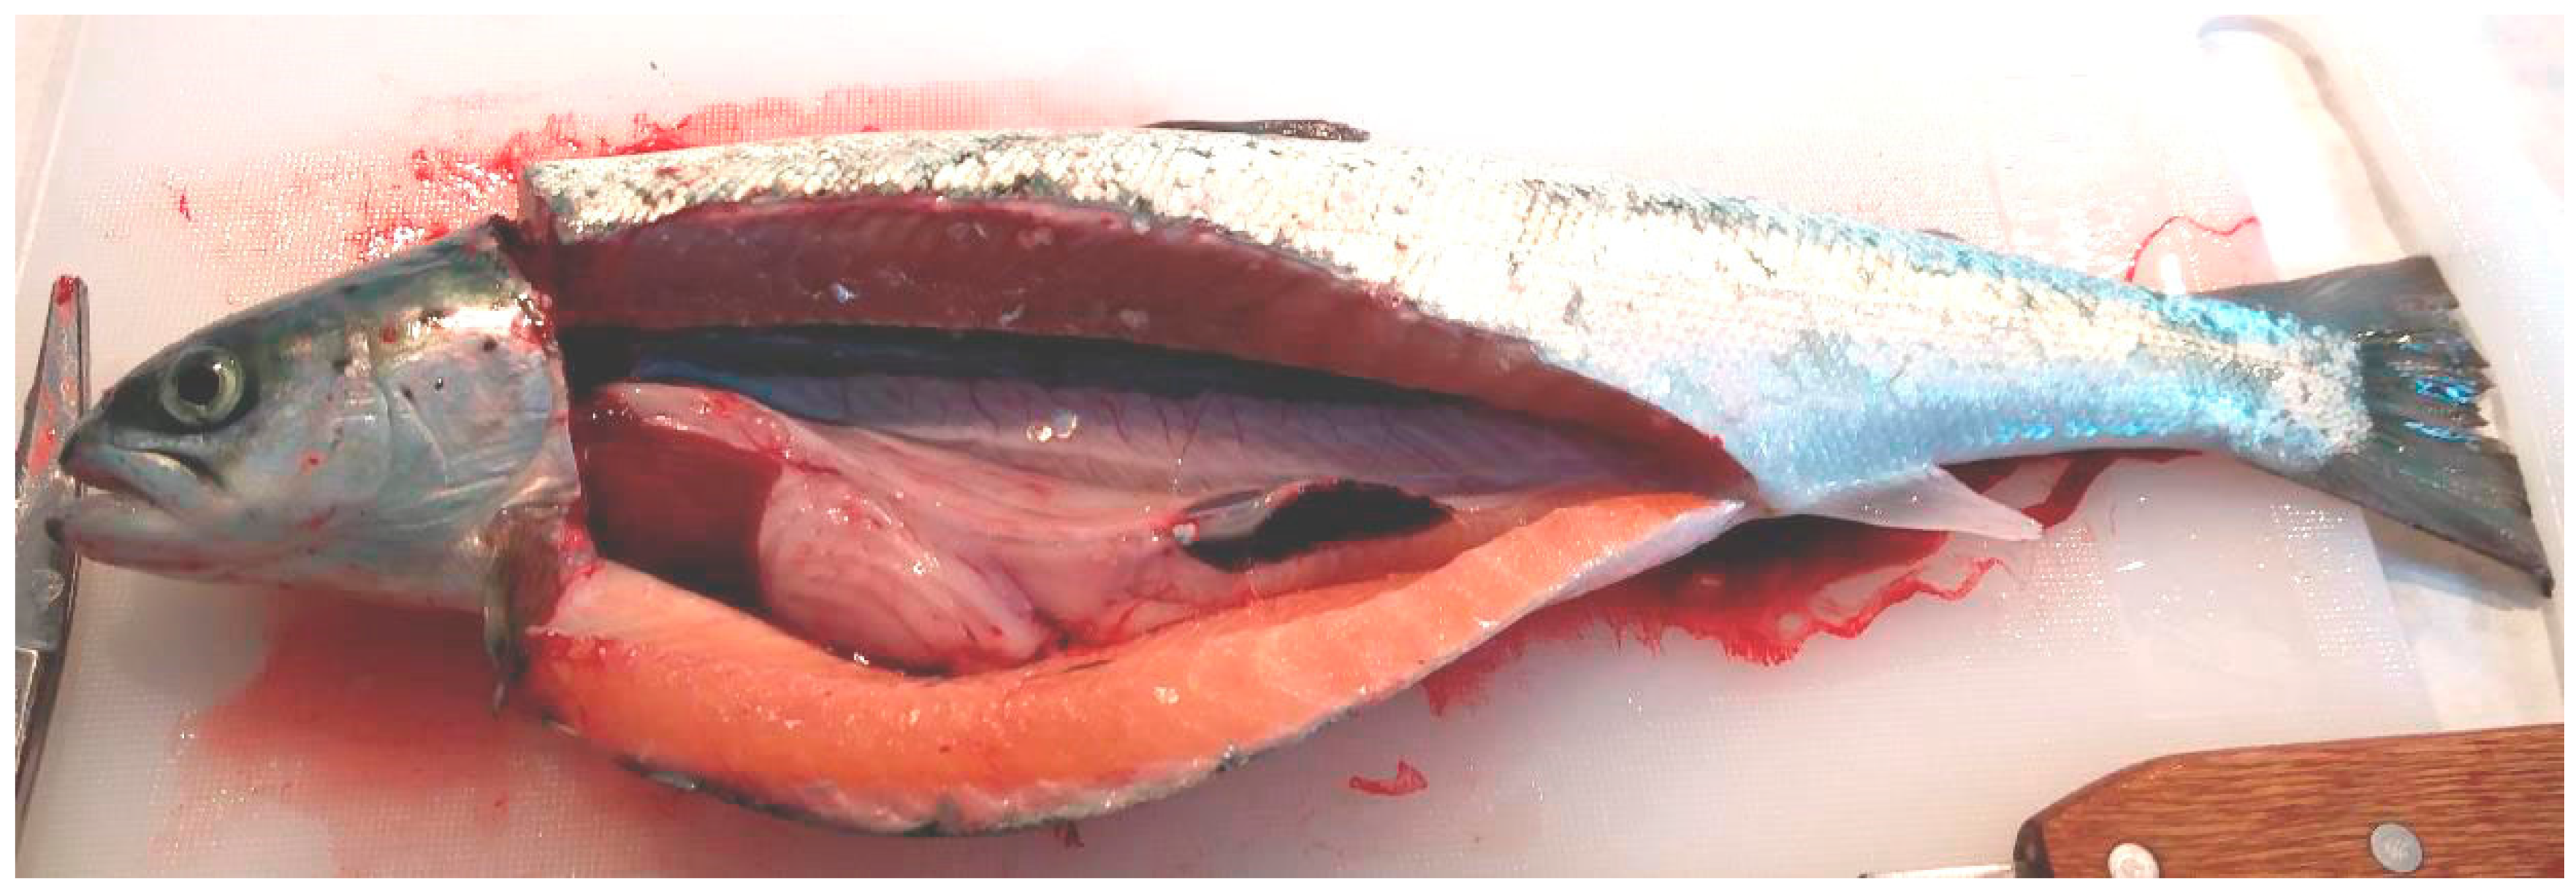
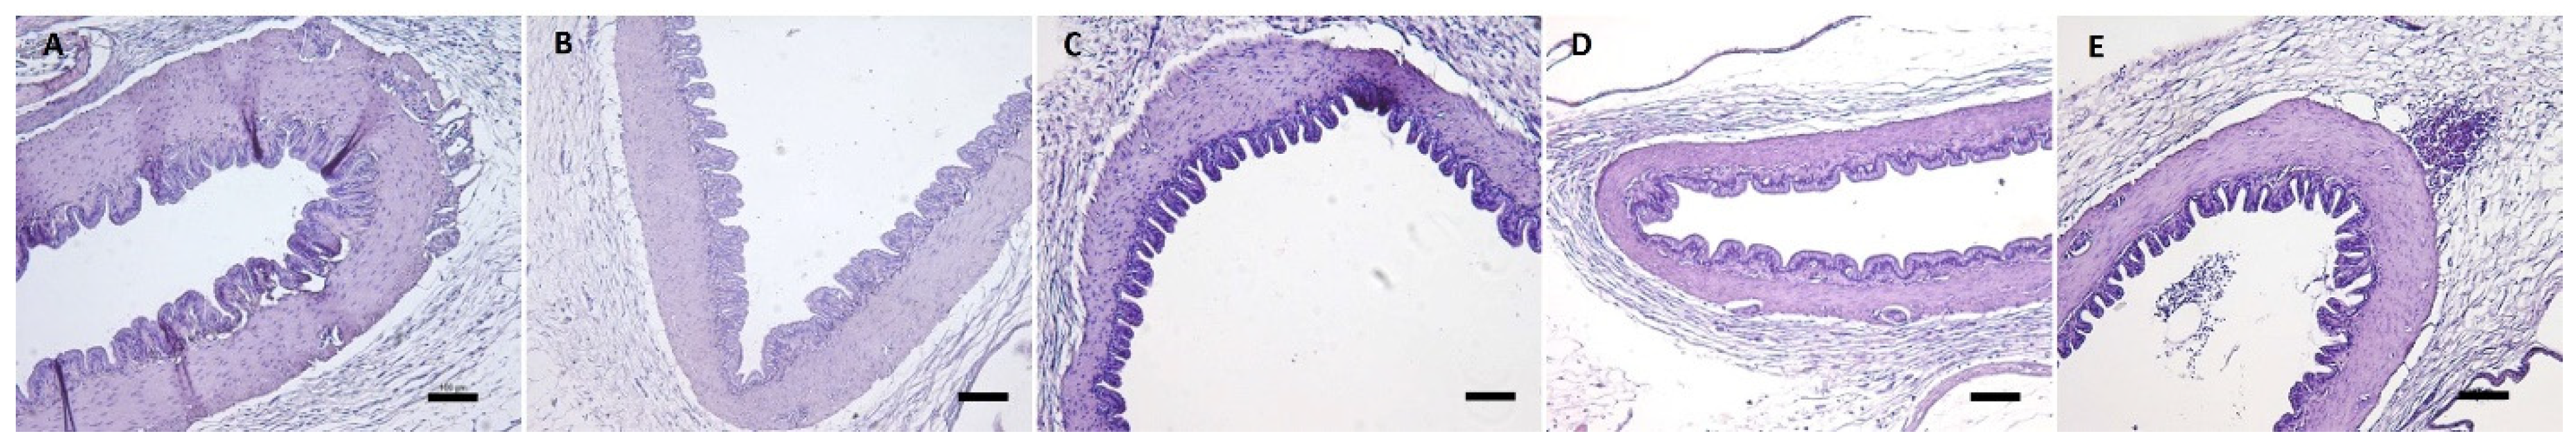
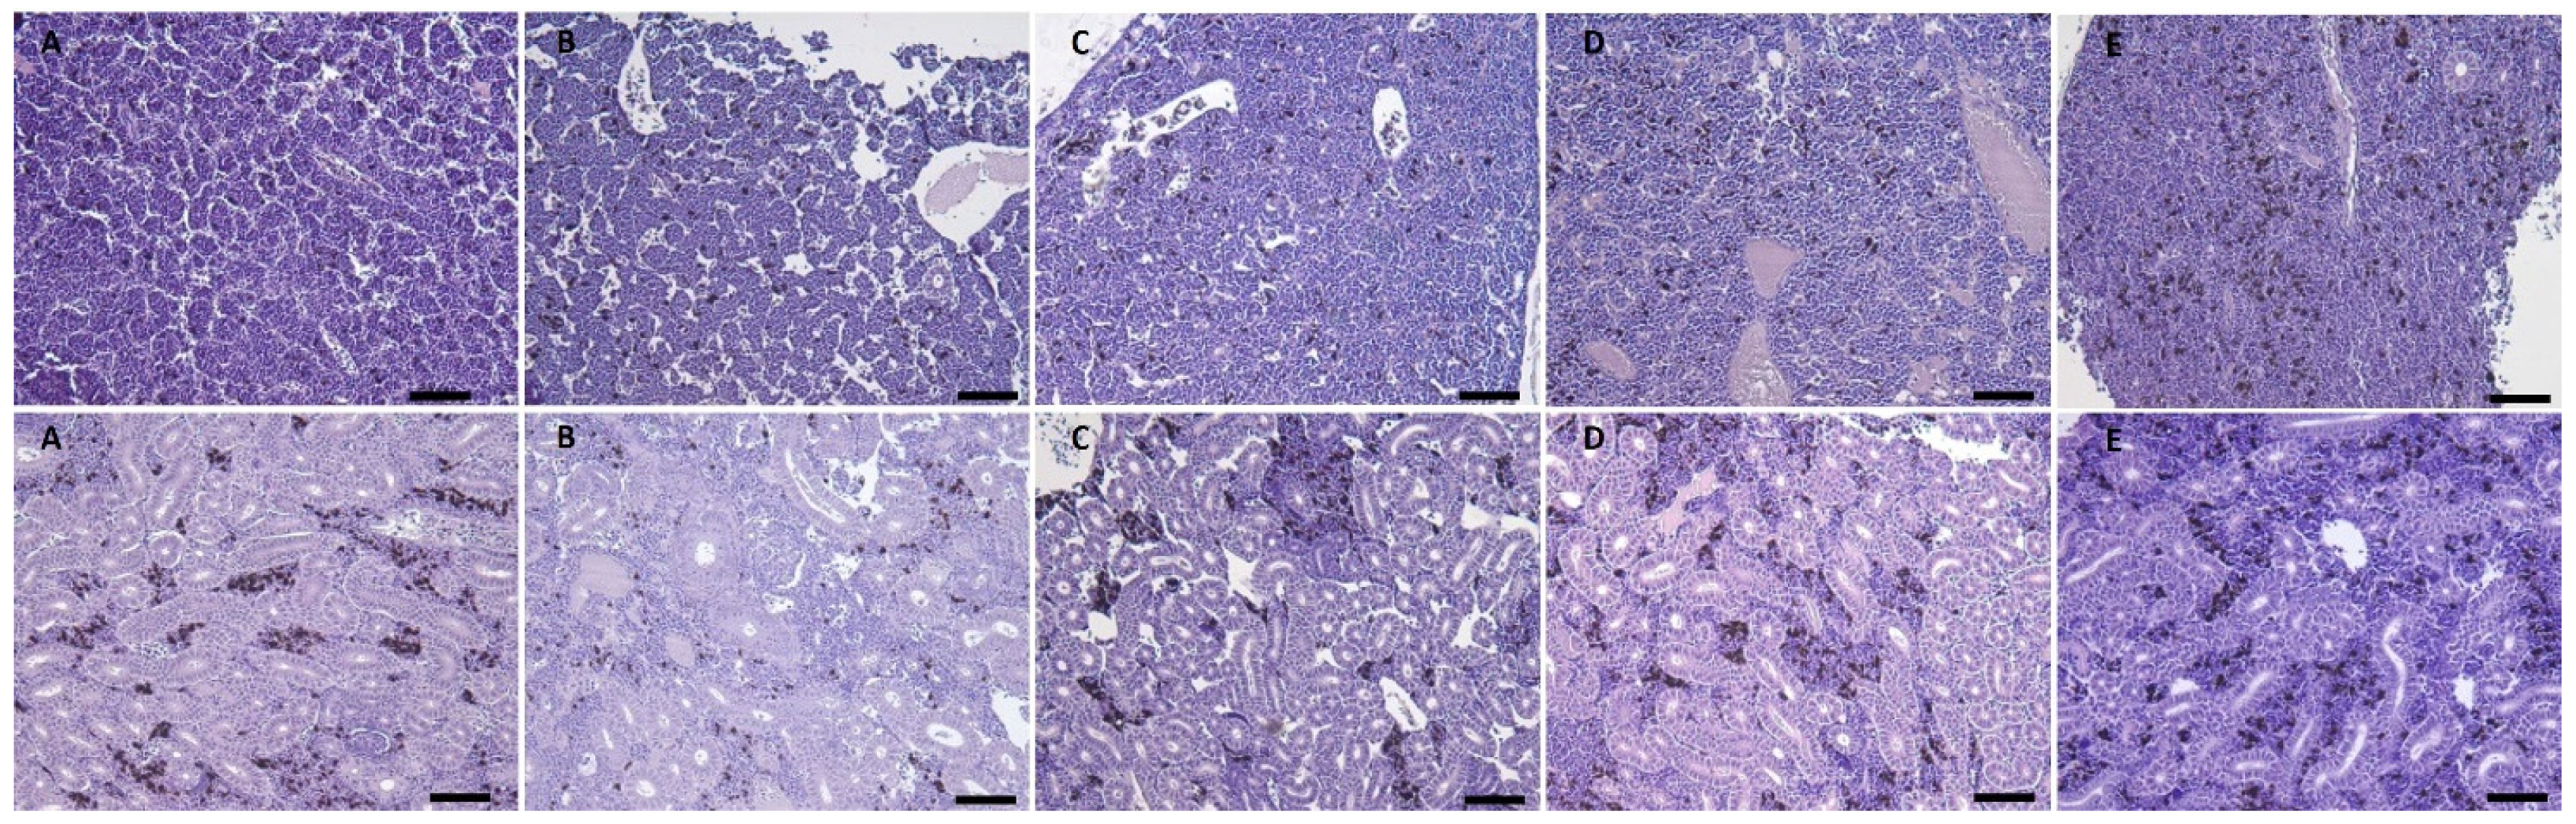
3.2.5. Gross Pathology and Histological Analysis

No macroscopic pathology nor histopathological alteration were observed in any of the tissue analysed that could be associated to sound exposure, exactly in the same way to those observed in LAB experiments. See Figure S3 (Supplementary Material) as an example of the normal aspect of the swim bladder of salmon (the most sensitive organ to sound exposure) throughout the samplings of the sea trial.

4. Discussion

The use of acoustic methods as an effective new approach to address sea lice infestation (L. salmonis) should first ensure that these methods do not negatively affect the fish. In this context, the present results showed that salmon exposed to sound with the same characteristics as previous lice exposure experiments [3] did not present any lesion in internal organs, nor in the otolith and lateral line sensory epithelia and they also did not induce behavioural alterations. We did not find an increase in mortality due to sound exposure, which is consistent with some previous experiments of sound exposure where much higher sound levels (e.g., pile driving and airgun) [11,12,15,16,17] did not show an effect on fish survival.
Although some authors reported sensory epithelia cell loss in the otolith organ after sound exposure [8,10,23], our analysis did not reveal any damage in auditory tissues. We proceeded to analyse the vaterite proportion of the otoliths. Sagittal otoliths are essential components of the sensory organs that are composed of calcium carbonate. In abnormal otoliths, aragonite (the normal crystal form) is replaced with vaterite that decreases hearing sensitivity, reducing growth rates [14]. In some Chinook salmon studies vateritic sagittae were bigger and less dense than the aragonitic form, and vaterite presence was associated with moderately altered saccular epithelia and a significant decrease in auditory sensitivity [24]. The functional cause of the degradation remains speculative and a variety of physiological factors may be involved. Among other hypotheses the most likely explanation is that hearing loss is caused by the lower density of the vaterite otoliths, which could induce a decrease in the differential movement between the saccular epithelium and its otolith. It would require a higher force to stimulate the sensory epithelium and trigger a neural response and, therefore, auditory sensitivity would be reduced [24].
After assessment (in our samples the otolith proportion that was affected by vaterite in control cages was higher than in exposed cages) we concluded that differences of the vaterite presence in otoliths had no relation with sound exposure, but was probably explained by a deficiency in nutrition associated to captivity as has been shown in previous studies [14].
In terms of behaviour, despite minor and non-permanent behavioural responses were reported (small level of startle response with habituation at subsequent exposures) to very high sound levels produced by air-guns (196 dB re 1 μPa at 1 m from the source) [16,17] we did not find any change in the behaviour of the salmon.
In addition, the lateral line superficial neuromasts did not show any alteration in the sensory epithelia. Acoustic trauma was, however, observed in larval zebrafish lateral line hair cells using underwater cavitation to stimulate a response [25].
Gross pathology and histopathological analysis on salmon did not show any lesion that could be associated to sound exposure. Some works have described different pathologies associated to sound exposure. Various levels of barotrauma after sound exposure—mild injuries (eye haemorrhage, fin haematoma), moderate injuries (liver haemorrhage, bruised swim bladder), and mortal injuries (intestinal haemorrhage and kidney haemorrhage)—were observed after exposing Chinook salmon (Oncorhynchus tshawytscha) to impulsive pile-driving sounds using a high-intensity controlled impedance fluid filled wave tube [26]. However, the sound exposure level received during this experiment greatly exceeded the levels we reached in our study. None of these consequences were observed during our experiments. Parasitic sea lice (L. salmonis) infestations are one of the most important concerns in salmonid farming, reducing productivity and causing economic losses to the aquaculture industry (around 0.39 € per kg of salmon produced) [27,28]. Currently the most common treatment against salmon lice are chemicals. The pharmaceuticals currently used for the control of sea lice (cypermethrin, deltamethrin, azamethiphos, hydrogen peroxide) are applied through in situ immersion treatments [28]. Although these treatments have been effective in managing sea lice outbreaks, they have negative effects on fish welfare, reducing appetite and growth. Furthermore, over time salmon lice have built up a resistance to the three major classes of chemicals being used [29]. In addition, these pharmaceuticals are released into the surrounding environment, exposing non-target species to lethal and sub-lethal doses, and are harmful to the human health [28]. Other methods (e.g., in-feed treatments and use of skirts) are very expensive. Skirts have low impact on salmon welfare and the environment but reduce oxygen flow, affecting the respiratory functions of fish. From this perspective, this exhaustive assessment of the effects of acoustic treatment against lice infestation on salmon confirmed that the chosen sound dose did not affect the exposed fish and, therefore, confirmed it as a potentially safe and sustainable protocol to address the problem.

Supplementary Materials

The following are available online at www.mdpi.com/article/10.3390/jmse9101114/s1, Figure S1: Salmon tanks and refrigeration system; Figure S2: Incidence of vaterite on the salmon otoliths. (A,B) Incidence of vaterite versus time. (C) Incidence of vaterite on total sampled fishes. (D) Incidence of vaterite in right and left otolith on total sampled fishes. (E) Incidence of vaterite on right and left otolith versus time. (F) Incidence of vaterite on total sampled fishes versus control/exposed cages; Figure S3: Swimbladder with normal aspect of salmons from sea trial experiment. (A) Control. (B) 3 weeks after exposure. (C) 6 weeks after exposure. (D) 9 weeks after exposure. (E) 12 weeks after exposure. Scale bar: 100μm.

Author Contributions

M.S. and M.A. planned the research and designed the study. M.S., M.A. and M.v.d.S. conducted experimental/lab work. M.S. and M.A. conducted sea trial work. A.L. and M.S. performed the otolith organ dissection. M.S. and J.-M.F. performed SEM analysis. M.C. and F.P. performed the histopathological examination. M.S. and M.v.d.S. analysed the data. M.S. and M.v.d.S. prepared the figures. M.S. wrote the article and all authors reviewed the manuscript. All authors have read and agreed to the published version of the manuscript.

Funding

Funding for this project was provided by SEASEL SOLUTIONS AS. Project: An acoustic and Bioacoustic solution to sea lice infestation on salmon- P.O.BOX 93 N-6282 BRATTVÅG. Norway.

Institutional Review Board Statement

The experimental protocol strictly followed the necessary precautions to comply with current ethical and welfare considerations when dealing with animals in scientific experimentation (Royal Decree 1386/2018, of 19 November). This process was also carefully analysed and approved by the Ethical Committee for Scientific Research of the Technical University of Catalonia, BarcelonaTech (UPC) (approval code B9900085).

Informed Consent Statement

Not applicable.

Acknowledgments

We would like to thank the staff of Mowi Fish Feed A/S Avd Averøy for their assistance and helpful cooperation on Sea trials experiments.

Conflicts of Interest

The authors declare no conflict of interest.

References

  1. Iversen, A.; Hermansen, Ø.; Andreassen, O.; Brandvik, R.K.; Marthinussen, A.; Nystøyl, R. Cost Drivers in Salmon Farming; Trondheim. 2015. Available online: https://nofima.no/en/pub/1281065/ (accessed on 13 October 2021).
  2. Barrett, L.T.; Oppedal, F.; Robinson, N.; Dempster, T. Prevention not cure: A review of methods to avoid sea lice infestations in salmon aquaculture. Rev. Aquac. 2020, 12, 2527–2543. [Google Scholar] [CrossRef]
  3. Solé, M.; Lenoir, M.; Fortuño, J.M.; De Vreese, S.; van der Schaar, M.; André, M. Sea Lice are sensitive to low frequency sounds. J. Mar. Sci. Eng. 2021, 9, 765. [Google Scholar] [CrossRef]
  4. Harding, H.; Bruintjes, R.; Radford, A.N.; Simpson, S.D. Measurement of Hearing in the Atlantic Salmon (Salmo salar) Using Auditory Evoked Potentials, and Effects of Pile Driving Playback on Salmon Behaviour and Physiology; Marine Scotland Science: Aberdeen, UK, 2016; Volume 7, 47p. [CrossRef]
  5. Smith, M.E.; Kane, A.S.; Popper, A.N. Noise-induced stress response and hearing loss in goldfish (Carassius auratus). J. Exp. Biol. 2004, 207, 427–435. [Google Scholar] [CrossRef] [PubMed] [Green Version]
  6. Popper, A.N.; Smith, M.E.; Cott, P.A.; Hanna, B.W.; MacGillivray, A.O.; Austin, M.E.; Mann, D.A. Effects of exposure to seismic airgun use on hearing of three fish species. J. Acoust. Soc. Am. 2005, 117, 3958–3971. [Google Scholar] [CrossRef] [PubMed] [Green Version]
  7. Hastings, M.C. Coming to terms with the effects of ocean noise on marine animals. Acoust. Today 2008, 4, 22–34. [Google Scholar] [CrossRef]
  8. McCauley, R.D.; Fewtrell, J.; Popper, A.N. High intensity anthropogenic sound damages fish ears. J. Acoust. Soc. Am. 2003, 113, 638–642. [Google Scholar] [CrossRef] [PubMed] [Green Version]
  9. Uribe, P.M.; Sun, H.; Wang, K.; Asuncion, J.D.; Wang, Q.; Chen, C.W.; Steyger, P.S.; Smith, M.E.; Matsui, J.I. Aminoglycoside-induced hair cell death of inner ear organs causes functional deficits in adult zebrafish (Danio rerio). PLoS ONE 2013, 8, e58755. [Google Scholar] [CrossRef]
  10. Smith, M.E.; Schuck, J.B.; Gilley, R.R.; Rogers, B.D. Structural and functional effects of acoustic exposure in goldfish: Evidence for tonotopy in the teleost saccule. BMC Neurosci. 2011, 12, 19. [Google Scholar] [CrossRef] [PubMed] [Green Version]
  11. Nedwell, J.R.; Turnpenny, A.W.H.; Lovell, J.M.; Edwards, B. An investigation into the effects of underwater piling noise on salmonids. J. Acoust. Soc. Am. 2006, 120, 2550–2554. [Google Scholar] [CrossRef]
  12. Ruggerone, G.T.; Goodman, S.E.; Miner, R. Behavioral Response and Survival of Juvenile Coho Salmon to Pile Driving Sounds; Natural Resources Consultants, Inc.: Seattle, DC, USA, 2008; Available online: http://home.comcast.net/∼ruggerone/FishTerminal%0APileDriveStudy.pdf (accessed on 13 October 2021).
  13. Casper, B.M.; Smith, M.E.; Halvorsen, M.B.; Sun, H.; Carlson, T.J.; Popper, A.N. Effects of exposure to pile driving sounds on fish inner ear tissues. Comp. Biochem. Physiol. A Mol. Integr. Physiol. 2013, 166, 352–360. [Google Scholar] [CrossRef]
  14. Reimer, T.; Dempster, T.; Wargelius, A.; Fjelldal, P.G.; Hansen, T.; Glover, K.A.; Solberg, M.F.; Swearer, S.E. Rapid growth causes abnormal vaterite formation in farmed fish otoliths. J. Exp. Biol. 2017, 220, 2965–2969. [Google Scholar] [CrossRef] [Green Version]
  15. Skalski, J.R.; Pearson, W.H.; Malme, C.I. Effects of sounds from a geophysical survey device on catch-per-unit-effort in a hook-and-line fishery for rockfish (Sebastes spp.). Can. J. Fish. Aquat. Sci. 1992, 49, 1357–1365. [Google Scholar] [CrossRef]
  16. Wardle, C.S.; Carter, T.J.; Urquhart, G.G.; Johnstone, A.D.F.; Ziolkowski, A.M.; Hampson, G.; Mackie, D. Effects of seismic air guns on marine fish. Cont. Shelf Res. 2001, 21, 1005–1027. [Google Scholar] [CrossRef]
  17. Boeger, W.A.; Pie, M.R.; Ostrensky, A.; Cardoso, M.F. The effect of exposure to seismic prospecting on coral reef fishes. Brazilian J. Oceanogr. 2006, 54, 235–239. [Google Scholar] [CrossRef]
  18. Herbert-Read, J.E.; Kremer, L.; Bruintjes, R.; Radford, A.N.; Ioannou, C.C. Anthropogenic noise pollution from pile-driving disrupts the structure and dynamics of fish shoals. Proc. R. Soc. B Biol. Sci. 2017, 284. [Google Scholar] [CrossRef] [PubMed] [Green Version]
  19. Weilgart, L.S. The Impact of Ocean Noise Pollution on Fish and Invertebrate; Ocean Care and Dalhousie University. 2018, p. 34. Available online: https://www.oceancare.org/wp-content/uploads/2017/10/OceanNoise_FishInvertebrates_May2018.pdf (accessed on 13 October 2021).
  20. Nedelec, S. Impacts of Anthropogenic Noise on Behaviour, Development and Fitness of Fishes and Invertebrates. Ecosystems. École Pratique Des Hautes Études-EPHE PARIS. University of Bristol. 2015. Available online: https://tel.archives-ouvertes.fr/tel-02099631/document (accessed on 13 October 2021).
  21. Wysocki, L.E.; Davidson, J.W.I.; Smith, M.E.; Frankel, A.S.; Ellison, W.T.; Mazik, P.M.; Popper, A.N.; Bebak, J. Effects of aquaculture production noise on hearing, Growth, and disease resistance of rainbow trout. Oncorhynchus Mykiss. Aquac. 2007, 272, 687–697. [Google Scholar] [CrossRef] [Green Version]
  22. Popper, A.N.; Hawkins, A.D.; Halvorsen, M.B. Anthropogenic Sound and Fishes; 2019. Available online: https://www.wsdot.wa.gov/research/reports/fullreports/891-1.pdf (accessed on 13 October 2021).
  23. Angelica, M.D.; Fong, Y. Cell proliferation follows acoustically-induced hair cell bundle loss in the zebrafish saccule. Hear. Res. 2009, 253, 67–76. [Google Scholar] [CrossRef]
  24. Oxman, D.S.; Barnett-Johnson, R.; Smith, M.E.; Coffin, A.; Miller, D.L.; Josephson, R.; Popper, A.N. The effect of vaterite deposition on sound reception, otolith morphology, and inner ear sensory epithelia in hatchery-reared Chinook salmon (Oncorhynchus tshawytscha). Can. J. Fish. Aquat. Sci. 2007, 64, 1469–1478. [Google Scholar] [CrossRef] [Green Version]
  25. Uribe, P.M.; Villapando, B.K.; Lawton, K.J.; Fang, Z.; Gritsenko, D.; Bhandiwad, A.; Sisneros, J.A.; Xu, J.; Coffin, A.B. Larval zebrafish lateral line as a model for acoustic trauma. eNeuro 2018, 5. [Google Scholar] [CrossRef] [PubMed] [Green Version]
  26. Halvorsen, M.B.; Casper, B.M.; Woodley, C.M.; Carlson, T.J.; Popper, A.N. Threshold for onset of injury in chinook salmon from exposure to impulsive pile driving sounds. PLoS ONE 2012, 7, e38968. [Google Scholar] [CrossRef] [PubMed]
  27. Whelan, K. A review of the impacts of the salmon louse, Lepeophtheirus salmonis (Krøyer, 1837) on wild salmonids. Atl. Salmon Trust 2010. Available online: https://atlanticsalmontrust.org/wp-content/uploads/2016/12/ast-sea-lice-impacts-review1.pdf (accessed on 13 October 2021).
  28. Urbina, M.A.; Cumillaf, J.P.; Paschke, K.; Gebauer, P. Effects of pharmaceuticals used to treat salmon lice on non-target species: Evidence from a systematic review. Sci. Total Environ. 2018, 649, 1124–1136. [Google Scholar] [CrossRef] [PubMed]
  29. Hannisdal, R.; Nøstbakken, O.J.; Hove, H.; Madsen, L.; Horsberg, T.E.; Lunestad, B.T. Anti-sea lice agents in Norwegian aquaculture; surveillance, treatment trends and possible implications for food safety. Aquaculture 2020, 521, 735044. [Google Scholar] [CrossRef]
Figure 1. Sound exposure protocol, sampling collection, and analysis. (1) After 2 weeks of acclimation, 10 salmon were taken for sample analysis as controls previous to the sound exposure. (2) Forty salmon were exposed to sound (Weeks 1, 2, 3:2 cycles [350 Hz (65 V-2 h) and 500 Hz (65 V-2 h)], daily with 2 h rest in between two cycles. Week 4:3 cycles [350 Hz (65 V-2 h) and 500 Hz (65 V-2 h)], daily with 2 h rest in between two cycles). (3) Samples of exposed salmon were sequentially taken for analysis after exposure (week 1 to 4).
Jmse 09 01114 g001
Figure 2. SEM. S. salar macula of saccule (A), utricle (B) and lagena (C). Hair cell bundle count locations on macula. Hair cell counts were sampled at five predetermined locations: 5, 25, 50, 75 and 95% of the total macular length. A 2500 μm2 box was placed at each sampling area and hair cells were counted within each box. Scale bar (A) = 1 mm. (B,C) = 500 μm.
Jmse 09 01114 g002
Figure 3. Sound exposure system [3].
Jmse 09 01114 g003
Figure 4. Drawing of the experimental setup. Note that the depth of the structure that holds the loud speakers was modified along the duration of the experiments. M9 loud speakers were lowered to −5 m [3].
Jmse 09 01114 g004
Figure 5. (A) LM (light microscopy). (BD): SEM (scanning electron microscopy). Salmon inner ear. (A) The location of the three sensory epithelia and the three semicircular channels in the salmon inner ear is visible. (B) White line encloses the saccule sensory epithelium. (C) White line encloses the utricle sensory epithelium. (D) White line encloses the lagena sensory epithelium. Scale bar: (B) = 1 mm. (C,D) = 500 µm.
Jmse 09 01114 g005
Figure 6. SEM (scanning electron microscopy). Saccule sensory epithelium. (A,B) Exposed animals. Control. (CF) By comparison with control animals, the images of the saccule epithelium show healthy sensory hair cells in all cases of exposed animals (1 week (C), 2 weeks (D), 3 weeks (E) and 4 weeks (F) of sound exposure). Scale bar: E = 30 µm. (A,C) = 20 µm. (F) = 10 µm. (D) = 5 µm. (B) = 3 µm.
Jmse 09 01114 g006
Figure 7. SEM (scanning electron microscopy). Utricle saccule sensory epithelium. (A,B) Exposed animals. Control. (CF) By comparison with control animals, the images of the saccule epithelium show healthy sensory hair cells in all cases of exposed animals (1 week (C), 2 weeks (D), 3 weeks (E) and 4 weeks (F) of sound exposure). Scale bar: (A) = 30 µm. (B,D) = 10 µm. (C,E,F) = 5 µm.
Jmse 09 01114 g007
Figure 8. SEM (scanning electron microscopy). Lagena sensory epithelium. (A,B) Exposed animals. Control. (CF) By comparison with control animals, the images of the saccule epithelium show healthy sensory hair cells in all cases of exposed animals (1 week (C), 2 weeks (D), 3 weeks (E) and 4 weeks (F) of sound exposure). Scale bar: (A) = 30 µm. (C,D) = 10 µm. (B,E,F) = 5 µm.
Jmse 09 01114 g008
Figure 9. Overview of the damaged hair cell ratio from data collected at the LAB experiments. (A) lagena, (B) saccule and (C) utricle. The red line is the median with the boxes defined by the 25 and 75 percentiles. The whiskers are defined by 1.5 times the interquartile distance and outliers (+) beyond that range. No significant differences were found between controls and exposed salmons (p-values: (A) 0.21, (B) 0.92, (C) 0.54).
Jmse 09 01114 g009
Figure 10. Dissected salmon showing the inner organs with normal aspect. No internal or external haemorrhages or lesions, nor alterations in the swim bladder were detected.
Jmse 09 01114 g010
Figure 11. Swim bladder with normal aspect of salmon at different samplings times. (A) Control. (B) 1 week after exposure. (C) 2 weeks after exposure. (D) 3 weeks after exposure. (E) 4 weeks after exposure. Scale bar: 100 µm.
Jmse 09 01114 g011
Figure 12. Head kidney (first line) and posterior kidney (second line) of salmon at different sampling times. (A) Control. (B) 1 week after exposure. (C) 2 weeks after exposure. (D) 3 weeks after exposure. (E) 4 weeks after exposure. Scale bar: 100 µm.
Jmse 09 01114 g012
Figure 13. Stomach (first line), intestine (second line), liver (third line) and spleen (fourth line) of salmon at different sampling times. (A) Control. (B) 1 week after exposure. (C) 2 weeks after exposure. (D) 3 weeks after exposure. (E) 4 weeks after exposure. Scale bar: 100 µm.
Jmse 09 01114 g013
Figure 14. Pancreas and adipose tissue (visceral fat) (first line) and gonad (second line) of salmon at different sampling times. (A) Control. (B) 1 week after exposure. (C) 2 weeks after exposure. (D) 3 weeks after exposure. (E) 4 weeks after exposure. Scale bar: 100 µm.
Jmse 09 01114 g014
Figure 15. Salmon swimming in the tanks and showing normal behaviour.
Jmse 09 01114 g015
Figure 16. SEM. Salmon inner ear. Saccule sensory epithelium. (A) Control. (B) 3 weeks after sound exposure. (C) 6 weeks after sound exposure. (D) 12 weeks after sound exposure. By comparison with control animals, the images of the saccule epithelium show healthy sensory hair cells in all cases of exposed animals. Scale bar: (B) = 20 µm. (A,D) = 10 µm. (C) = 5 µm.
Jmse 09 01114 g016
Figure 17. SEM. Salmon inner ear. Utricle sensory epithelium. (A) Control. (B) 3 weeks after sound exposure. (C) 6 weeks after sound exposure. (D) 12 weeks after sound exposure. By comparison with control animals, the images of the saccule epithelium show healthy sensory hair cells in all cases of exposed animals. Scale bar: (A) = 30 µm. (BD) = 10 µm.
Jmse 09 01114 g017
Figure 18. SEM. Salmon inner ear. Lagena sensory epithelium. (A) Control. (B) 3 weeks after sound exposure. (C) 6 weeks after sound exposure. (D) 12 weeks after sound exposure. By comparison with control animals (A), the images of the saccule epithelium show healthy sensory hair cells in all cases of exposed animals (BD). Scale bar: (C) = 30 µm. (A) = 20 µm. (B) = 10 µm. (D) = 5 µm.
Jmse 09 01114 g018
Figure 19. Overview of the damaged hair cell ratio from data collected at sea experiments. (A) Lagena, (B) saccule, (C) utricle. The red line is the median with the boxes defined by the 25th and 75th percentiles. The whiskers are defined by 1.5 times the interquartile distance and outliers (+) beyond that range. No significant differences were found between controls and exposed salmons (p-values (A) 0.29, (B) 0.38, (C) 0.78).
Jmse 09 01114 g019
Figure 20. LM. (A) Left and right otolith composed entirely of aragonite. (B) Right otolith composed basically of vaterite.
Jmse 09 01114 g020
Figure 21. SEM. (A) Light microscopy (LM). (BD): SEM. (A) Lateral line system located on the salmon scales of trunk (c signs the lateral line channel). (B) Lateral system located on the epithelium of the head (arrows). (C) Holes (arrows) of the channel of the lateral line system on the trunk. (D) Upper channel view on the scales (c). Scale bar: (B,C) = 3 mm. (D) = 2 mm.
Jmse 09 01114 g021
Figure 22. SEM. Superficial neuromast. (A) Upper view of a superficial neuromast. (B) Normal aspect of hair cell bundles on superficial neuromast of a control salmon. (C,D) Hair cell bundles on superficial neuromast of a 12-week exposed salmon. No lesions are visible. Scale bar: (A) = 200 µm. (B) = 30 µm. (C) = 5 µm. (D) = 3 µm.
Jmse 09 01114 g022
Table 1. Vaterite incidence rate on the salmon otoliths (%).
TimeVaterite Incidence Rate (%)
Week 375
Week 683.3
Week 1216.6
Total Incidence-
Vateritic otolith65.6
No vateritic otolith34.3
Location-
Right otolith52
Left otolith48
Cages-
Control75
Exposed50
Publisher’s Note: MDPI stays neutral with regard to jurisdictional claims in published maps and institutional affiliations.

