
Quantification of Measurement and Model Effects in Monopile Foundation Scour Protection Experiments

 , , , , and
Abstract
:1. Introduction
- Measurement effectsThe measurement effects are caused by the different configurations of the measurement system, which refer to error or inaccuracy of the measurement system due to the resolution of data sampling, the location of probes and the quality of measurement. In monopile scour protection tests, the measurement effects are mainly caused by the accuracy of wave gauges, velocity meters, distance sensors, bed profile scanner or pressure gauges. Despite the accuracy information provided in the specification of the instrument, the measurement effects can also be caused by calibration induced errors, human manipulation and environment condition variation, such as light, humidity, temperature, etc. It is sometimes necessary to use a statistic analysis method and repeated measurements to check the applicability and the uncertainty level of using such instruments [32]. According to [35,36], the set-up and application of the bed profile scanner is considered to be the major source of the measurement effects in monopile scour protection experiments.
- Model effectsThe model effects originate from the incorrect reproduction of the prototype situation in the laboratory facility. They are significantly associated with the reliability of the experimental results based on a single test. In experiments for modelling monopile scour protections, the model effects are mainly caused by wave and current generation, armour layer construction, sediment and pile construction. When the experiments are carried out in different wave flumes, model effects may also be introduced by different flume side walls, wave paddles and wave absorption systems. In comparison to the scale effects, the model effects often have less impact, but can sometimes be considerably high, especially when there is observed non-repeatability of the experimental conditions. For example, (i) due to the presence of turbulence and interactions between waves and current, the instantaneous pressure and velocity distributions around the pile are different; (ii) the impossibility of building an identical armour layer makes the results of one test deviating from the results from a repeated test. Regarding these problems, the present study refers to [32] who suggest to apply repeated tests, such as re-constructing the armour layer several times, in order to quantify model effects in small scale tests.
- Scale effectsThe scale effects are induced by the incorrect reproduction of prototype fluid-particle-structure interactions in the scale model. The factors that lead to potential scale effects in monopile scour protection experiments include: model geometry, actions of waves and currents, armour stone configuration and sediments. Unique scaling laws are applied to each factor to obtain maximum similarities between prototype and scale model, however, a full similarity is impossible to achieve due to the fact that the similarities for flow field, sediment and fluid-particle-structure dynamics cannot be satisfied at the same time [31,37,38,39].
2. Experimental Set-Up and Focus
2.1. Description
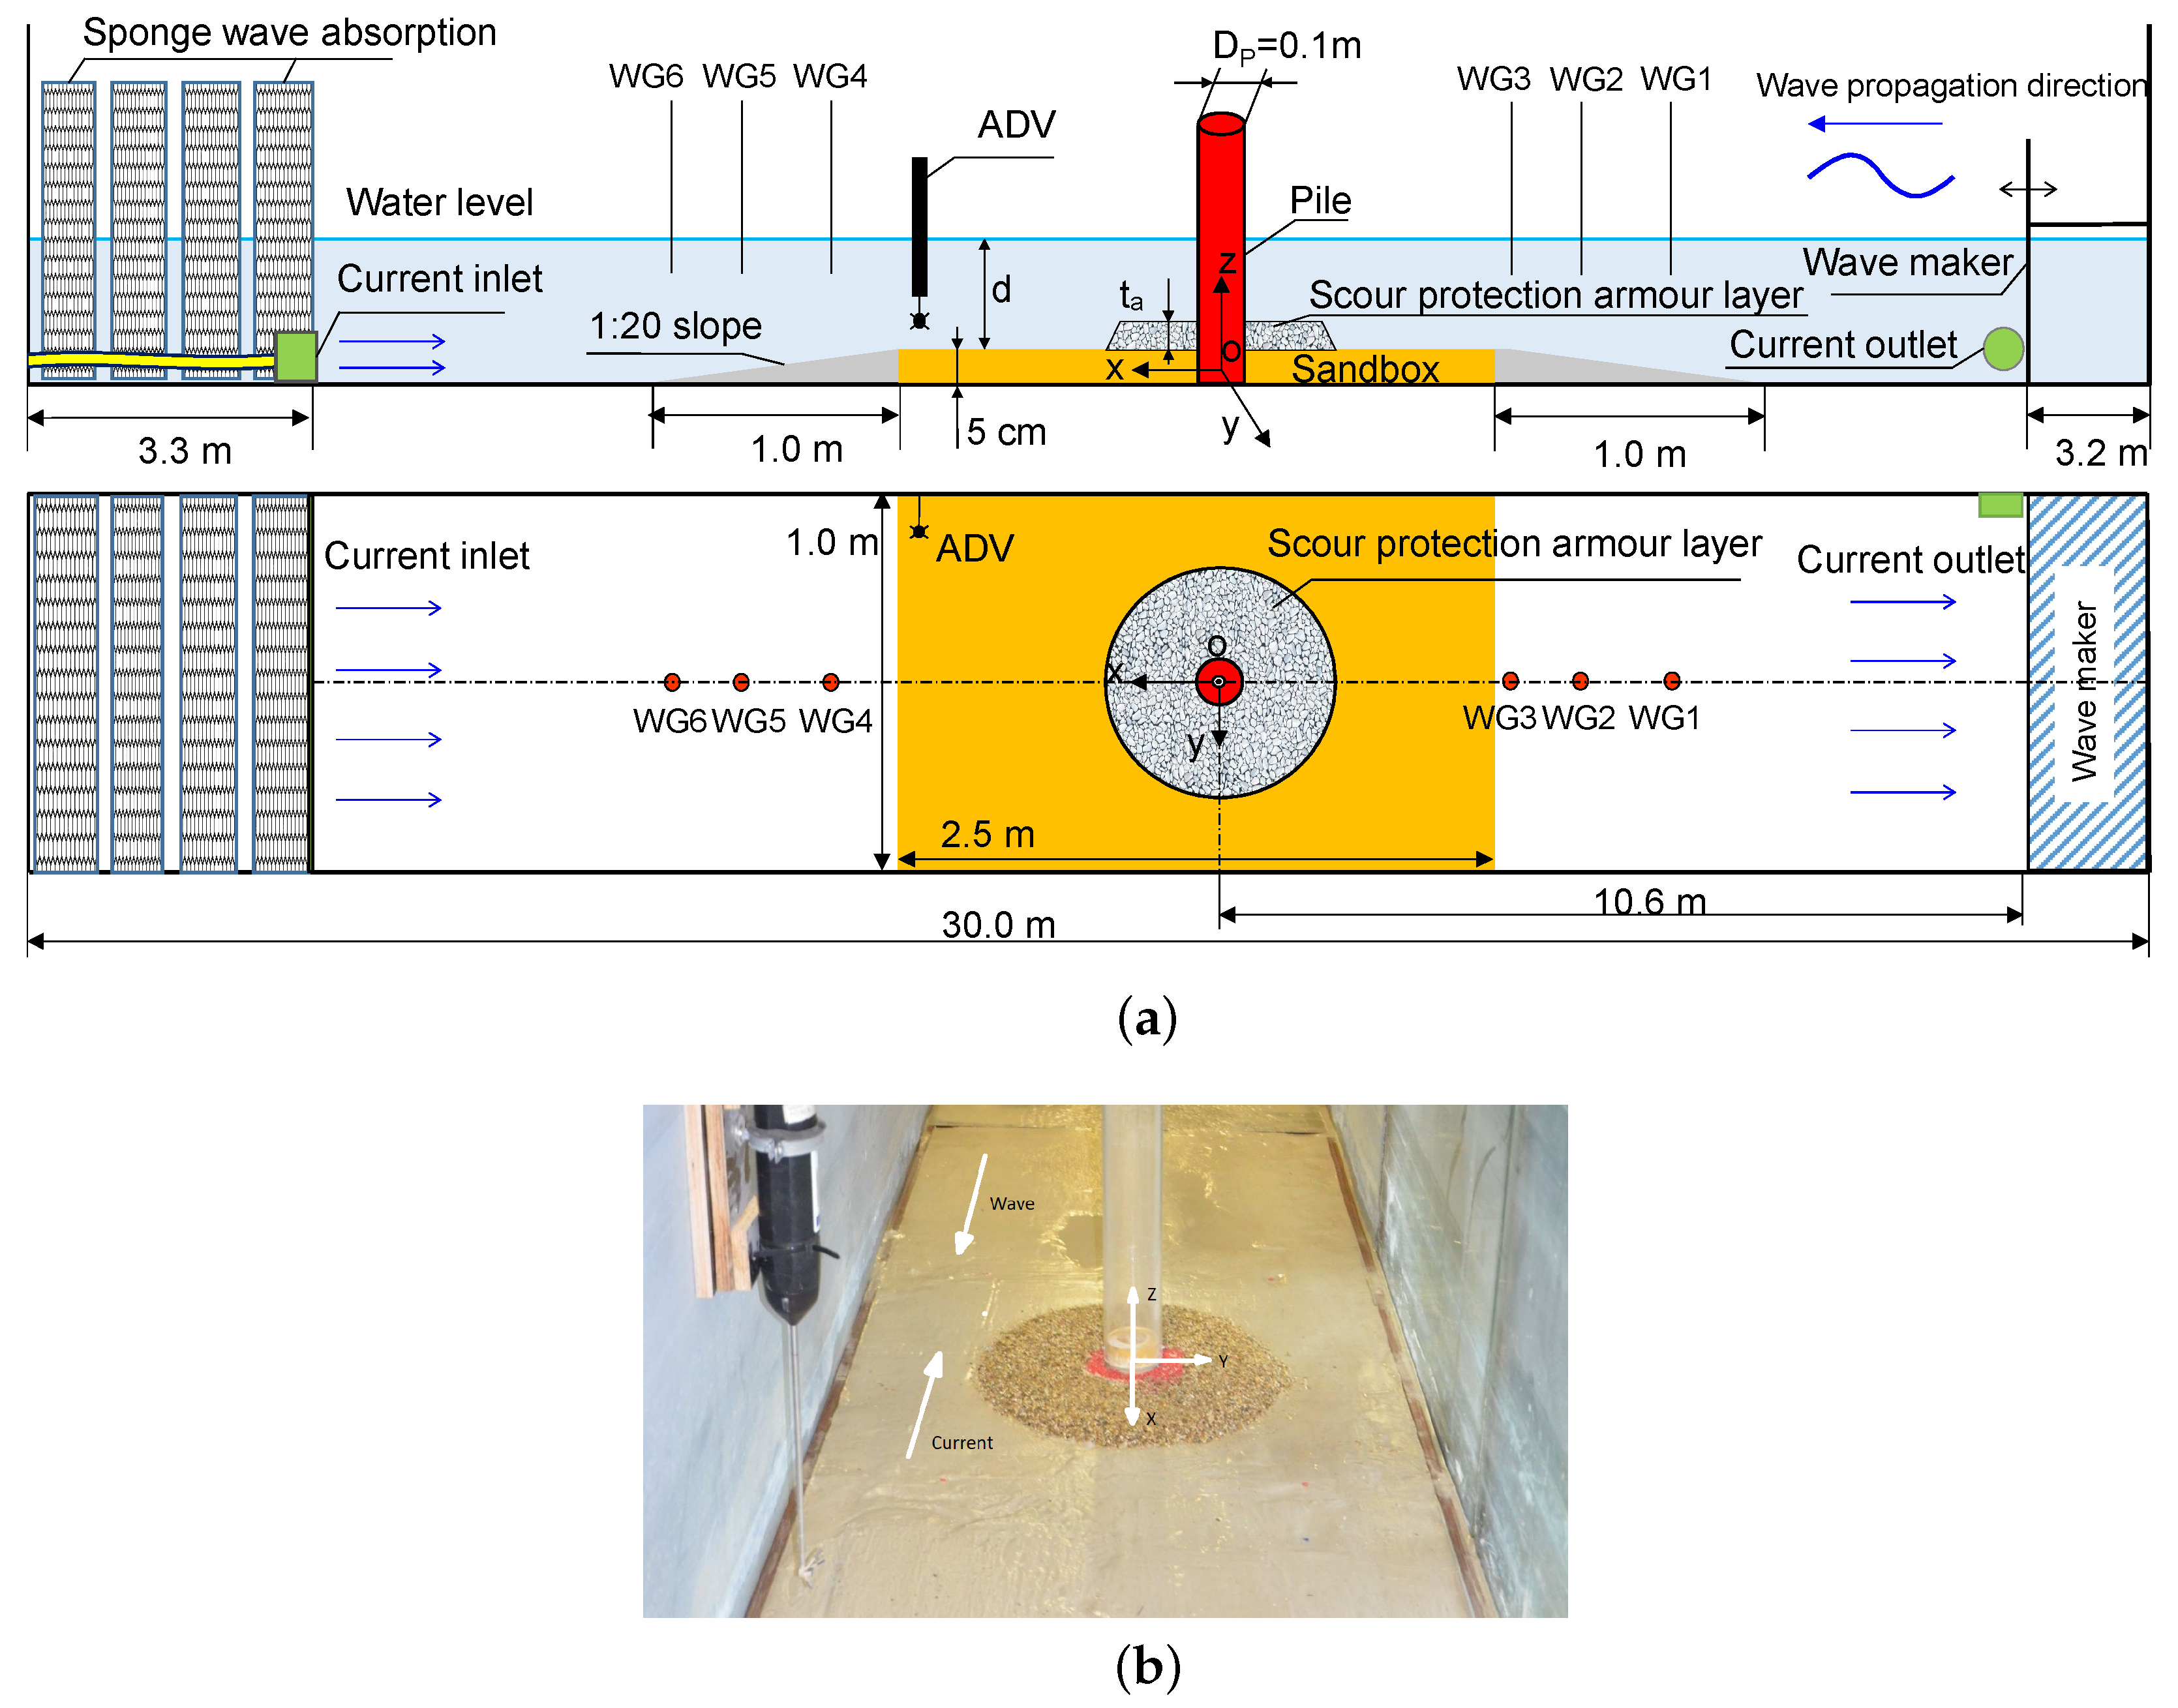
2.2. Facility and Test Setup
2.3. Test Matrix
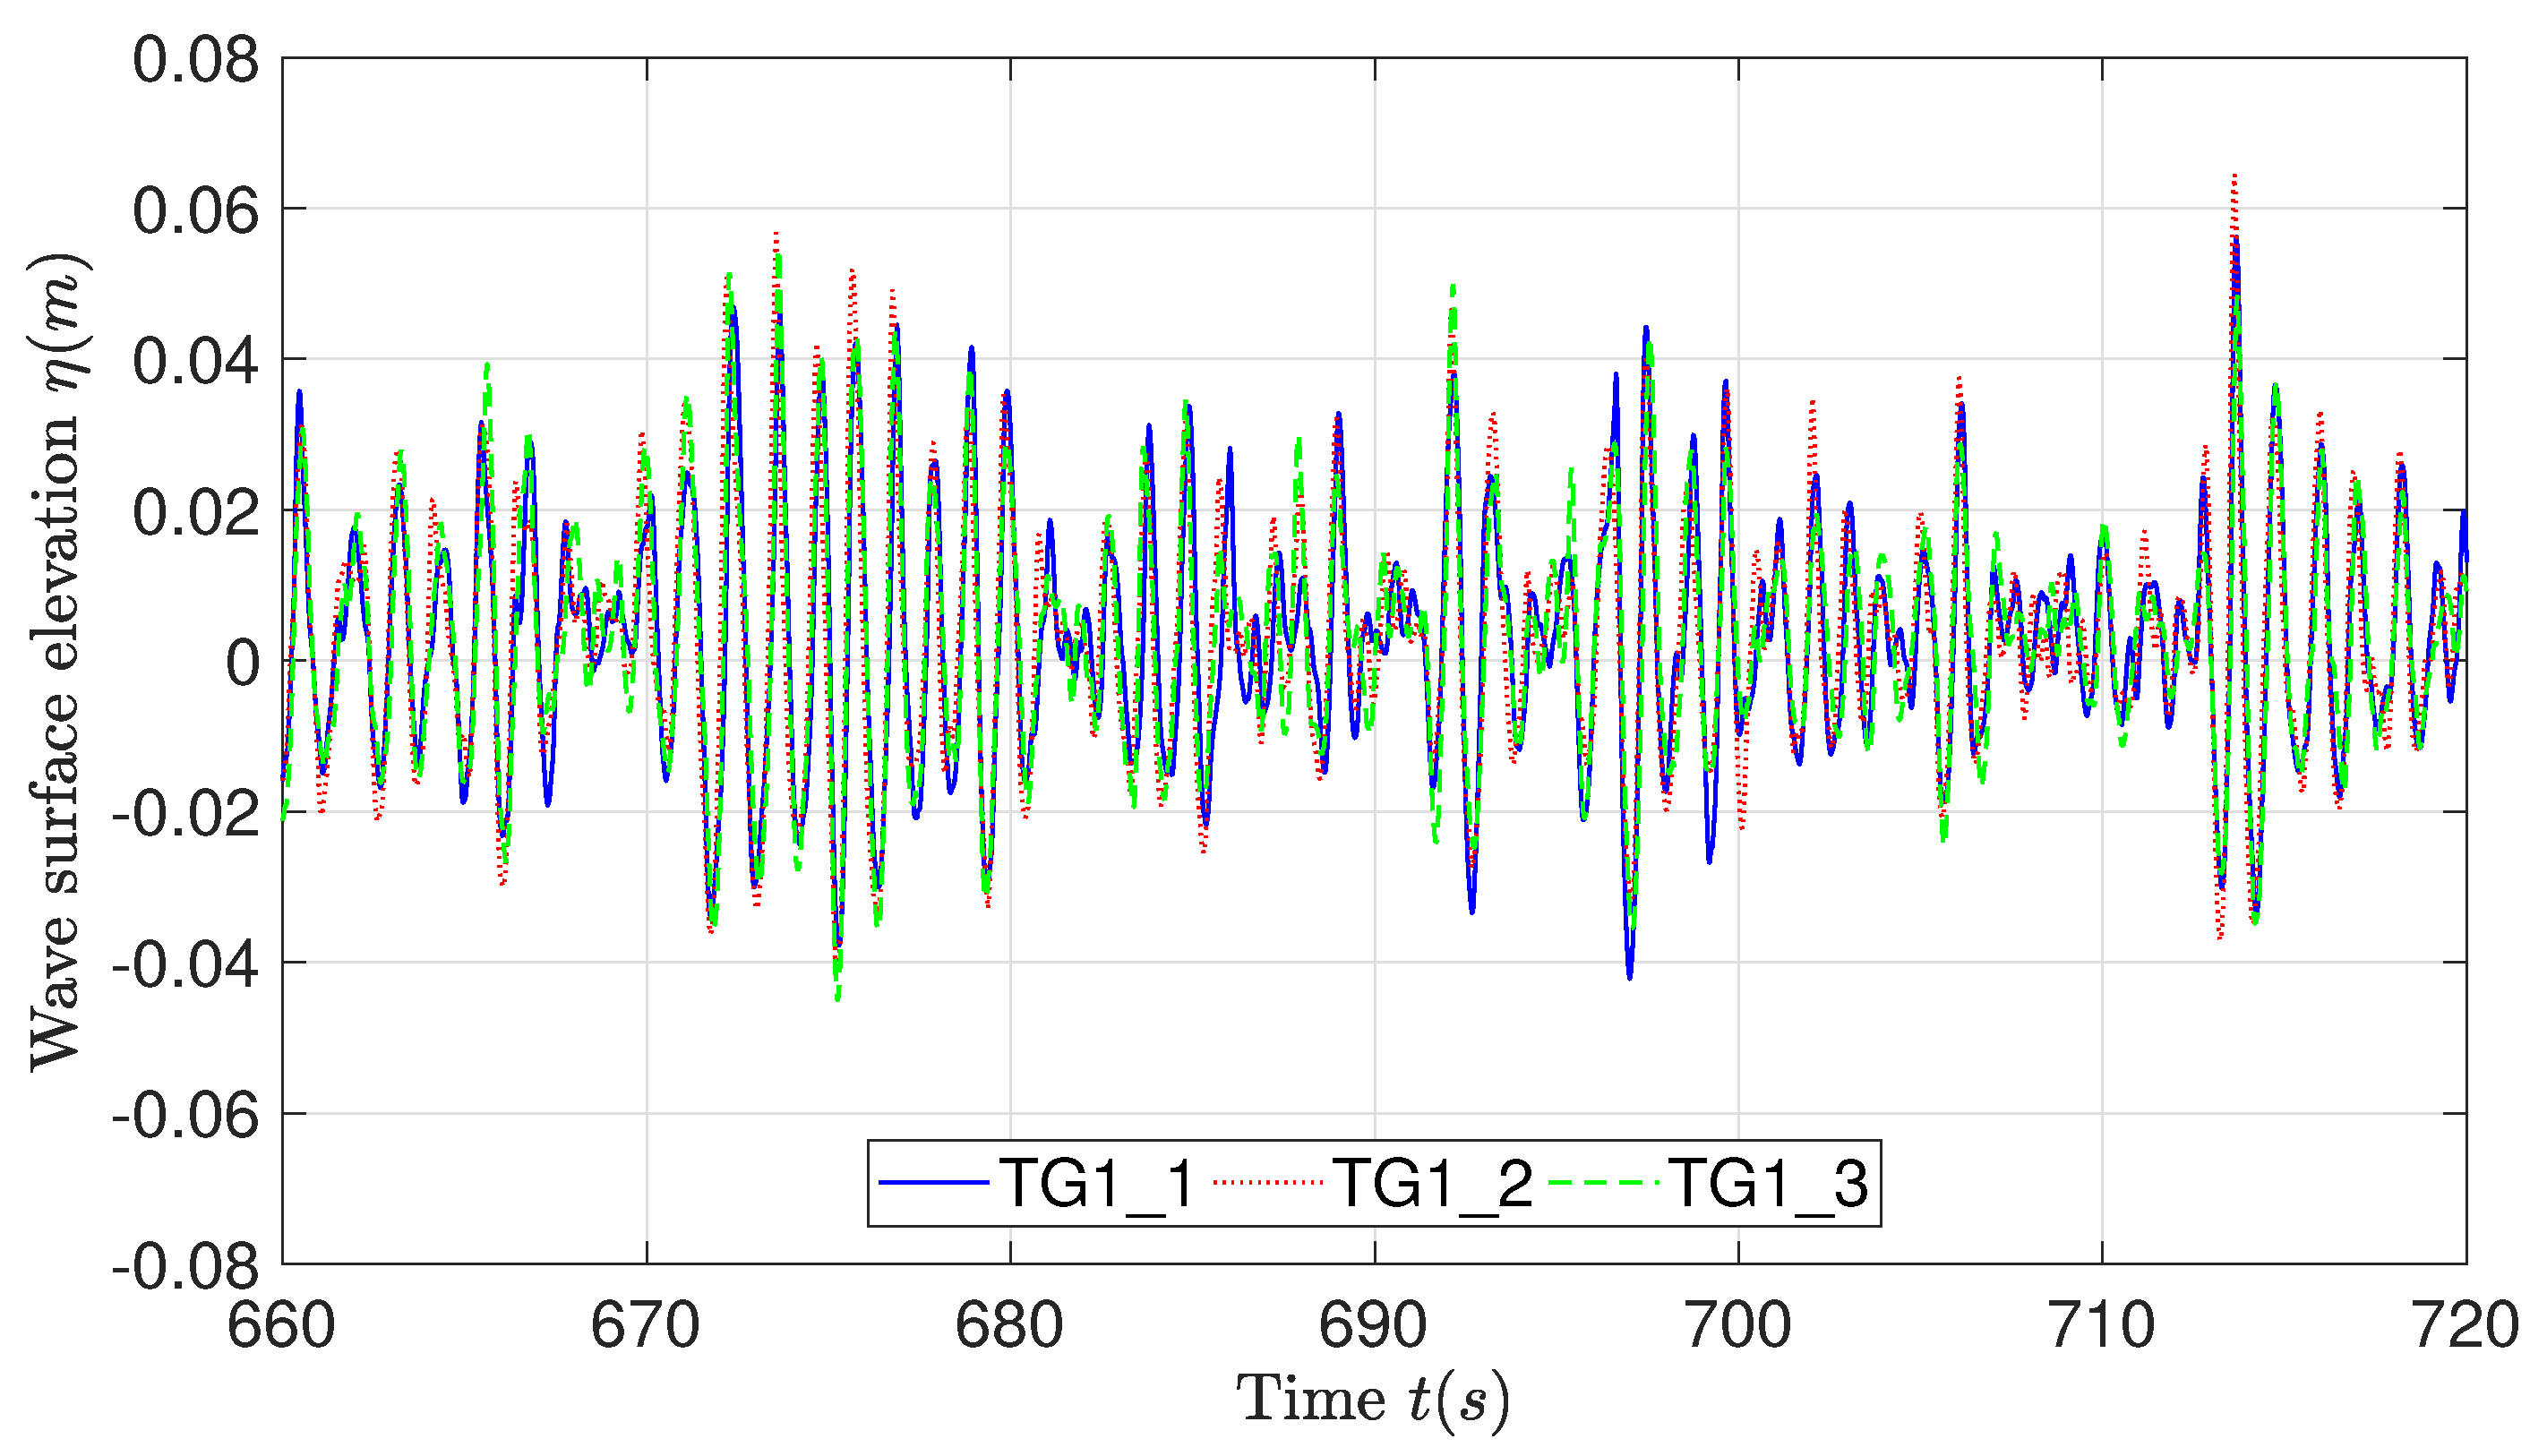
2.4. Repeatability of Wave and Current Conditions, Generated in the Laboratory
2.5. Repeatability of Armour Layer Flatness
3. Results
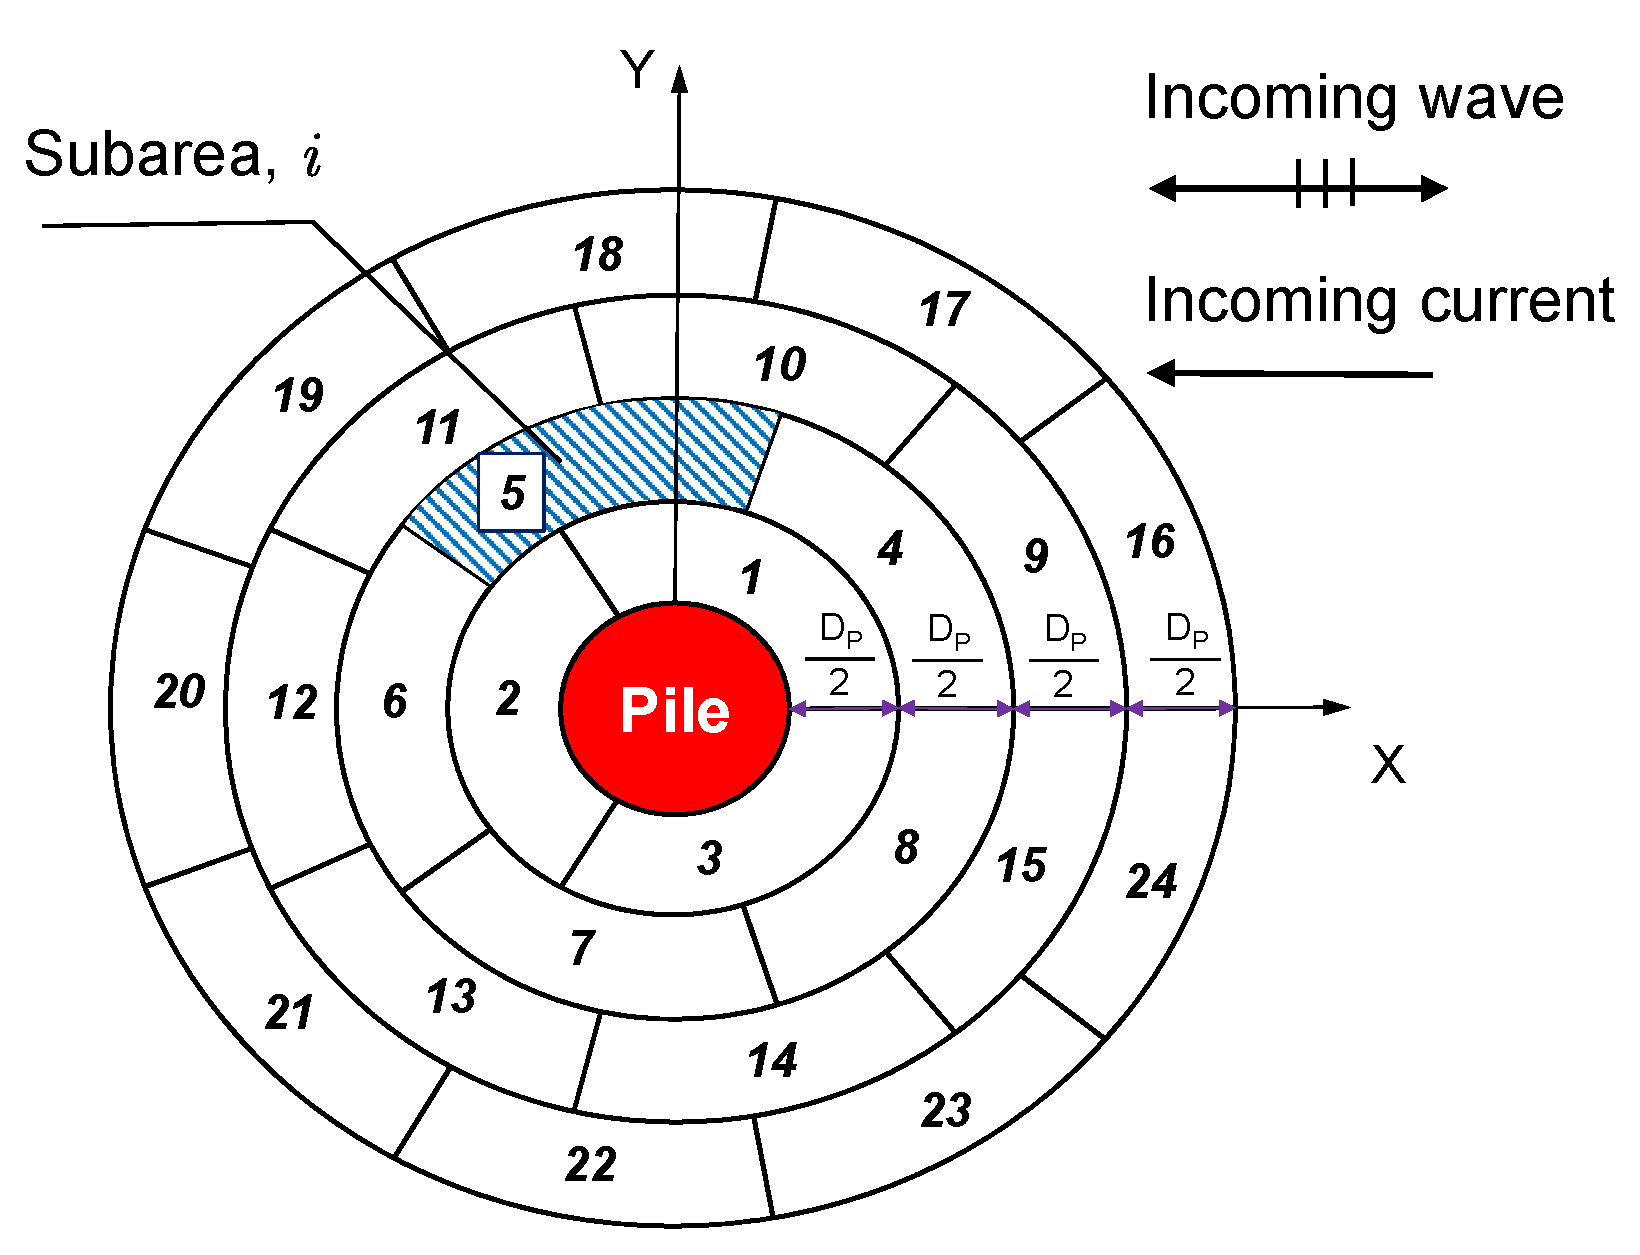
3.1. Damage Number
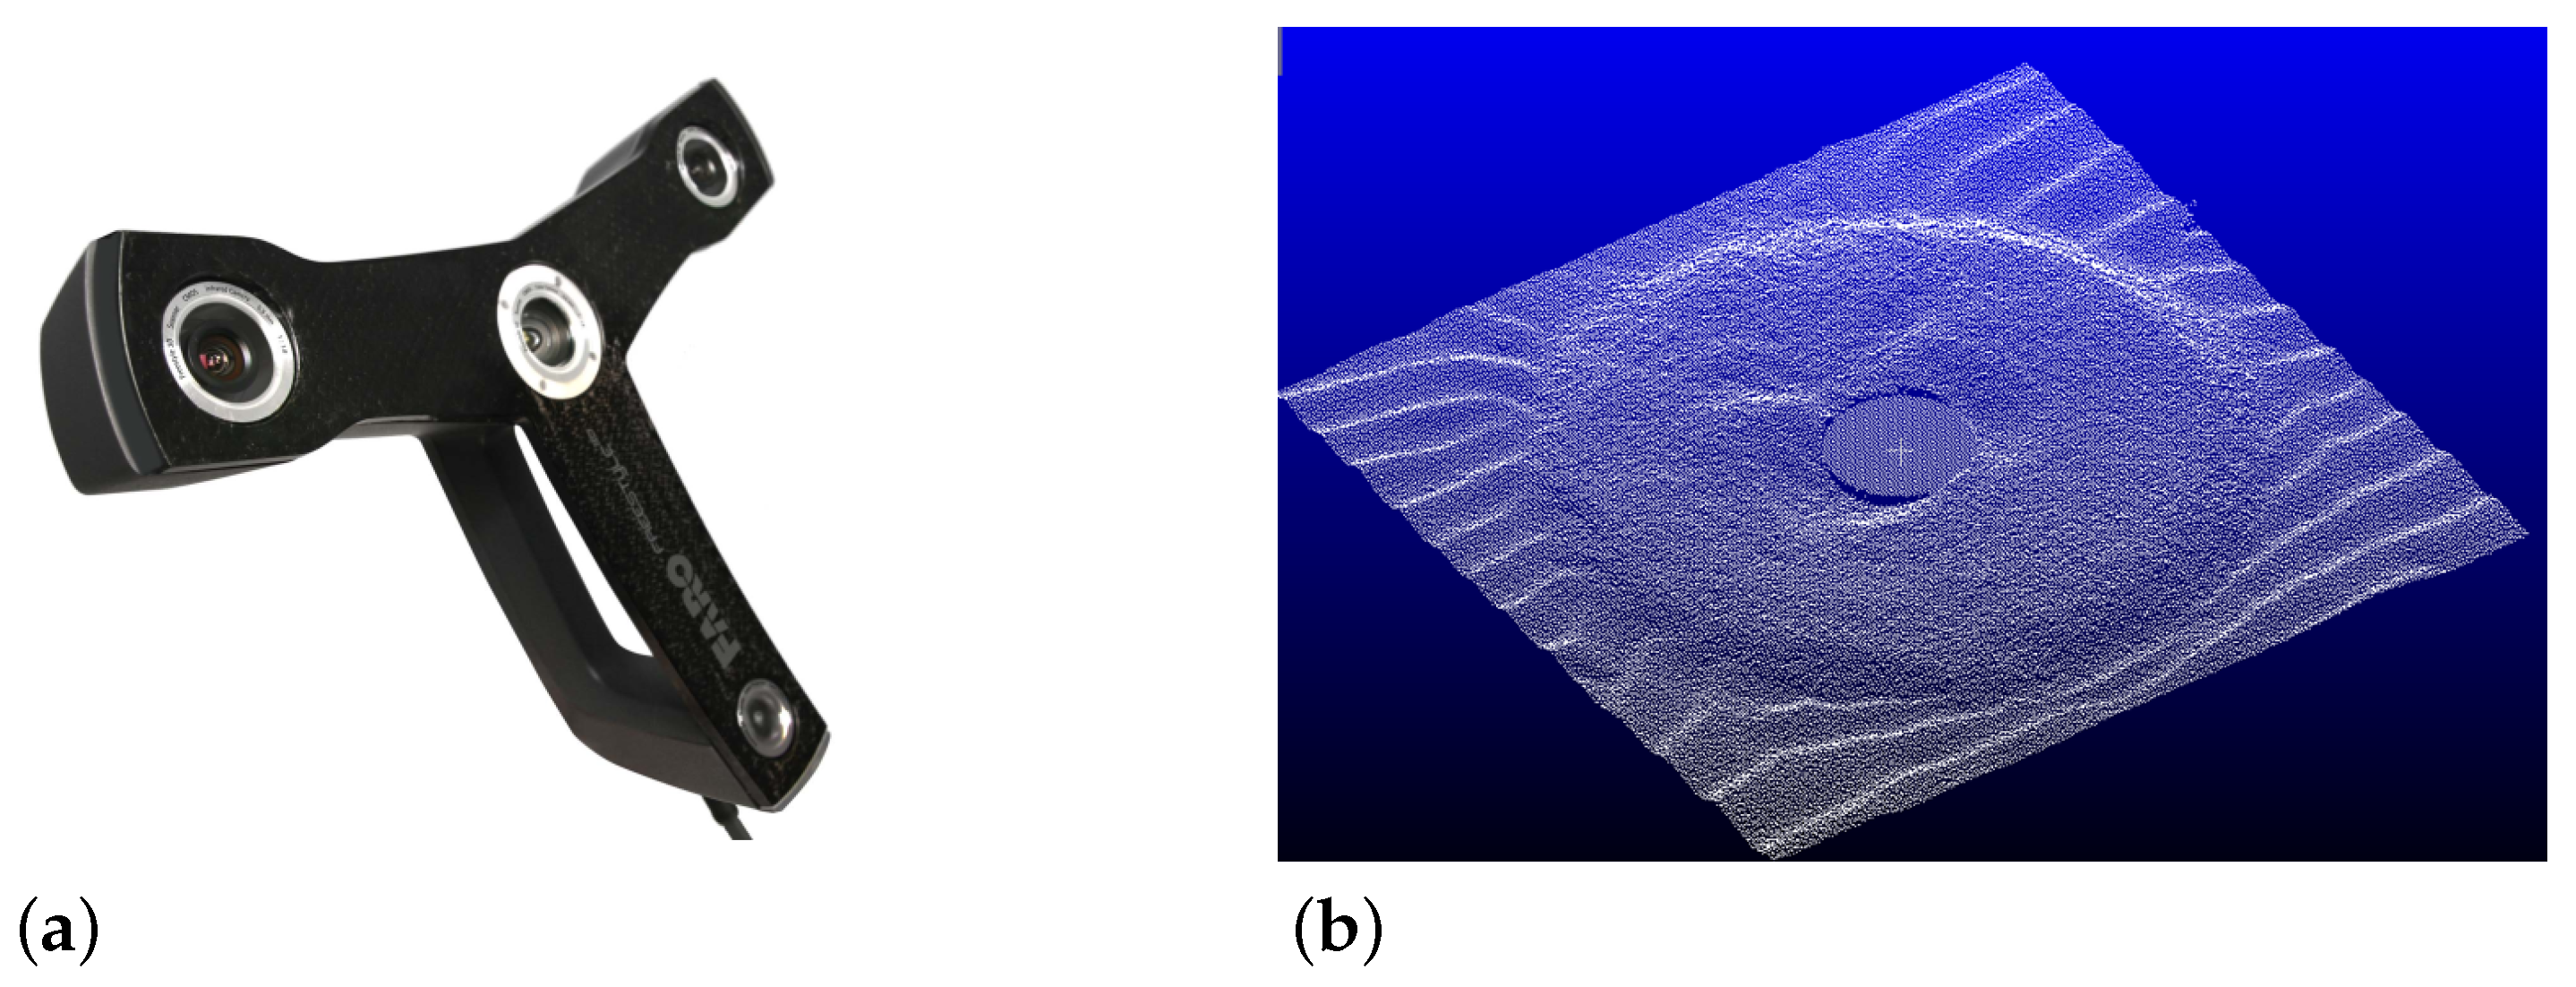
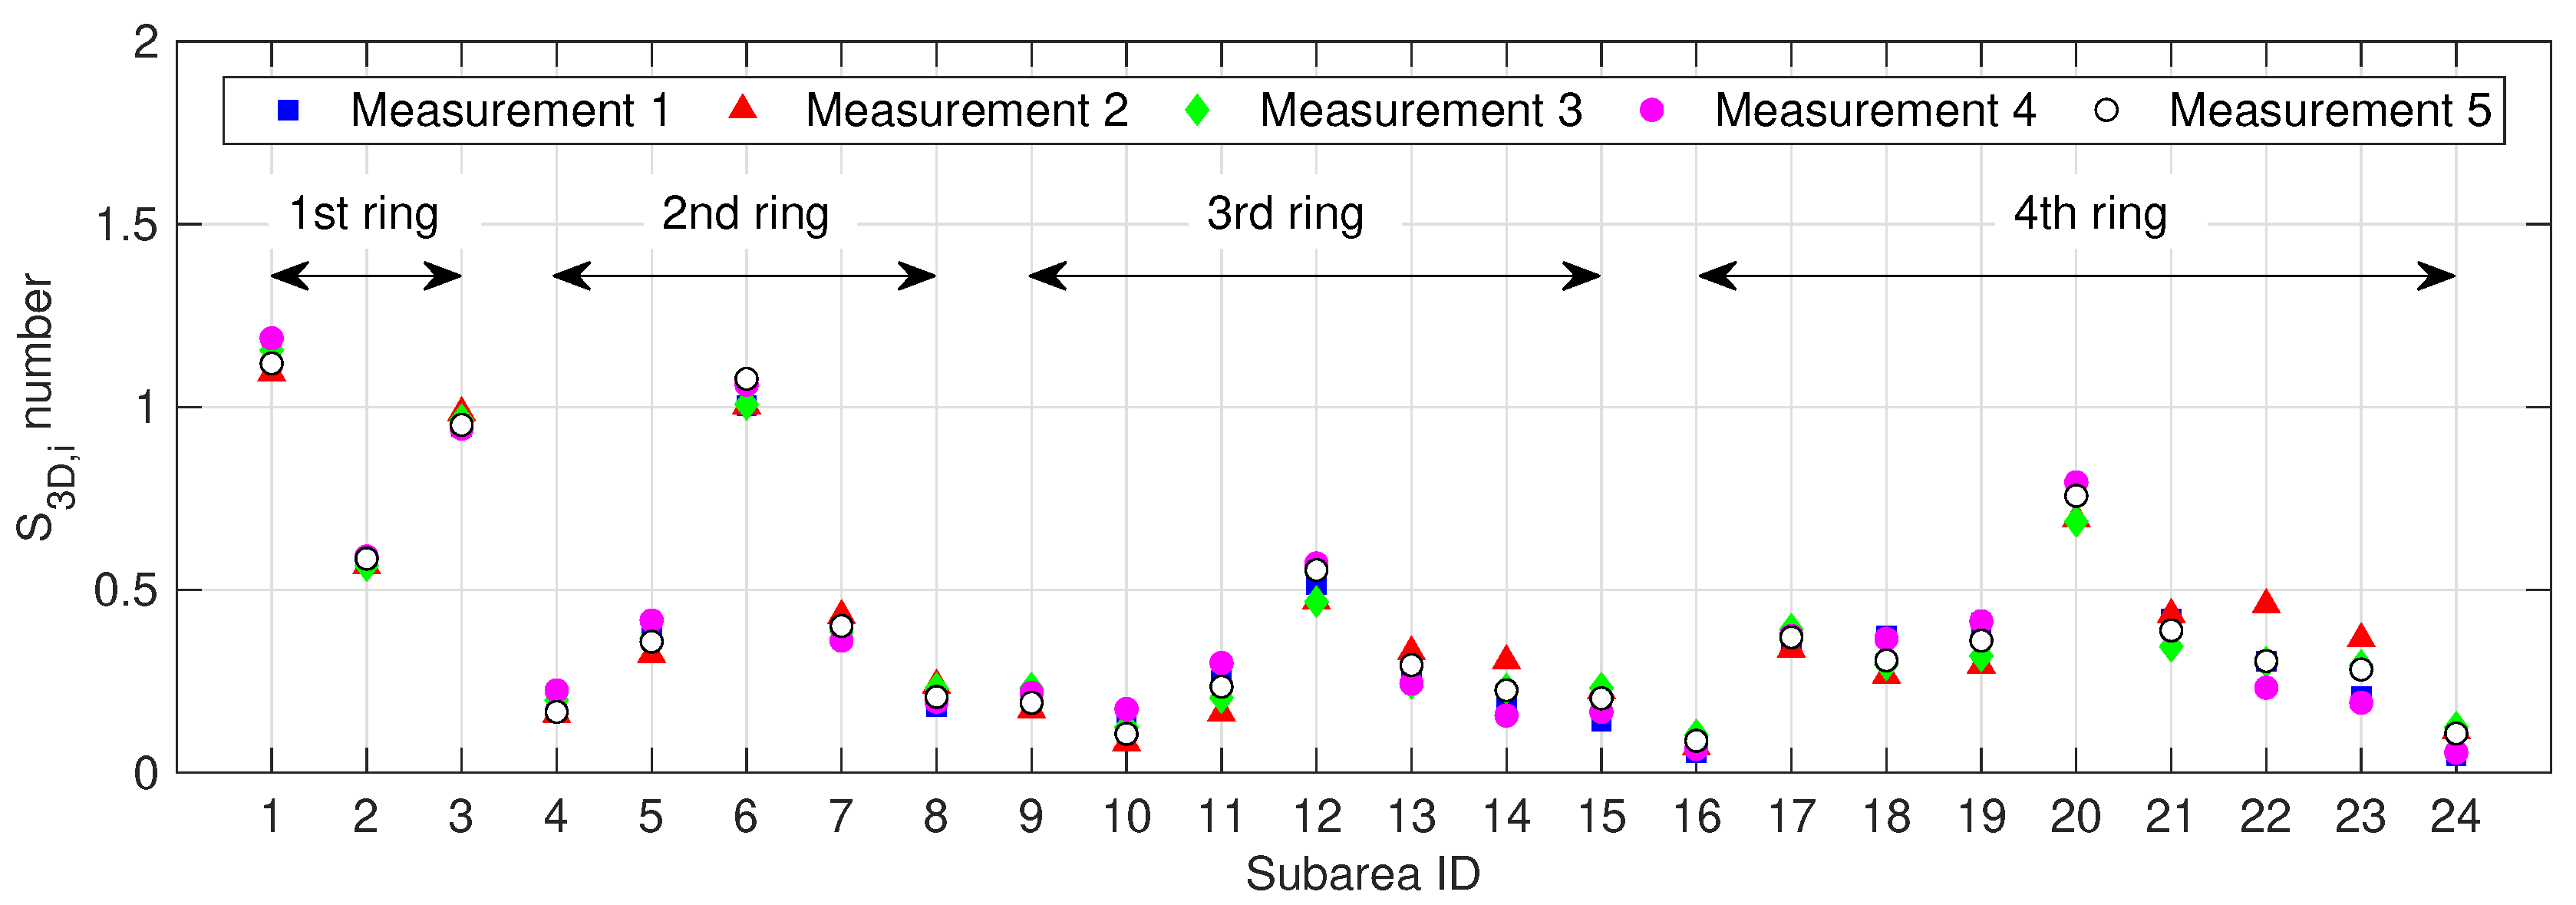
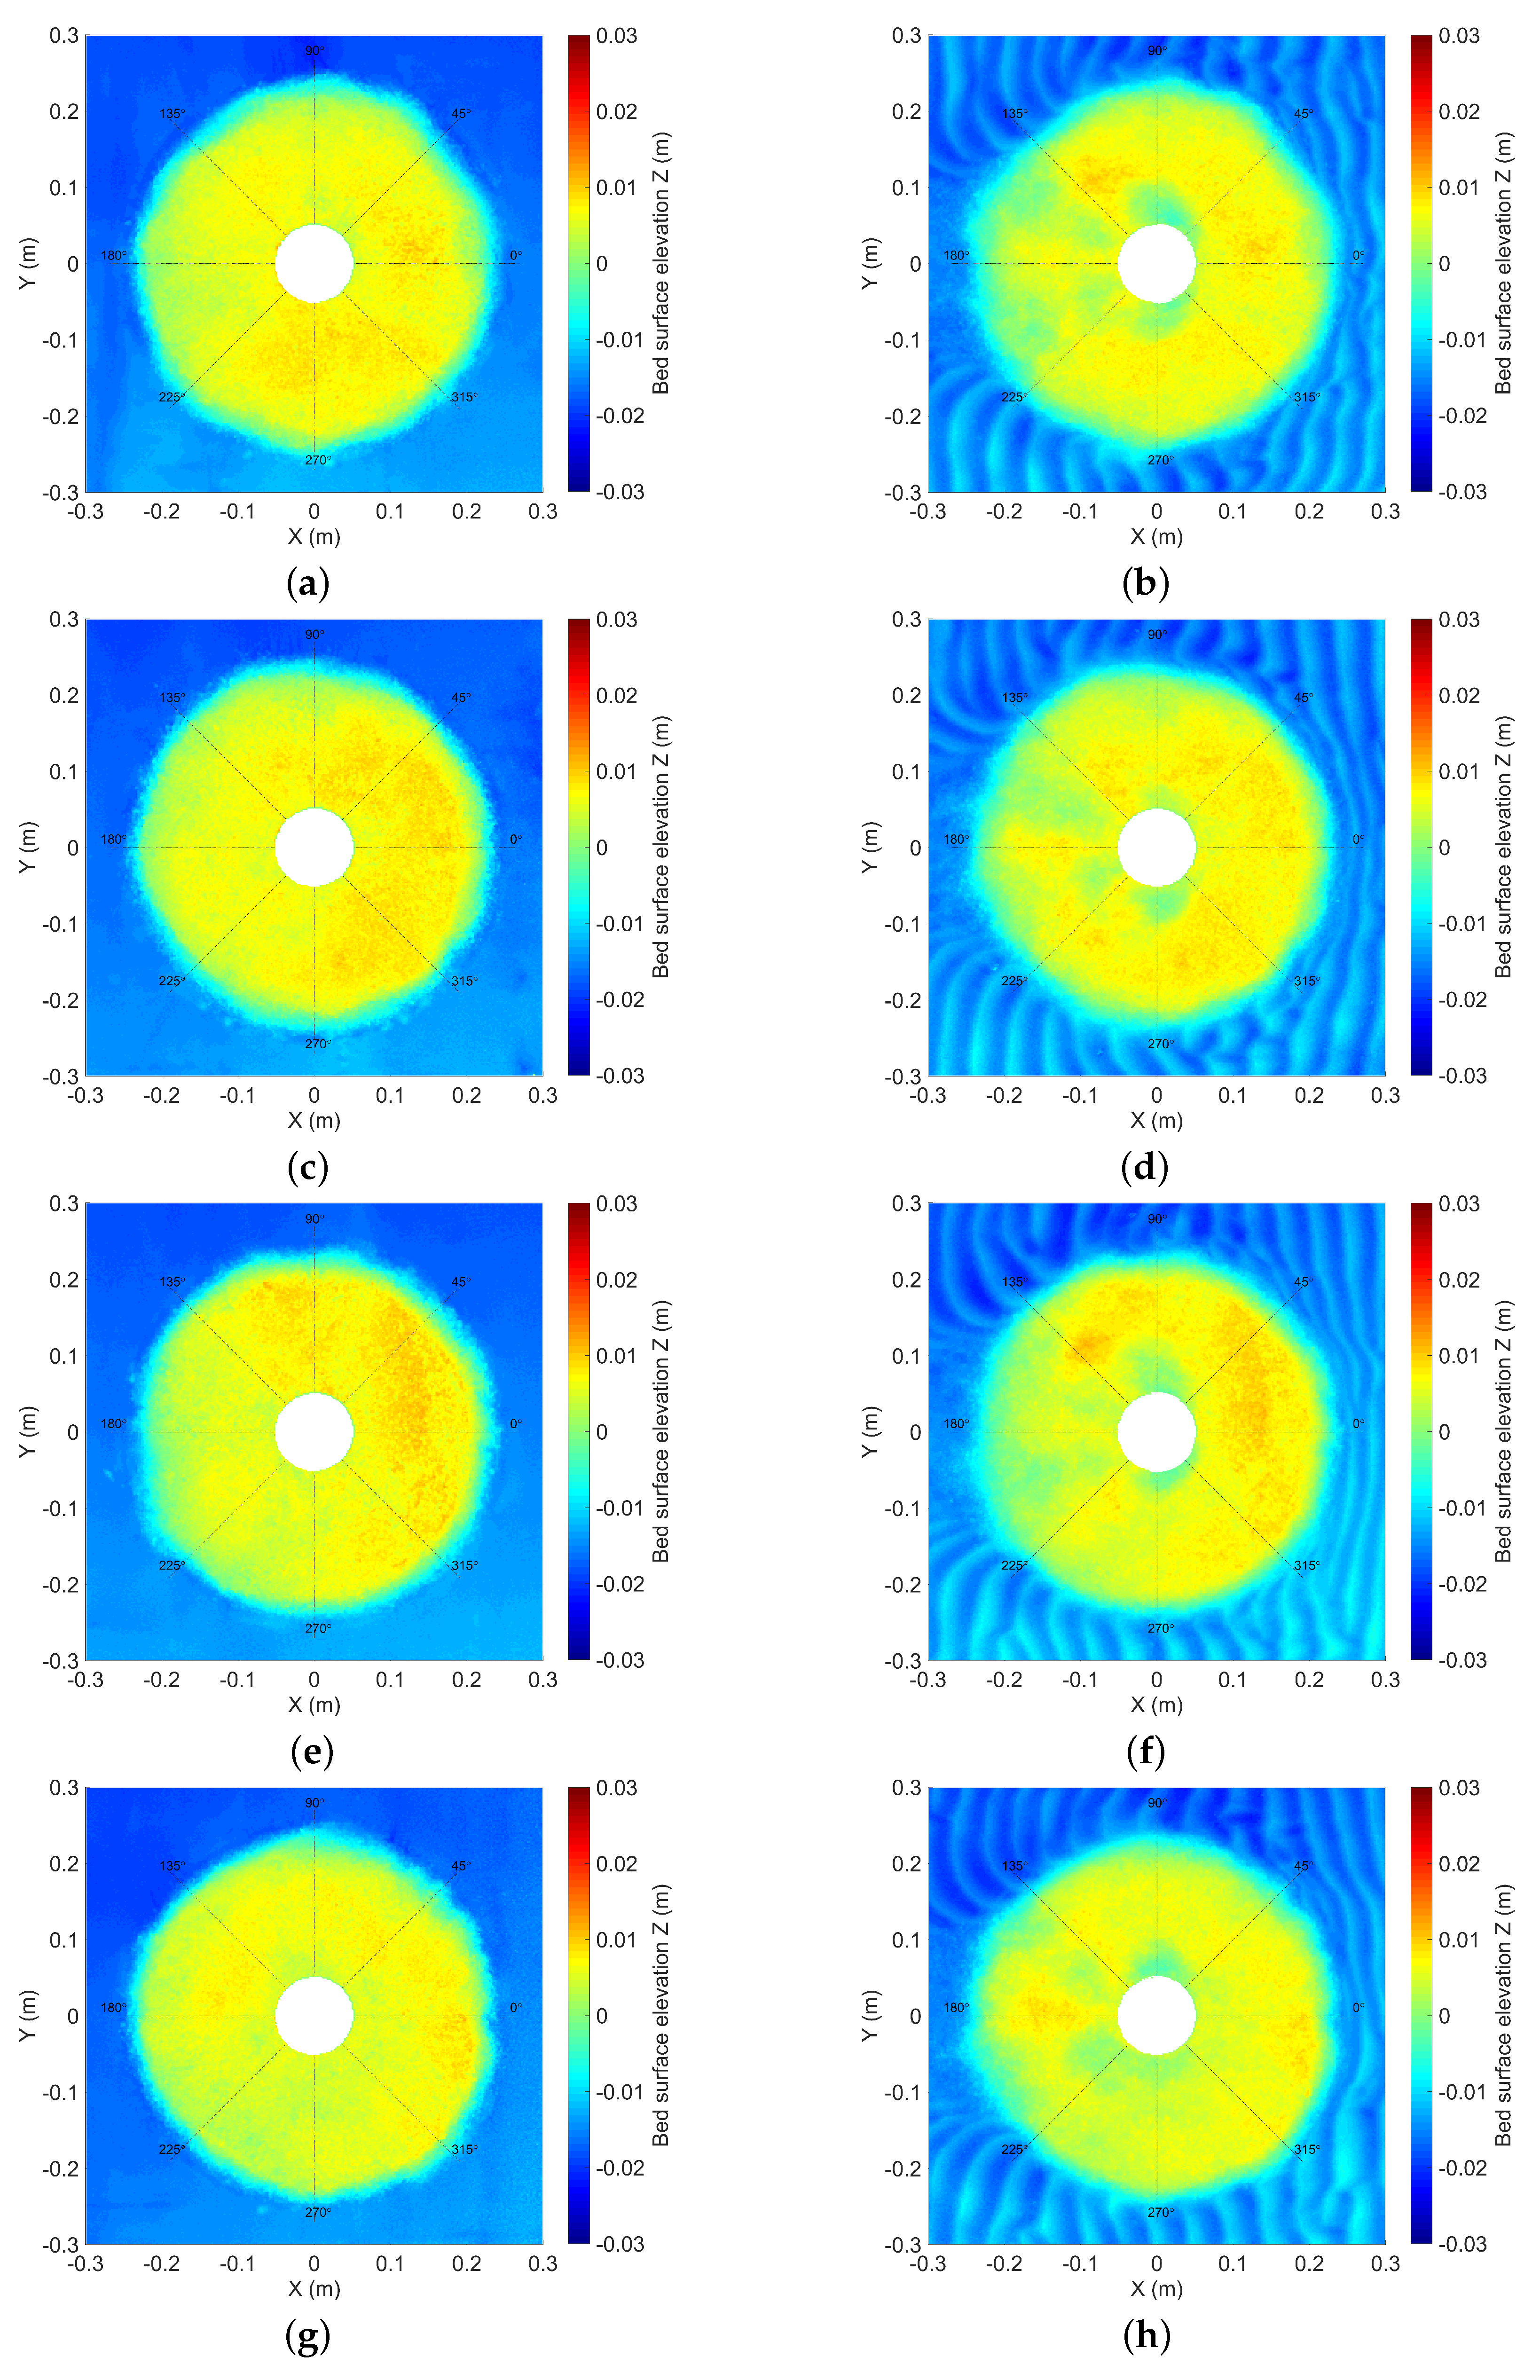
3.2. Measurement Effects Due to Handheld Laser Scanner
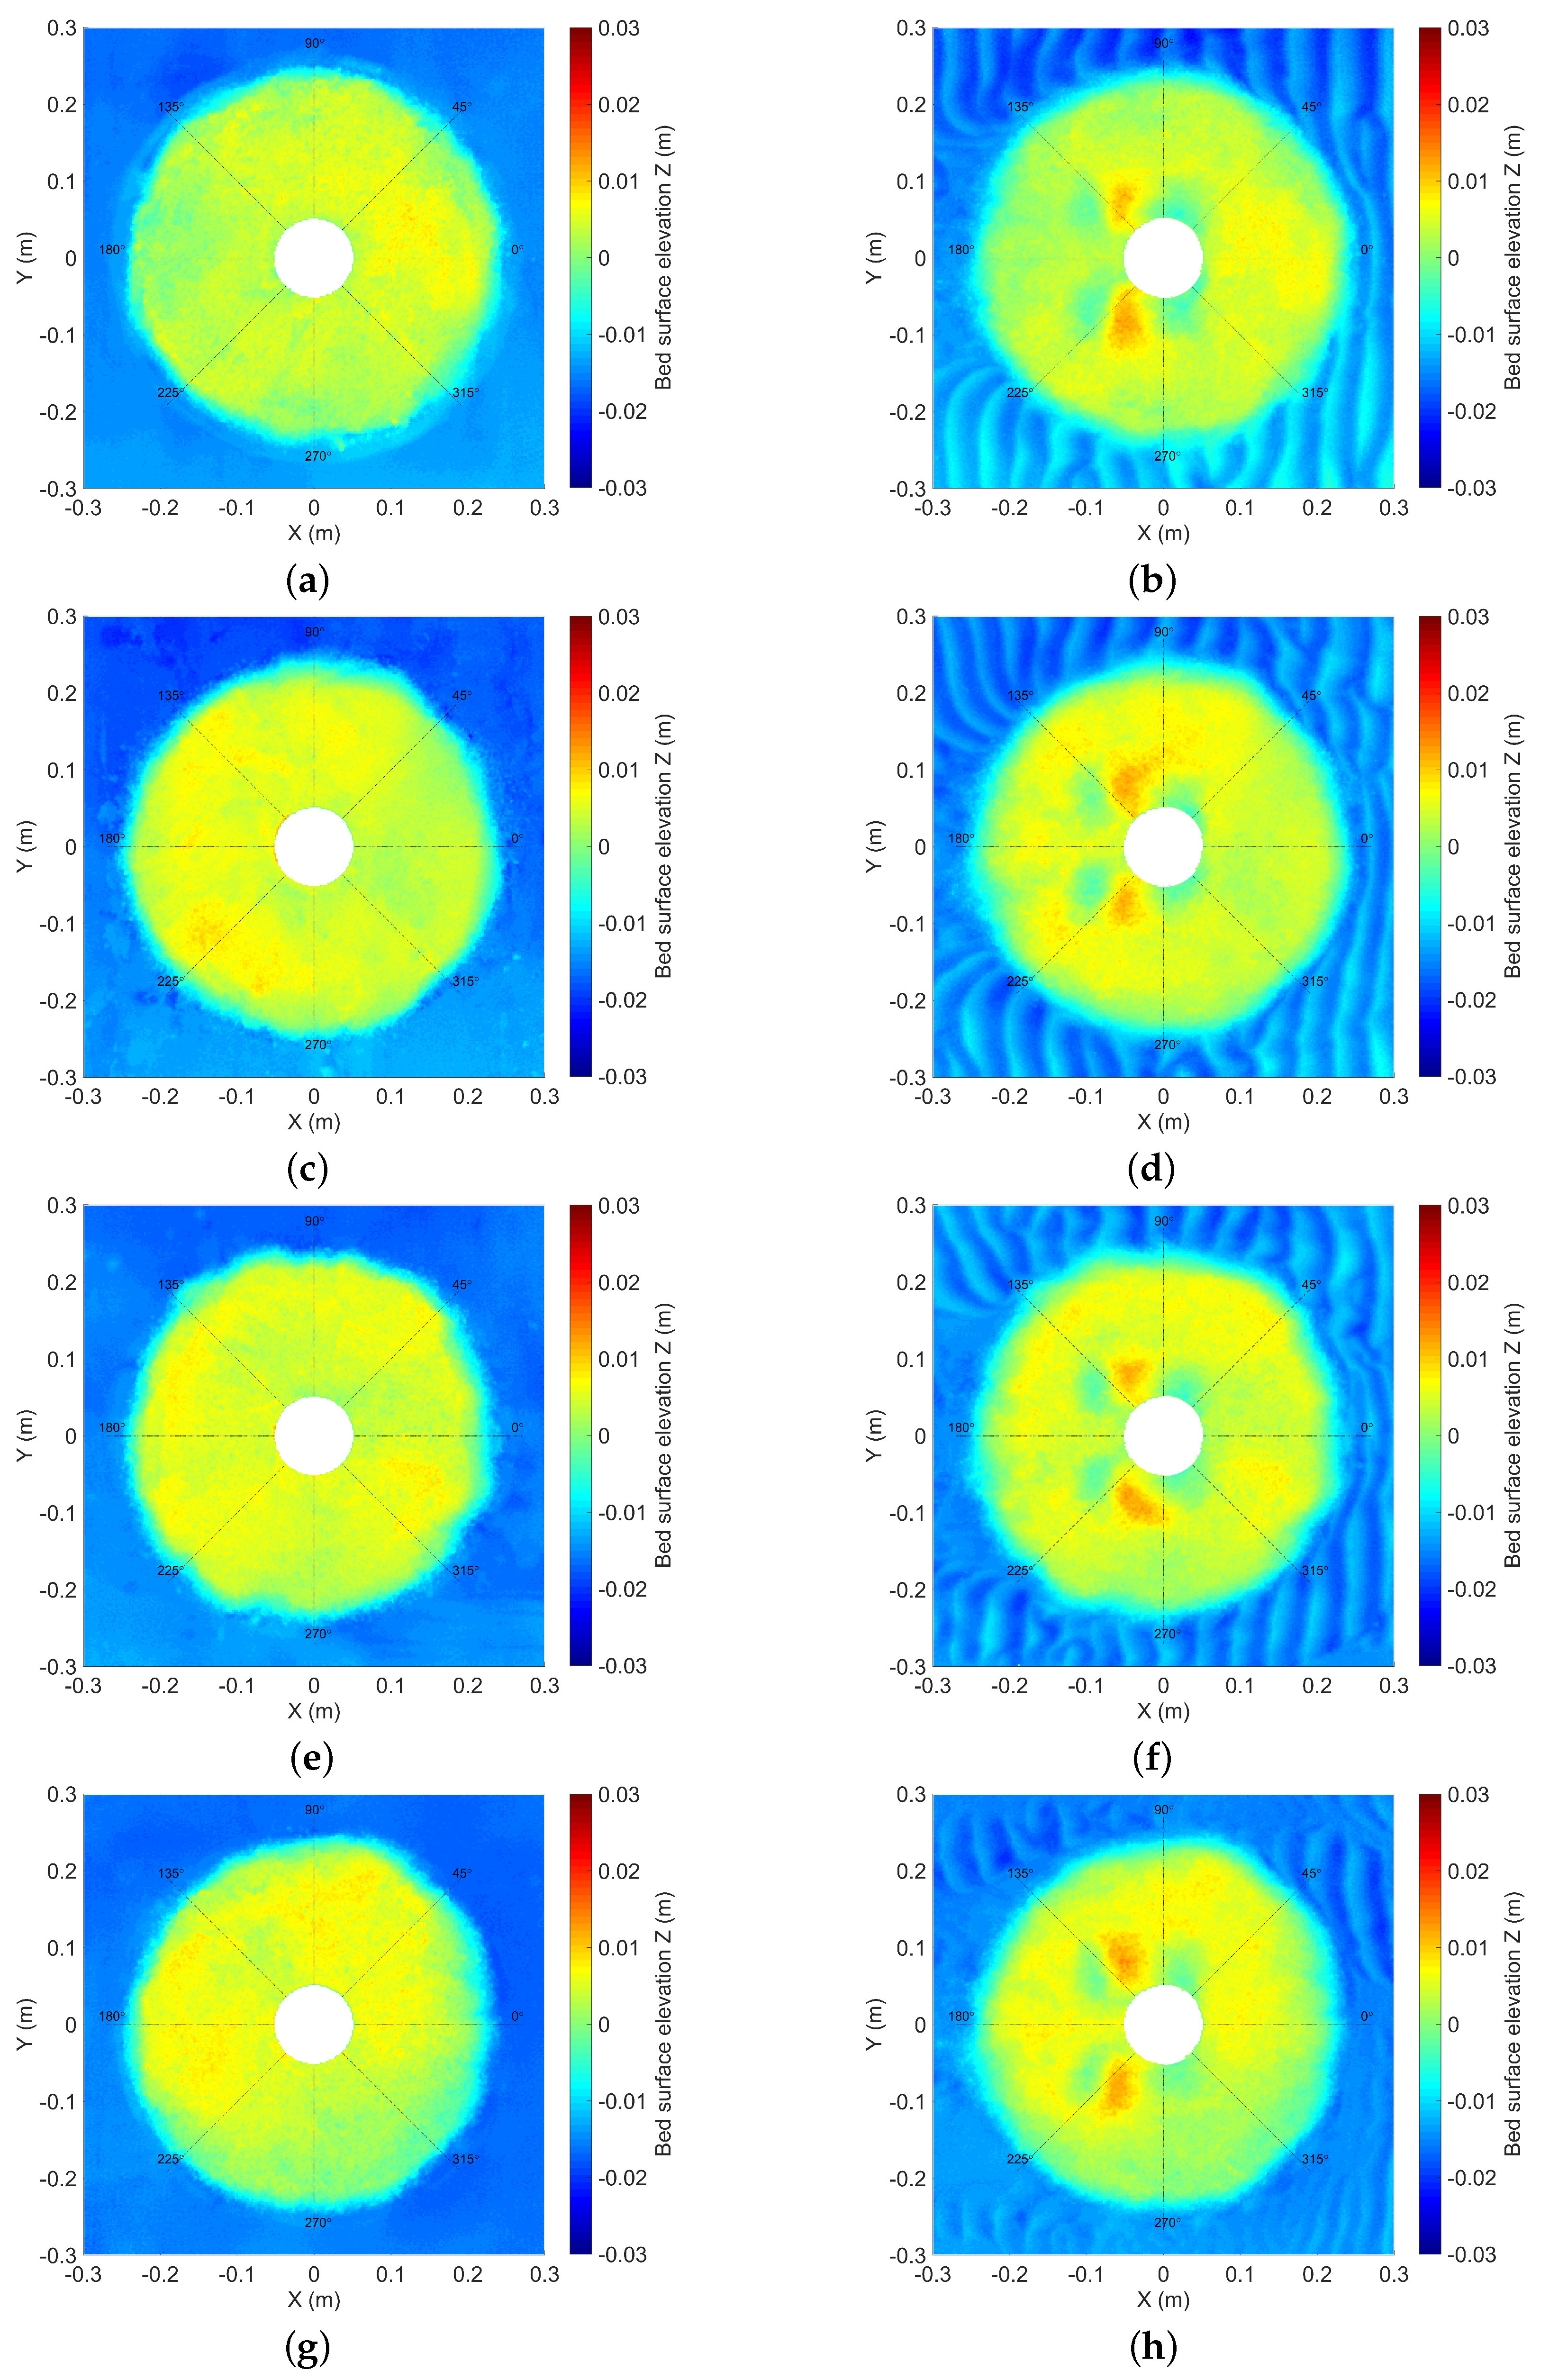
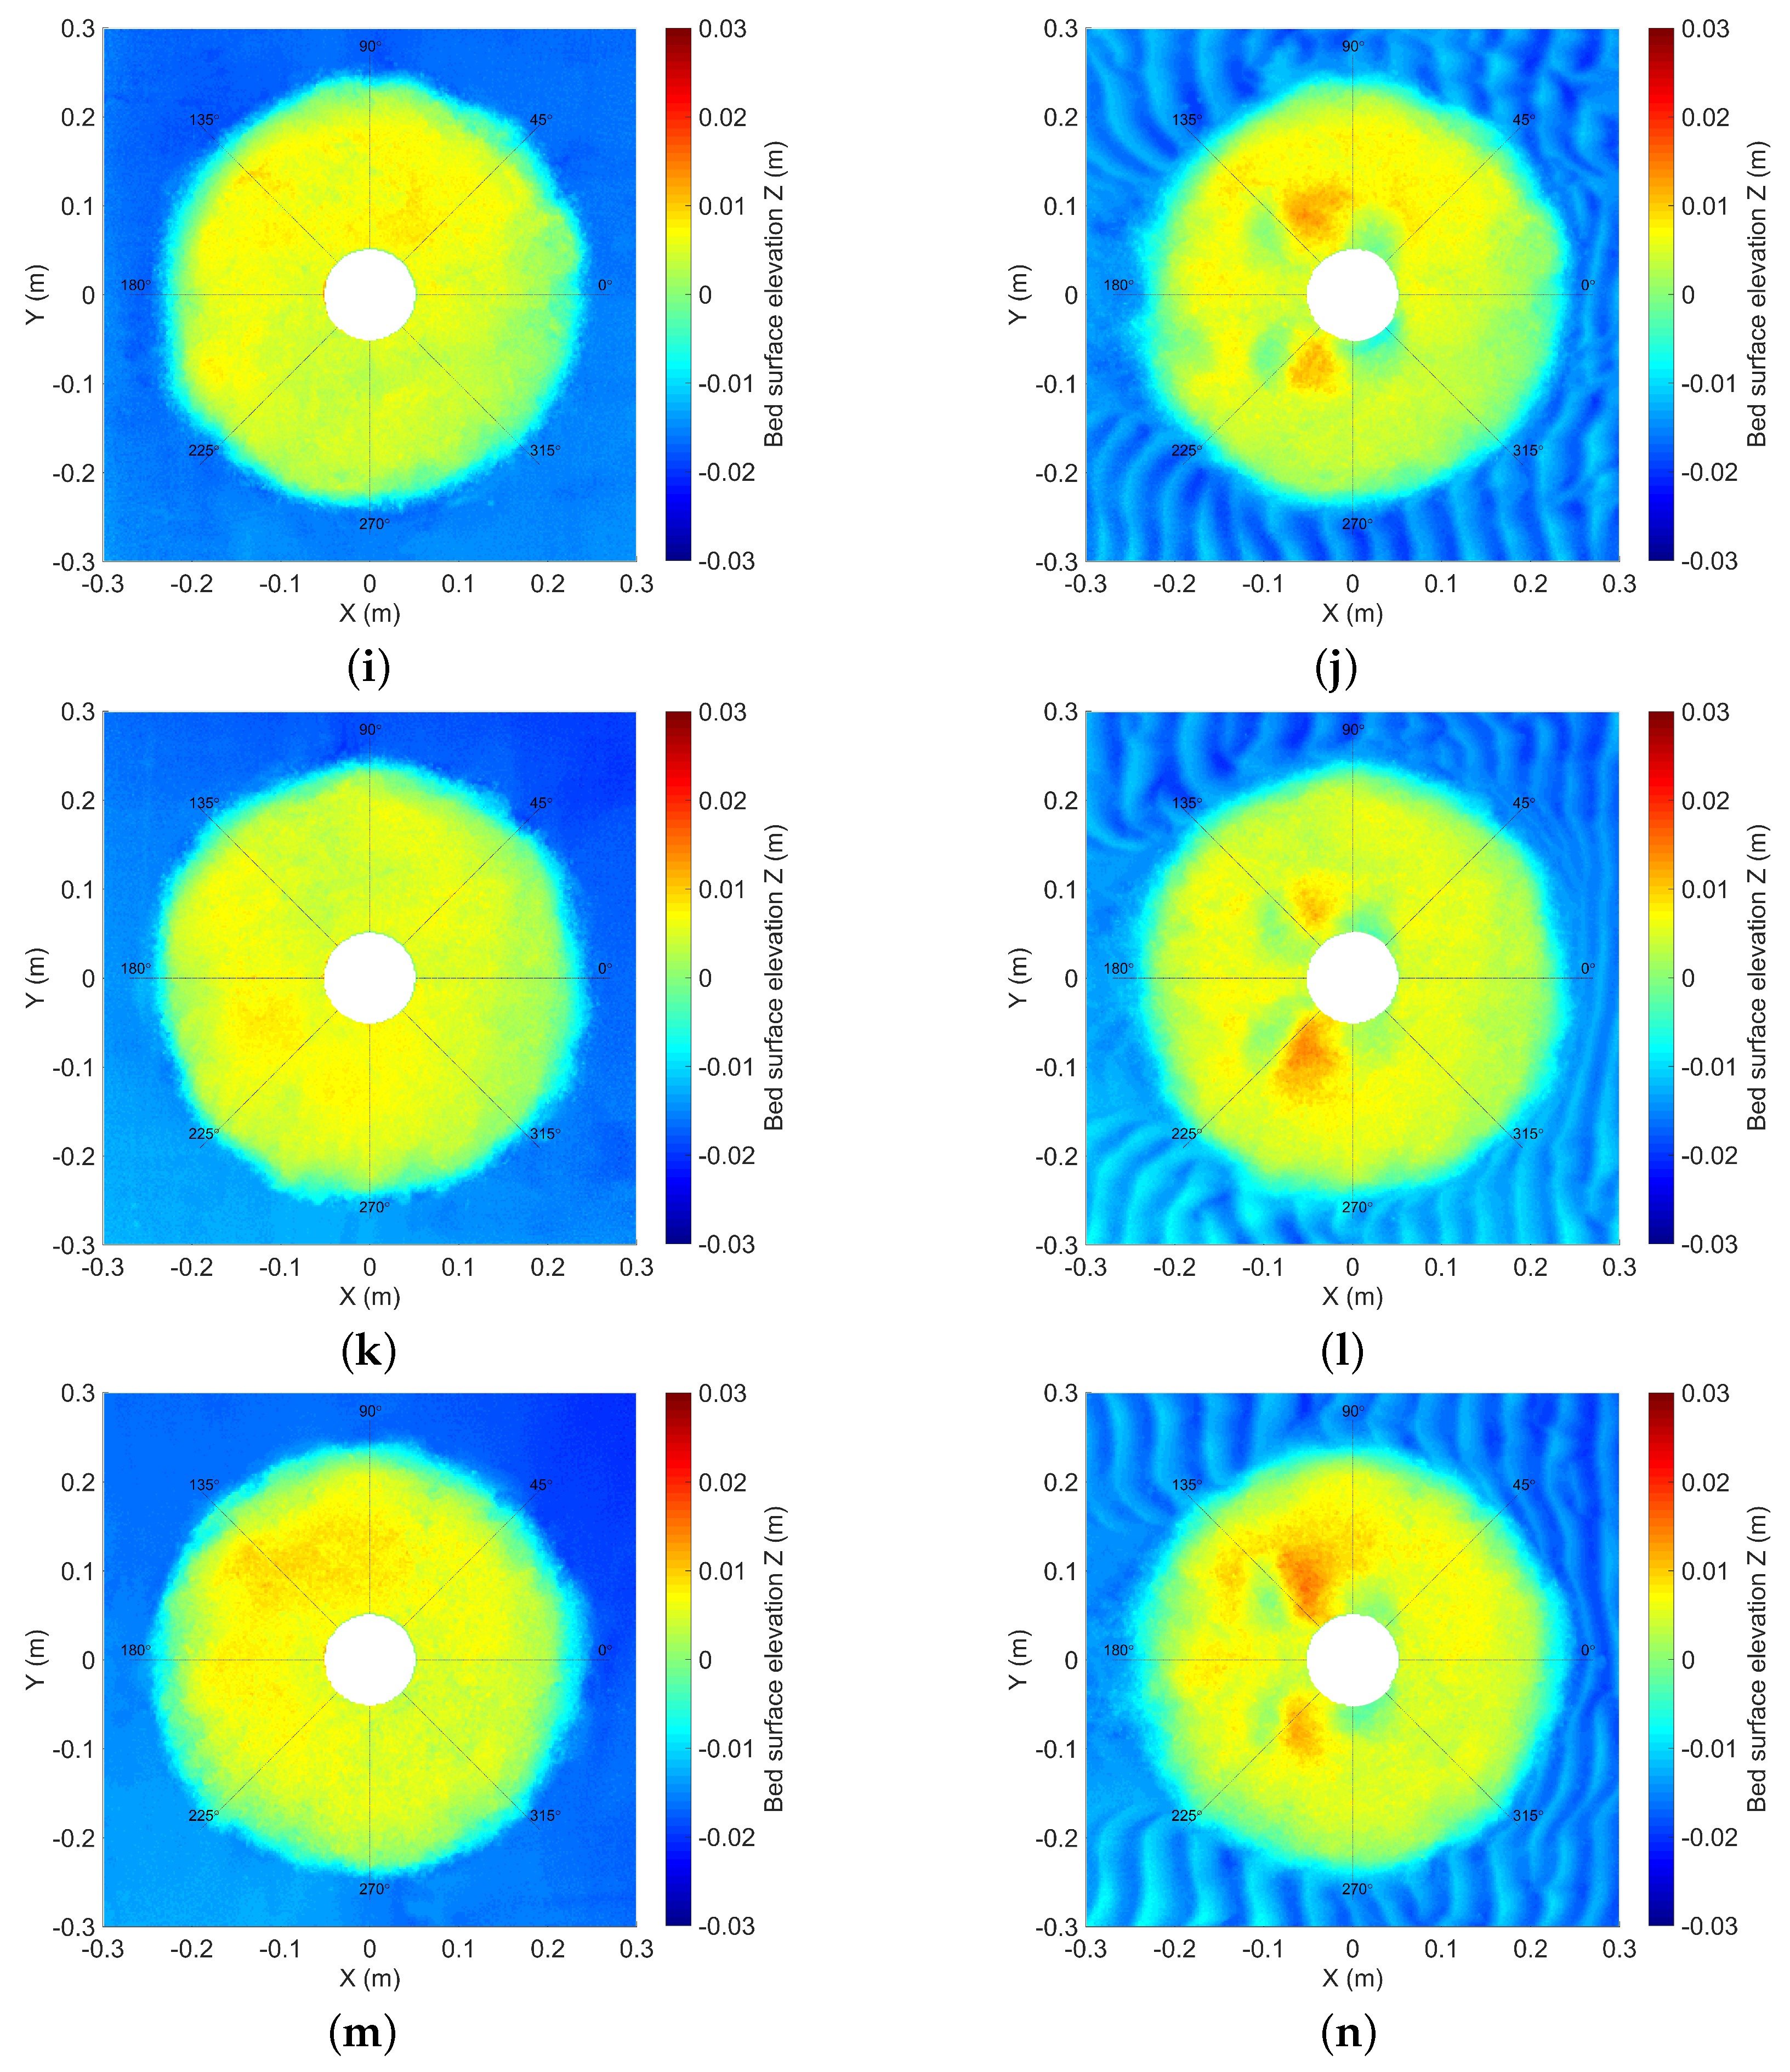
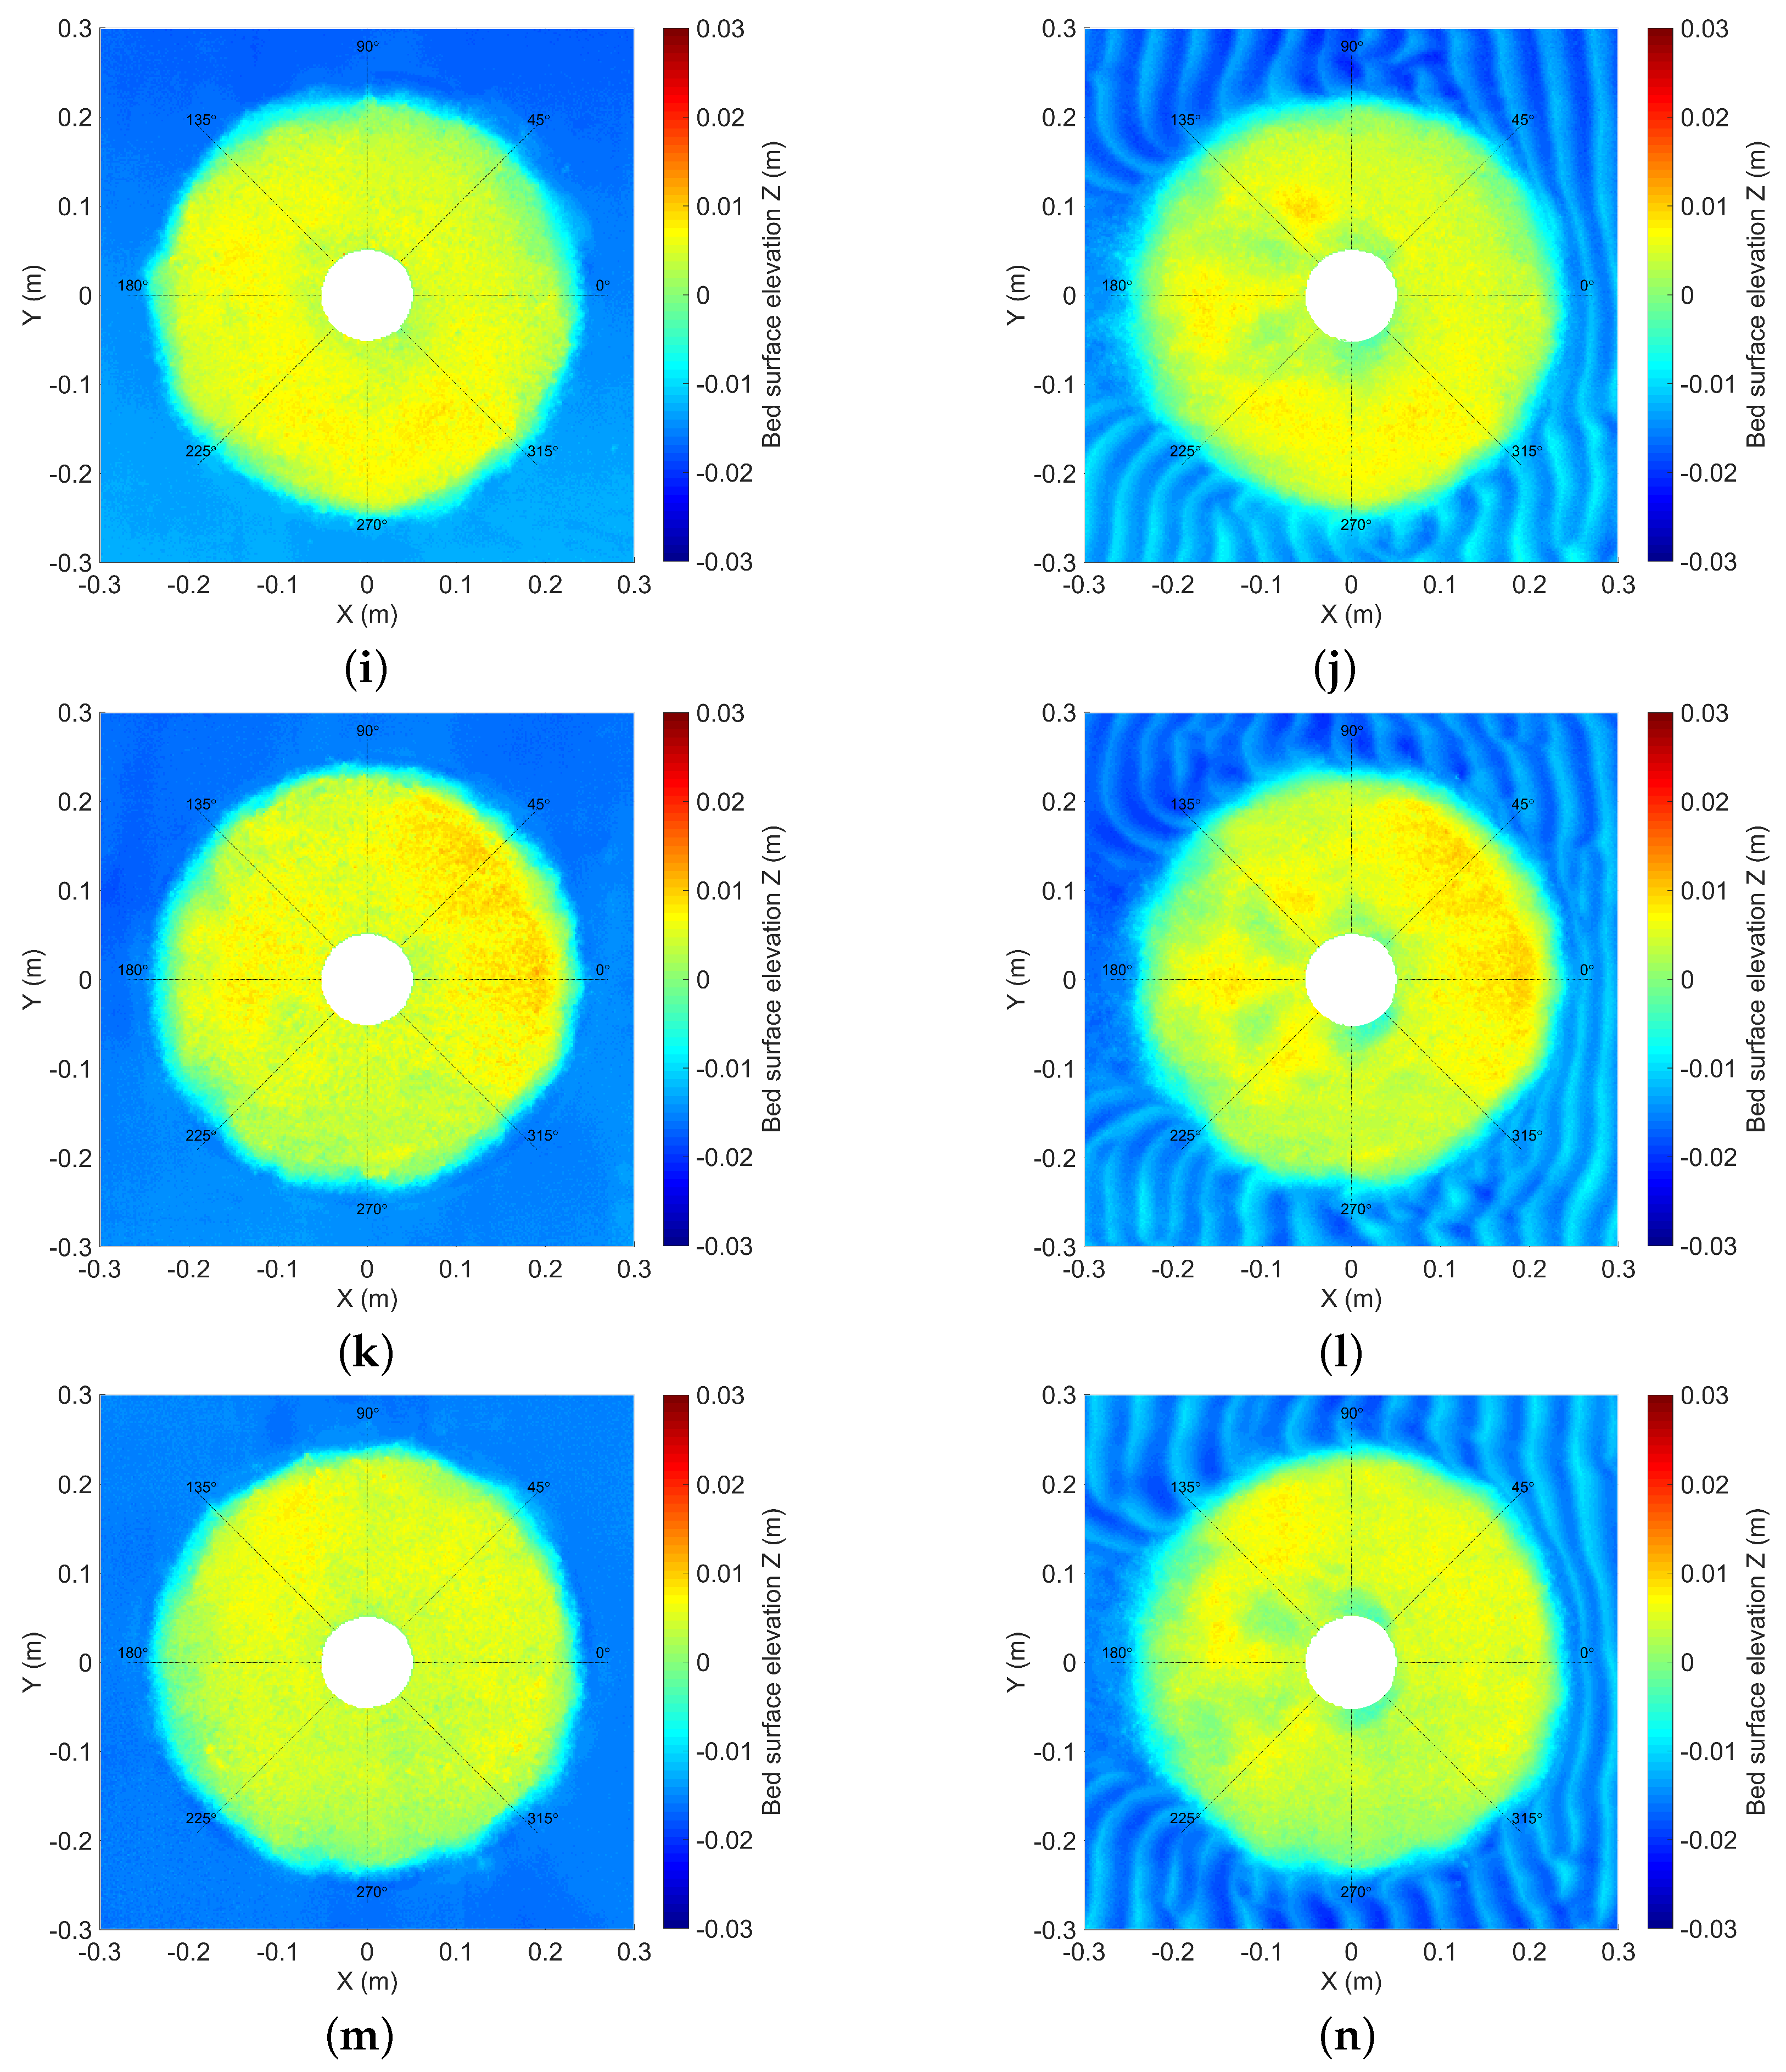
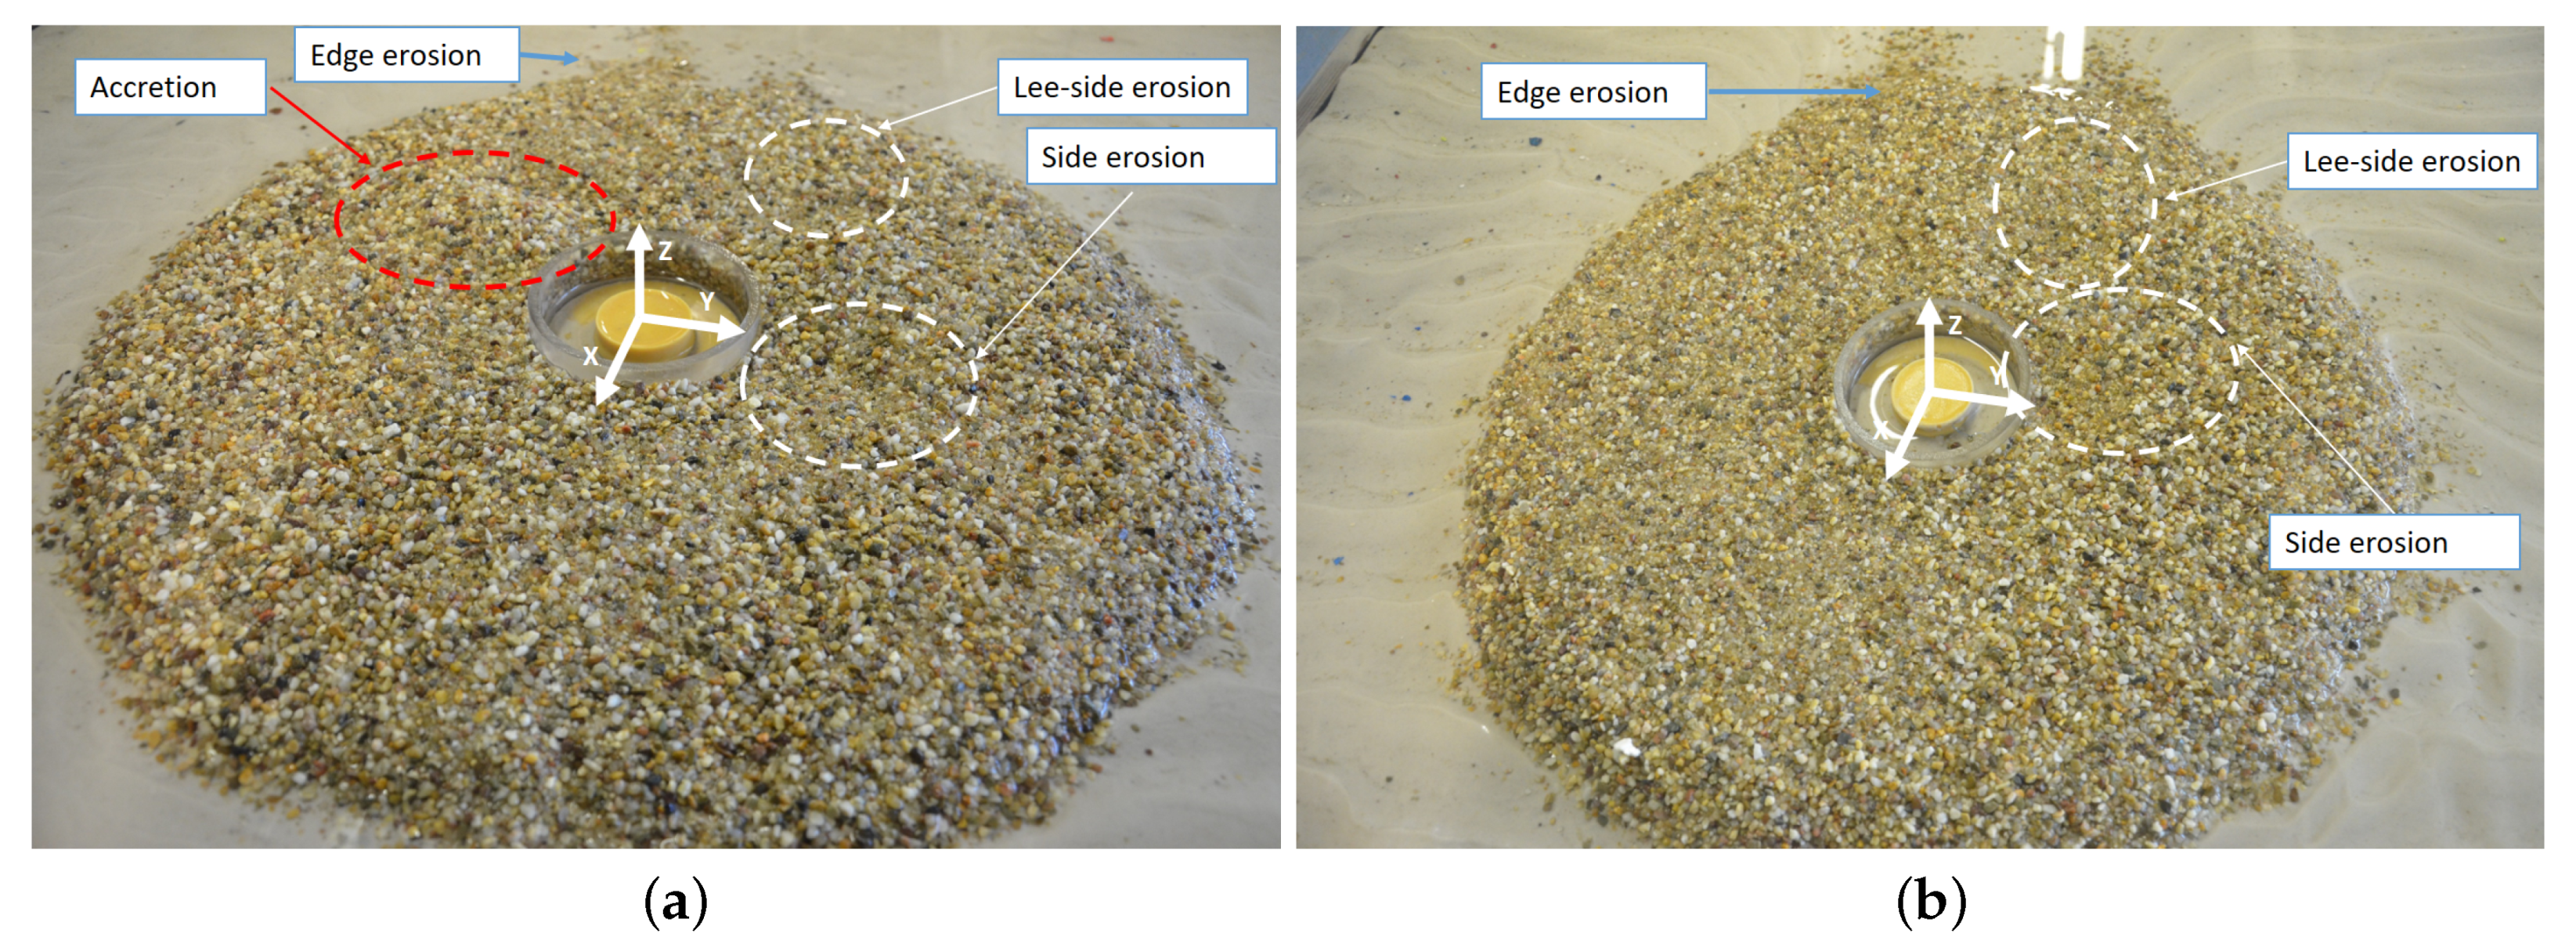
3.3. Damage Patterns
3.4. Model Effects Analysis
4. Discussion
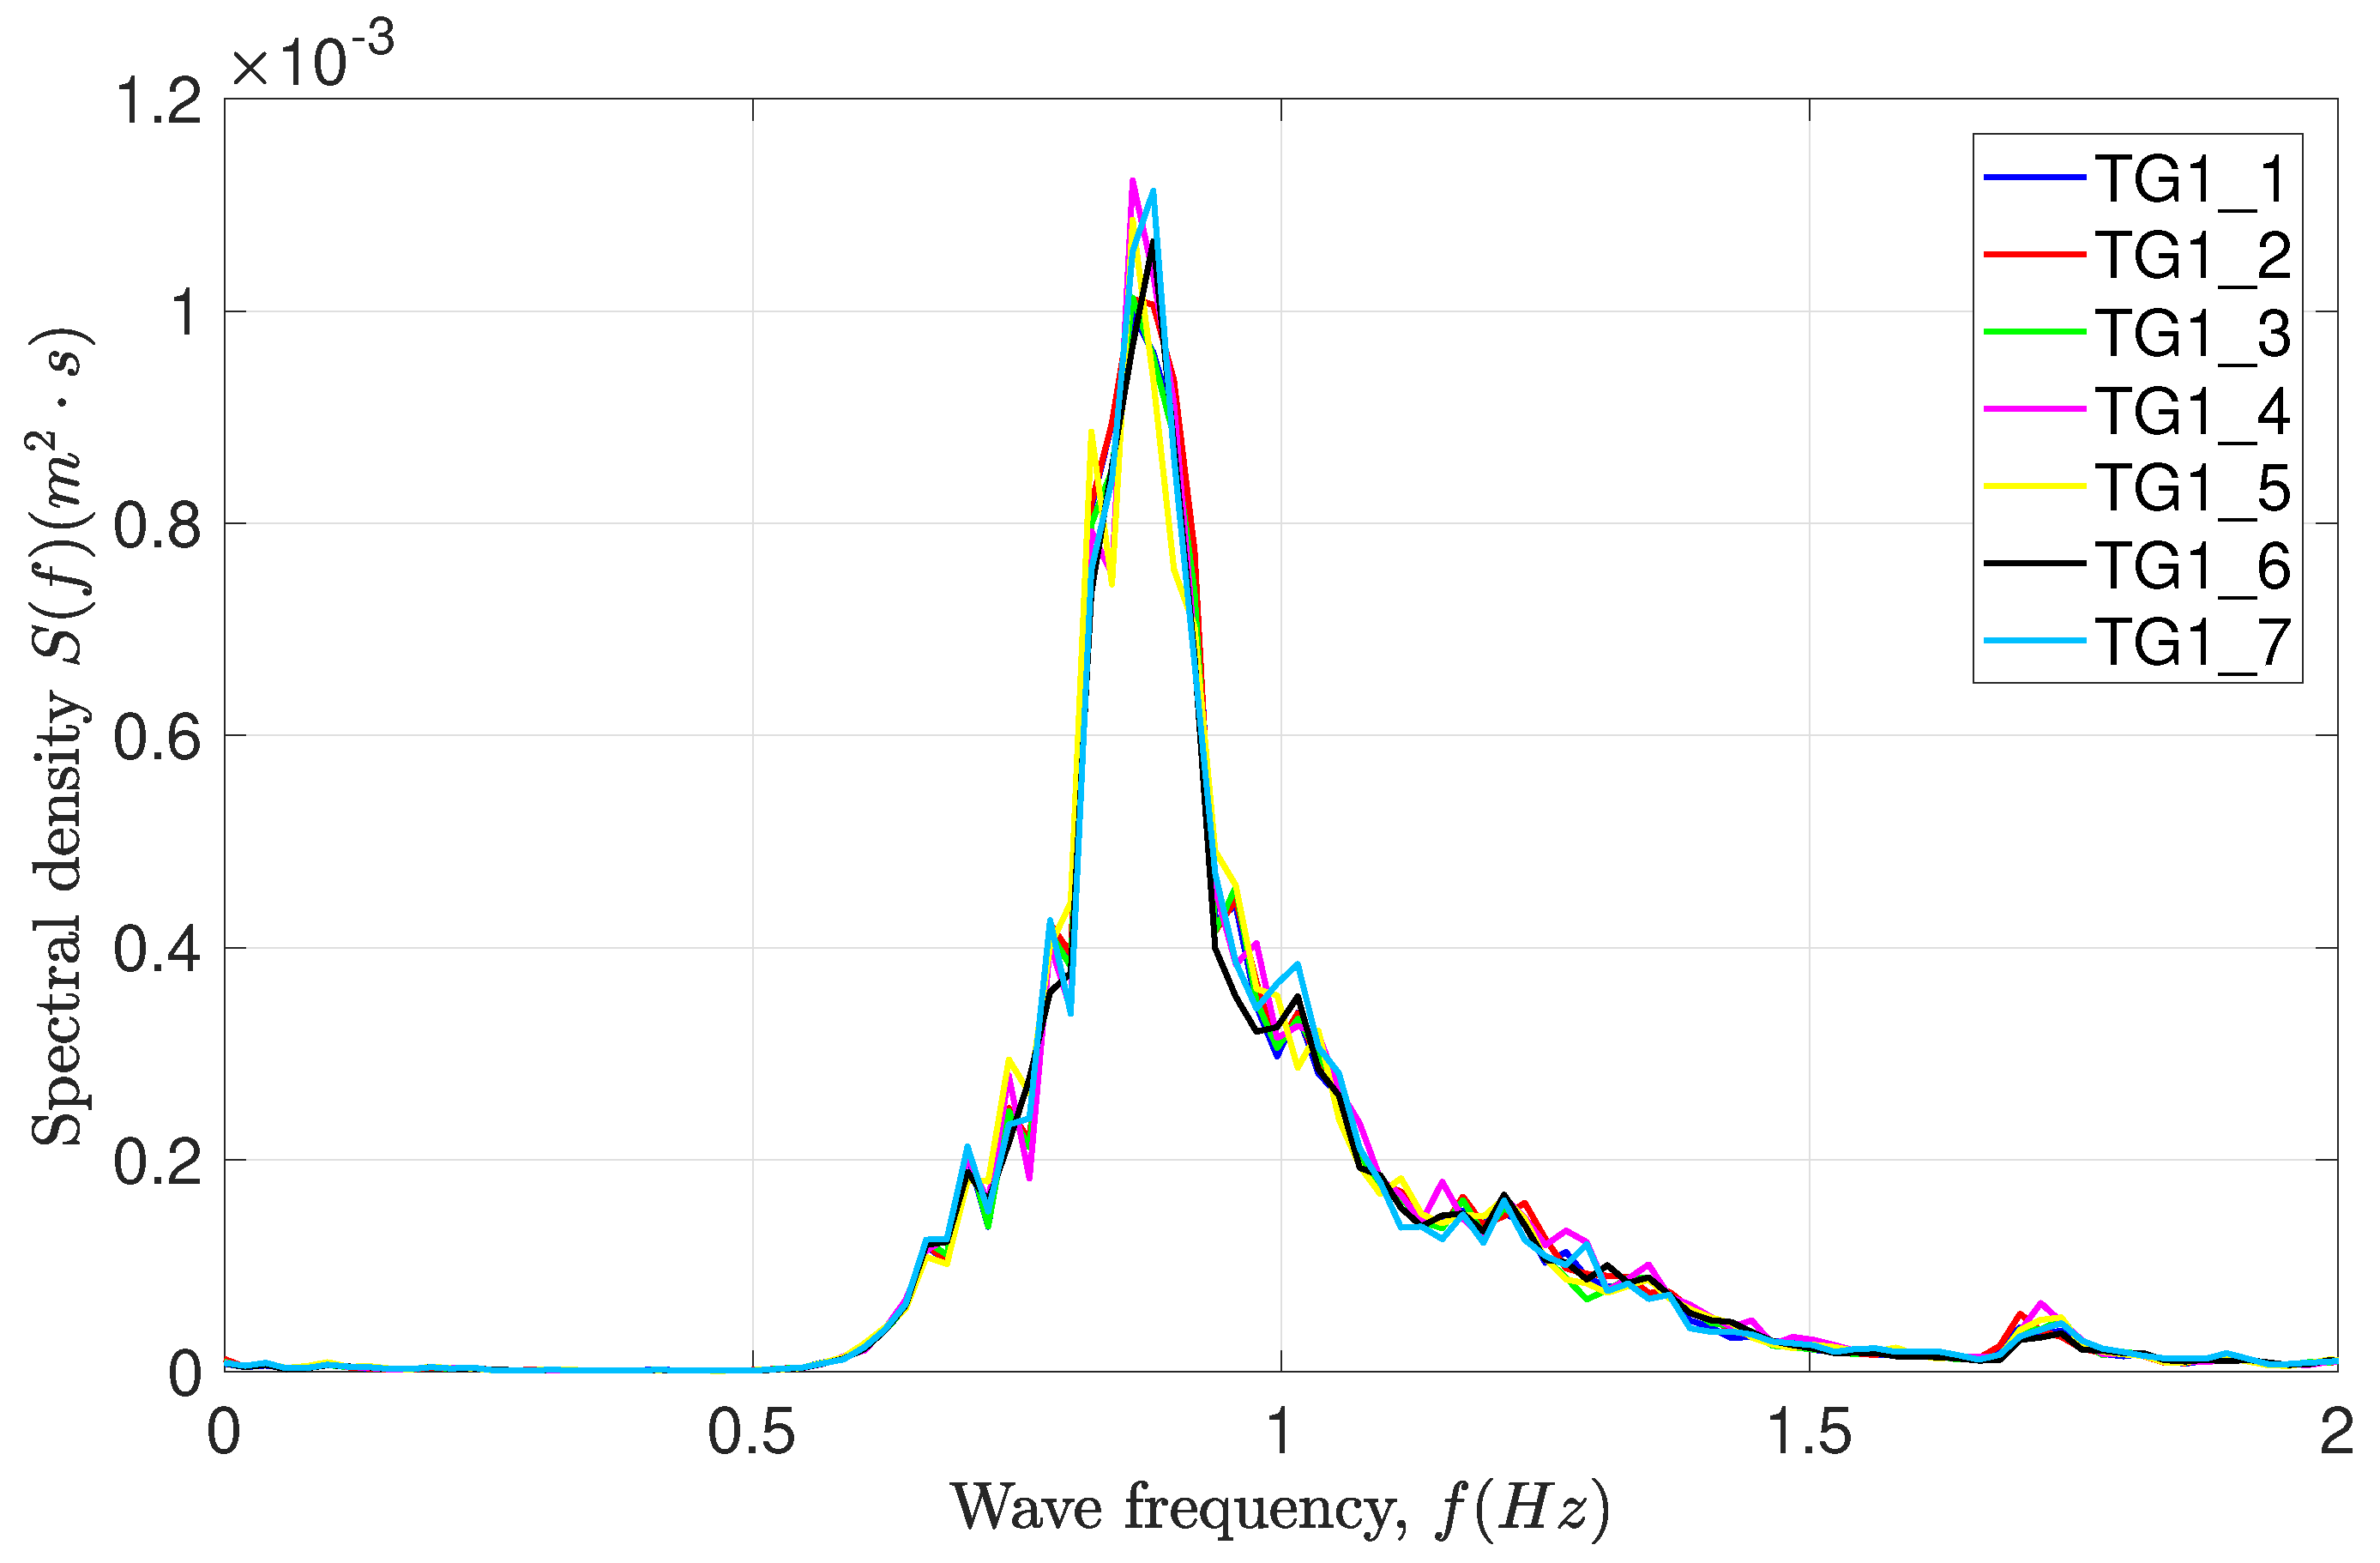
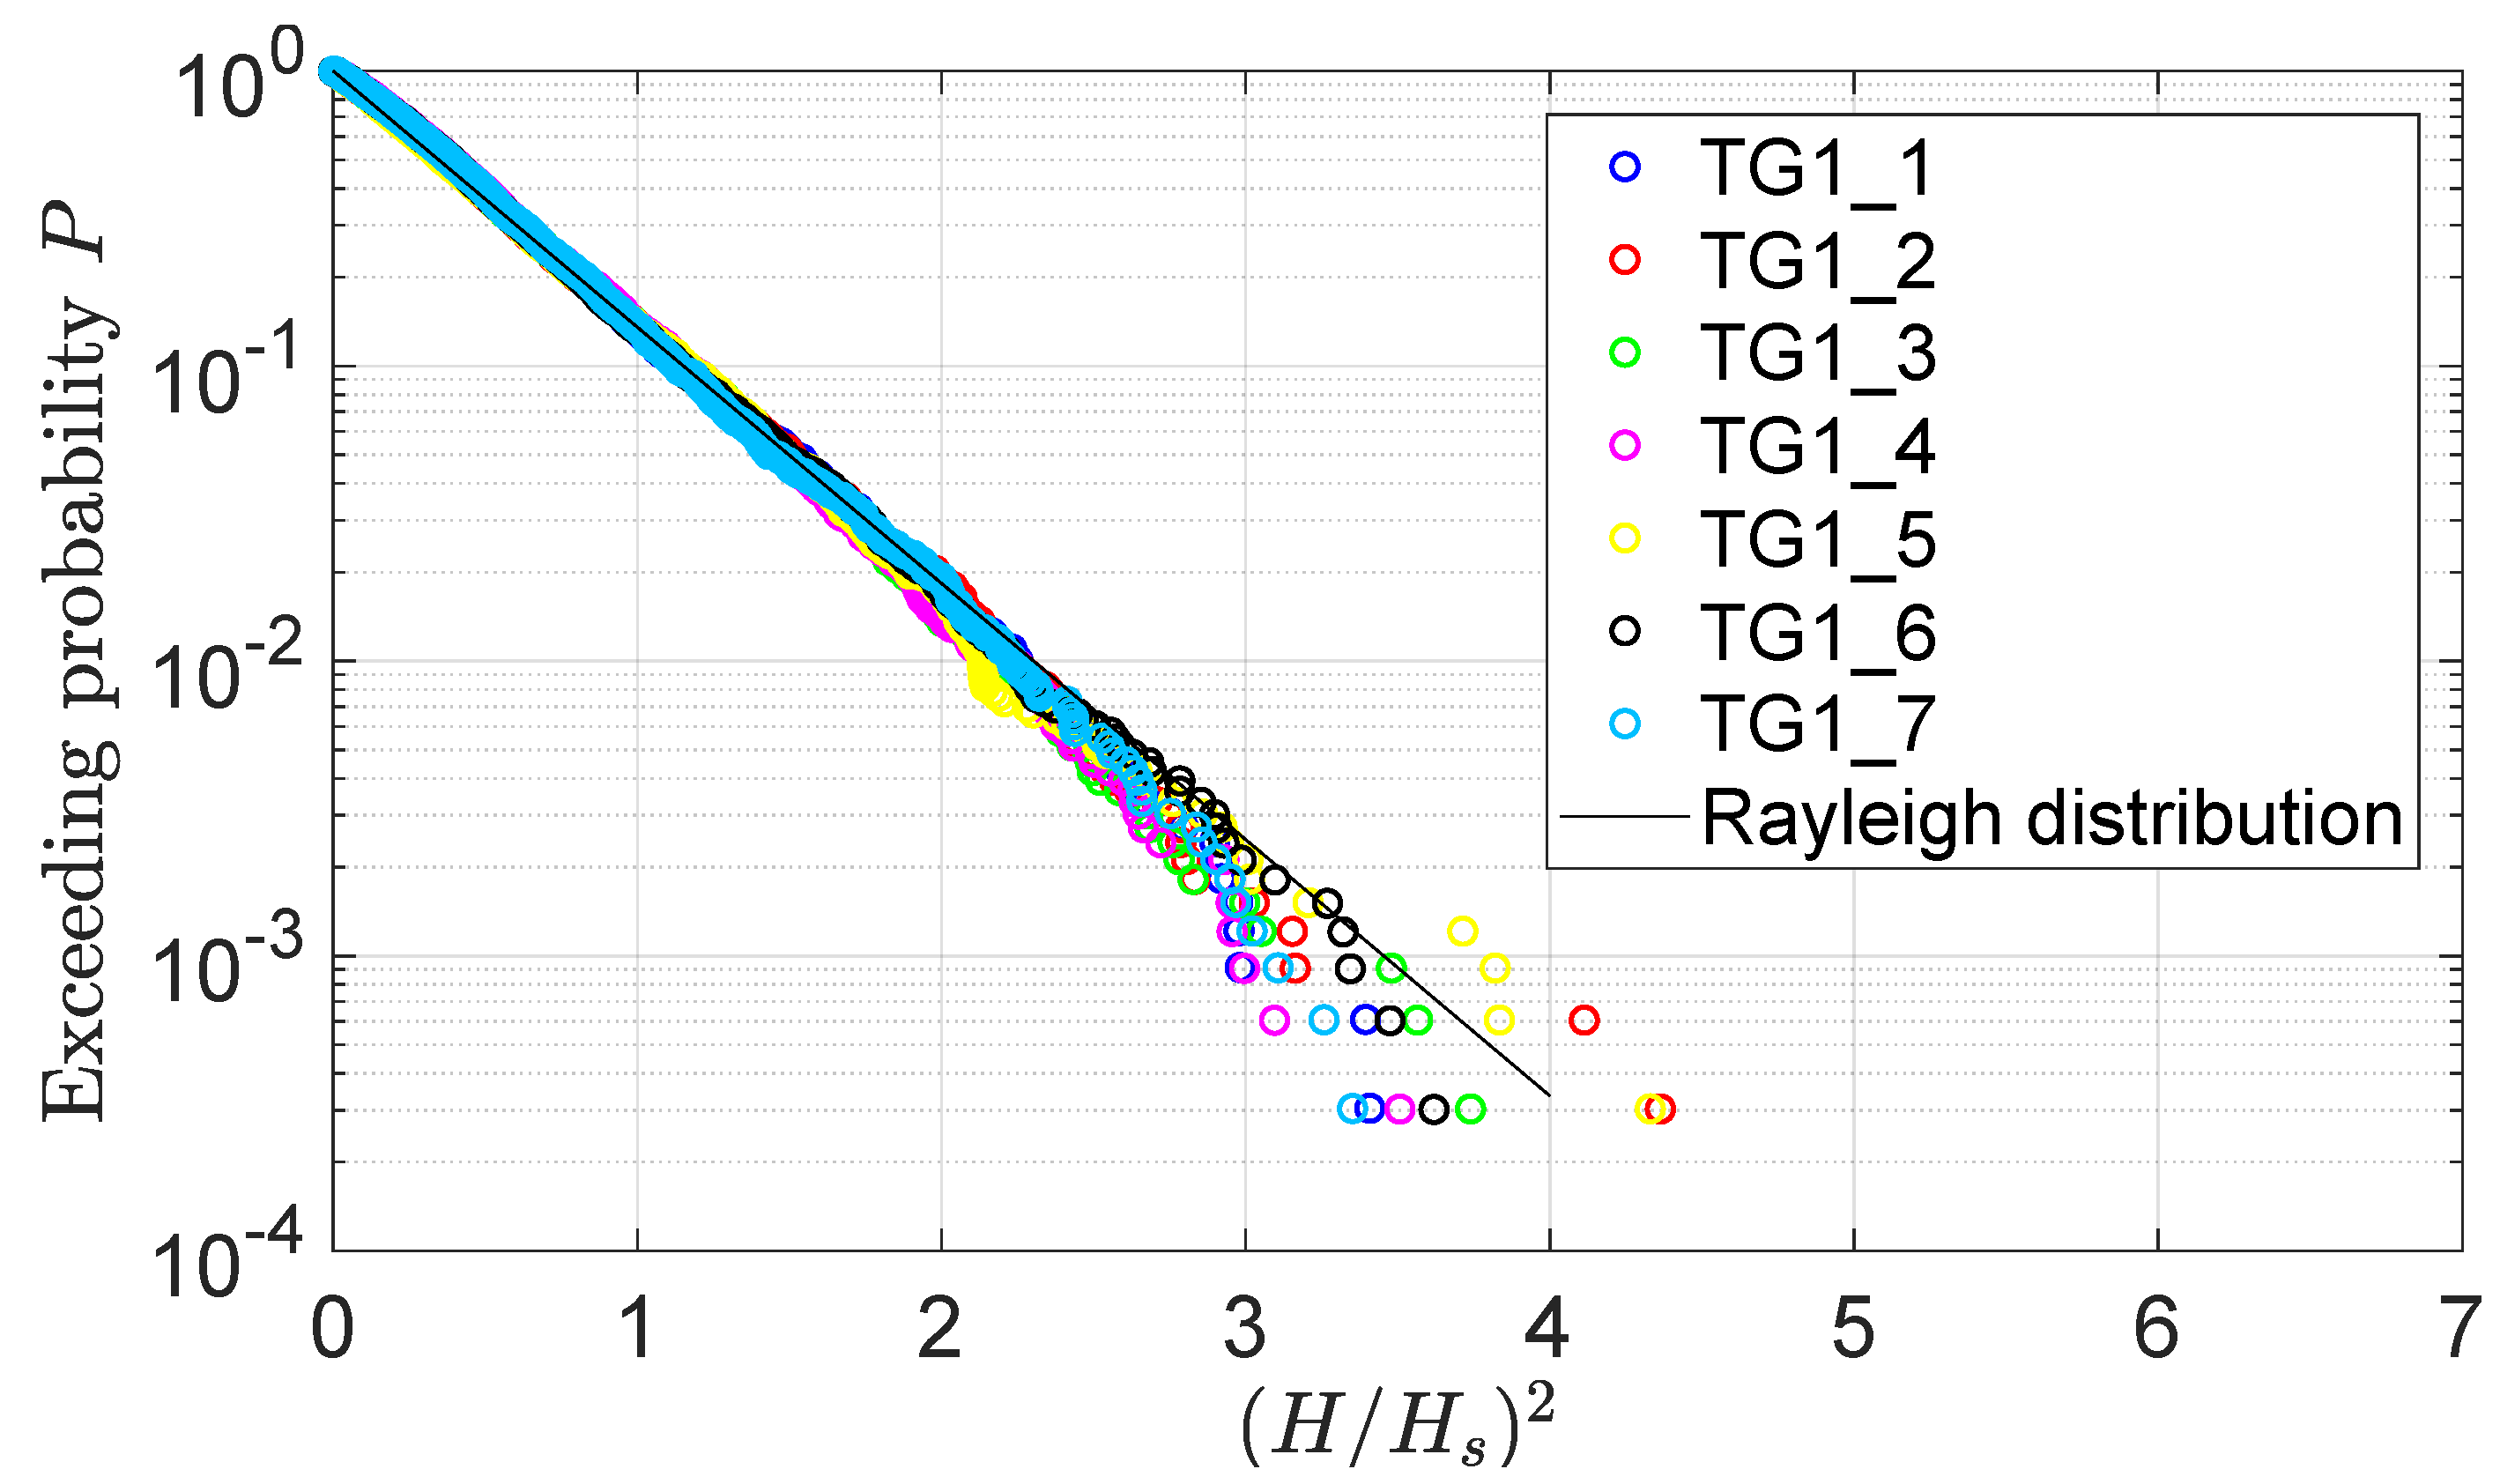
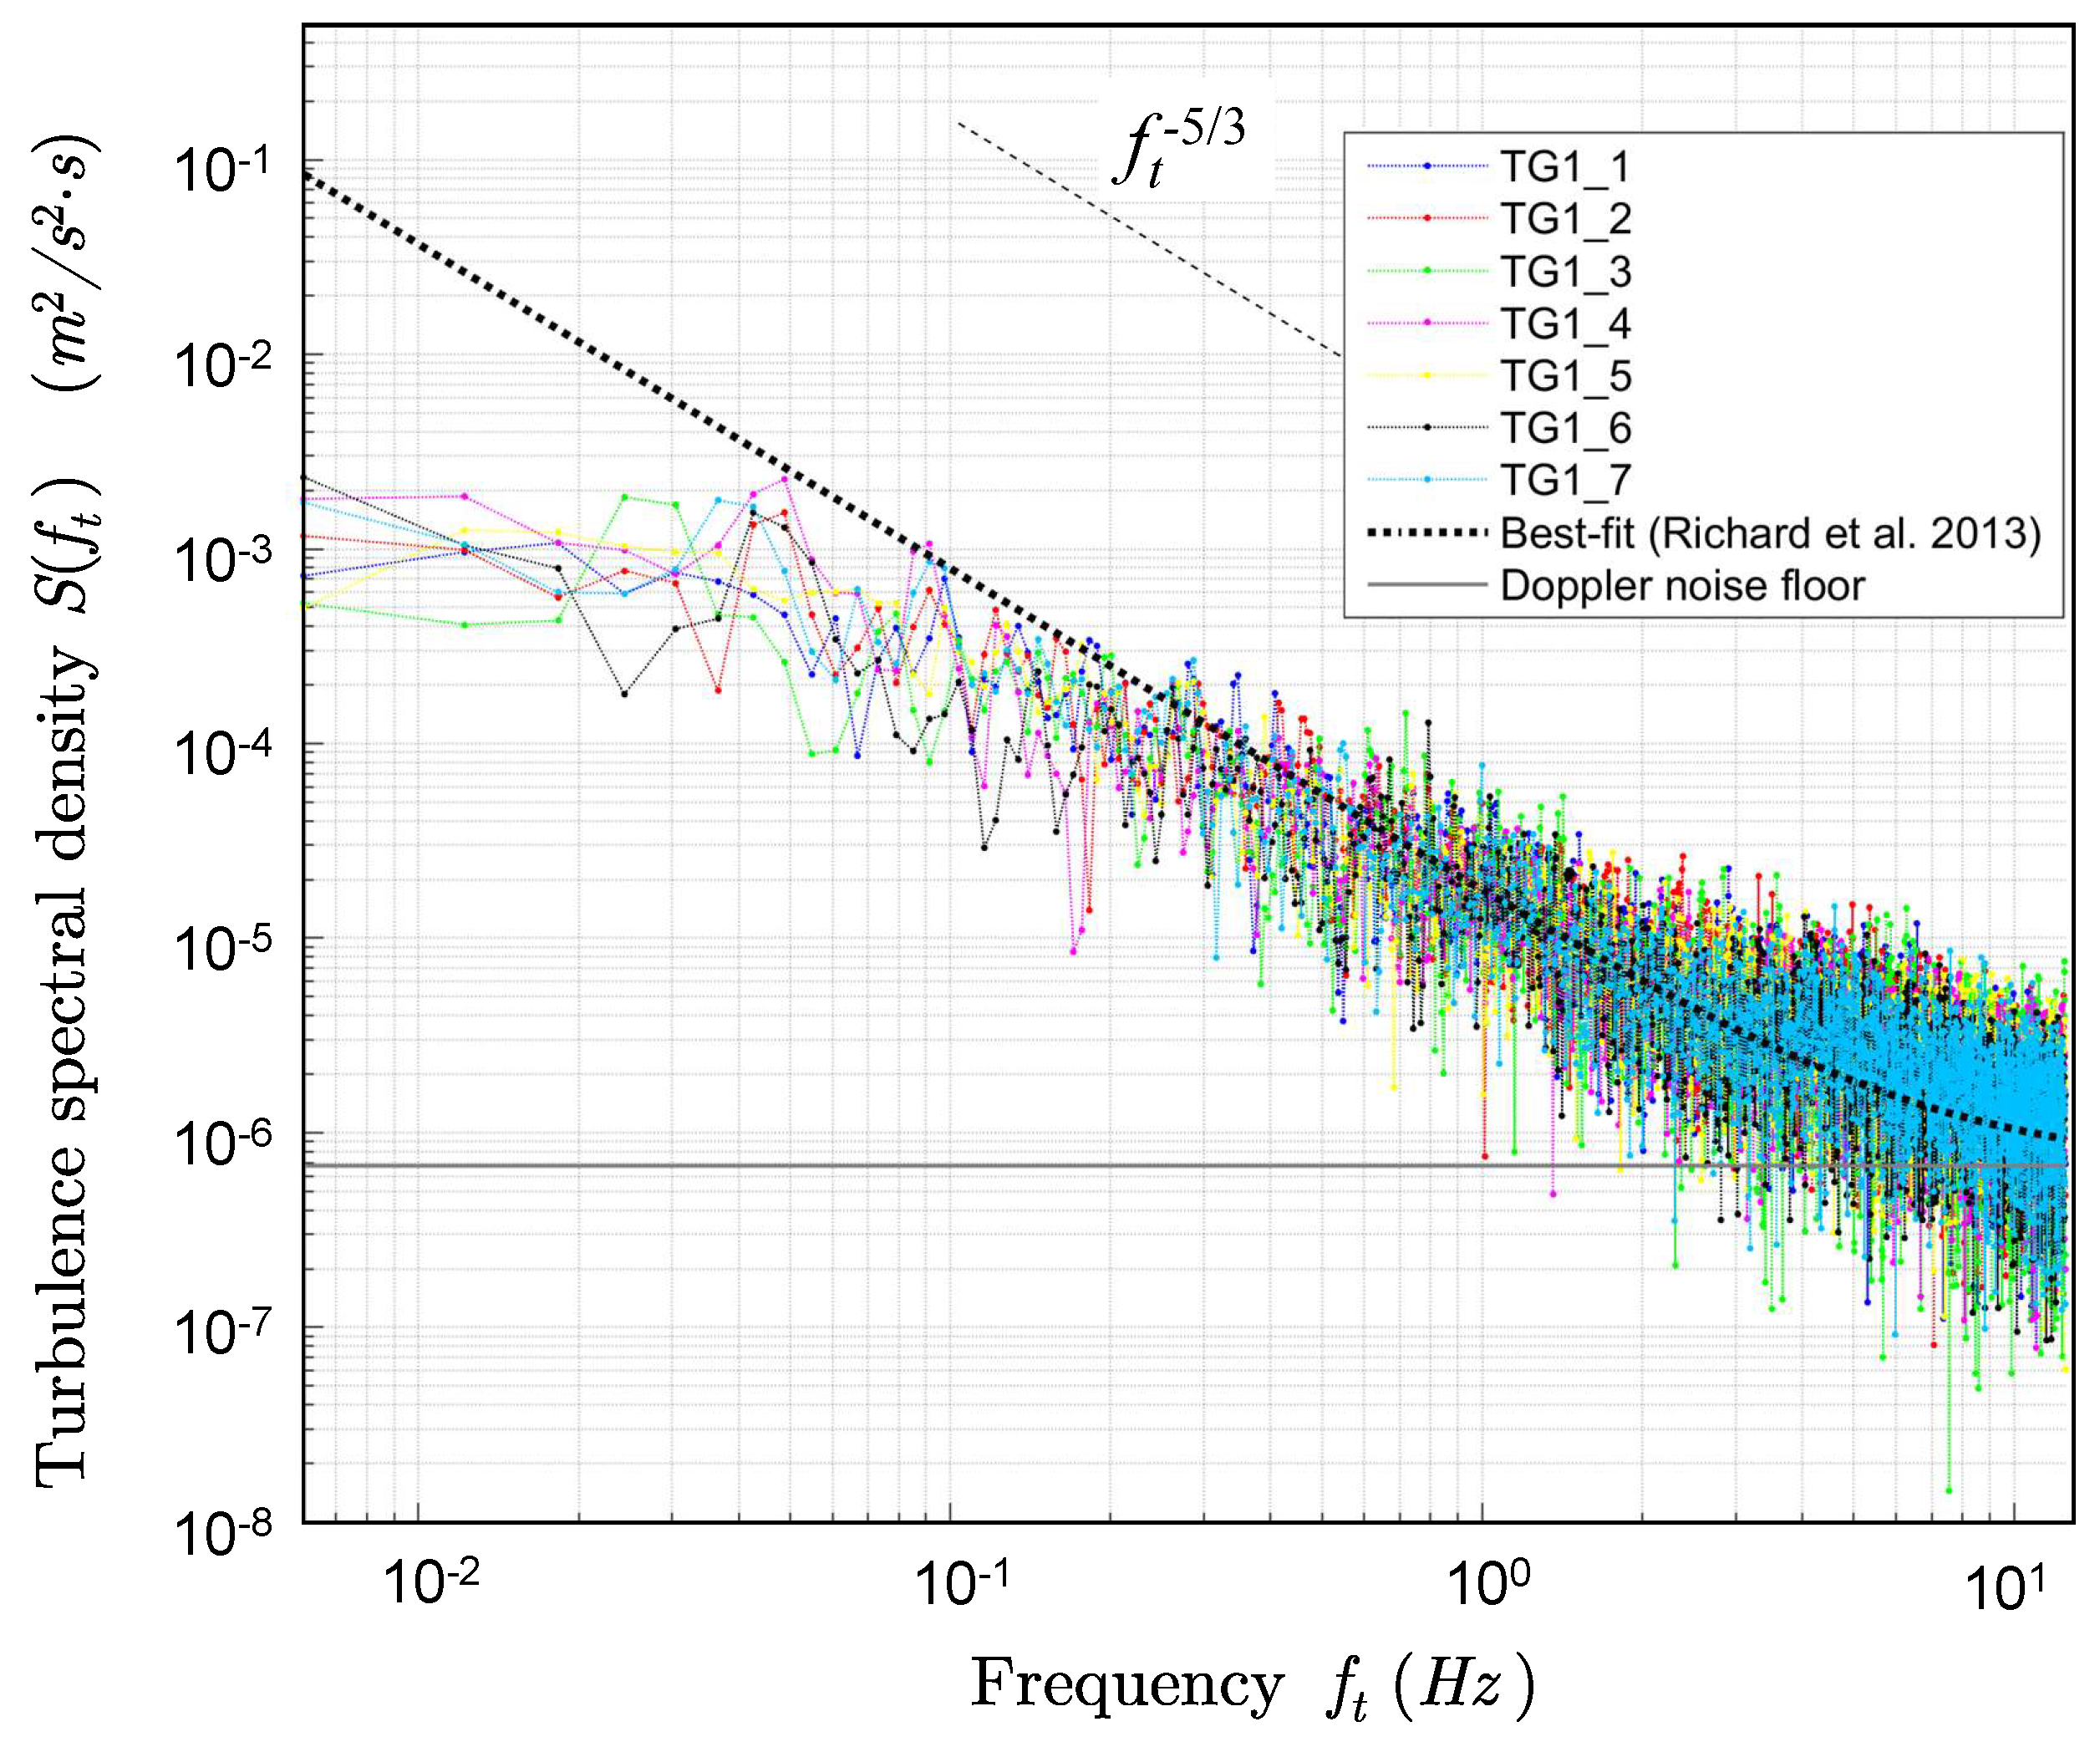
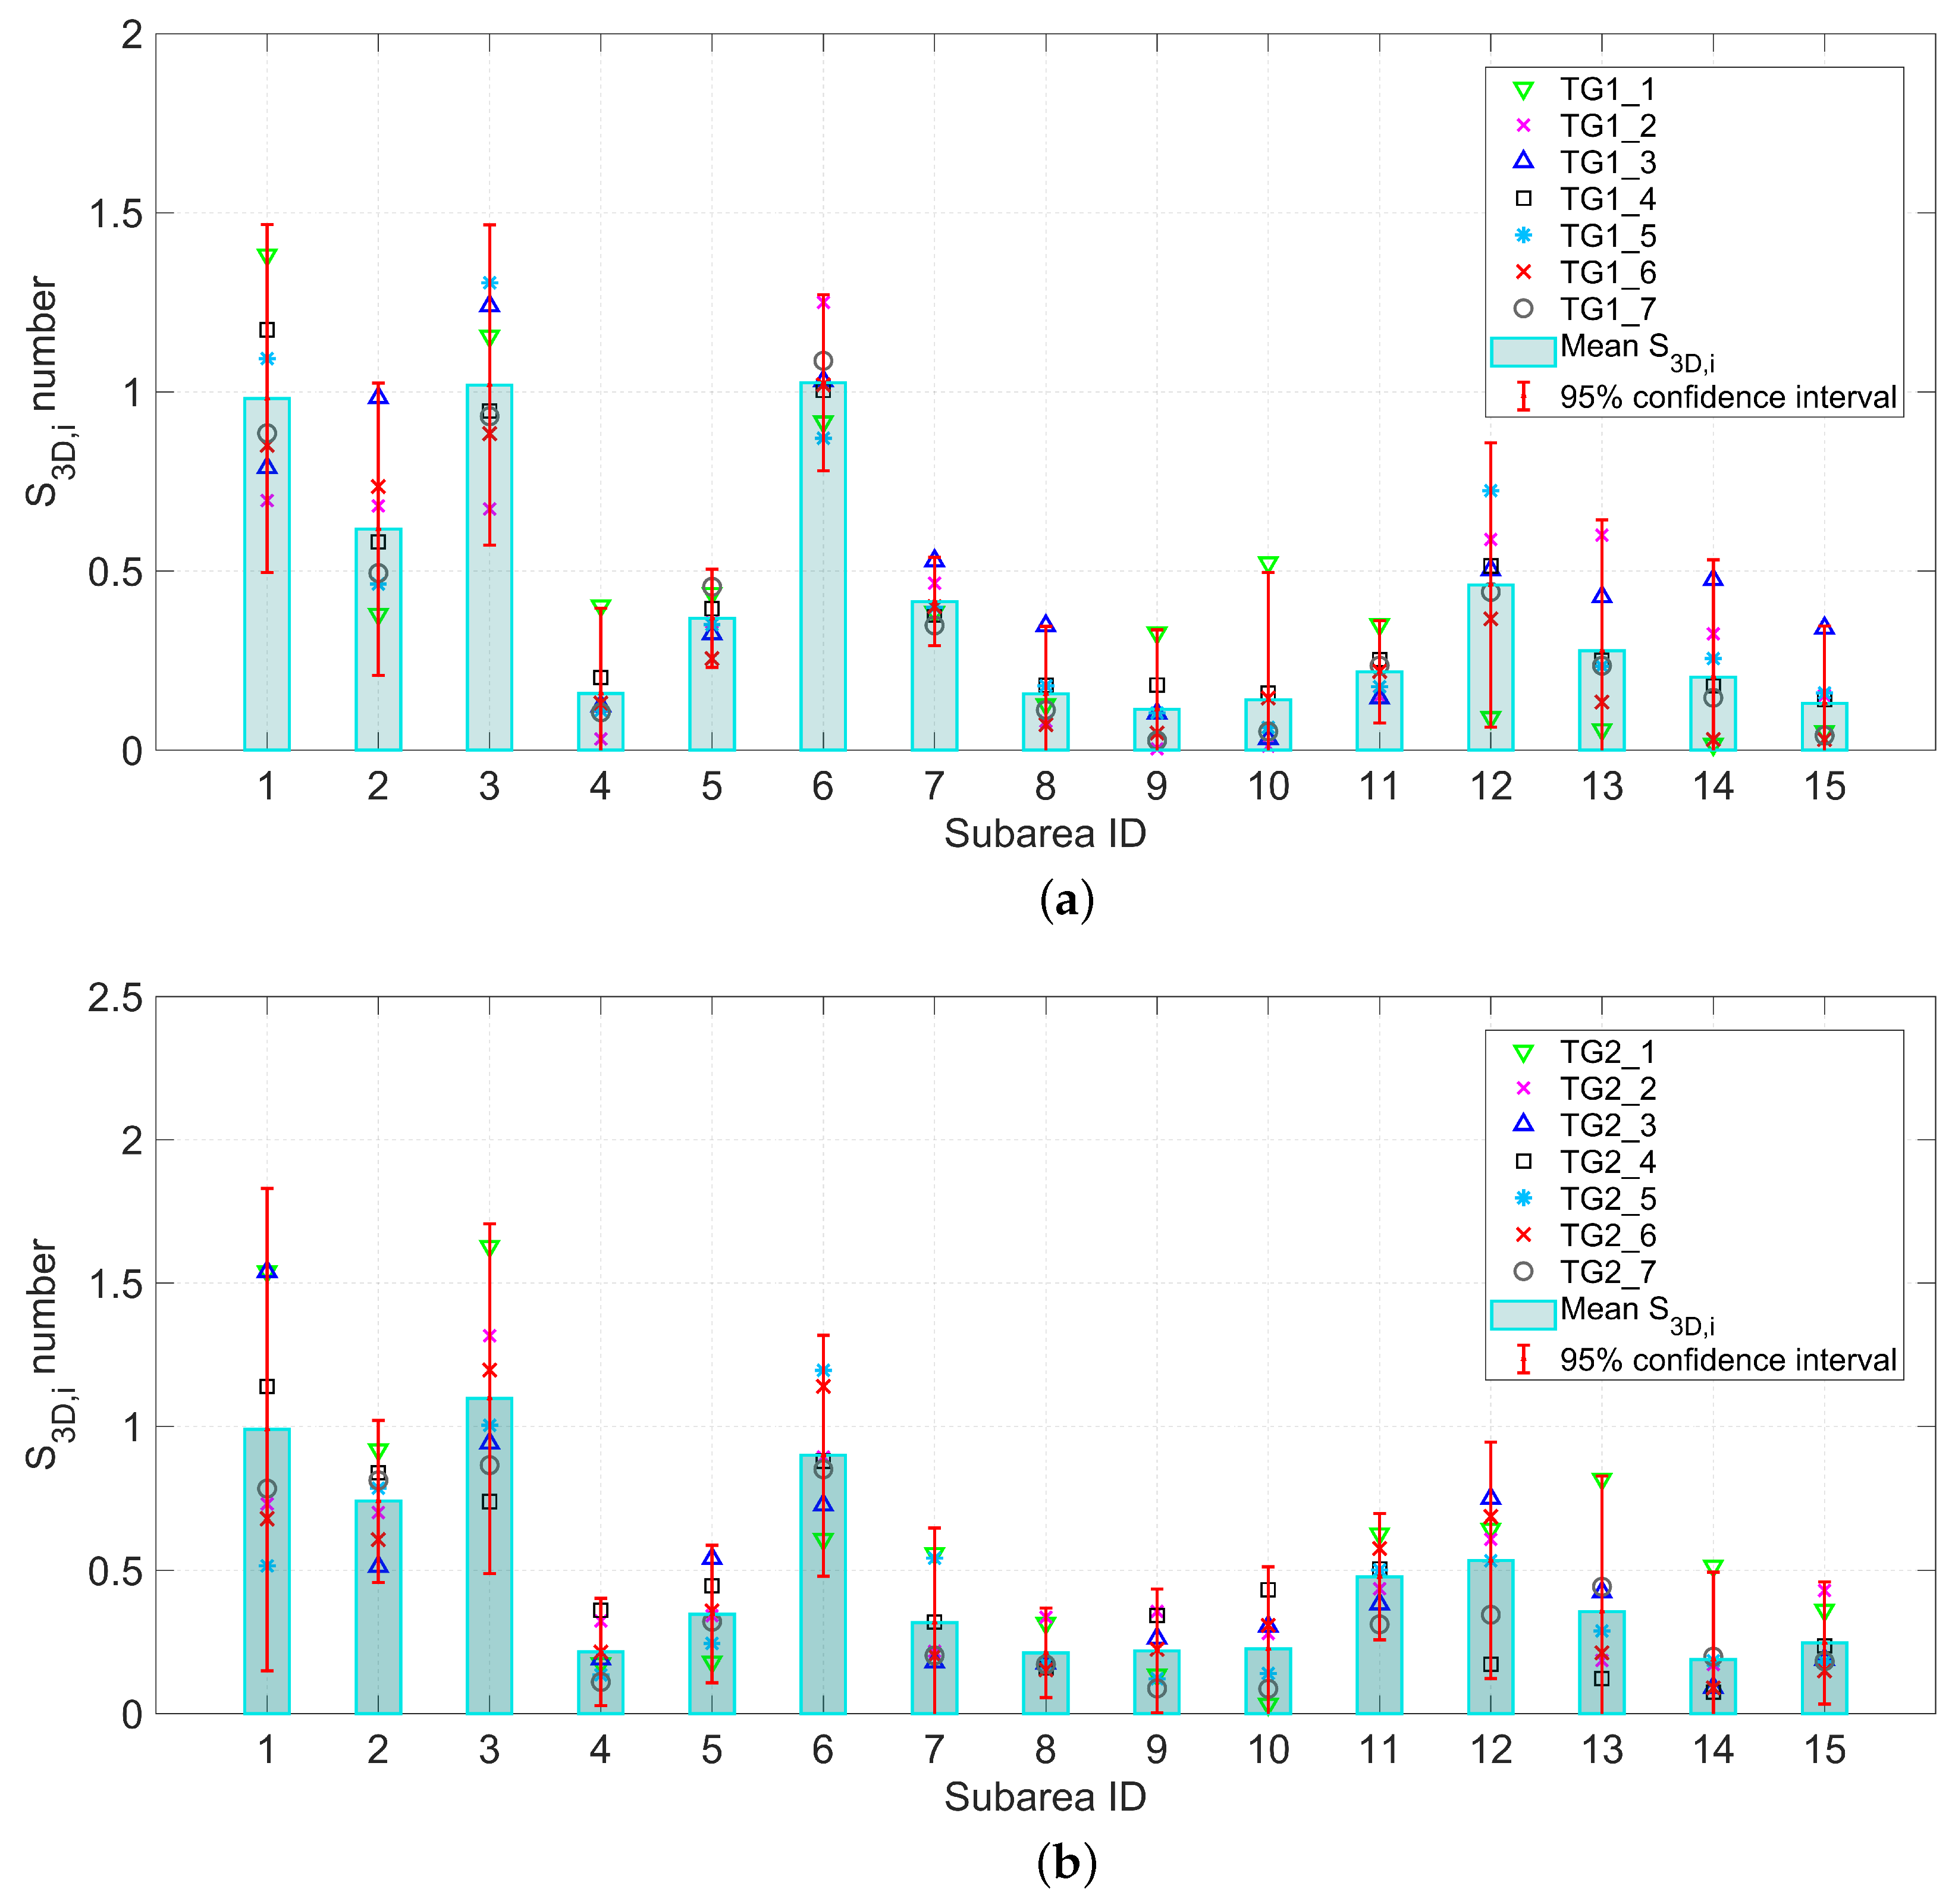
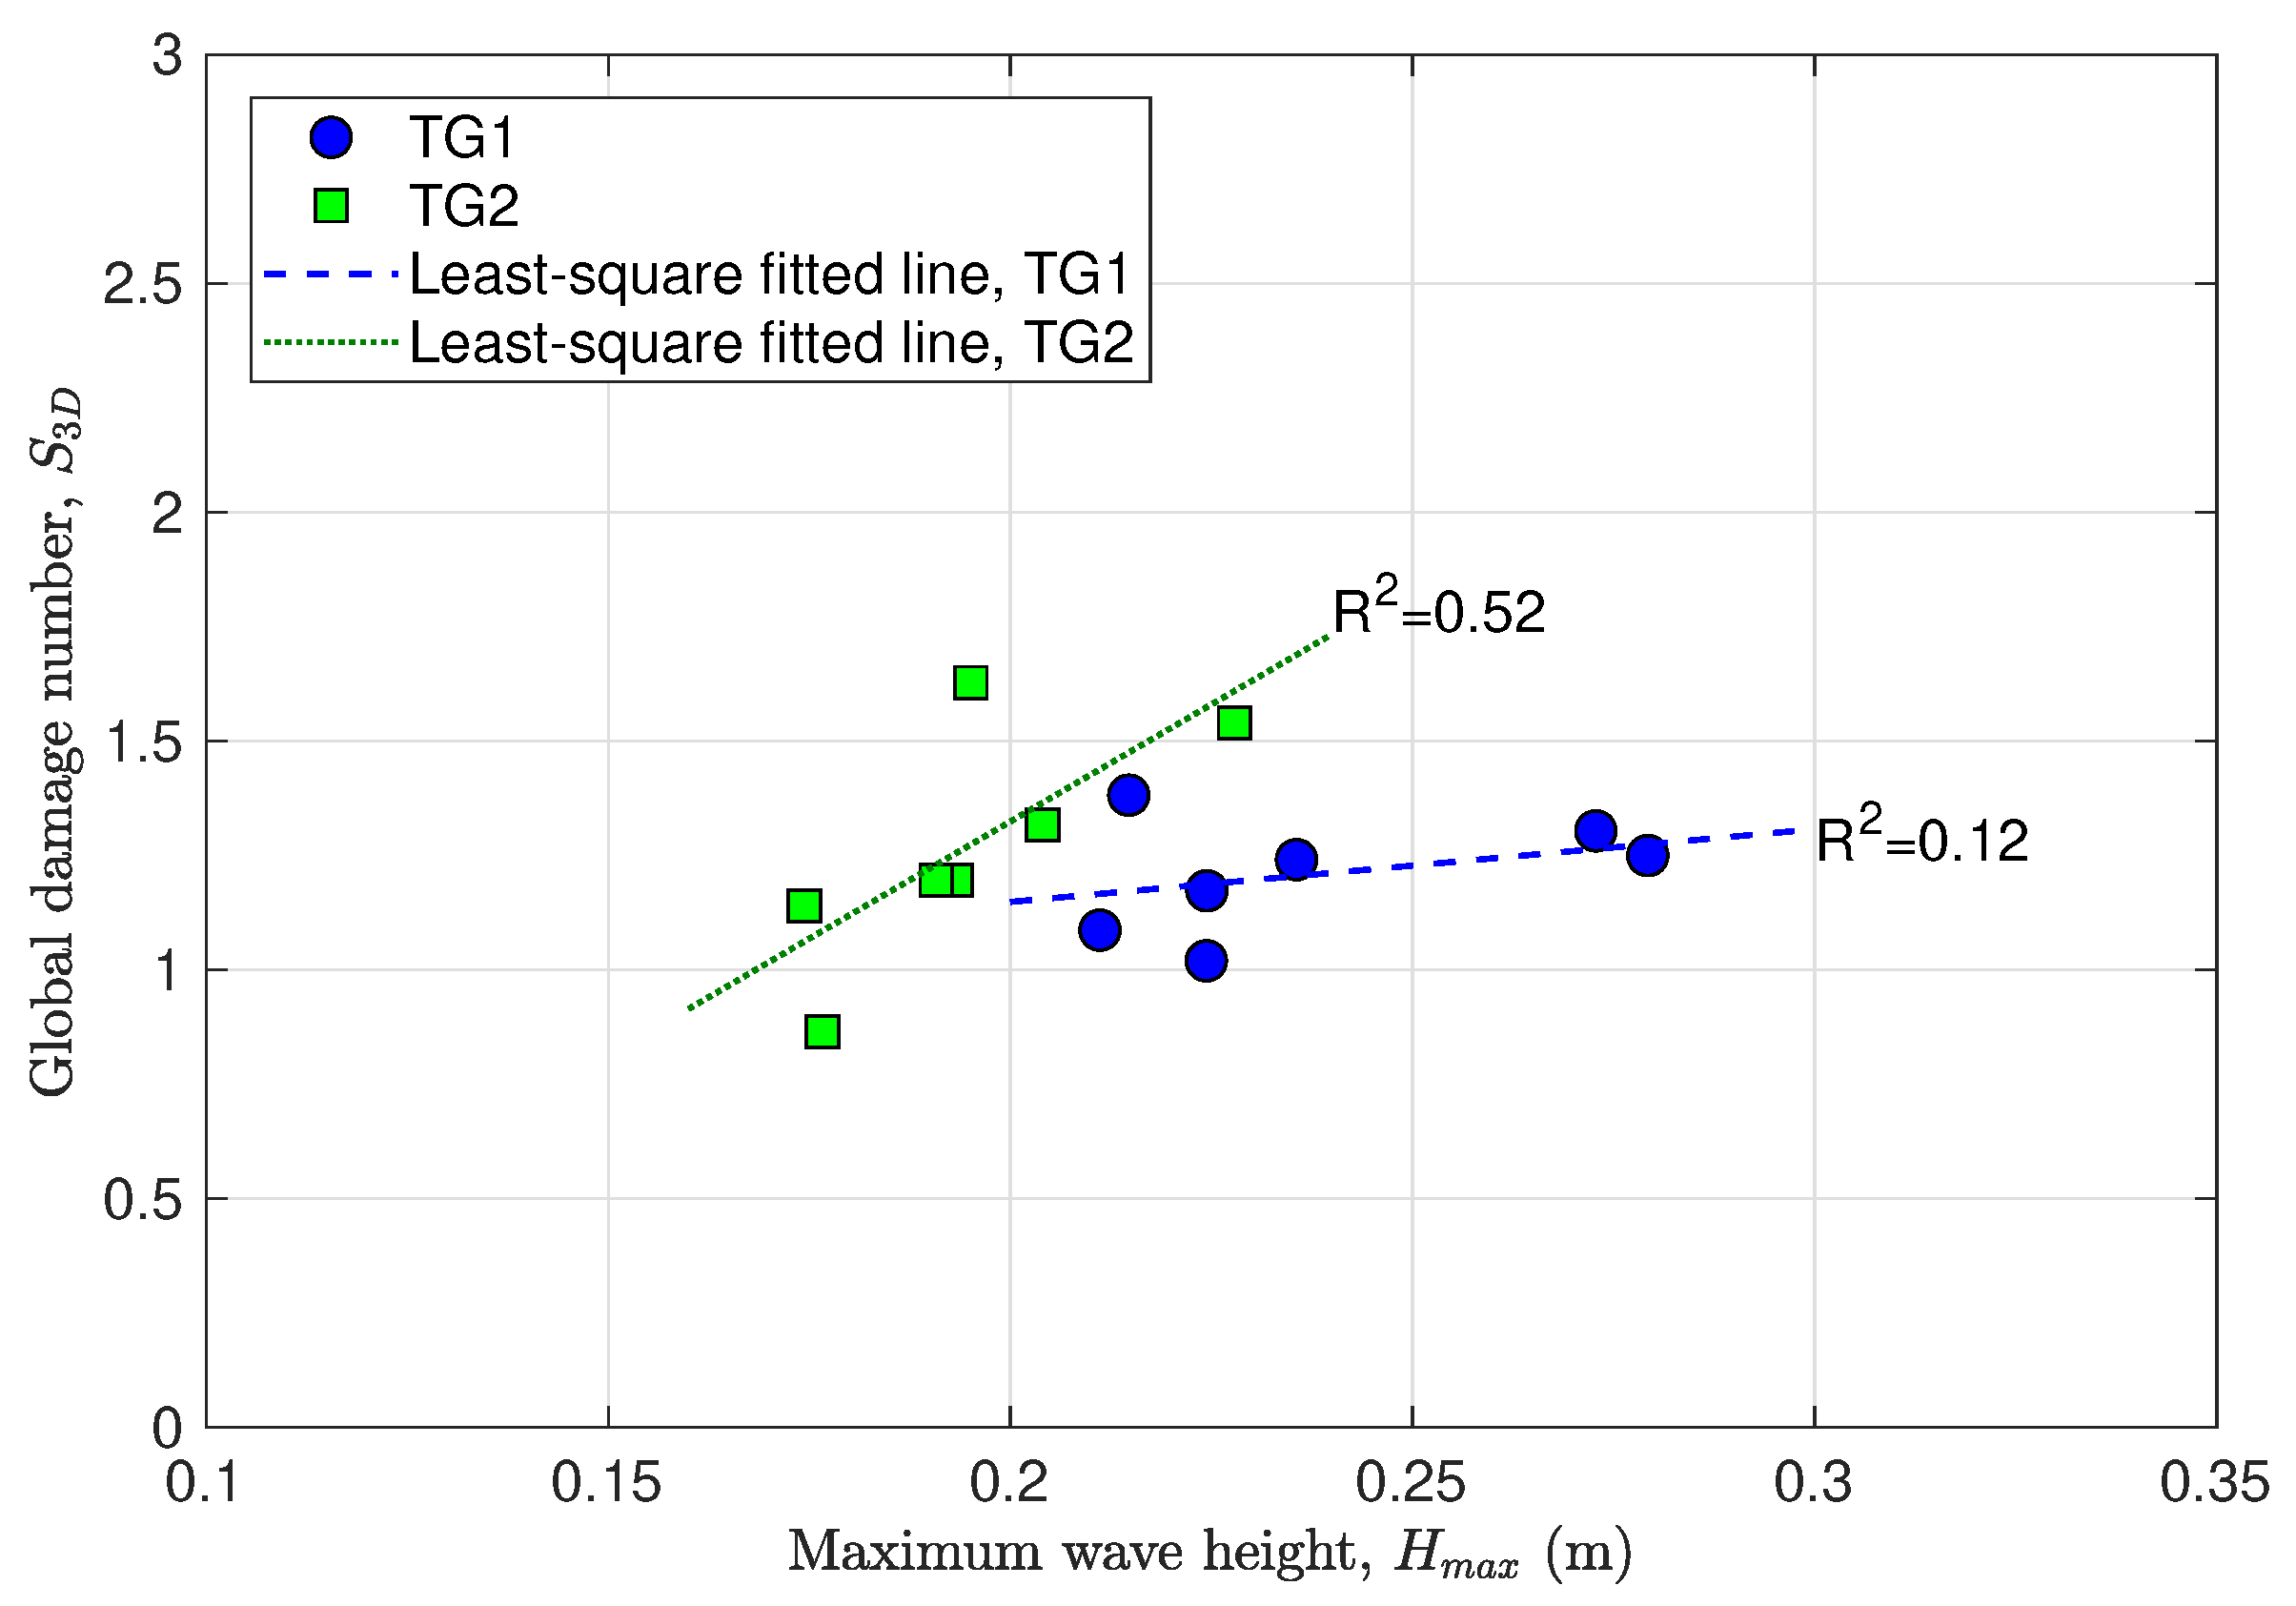
- Incoming waves and current.Under the conditions of the same wave spectra parameters, the model effects from the same and distinct wave trains are negligible. Referring to the measured wave conditions (Table 4) and the damage results (Table 8), the same wave train cases (TG1_1 to TG1_3, TG2_1 to TG2_3) can neither contribute to a same global damage nor a same subarea damage, indicating that the influence of same or distinct wave trains on the armour layer dynamic stability is weak. As discussed in Section 2.4, the measured wave spectra and wave height exceeding probabilities are not sensitive to the randomness of a specific wave train, except for the maximum wave height . As listed in Table 9, the relative standard deviations, are 11.6% for TG1 and 9.2% for TG2, which indicates that could be a major contributor to compared to other wave parameters. The relationship between recorded and is plotted in Figure 16. The fitted trend lines show that higher could give rise to higher number, which is reasonable as higher introduces larger wave bottom orbital velocity acting on the armour stones. However, the correlation for the two fitted lines are weak (). Despite , no clear evidence in this study can prove the links between the low uncertainty level of other measured wave parameters and the high uncertainty of local scour protection damage. For the incoming current, the uncertainty levels of depth-averaged current velocity and turbulence intensity weakly affect the uncertainty of local damage.
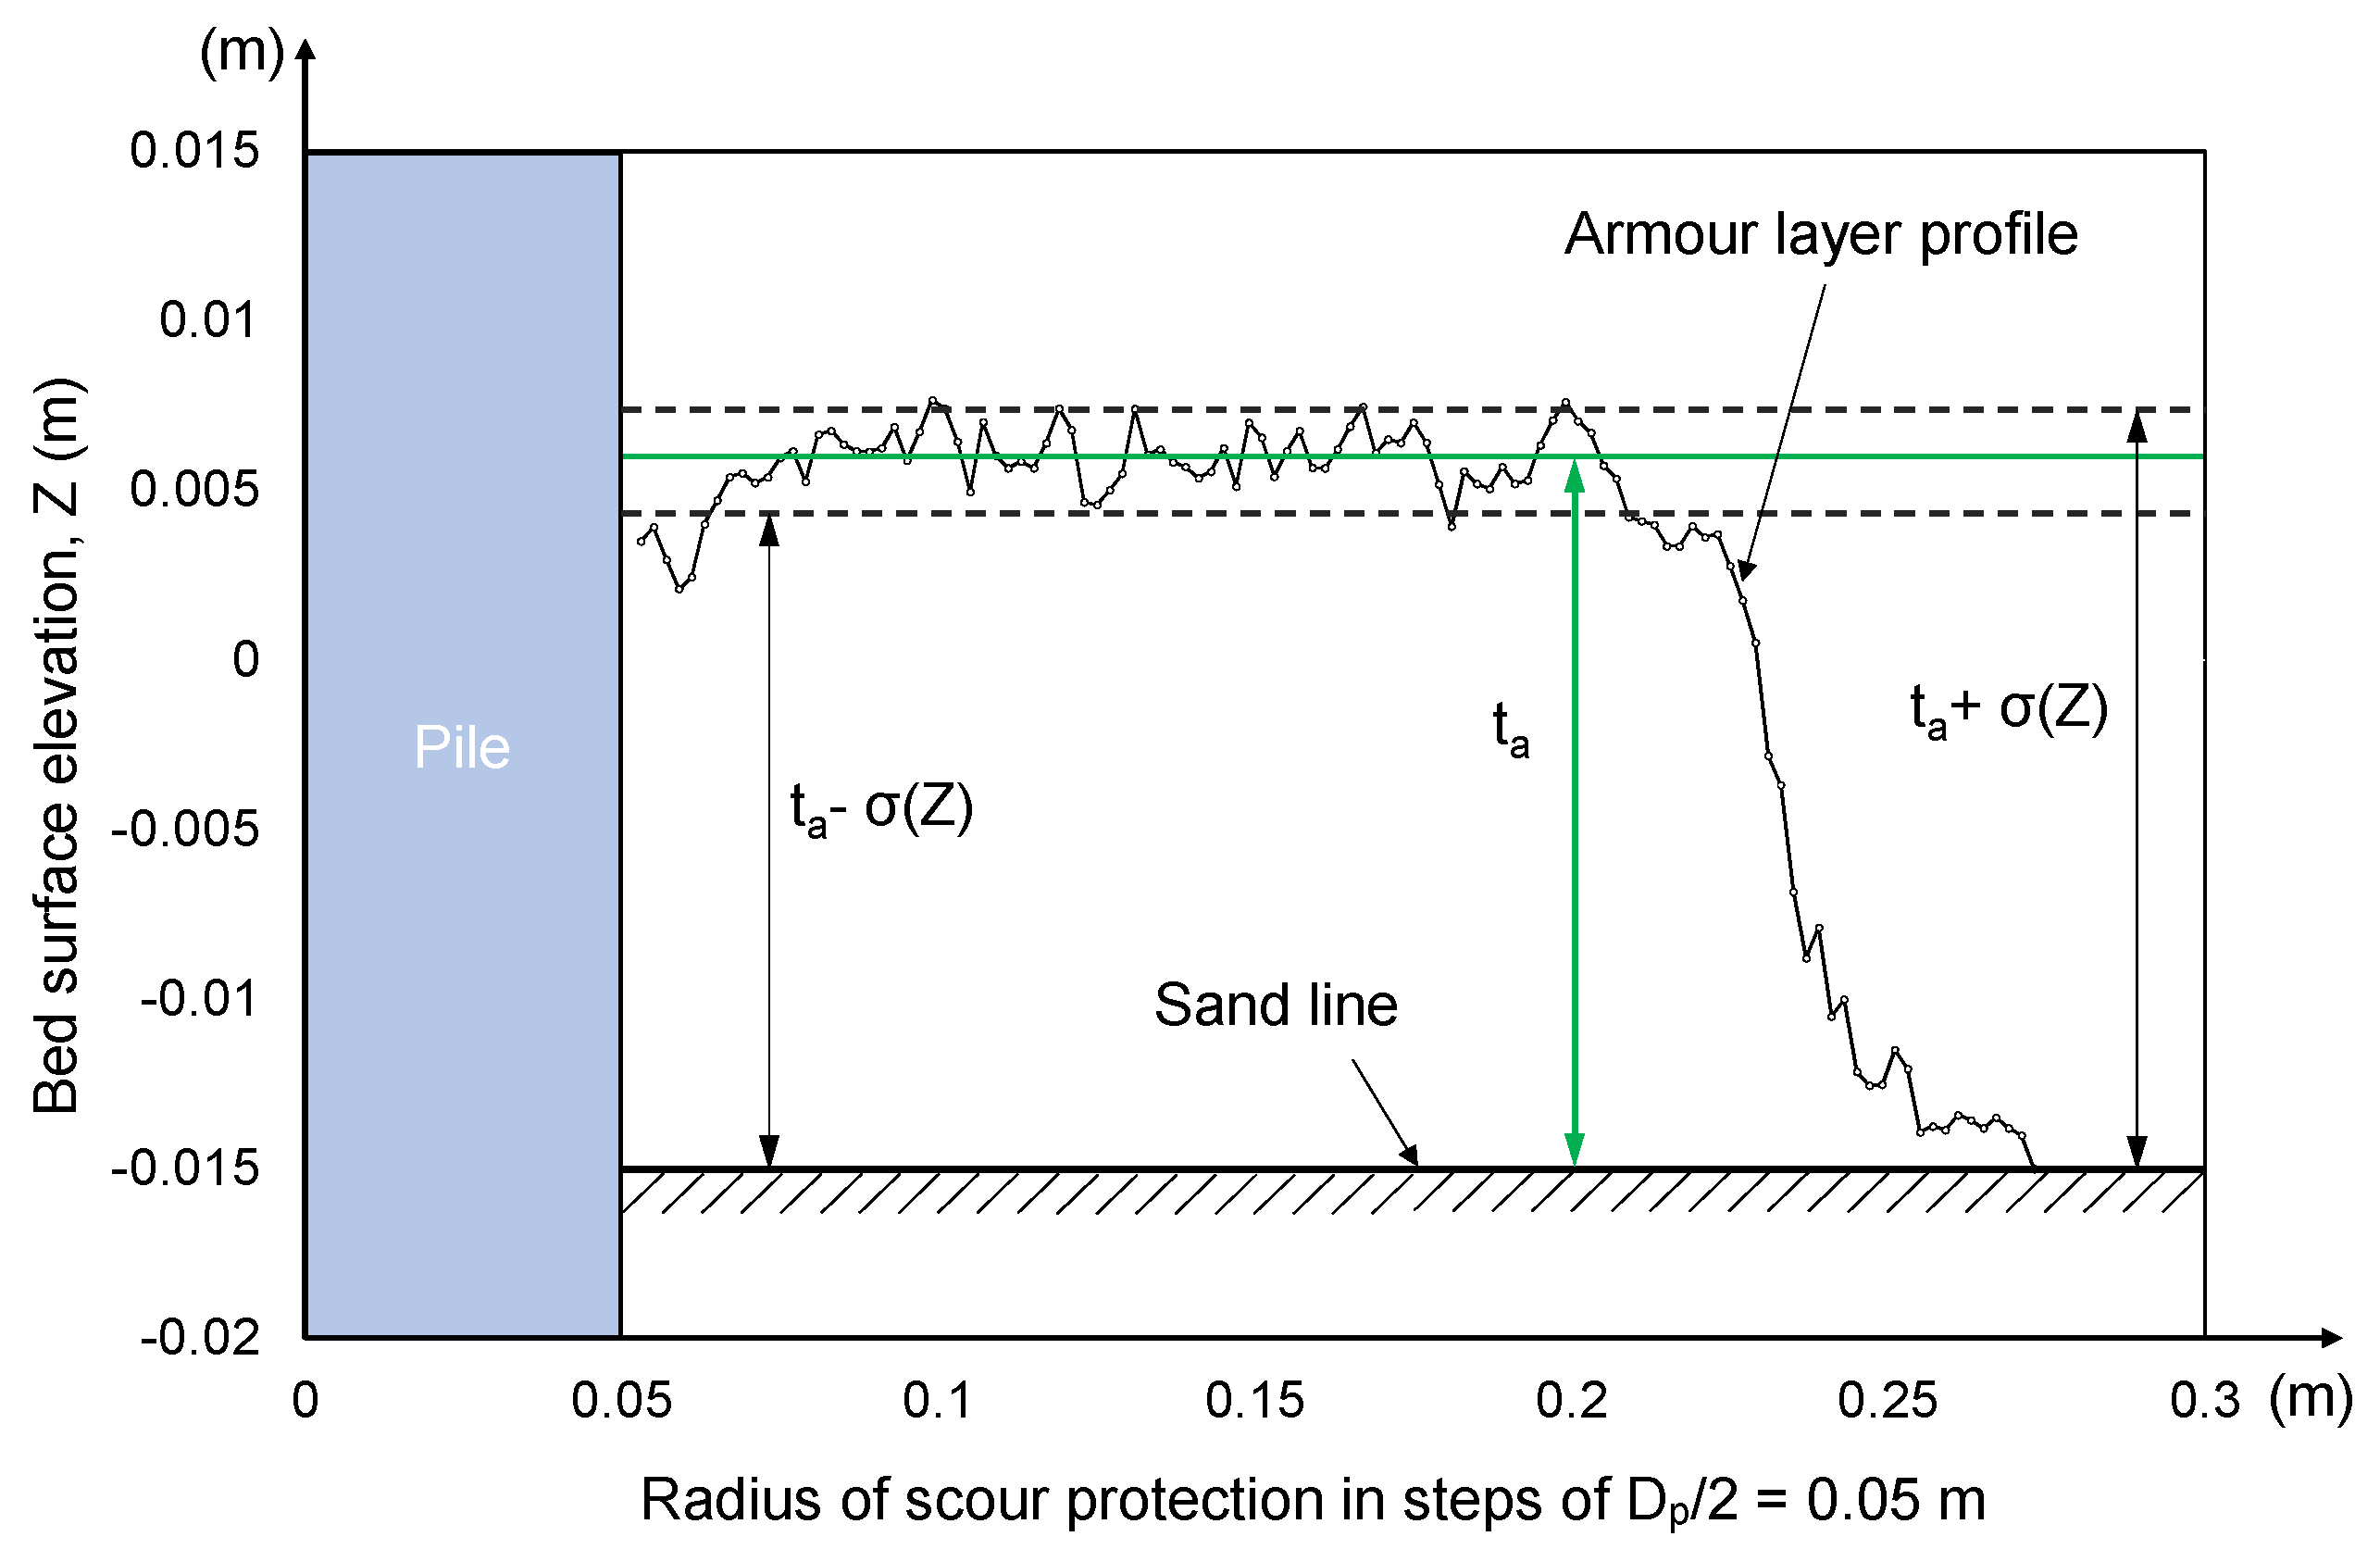
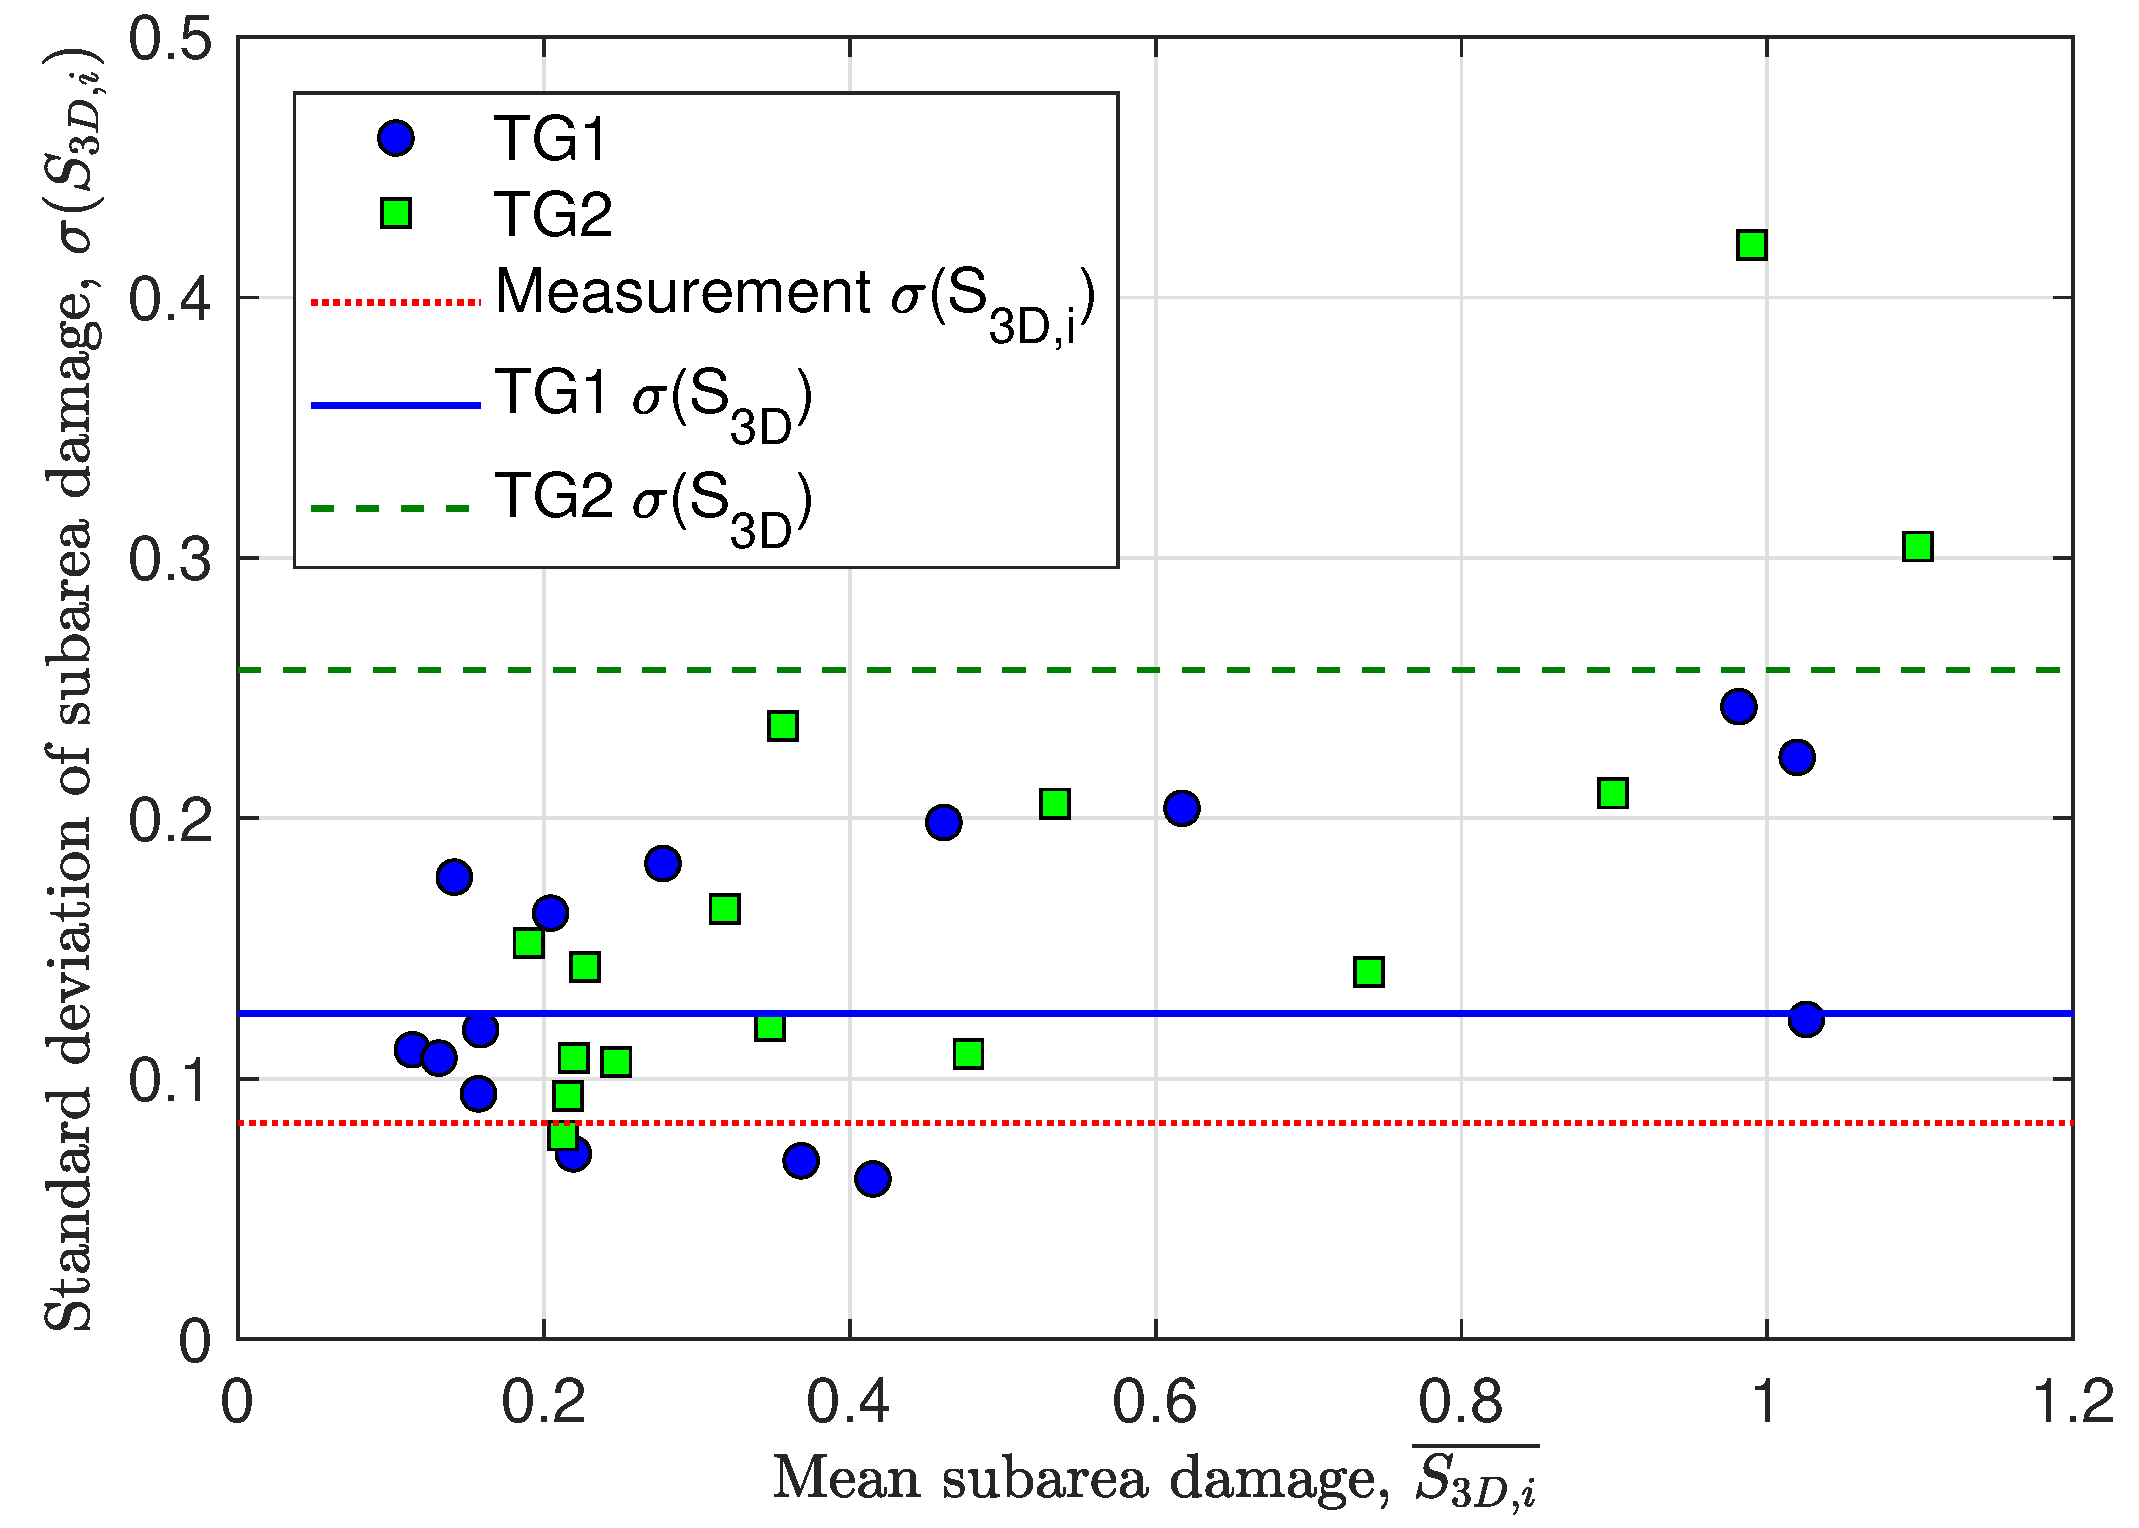
- Thickness () and flatness (F) of the armour layer.The uncertainty due to the flatness of the armour layer is the highest among the discussed model inputs. Understandably, it contributes to high uncertainty of damage outputs. Reducing the F value and the uncertainty of the F value is beneficial for lowering the model effects. This may be achieved by using moulds to build the armour layer or via machine aided model construction instead of less accurate handwork in laboratory. In real engineering, it is impossible to build ideally flat armour layers in a wind farm. Therefore, conservatively, at least is suggested to be considered when designing a monopile scour protection made up with multiple layers of small grains. However, it can be seen that is lower for TG2, but the in TG2 is higher than in TG1. This results in less evidence that the is strongly dependent on the flatness of the armour layer.
5. Conclusions
- Measurement effects due to the application of the handheld laser scanner contributes limited to the total uncertainty, the standard deviation of the global damage number is for five repeated measurements. The maximum difference of among the measurements is 0.095. The maximum standard deviation of the subarea damage number is . The results show a limited impact from measurement effects to the total uncertainty.
- The model effects are analysed by means of two groups of repeated tests. In the two test groups, the wave and current conditions are well replicated as listed in Table 9. The damage profiles have shown a repeatable damage distribution. The standard deviation of the global damage number is up to and . The standard deviation of the subarea damage number reaches even larger values of and . The low repeatability of the maximum wave height and the flatness of the armour layer thickness due to the irregular armour stones distribution are two important sources of the total uncertainty. The irreproducible and chaotic flow field around the pile is considered to be the key reason for the large standard deviation of scour protection damage number. As for the future design, a standard deviation up to is conservatively expected regarding a dynamically stable monopile scour protection made up with multiple layers of small grains.
Author Contributions
Funding
Institutional Review Board Statement
Informed Consent Statement
Acknowledgments
Conflicts of Interest
Abbreviations
| ADV | Acoustic Doppler Velocimeter |
| OWT | Offshore Wind Turbine |
| TG | Test Group |
| UGent | Ghent University |
| WG | Wave Gauge |
References
- Wind Europe. Offshore Wind in Europe, Trends and Statistics 2019. 2019. Available online: https://windeurope.org/about-wind/statistics/european/wind-energy-in-europe-in-2019/ (accessed on 21 May 2021).
- Esteban, M.D.; López-Gutiérrez, J.S.; Negro, V.; Sanz, L. Riprap scour protection for monopiles in offshore wind farms. J. Mar. Sci. Eng. 2019, 7, 440. [Google Scholar] [CrossRef] [Green Version]
- Corvaro, S.; Marini, F.; Mancinelli, A.; Lorenzoni, C. Scour protection around a single slender pile exposed to waves. Coast. Eng. Proc. 2018, 1, 6. [Google Scholar] [CrossRef] [Green Version]
- Tafarojnoruz, A.; Gaudio, R.; Calomino, F. Evaluation of flow-altering countermeasures against bridge pier scour. J. Hydraul. Eng. 2012, 138, 297–305. [Google Scholar] [CrossRef]
- Pandey, M.; Azamathulla, H.M.; Chaudhuri, S.; Pu, J.H.; Pourshahbaz, H. Reduction of time-dependent scour around piers using collars. Ocean Eng. 2020, 213, 107692. [Google Scholar] [CrossRef]
- Yang, B.; Wei, K.; Yang, W.; Li, T.; Qin, B. A feasibility study of reducing scour around monopile foundation using a tidal current turbine. Ocean Eng. 2021, 220, 108396. [Google Scholar] [CrossRef]
- Hjorth, P. Studies on the Nature of Local Scour; Bulletin Series A; Lund Institute of Technology/Lund University, Department of Water Resources Engineering: Lund, Sweden, 1975; Volume 46. [Google Scholar]
- Breusers, H.N.C.; Nicollet, G.; Shen, H.W. Local Scour Around Cylindrical Piers. J. Hydraul. Res. 1977, 15, 211–252. [Google Scholar] [CrossRef]
- Raudkivi, A.J.; Ettema, R. Clear-water scour at cylindrical piers. J. Hydraul. Eng. 1983, 109, 338–350. [Google Scholar] [CrossRef]
- Chiew, Y.M. Mechanics of riprap failure at bridge piers. J. Hydraul. Eng 1995, 121, 635–643. [Google Scholar] [CrossRef]
- Lauchlan, C.S.; Melville, B.W. Riprap protection at brdige piers. J. Hydraul. Eng. 2001, 127, 412–418. [Google Scholar] [CrossRef]
- Sumer, B.M.; Fredsøe, J. The Mechanics of Scour in the Marine Environment; Advanced Series on Ocean Engineering; World Scientific: Singapore, 2002; Volume 17. [Google Scholar]
- Det Norske Veritas AS (DNV). Design of Offshore Wind Turbine Structures; Offshore Standard DNV-OS-J101; Det Norske Veritas AS (DNV): Hovik, Norway, 2014. [Google Scholar]
- Den Boon, J.H.; Sutherland, J.; Whitehouse, R.J.S.; Soulsby, R.; Stam, C.J.M.; Verhoeven, K.; Høgedal, M.; Hald, T. Scour behavior and scour protection for monopile foundations of offshore wind turbines. In Proceedings of the European Wind Energy Conference (EWEC), London, UK, 22–25 November 2004. [Google Scholar]
- De Vos, L.; De Rouck, J.; Troch, P.; Frigaard, P. Empirical design of scour protections around monopile foundations Part 1: Static approach. Coast. Eng. 2011, 58, 540–553. [Google Scholar] [CrossRef]
- De Vos, L.; De Rouck, J.; Troch, P.; Frigaard, P. Empirical design of scour protections around monopile foundations Part 2: Dynamic approach. Coast. Eng. 2012, 60, 286–298. [Google Scholar] [CrossRef]
- Whitehouse, R.J.S.; Brown, A.; Audenaert, S.; Bolle, A.; de Schoesitter, P.; Haerens, P.; Baelus, L.; Troch, P.; das Neves, L.; Ferradosa, T.; et al. Optimising scour protection stability at offshore foundation. In Proceedings of the 7th International Conference on Scour and Erosion (ICSE-7), Perth, Australia, 2–4 December 2014. [Google Scholar]
- De Schoesitter, P.; Audenaert, S.; Baelus, L.; Bolle, A.; Brown, A.; Das Neves, L.; Ferradosa, T.; Haerens, P.T.; Pinto, F.; Troch, P.; et al. Feasibility of a dynamically stable rock armour layer scour protection for offshore wind farms. In Proceedings of the 33rd International Conference on Ocean, Offshore and Arctic Engineering (OMAE), San Francisco, CA, USA, 8–13 June 2014. [Google Scholar]
- Riezebos, H.; Raaijmakers, T.; Tönnies-Lohmann, A.; Waßmuth, S.; Van Steijn, P. Scour protection design in highly morphodynamic environments. In Proceedings of the 8th International Conference on Scour and Erosion (ICSE-8), Oxford, UK, 12–15 September 2016. [Google Scholar]
- Arboleda Chavez, C.E.; Stratigaki, V.; Wu, M.; Troch, P.; Schendel, A.; Welzel, M.; Villanueva, R.; Schlurmann, T.; De Vos, L.; Kisacik, D.; et al. Large-scale experiments to improve monopile scour protection design adapted to climate change–the PROTEUS project. Energies 2019, 12, 1709. [Google Scholar] [CrossRef] [Green Version]
- Nielsen, A.W.; Petersen, T.U. Stability of cover stones around a vertical cylinder under the influence of waves and current. Coast. Eng. 2019, 154, 103563. [Google Scholar] [CrossRef]
- Wu, M.; De Vos, L.; Arboleda Chavez, C.E.; Stratigaki, V.; Fazeres-Ferradosa, T.; Rosa-Santos, P.; Taveira-Pinto, F.; Troch, P. Large scale experimental study of the scour protection damage around a monopile foundation under combined wave and current conditions. J. Mar. Sci. Eng. 2020, 8, 417. [Google Scholar] [CrossRef]
- Sumer, B.M.; Nielsen, A.W. Sinking failure of scour protection at wind turbine foundation. PI Civil Eng. Energy 2013, 166, 170–188. [Google Scholar] [CrossRef]
- Nielsen, A.W.; Probst, T.; Petersen, T.U.; Sumer, B.M. Sinking of armour layer around a vertical cylinder exposed to waves and current. Coast. Eng. 2015, 100, 58–66. [Google Scholar] [CrossRef]
- Nielsen, A.W.; Petersen, T.U. Onset of motion of sediment underneath scour protection around a monopile. J. Mar. Sci. Eng. 2018, 6, 100. [Google Scholar] [CrossRef] [Green Version]
- Petersen, T.U.; Sumer, B.M.; Fredsøe, J.; Raaijmakers, T.; Schouten, J.J. Edge scour at scour protections around piles in the marine environment—Laboratory and field investigation. Coast. Eng. 2015, 106, 42–72. [Google Scholar] [CrossRef]
- Raaijmakers, T.C.; van Oeveren, M.C.; Rudolph, D.; Leenders, V.; Sinjou, W.C.P. Field performance of scour protection around offshore monopiles. In Proceedings of the 5th International Conference on Scour and Erosion (ICSE-5), San Francisco, CA, USA, 7–10 November 2010. [Google Scholar]
- Fazares-Ferradosa, T.; Wezel, M.; Schendel, A.; Baelus, L.; Rosa Santos, P. Extended characterization of damage in rubble mound scour protection. Coast. Eng. 2020, 158, 103671. [Google Scholar] [CrossRef]
- Baykal, C.; Sumer, B.M.; Fuhrman, D.R.; Jacobsen, N.G.; Fredsøe, J. Numerical simulation of scour and backfilling processes around a circular pile in waves. Coast. Eng. 2017, 122, 87–107. [Google Scholar] [CrossRef] [Green Version]
- Schendel, A.; Hildebrandt, A.; Schlurmann, T. Experimental study on the progression of scour around a monopile in unidirectional and tidal currents. In Proceedings of the 6th International Conference on the Application of Physical Modelling in Coastal and Port Engineering and Science, Ottawa, ON, Canada, 10–13 May 2016. [Google Scholar]
- Mayall, R.O.; McAdam, R.A.; Whitehouse, R.J.S.; Burd, H.J.; Byrne, B.W.; Heald, S.G.; Sheil, B.B.; Slater, P.L. Flume tank testing of offshore wind turbine dynamics with foundation scour and scour protection. J. Waterw. Port Coast. Ocean Eng. 2020, 146, 04020033. [Google Scholar] [CrossRef]
- Kortenhaus, A.; Van der Meer, J.; Burcharth, H.F.; Geeraerts, J.; Pullen, T.; Ingram, D.; Troch, P. D40 Report on Conclusions of Scale Effects, Workpackage 7, Quantification of Measurement Errors, Model and Scale Effects Related to Wave Overtopping; Leichtweiß-Institute for Hydraulic Engineering: Braunschweig, Germany, 2005. [Google Scholar]
- Qiu, W.; Junior, J.S.; Lee, D.; Lie, H.; Magarovskii, V.; Mikami, T.; Rousset, J.M.; Sphaier, S.; Tao, L.; Wang, X. Uncertainties related to predictions of loads and responses for ocean and offshore structures. Ocean Eng. 2014, 86, 58–67. [Google Scholar] [CrossRef]
- Wahlin, B.; Wahl, T.; Gonzalez-Castro, J.A.; Fulford, J.; Robeson, M. Task committee on experimental uncertainty and measurement errors in hydraulic engineering: An update. In Proceedings of the World Water and Environmental Resources Congress 2005: Impacts of Global Climate Change (EWRI), Anchorage, AK, USA, 15–19 May 2005. [Google Scholar]
- De Vos, L. Optimisation of Scour Protection Design for Monopiles and Quantification of Wave Run-Up. Ph.D. Thesis, Ghent University, Ghent, Belgium, 2008. [Google Scholar]
- Debaveye, R.; De Riemacker, B. Data Analysis of the 3D Damage Number in Small-Scale Monopile Scour Protection Experiments. Master’s Thesis, Ghent University, Ghent, Belgium, 2020. [Google Scholar]
- Ettema, R.; Melville, B.W.; Barkdoll, B. Scale effect in pier-scour experiments. J. Hydraul. Eng. 1996, 124, 639–642. [Google Scholar] [CrossRef]
- Heller, V. Scale effects in physical hydraulic engineering models. J. Hydraul. Res. 2011, 49, 293–306. [Google Scholar] [CrossRef]
- Hughes, S.A. Physical Models and Laboratory Techniques in Coastal Engineering; Advanced Series on Ocean Engineering; World Scientific: Singapore, 1993; Volume 7. [Google Scholar]
- Reis, M.T.; Neves, M.G.; Hedges, T. Investigating the lengths of scale model tests to determine mean wave overtopping discharges. J. Hydraul. Res. 2008, 50, 441–462. [Google Scholar] [CrossRef]
- Williams, H.E.; Briganti, R.; Romano, A.; Dodd, N. Experimental Analysis of Wave Overtopping: A new small scale laboratory dataset for the assessment of uncertainty for smooth sloped and vertical coastal structures. J. Mar. Sci. Eng. 2019, 7, 217. [Google Scholar] [CrossRef] [Green Version]
- Ghent University. Large Physical Wave Flume. 2020. Available online: https://www.ugent.be/ea/civil-engineering/en/research/coastal-bridges-roads/coastal-engineering/infrastructure-services/overview (accessed on 21 May 2021).
- Nortek Group. Nortek Quick Guide-Vectrino Profiler. 2017. Available online: https://www.nortekgroup.com/assets/software/N3015-012-NQG_VECTRINPROO_1017.pdf (accessed on 21 May 2021).
- Oumeraci, H. Scour in front of vertical breakwaters—Review of problems. In Proceedings of the International Workshop on Wave Barriers in Deepwaters (PHRI), Yokosuka, Japan, 10–14 January 1994; pp. 281–317. [Google Scholar]
- Van Rijn, L.C. Sediment transport, part II: Suspended load transport. J. Hydraul. Eng. 1984, 110, 1613–1641. [Google Scholar] [CrossRef]
- FARO Technologies Inc. Freestyle3D and Software User Manual. 2017. Available online: https://faro.app.box.com/s/pkfiiyeom0kwx722cff4yh01lwyspxu2/file/314135742270 (accessed on 21 May 2021).
- JCGM. JCGM 100:2008 Evaluation of Measurement Data–Guide to the Expression of Uncertainty in Measurement (GUM). 2008. Available online: https://www.bipm.org/documents/20126/2071204/JCGM_100_2008_E.pdf/cb0ef43f-baa5-11cf-3f85-4dcd86f77bd6 (accessed on 21 May 2021).
- Richard, J.-B.; Thomson, J.; Polagye, B.; Bard, J. Method for identification of Doppler noise levels in turbulent flow measurements dedicated to tidal energy. Int. J. Mar. Energy 2013, 3–4, 52–64. [Google Scholar] [CrossRef]
- Wu, M.; Arnout, J.; Molina Ruiz, J.; Arboleda Chavez, C.; Stratigaki, V.; Troch, P. Evaluation of uncertainty of damage results in experimental modelling of monopile foundation scour protection. In Proceedings of the 38rd International Conference on Ocean, Offshore and Arctic Engineering (OMAE), Glasgow, Scotland, 9–14 June 2019. [Google Scholar]
- Fazeres-Ferradosa, T.; Taveira-Pinto, F.; Romão, X.; Vanem, E.; Reis, M.T.; das Neves, L. Probabilistic design and reliability analysis of scour protections for offshore windfarms. Eng. Fail. Anal. 2018, 91, 291–305. [Google Scholar] [CrossRef]


| Test ID | Scale Ratio | Water Depth | Pile Diameter | Current Velocity | Significant Wave Height | Peak Period | Number of Waves |
|---|---|---|---|---|---|---|---|
| (m) | (m) | (m/s) | (m) | (s) | (-) | ||
| PROTEUS Test 10B | 1:16.67 | 0.9 | 0.3 | −0.330 | 0.191 | 2.00 | 3000 |
| TG1 | 1:50 | 0.3 | 0.1 | −0.191 | 0.064 | 1.16 | 3000 |
| PROTEUS Test 13B | 1:8.33 | 1.5 | 0.6 | −0.570 | 0.377 | 2.28 | 3000 |
| TG2 | 1:50 | 0.25 | 0.1 | −0.233 | 0.063 | 0.93 | 3000 |
| Probe Location | TG1 | TG2 | |||
|---|---|---|---|---|---|
| X (m) | Y (m) | X (m) | Y (m) | ||
| Pile centre | 0.00 | 0.00 | 0.00 | 0.00 | |
| WG1 | −2.59 | 0.00 | −2.59 | 0.00 | |
| WG2 | −2.18 | 0.00 | −2.18 | 0.00 | |
| WG3 | −1.88 | 0.00 | −1.88 | 0.00 | |
| WG4 | 9.20 | 0.00 | 9.41 | 0.00 | |
| WG5 | 9.37 | 0.00 | 9.53 | 0.00 | |
| WG6 | 9.70 | 0.00 | 9.70 | 0.00 | |
| ADV | 0.80 | −0.45 | 0.80 | −0.45 | |
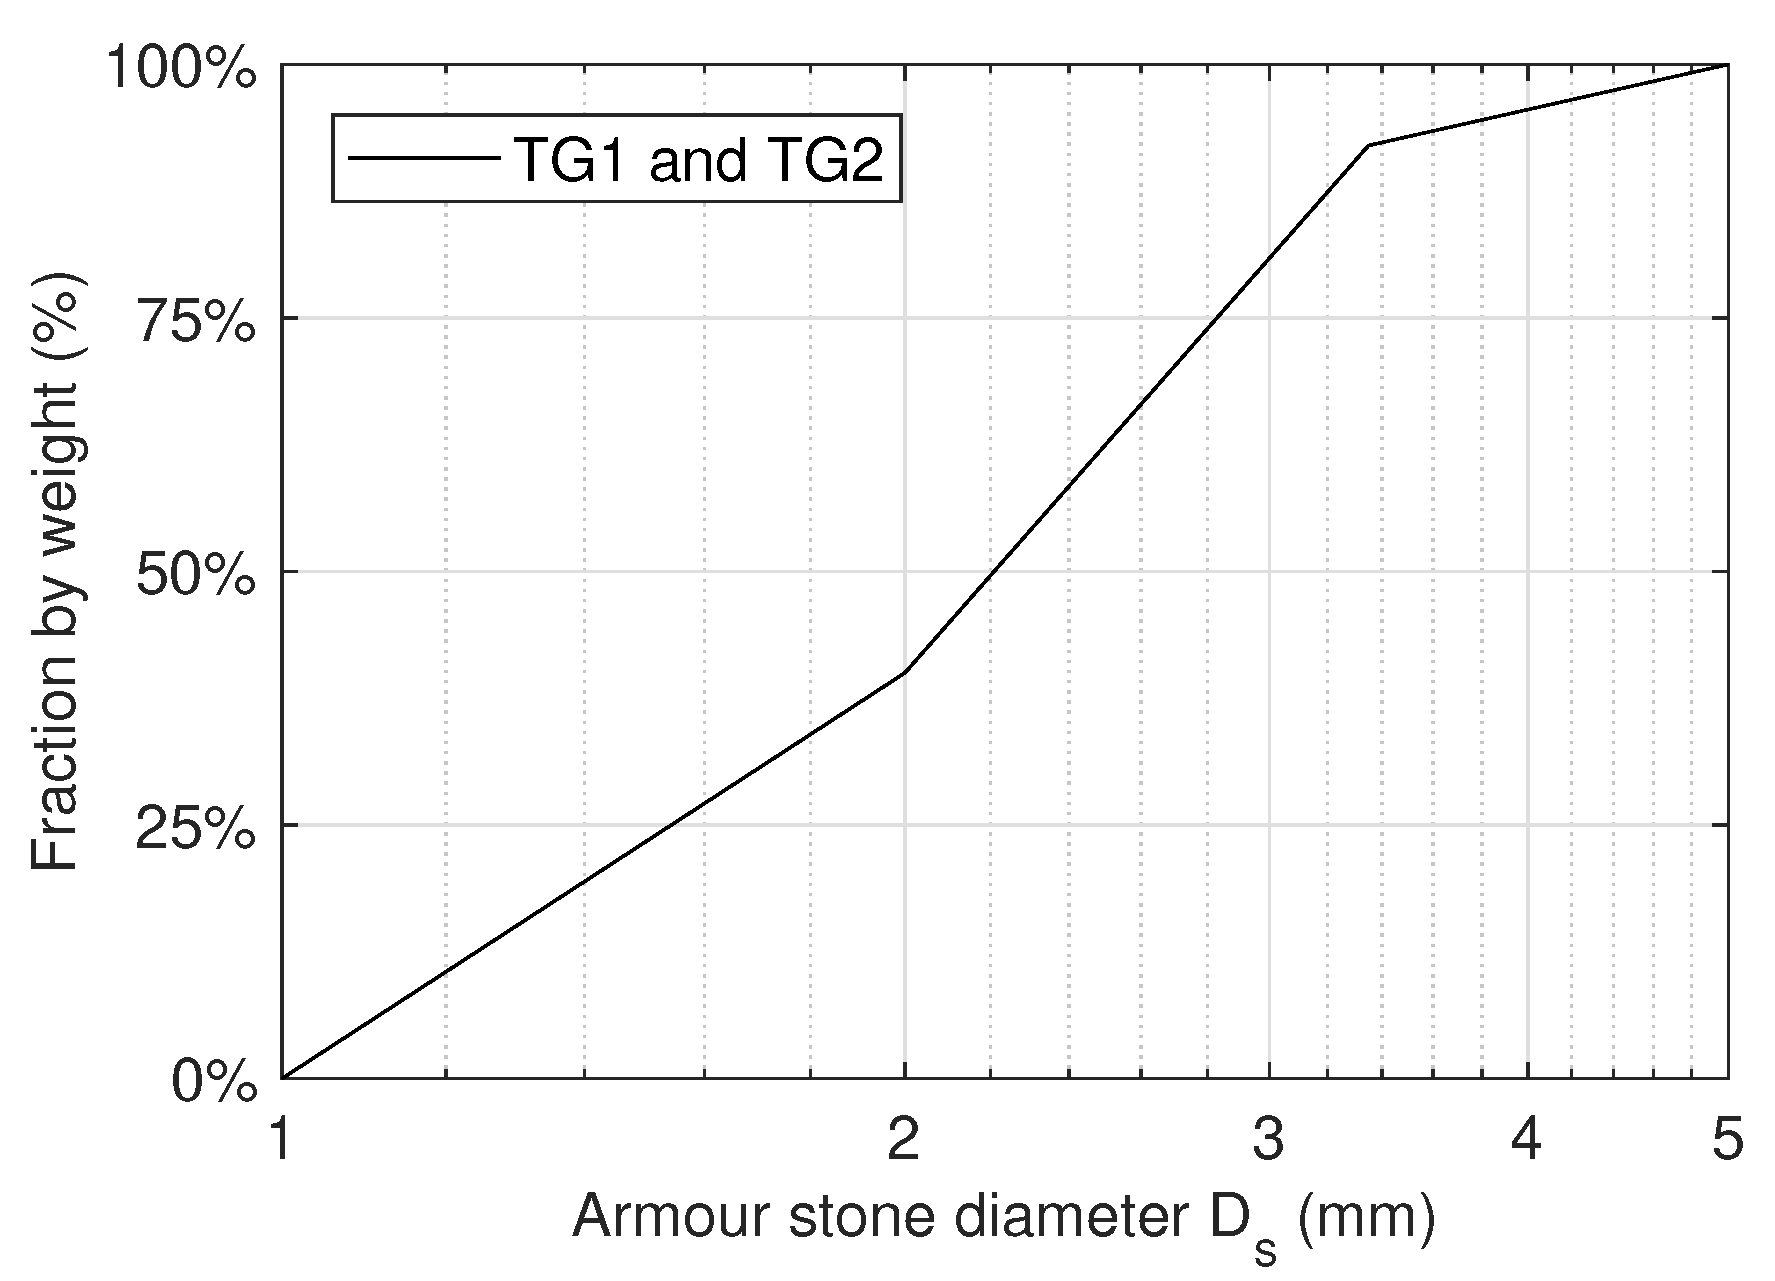
| Sieve Size | (mm) | (mm) | (mm) | (mm) | |
|---|---|---|---|---|---|
| Values | 1.38 | 2.26 | 3.17 | 1.90 | 2.30 |
| Test ID | Water Depth | Current Velocity | Significant Wave Height | 1/10 Wave Height | Maximum Wave Height | Peak Period | Mean Energy Period |
|---|---|---|---|---|---|---|---|
| (m) | (m/s) | (m) | (m) | (m) | (s) | (s) | |
| TG1_1 | 0.3 | −0.187 | 0.063 | 0.080 | 0.214 | 1.182 | 1.074 |
| TG1_2 | 0.3 | −0.190 | 0.064 | 0.081 | 0.279 | 1.147 | 1.072 |
| TG1_3 | 0.3 | −0.183 | 0.063 | 0.079 | 0.236 | 1.164 | 1.072 |
| TG1_4 | 0.3 | −0.183 | 0.064 | 0.080 | 0.224 | 1.164 | 1.065 |
| TG1_5 | 0.3 | −0.186 | 0.063 | 0.080 | 0.273 | 1.164 | 1.073 |
| TG1_6 | 0.3 | −0.185 | 0.062 | 0.079 | 0.224 | 1.138 | 1.071 |
| TG1_7 | 0.3 | −0.187 | 0.063 | 0.079 | 0.211 | 1.138 | 1.072 |
| TG2_1 | 0.25 | −0.222 | 0.063 | 0.078 | 0.195 | 0.978 | 0.922 |
| TG2_2 | 0.25 | −0.221 | 0.062 | 0.077 | 0.204 | 0.954 | 0.923 |
| TG2_3 | 0.25 | −0.221 | 0.063 | 0.078 | 0.228 | 0.954 | 0.920 |
| TG2_4 | 0.25 | −0.219 | 0.062 | 0.078 | 0.174 | 0.973 | 0.923 |
| TG2_5 | 0.25 | −0.217 | 0.063 | 0.078 | 0.193 | 0.985 | 0.923 |
| TG2_6 | 0.25 | −0.221 | 0.061 | 0.076 | 0.191 | 0.985 | 0.927 |
| TG2_7 | 0.25 | −0.217 | 0.062 | 0.078 | 0.177 | 0.964 | 0.922 |
| TG1 | (m) | (m) | (m) | (s) | (s) | (m/s) | (%) |
|---|---|---|---|---|---|---|---|
| 0.063 | 0.080 | 0.237 | 1.16 | 1.07 | −0.186 | 6.57 | |
| 0.0007 | 0.0008 | 0.0275 | 0.016 | 0.003 | 0.0025 | 0.32 | |
| 0.0003 | 0.0003 | 0.0104 | 0.006 | 0.001 | 0.0009 | 0.12 | |
| TG2 | (m) | (m) | (m) | (s) | (s) | (m/s) | (%) |
| 0.062 | 0.078 | 0.195 | 0.97 | 0.92 | −0.220 | 6.57 | |
| 0.0008 | 0.0007 | 0.0180 | 0.013 | 0.002 | 0.0021 | 0.53 | |
| 0.0003 | 0.0003 | 0.0068 | 0.005 | 0.0001 | 0.0008 | 0.20 |
| Test ID | (mm) | (mm) | F (-) | Test ID | (mm) | (mm) | F (-) |
|---|---|---|---|---|---|---|---|
| TG1_1 | 16.5 | 1.7 | 0.11 | TG2_1 | 18.5 | 1.8 | 0.10 |
| TG1_2 | 18.4 | 1.6 | 0.08 | TG2_2 | 18.5 | 1.7 | 0.09 |
| TG1_3 | 17.6 | 1.4 | 0.08 | TG2_3 | 18.1 | 2.0 | 0.11 |
| TG1_4 | 17.6 | 2.5 | 0.14 | TG2_4 | 18.4 | 1.6 | 0.08 |
| TG1_5 | 17.5 | 1.9 | 0.11 | TG2_5 | 17.1 | 1.8 | 0.11 |
| TG1_6 | 18.1 | 1.5 | 0.09 | TG2_6 | 17.8 | 1.9 | 0.11 |
| TG1_7 | 18.1 | 2.1 | 0.11 | TG2_7 | 17.2 | 1.5 | 0.09 |
| Test Group | (mm) | (-) | (mm) | (-) | (mm) | (-) |
|---|---|---|---|---|---|---|
| TG_1 | 17.7 | 0.103 | 0.62 | 0.021 | 0.24 | 0.008 |
| TG_2 | 17.9 | 0.099 | 0.60 | 0.011 | 0.23 | 0.004 |
| Test ID | Max in Subarea i | Test ID | Max in Subarea i | ||
|---|---|---|---|---|---|
| TG1_1 | 1.382 | 1 | TG2_1 | 1.628 | 3 |
| TG1_2 | 1.250 | 6 | TG2_2 | 1.317 | 3 |
| TG1_3 | 1.241 | 3 | TG2_3 | 1.540 | 1 |
| TG1_4 | 1.173 | 1 | TG2_4 | 1.140 | 1 |
| TG1_5 | 1.304 | 3 | TG2_5 | 1.196 | 6 |
| TG1_6 | 1.020 | 6 | TG2_6 | 1.196 | 3 |
| TG1_7 | 1.087 | 6 | TG2_7 | 0.865 | 3 |
| TG1 | 1.208 | 0.125 | 1.3% | 1.1% | 11.6% | 1.4% | 3.5% | 20.2% | 10.3% | 19.9% |
| TG2 | 1.269 | 0.257 | 0.9% | 1.2% | 9.2% | 1.4% | 3.3% | 10.7% | 20.3% | 33.1% |
Publisher’s Note: MDPI stays neutral with regard to jurisdictional claims in published maps and institutional affiliations. |
© 2021 by the authors. Licensee MDPI, Basel, Switzerland. This article is an open access article distributed under the terms and conditions of the Creative Commons Attribution (CC BY) license (https://creativecommons.org/licenses/by/4.0/).
Share and Cite
Wu, M.; De Vos, L.; Arboleda Chavez, C.E.; Stratigaki, V.; Streicher, M.; Troch, P. Quantification of Measurement and Model Effects in Monopile Foundation Scour Protection Experiments. J. Mar. Sci. Eng. 2021, 9, 585. https://doi.org/10.3390/jmse9060585
Wu M, De Vos L, Arboleda Chavez CE, Stratigaki V, Streicher M, Troch P. Quantification of Measurement and Model Effects in Monopile Foundation Scour Protection Experiments. Journal of Marine Science and Engineering. 2021; 9(6):585. https://doi.org/10.3390/jmse9060585
Chicago/Turabian StyleWu, Minghao, Leen De Vos, Carlos Emilio Arboleda Chavez, Vasiliki Stratigaki, Maximilian Streicher, and Peter Troch. 2021. "Quantification of Measurement and Model Effects in Monopile Foundation Scour Protection Experiments" Journal of Marine Science and Engineering 9, no. 6: 585. https://doi.org/10.3390/jmse9060585