
Coastal Defences on Low-Lying Reef Flats: A Laboratory Study of Seawall Shape and Position

1
Université de Toulon, Aix Marseille Université, CNRS, IRD, Mediterranean Institute of Oceanography (MIO), 83130 La Garde, France
2
Universite de Pau et des Pays de l’Adour, E2S UPPA, SIAME, Anglet, 64000 Pau, France
*
Author to whom correspondence should be addressed.
†
These authors contributed equally to this work.
J. Mar. Sci. Eng. 2022, 10(11), 1652; https://doi.org/10.3390/jmse10111652
Submission received: 12 October 2022
/
Revised: 25 October 2022
/
Accepted: 26 October 2022
/
Published: 4 November 2022
(This article belongs to the Special Issue Advanced Studies in Breakwaters and Coastal Protection)
Abstract
:The present study reports on a series of laboratory experiments aiming to understand and to optimize the deployment of seawall defences over low-lying coral reef flats. The study is performed in a purely cross-shore configuration, with varying wave forcing, water depth, and seawall shapes and positions along the reef flat. The observations reveal the individual and combined effects of the external parameters. A higher seawall efficiency is reached for low waves, shallow water depth, seaward position, and a stepped seawall shape. A dimensionless formulation is proposed to predict the short wave transmission coefficient dependency on the seawall freeboard, incoming wave height, berm width, and seawall shape.
1. Introduction
Mainly found along tropical and subtropical coastlines, coral reefs provide a major form of shelter for low-lying coastal areas against marine hazards, including submersion and wave damages during tropical storms, cyclones, and tsunamis. The sustainability of coastal coral reefs is now threatened by the effects of global warming, ocean acidification, plastic debris, and human actions [1,2,3]. The potential degradation (smoothing, patchiness, and flattening) of shallow water coral colonies, combined with the rise of the sea level, is expected to increase the exposure of coastlines [4] leading to higher risks of damages to natural and engineered structures, and flooding and salinization of coastal aquifers [5]. In many situations, hard engineering structures will remain the most relevant solution to protecting the shore from the ocean’s attack. Optimizing the deployment of coastal defences is therefore essential to prevent further damages while avoiding excessive costs and consumption of materials (generally locally made coral concrete [6]).
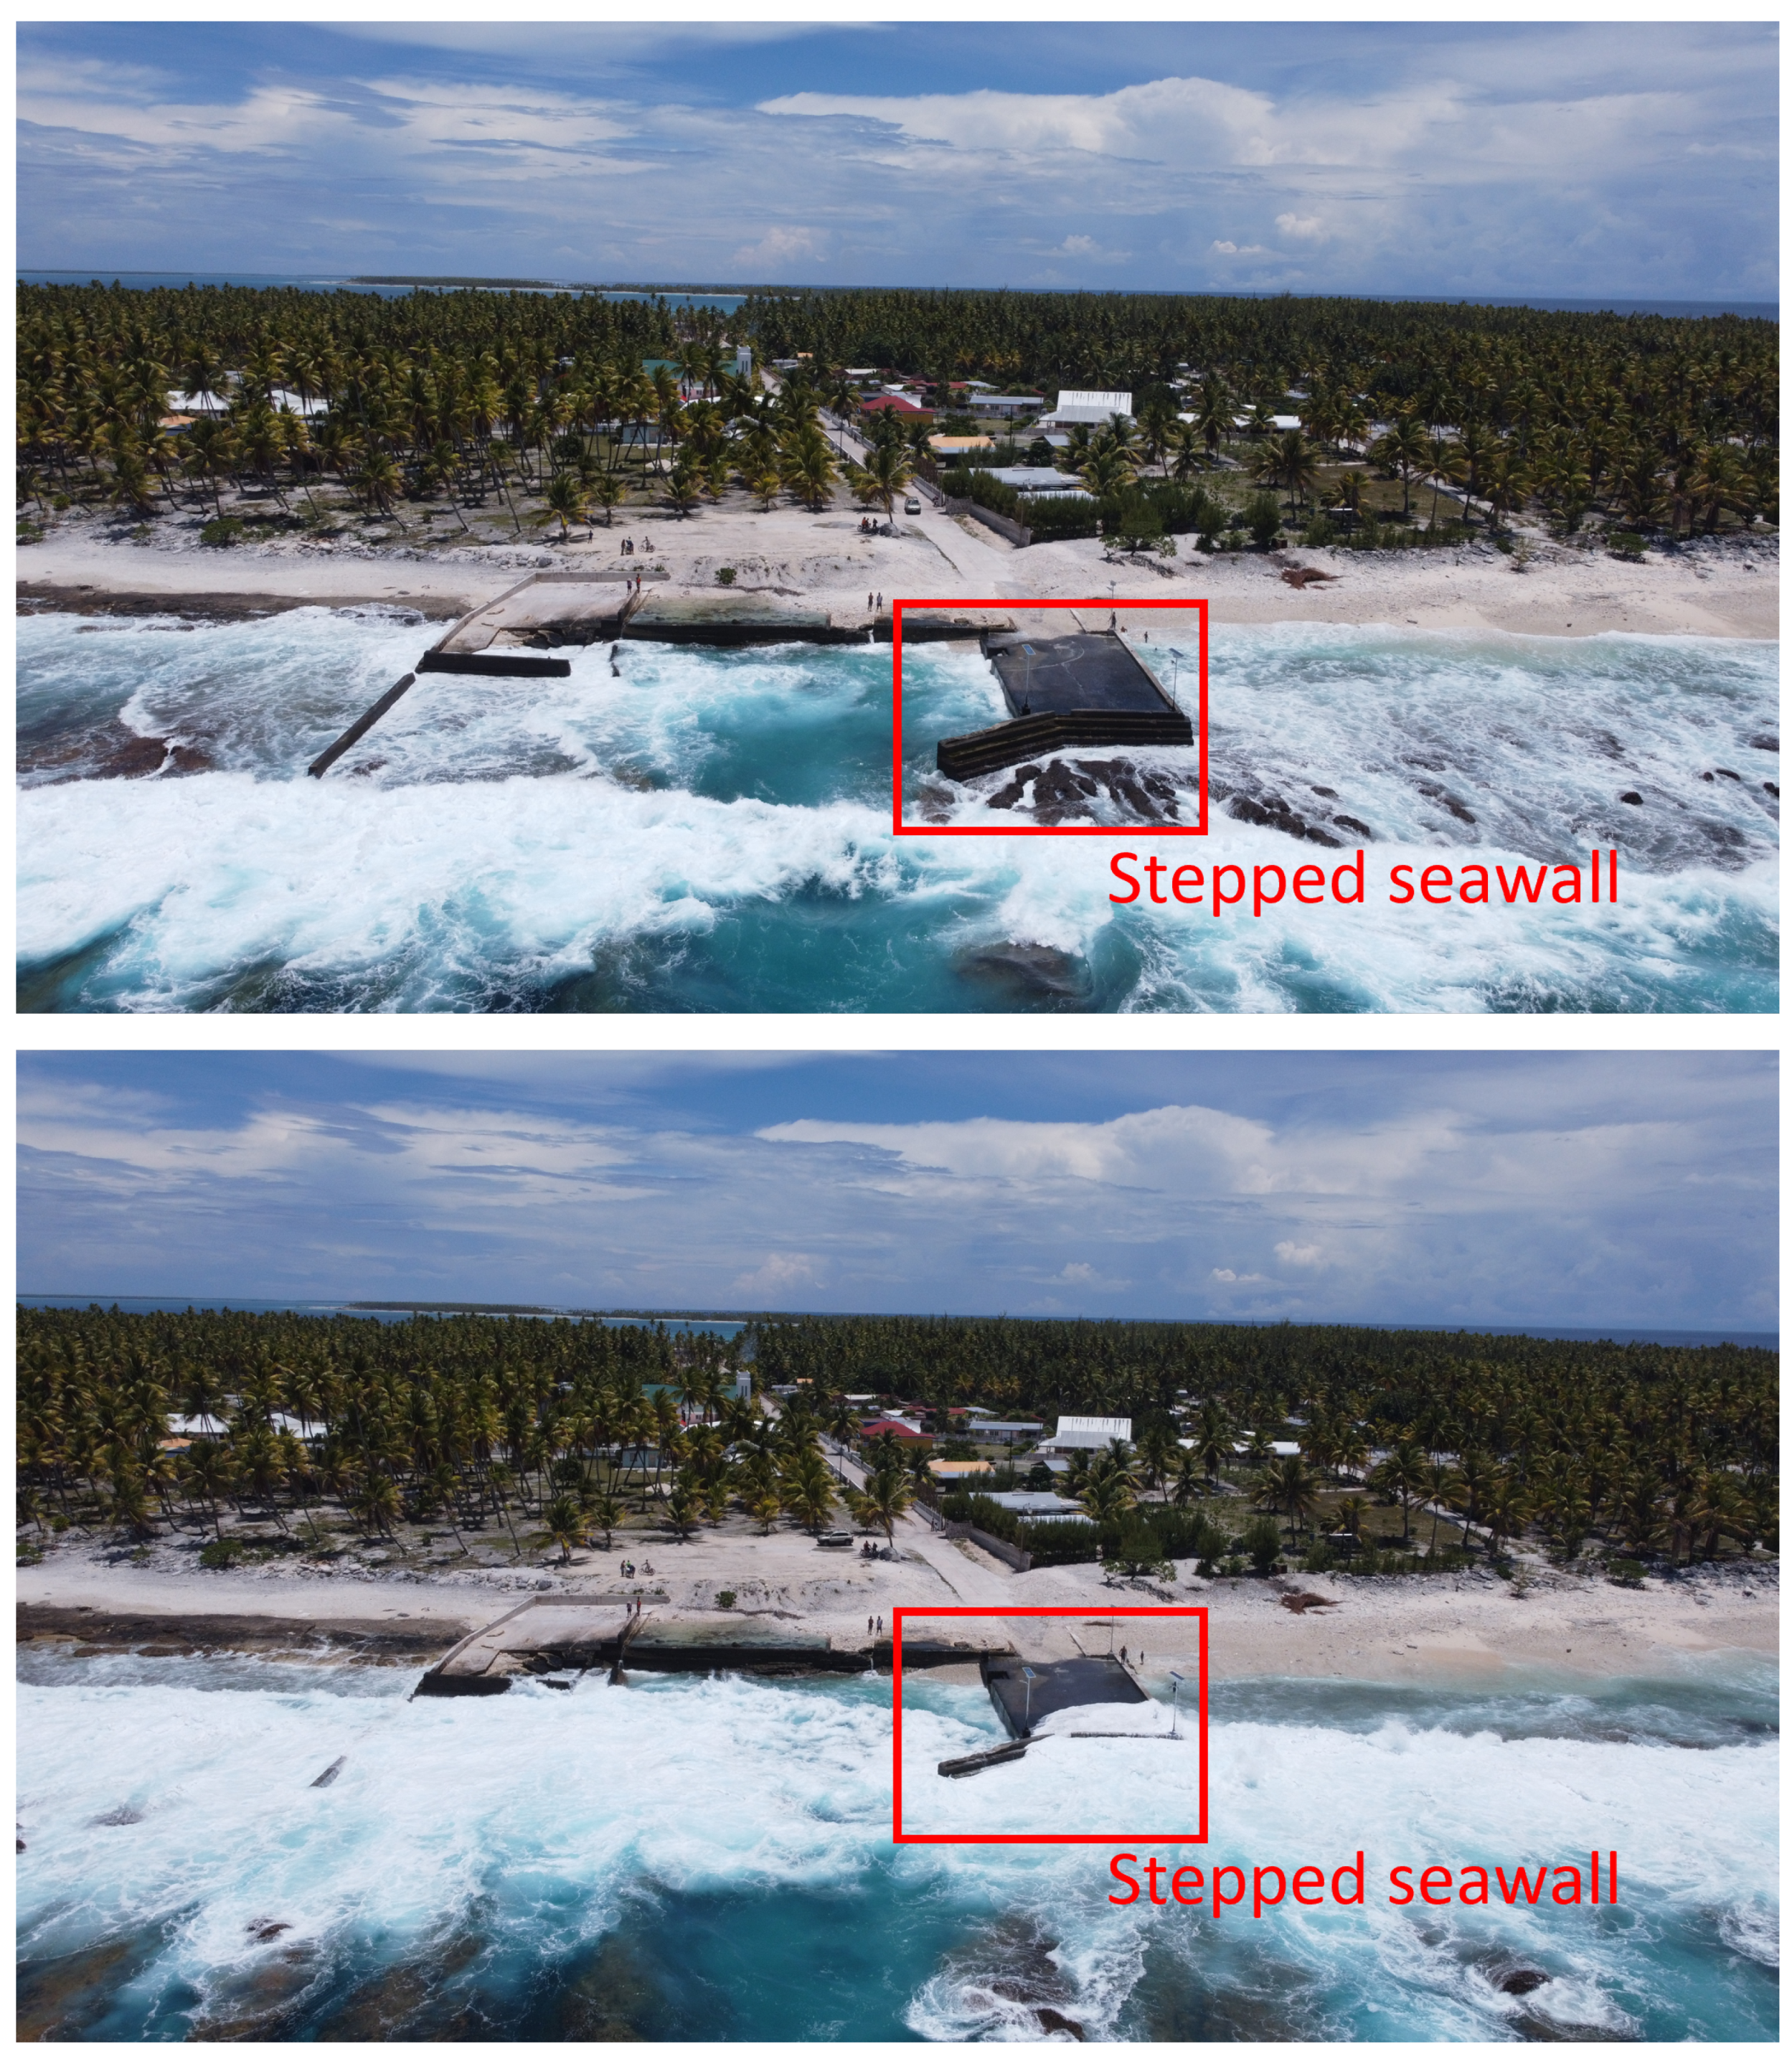
The defence design is currently a crucial issue for many low-lying coral islands such as closed coral atolls, where in the absence of well-developed reef passes, channel-basin systems have been directly dug into the reef flat to ensure boat access for all island supplies. A typical illustration of such a system at Reao island, French Polynesia, is displayed in Figure 1. The seawalls here play a direct role on wave buffering, but they also affect, by controlling the transmitted energy and the water mass, the intensity and stability of the return flow in the channel, which is a major threat for boat navigation and berthing. The wave conditions at the time of the picture were typical of well-developed swell conditions, but not a particularly energetic event, according to local fishermen (no wave data were available in this remote area). One notes that the submersion of most defences, including the 2.4 m high stepped wall in the red frame.
While a vast body of literature exists on wave force and stability issues in the design of breakwaters [7,8,9,10,11,12,13,14,15], together with the parameterization of overtopping for simple seawall shapes [15,16,17], a few studies have been dedicated to the shape optimization [18]. Most existing seawalls can be classified as vertical, sloping, stepped, or curved types (these latter include the so-called ‘’non-overtopping” design) [19,20,21,22,23,24]. Furthermore, the seawall effectiveness is strongly dependent on the local deployment and hydrodynamic conditions, making direct comparisons delicate [18]. The main trends can be summarized as follows.
- Sloping seawalls reduce wave reflection compared to the vertical seawall, lowering the scouring risk and impact pressure [27], but they are less efficient in limiting overtopping (the ramp effect).
- Stepped seawalls have the same advantages as sloping seawalls (less impact and scouring), but are expected to favor wave dissipation.
Compound designs have also been proposed, such as the combination of a stepped/curved profile at the lower/upper part of the seawall profile, potentially providing the advantages of both shapes (wave breaking and reflection) and minimizing the disadvantages (ramping and impact) [19,20].
In addition to the sparse knowledge of the shape effect, the specific configuration of seawall systems deployed on coral reef flat remains undocumented. On natural reef systems, being barrier or fringing reefs, the wave dynamics show remarkable features when compared to the more classical case of sand beaches. The steep slope observed on forereefs induces more violent plunging wave breaking [29,30,31,32,33], leading to an increased wave setup, while the shallowness and the roughness of the reef flat system are associated with an increased degree of dissipation and spectral energy transfers [34,35,36,37,38,39,40,41,42,43]. Waves and water levels are then intrinsically and non-linearly connected all across the reef system. Starting at the breaking point, the main trends are an attenuation of short waves (SW), an increase of the mean water level, and the development of long infragravity (IG) waves [44]. However, the coupling between the driving physical processes (reflexion, breaking, friction, and non-linear transfers) controlling wave transformation are strongly non-linear [37], and are dependent on the local hydrodynamical and morphological features. This complex coupled evolution of waves and the water level is therefore a major obstacle for the prediction of the exposure level of any defence placed on the reef flat.
The aim of the present study is to decipher, under controlled conditions, the hydrodynamical functioning of a seawall deployed on a fringing reef flat. To address this issue, direct field studies should be ruled out, considering their cost and environmental impact, while numerical models able to reach sufficient resolution to decipher the shape effect [18] are still unusable at the full reef system scale. The approach followed here is to use laboratory wave flume experiments to understand the seawall effect on the wave field, focusing on the role played by shape and position. Section 2 describes the experimental setup, including the instrumentation and methods. Section 3 presents the results, while Section 4 provides a discussion and outlines the prospects.
2. Materials and Methods
2.1. Experimental Setup
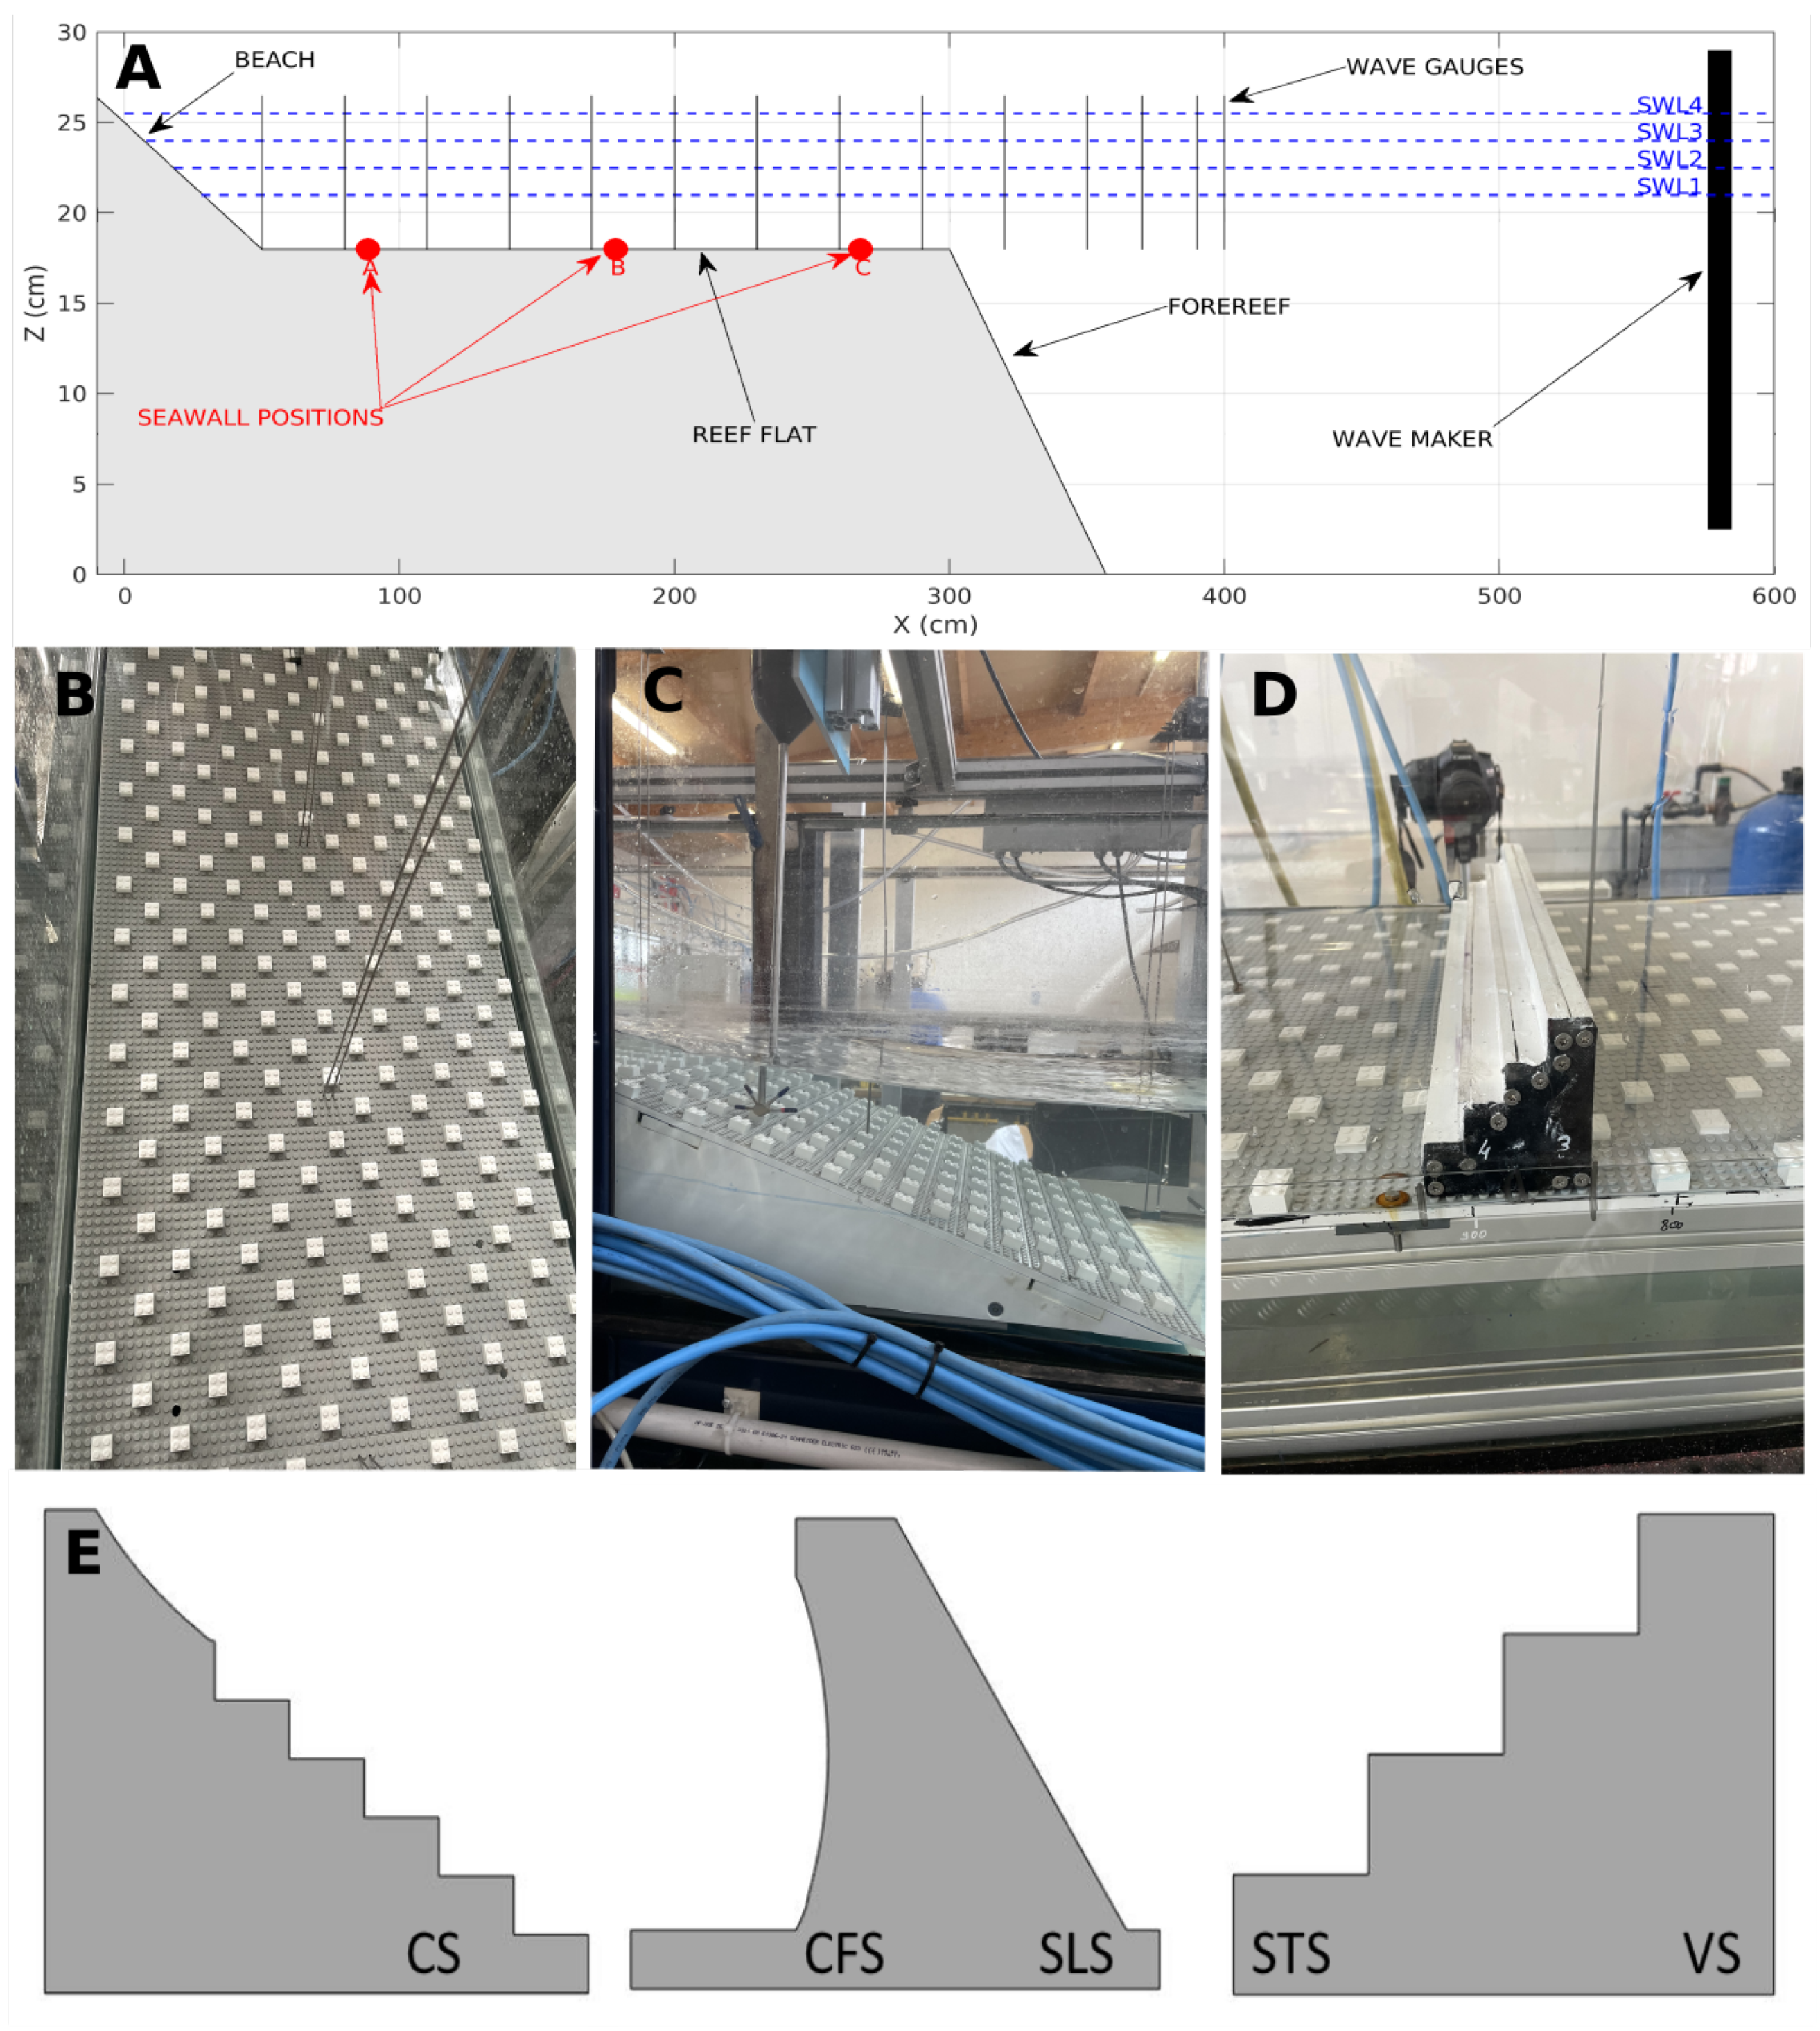
Experiments were carried out in the CASH (Canal Aero-Sedimento- Hydrodynamics) wind-wave flume Seatech engineering school, University of Toulon [45]. The flume has a length of 6m and a width of 0.5m. It was equipped with an idealized fringing reef bathymetry (Figure 2A) made of (i) a 2.5 m length flat horizontal bottom, (ii) a 0.5 m length linear sloping forereef (slope of ), (iii) a 2.5 m length and 0.18m height horizontal reef flat, and (iv) a dissipative beach. The reef bed, including the forereef, the reef flat, and the dissipative beach, was made of a plastic LEGO® baseplate covered by a regular layout of 1.6cm height plastic cubes arranged in alternating gridlines (Figure 2B,C), showing an overall roughness standard deviation of 0.6 mm.
2.2. Test Cases
2.2.1. Wave and Depth Conditions
Irregular waves, based on a JONSWAP spectrum (), were produced using a piston wave maker in the flat bottomed section of the flume. Each run lasted 5 min. Four experimental water depth cases and five experimental wave cases with different wave characteristics were performed, aiming to cover a wide range of seawall exposure (Table 1). For a given wave forcing, the actual significant height of the generated wave depends on the water depth (deeper conditions at the wave maker produces slightly higher waves).
2.2.2. Seawall Shapes and Positions
For each wave/depth condition, five seawall shapes and three seawall positions were systematically tested (Figure 2D,E):
- Curved front seawall (CFS),
- Stepped seawall (STS),
- Sloping seawall with a slope of 45° (SLS).
- Vertical seawall (VS).
- Compound seawall with a stepped part at the toe and a curved part at the top of the structure (CS).
Three asymmetric seawalls were actually built (Figure 2E) and flipped to expose the selected face to the incoming wave. All seawall shapes were built in PVC with a 8 cm crest, and filled with lead beads to ensure stability. The smooth PVC surface ensured that the study focused on the effect of shape only, without additional surface-roughness dissipation. Each seawall was tested at three different positions, defined from the shoreward end of the flume: near the reef crest ( m), in the middle of the reef flat ( m), and near the shoreline ( m) (Figure 2A).
2.3. Instrumentation and Data Processing
Free surface elevation measurements were performed using 14 resistor-type wave gauges arranged as shown in Figure 2, with an acquisition frequency of 100 Hz. Data processing was carefully conducted in order to maintain the original wave characteristics while separating the short waves (SW) and infragravity waves (IG). Each elevation timeseries was processed using a Fourier transform. The resulting spectral density of variance was integrated on the short waves (SW) band of to obtain the corresponding significant wave height . The lower limit at was selected because a clear energy drop was observed between the short and long (infragravity) bands for all wave and depth conditions.
2.4. Estimation of Seawall Efficiency
Estimating the efficiency of a seawall in a realistic reef flat context remains a challenge, owing to the fact that the seawall is integrated within a natural system already affected by a strong wave dissipation and fluctuation of the free surface at various time scales (SW, IG, and wave setup). The seawall implementation on the reef flat may not only act as a local filter of wave energy, but is expected to affect several processes acting in wave transformation (reflexion, breaking, and harmonic transfers). Therefore, the assessment of seawall efficiency requires a quantification of the defence-induced modification applied on the reef system as a whole. Moreover, in many situations observed in Polynesian atolls, seawalls are exposed to regular submersion during typical wave events, as illustrated by Figure 1, without the need to reach extreme wave conditions. In this context, the defence will act as a partly submerged breakwater. In addition, a focus point of the present study was to characterize the remaining wave agitation downstream of the seawall. For these reasons, instead of assessing the seawall effect in terms of the overtopping discharge [46,47,48], the seawall efficiency was here quantified by the global transmission coefficients (Equation (1)), defined as the ratio between the deep water and the shoreline wave heights. Higher transmission coefficients were then associated with a lower defence efficiency.
The SW transmission coefficient is given by:
where is the deep-water wave height calculated from the linearly deshoaled free surface measurement average of the two wave gauges closest to the wave maker, and is the shoreline SW height. In order to distinguish the seawall effect from the free reef functioning, normalized transmission coefficients were defined as the ratio between transmission coefficients with the seawall and without the seawall .
The estimation of the transmission coefficient can be affected by secondary wave reflection at the wave maker, through possible changes in due to differential wave height modulation. For given depth and wave forcing conditions, the average fluctuation of is 2.9%. This remains weak compared to the effects of seawall shape and position on highlighted hereafter, and should therefore not drastically affect the main interpretations.
2.5. Scaling Strategy
The laboratory experiments did not aim to provide a comprehensive scaling of the fine wave impact dynamics at the real scale, but rather, to assess the overall hydrodynamical defence effect under controlled conditions. The focus was placed on the relevancy of conditions for wave propagation over the reef flat (), wave shape (), and breaking features (surf similarity parameter < 2, with , being the forereef slope, H being the breaker height, and being the deep water wave length). The Froude scaling indicates that the scaling ratio between nature and laboratory was for the vertical scale and for the horizontal scale. Therefore, the real-scale depths are 6.3 to 7.65 m at the toe of the forereef, and 0.9 to 2.25 m over the reef flat, while the real-scale offshore wave heights range from 0.6 to 2.6 m. Note that the waves are generated at the wave maker under intermediate depth conditions. The experimental setup being focused on shallow wave dynamics, from the breaking over the forereef to the beach, the transformation from deep water up to the forereef is out of the scope of the present study. As for most wave flume experiments, the Reynolds number similitude is impossible to achieve.
3. Results
3.1. Overview
3.1.1. No-Seawall Cases
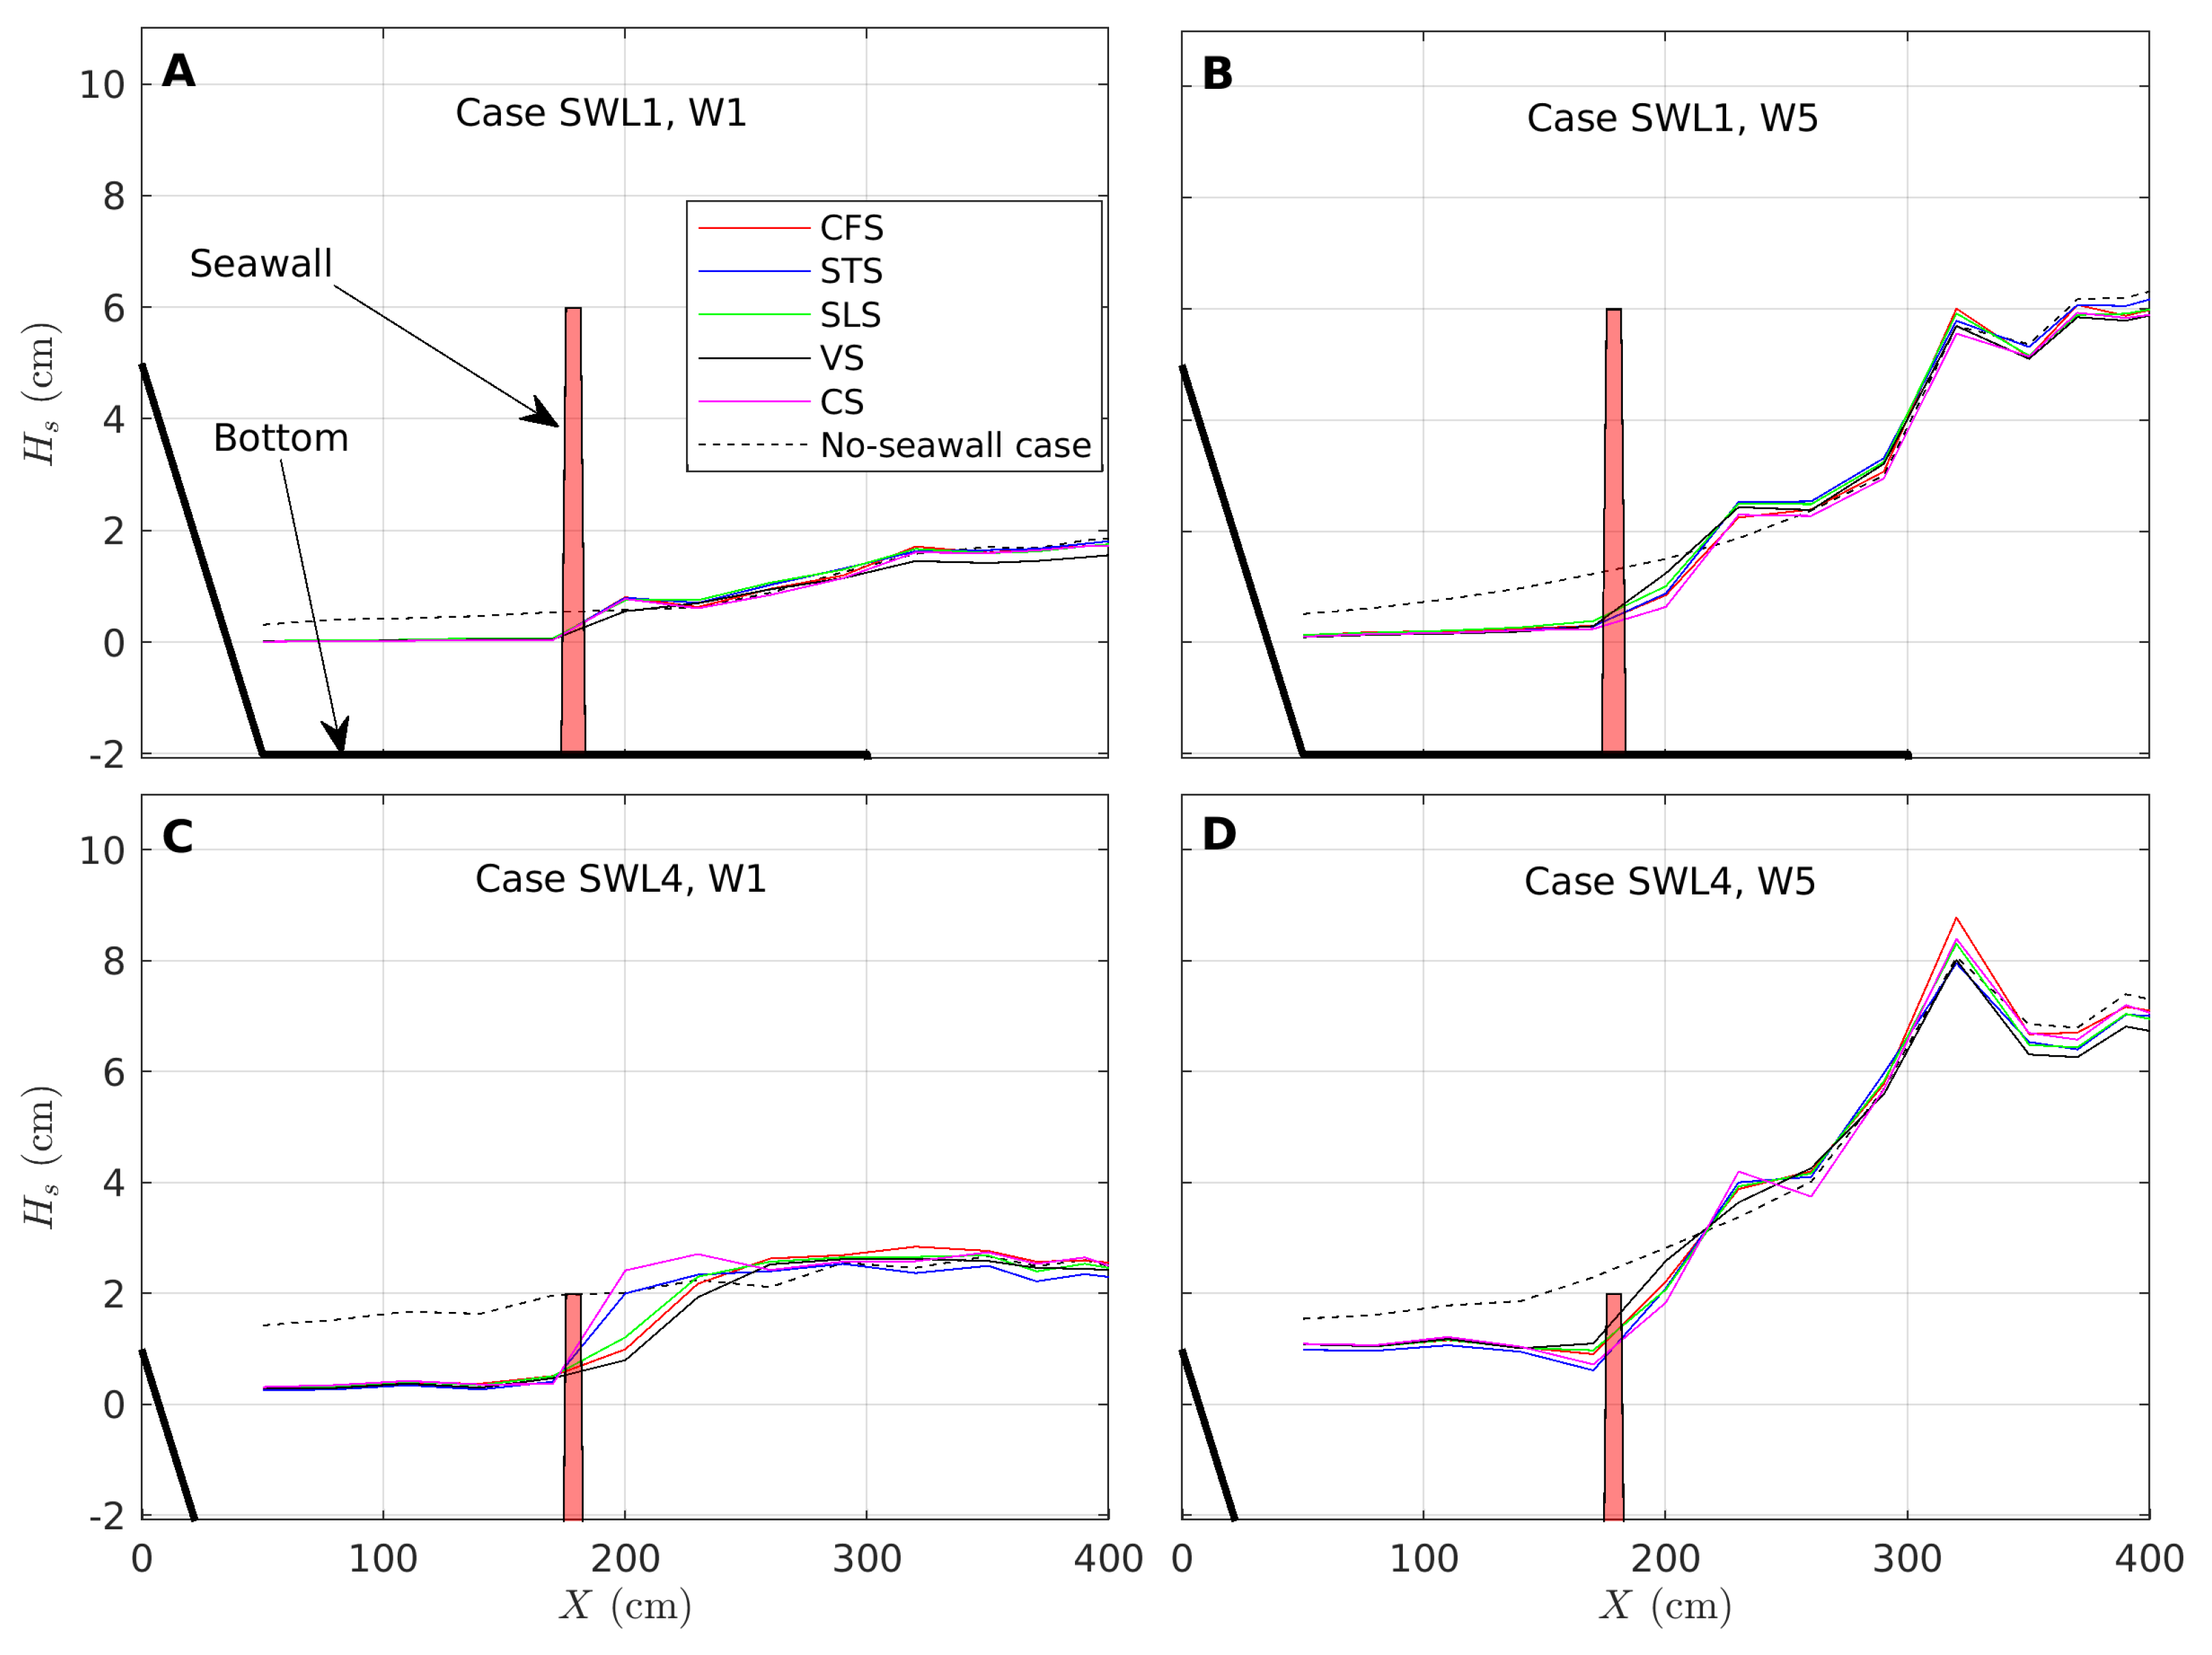
Figure 3 depicts the cross-shore profiles of significant wave height in SW bands, respectively, for four illustrative cases with low (SWL1) and high (SWL4) water levels and weak (W1) and strong (W5) wave forcing. Note that the zero for the y-axis corresponds to the still water level for each case. We first focus on the description of the reference no-seawall tests (see the black dashed lines in Figure 3). The aim of the analysis is not to precisely decipher each physical process acting in the wave dynamics on the reef system, which has already been detailed in dedicated studies [34,35,36,37,49,50], but rather, to assess the relevancy of the present reef system in reproducing the common hydrodynamics observed on typical fringing reef systems before exploring the effect of the seawall. As expected in such environments [37,51,52], the SW profiles show a strong dependency to both deep water wave forcing and depth. For weak wave and shallow reef flat conditions (Figure 3A), wave breaking occurs over the upper forereef. The attenuation rate, due to the combined effects of friction and breaking dissipation and non-linear energy transfers, is moderate: half of the incident wave height is attenuated at around cm, and 18% remains at the shore. Increasing the water depth (Figure 3C) leads to a strong decrease of wave dissipation. No breaking-induced inflexion of the wave height profile is observed, indicating that most of the attenuation should be attributed to frictional dissipation. This observation is confirmed with the estimation of the breaking parameter , defined as the ratio between the local wave height and depth, which remains below 0.3 throughout the reef system. The remaining wave height at the shore is about 54 % of the incident wave height. Increasing the wave energy has a drastic effect on the SW profile ((Figure 3B,D). The breaking point is clearly identified, with a nearly constant position over the forereef (about , see Figure 3B,D) regardless of the water depth due to the very strong bottom slope [49]. Offshore of the breaking point ( cm), the SW height profile displays spatial modulations due to the combined effects of shoaling and partial reflection. Onshore of the breaking point, the wave attenuation is first governed by breaking dissipation over the forereef (260 cm cm). Decreasing the water depth (Figure 3b vs. Figure 3d) leads to a stronger dissipation rate in the surf zone, due to a more violent plunging breaking. The remaining SW heights at the shore are 8% and 21% of the offshore wave height for the shallow and deep cases, respectively.
3.1.2. Seawall Cases
In each studied case, the seawall has a drastic effect on the wave dynamics. Illustrative cases with the seawall in Position B are depicted in solid lines in Figure 3, with colors indicating the seawall shape. First, it is worthwhile to mention that the seawalls do not only show a local buffering effect, but they also strongly affect the upstream wave field due to reflection and complex wave–structure interaction. This is particularly visible under strong wave conditions (Figure 3B,D) where a spatial modulation of the wave height is observed, leading to a decrease of wave height just upstream of the obstacle when compared to the no-seawall case. This observation reinforces the need to use a global approach at the reef scale to understand the seawall effect. In the small wave and shallow depth case (Figure 3A), an abrupt drop is observed on the SW profile. Regardless of the seawall type, most of the incoming energy is filtered and only residual agitation is measured downstream of the seawall ( cm). The wave damping decreases with increasing incoming wave height or water depth. The distinct effects of depth and wave condition are observed when comparing Figure 3B,C with Figure 3A, respectively. While forced by different conditions (small depth/large wave vs. large depth/small waves), both the SWL1/W5 and SWL4/W1 cases show similar levels of agitation downstream of the obstacle ( about 0.3 cm at the shore). Combining large waves and deeper conditions (Figure 3D) leads to a higher transmission of SW energy toward the shore ( cm).
3.2. Transmission Coefficients
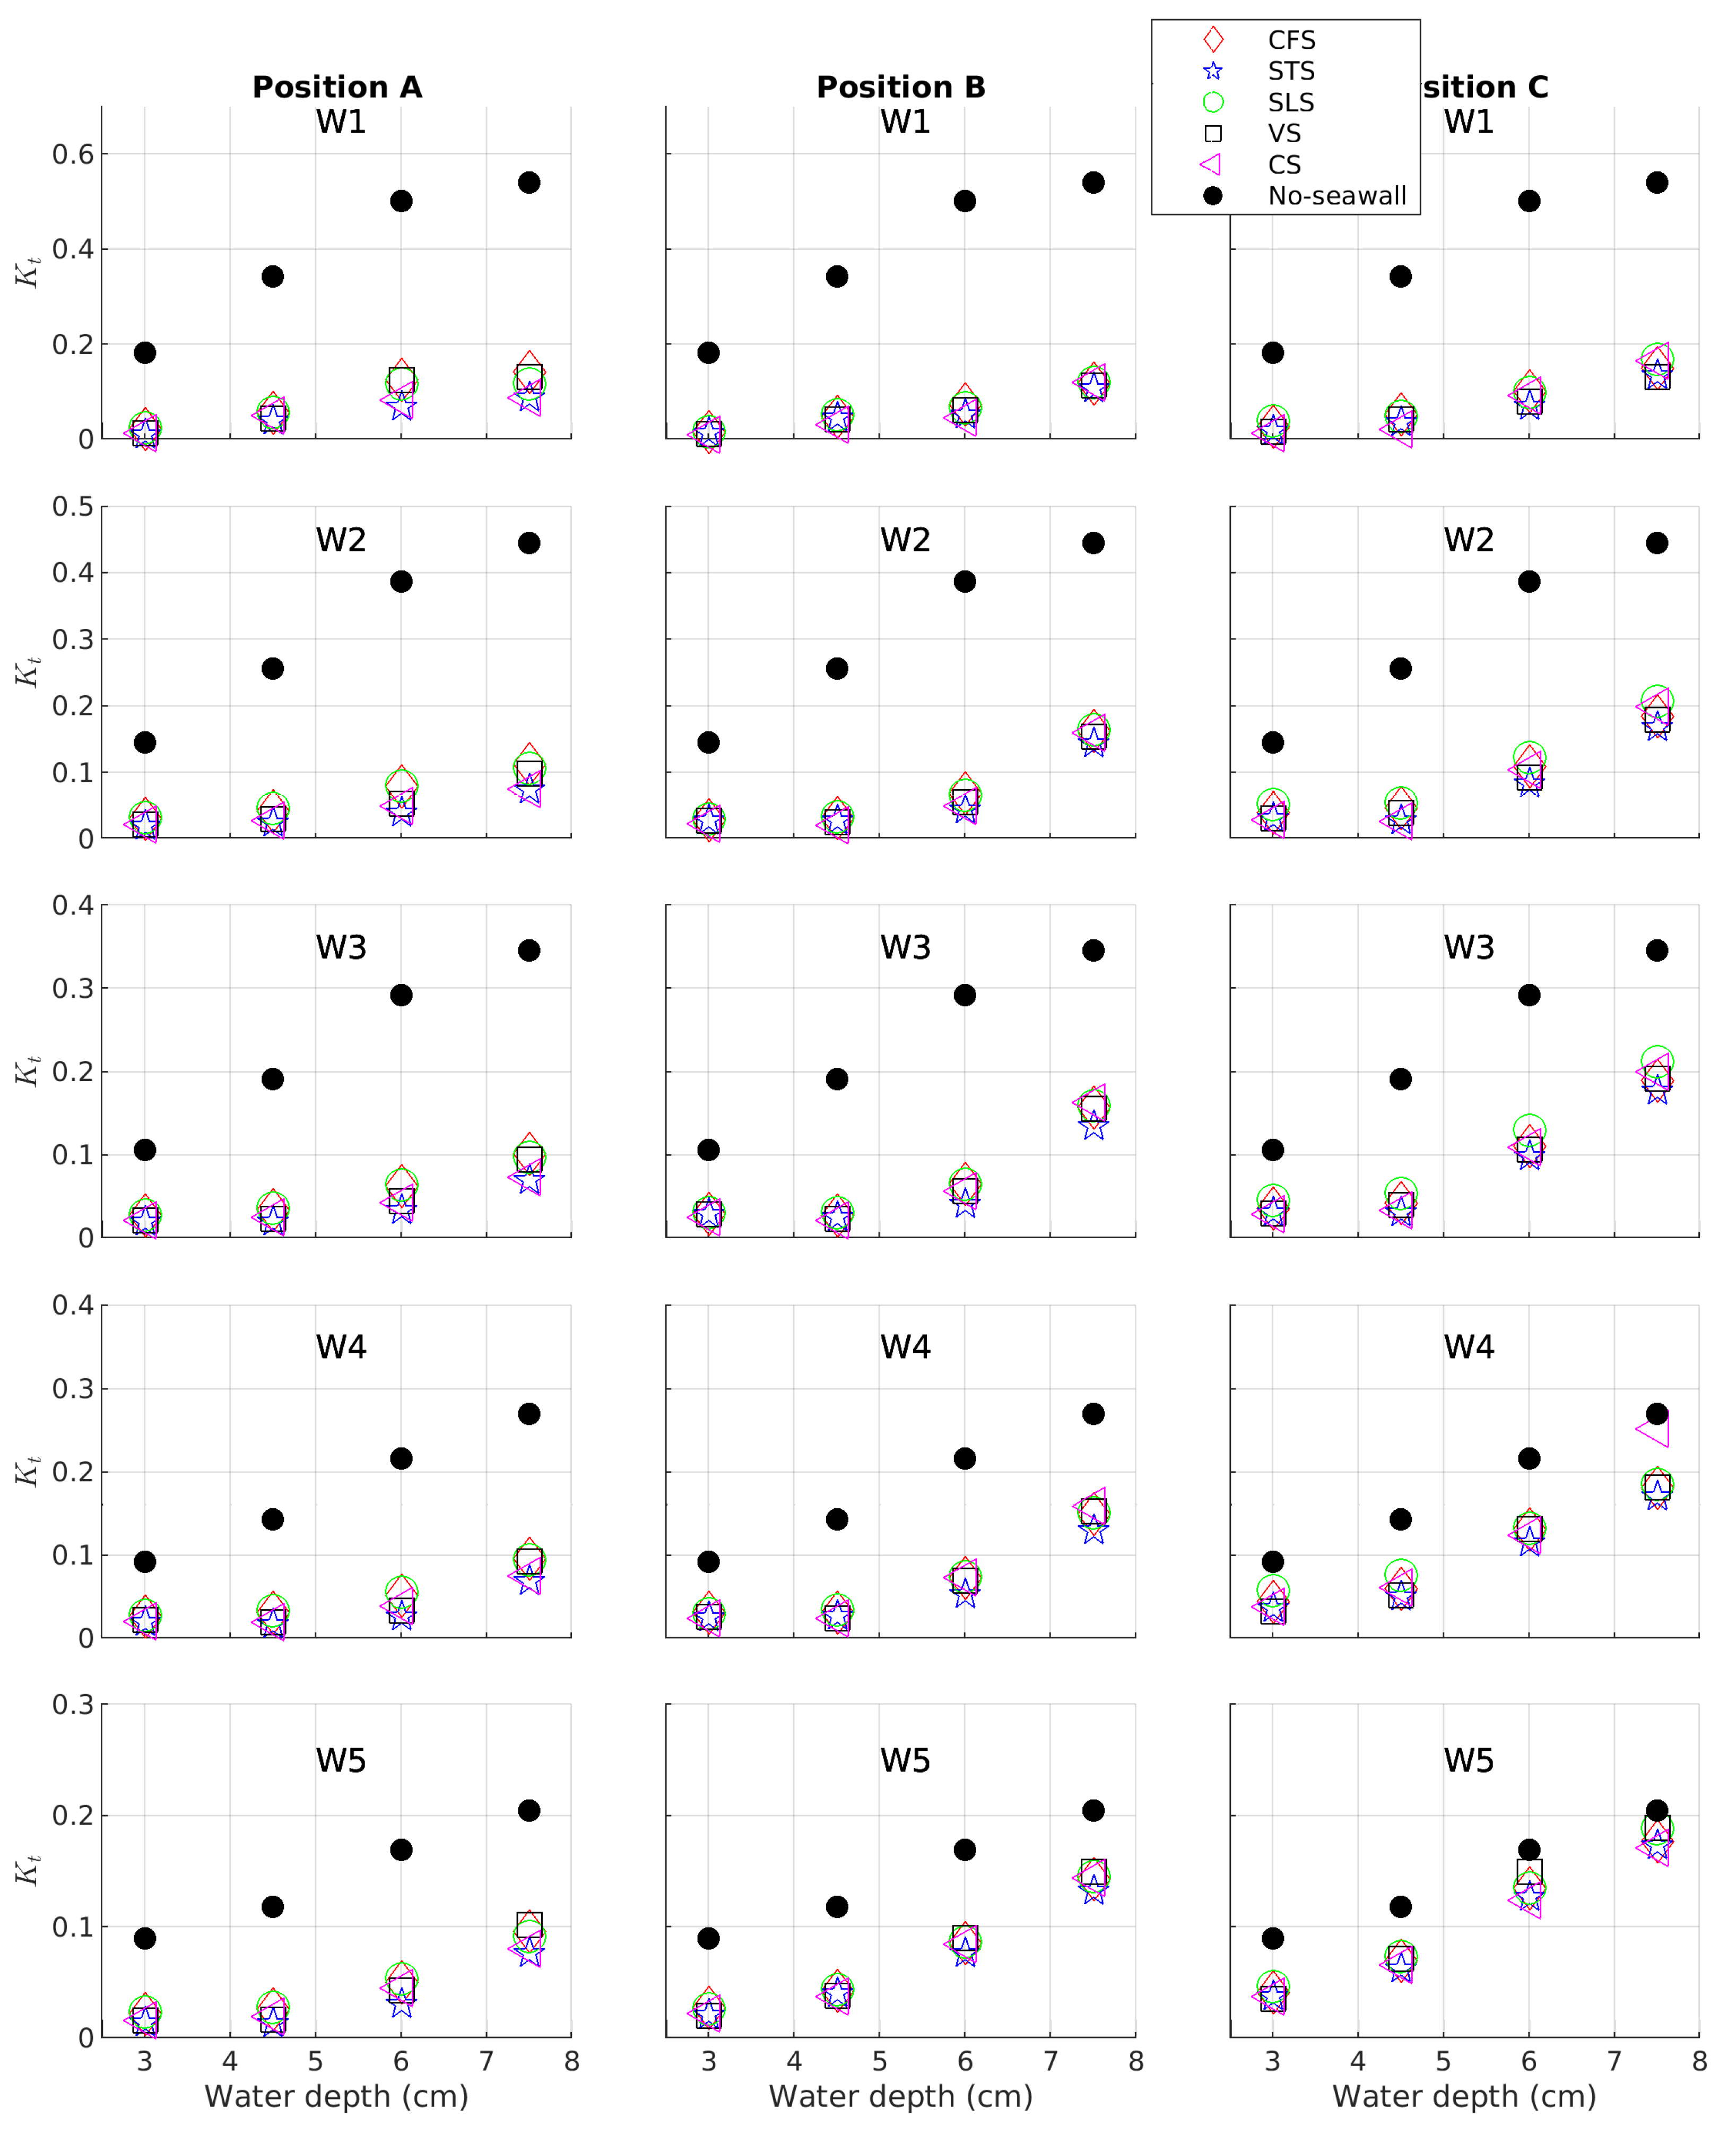
Figure 4 depicts the transmission coefficient for each considered case: the water depth (x-axis), wave condition (rows), seawall position (columns), and seawall shape (colored markers). The reference no-seawall conditions are shown in black dots. The free (no-seawall) reef system shows the expected increase of SW dissipation for shallow depths and large waves. In most cases, the transmission coefficients are significantly lowered by the implementation of the defence. The seawall effect first shows a marked dependency on depth: the larger the depth, the greater the transmission coefficient. For a small depth, remains below 0.07 regardless of the wave forcing, or the seawall shape of position. An increasing depth leads to an increase of , with a further dependency on wave forcing and seawall position. For small waves and shallow depths, the seawalls show similar performances regardless of their positions. Increasing wave forcing and water depth leads to a differential behavior depending on the seawall position: the more shoreward the seawall, the weaker the transmission coefficient. Overall, the most unfavorable case is reached when combining a large depth, high waves, and an offshore seawall position, for which the transmission coefficient is quite close to the one obtained in the no-seawall case.
Finer information is gained on the seawall shape effect by computing the normalized transmission coefficient (Equation (2)); see Figure 5. Strong variations are observed, with ranging from 9 to . The previous trends are confirmed: the wave transmission over the seawall is promoted by large waves, a large depth, and an offshore-located seawall. An additional sensitivity to the seawall shape is observed. The best overall performance in terms of SW attenuation is reached for STS and CS, which shows a 5 to 25% lower than the SLS and CFS types. VS show variable efficiency, with the best performances reached at low water depths.
3.3. Relationship to External Parameters
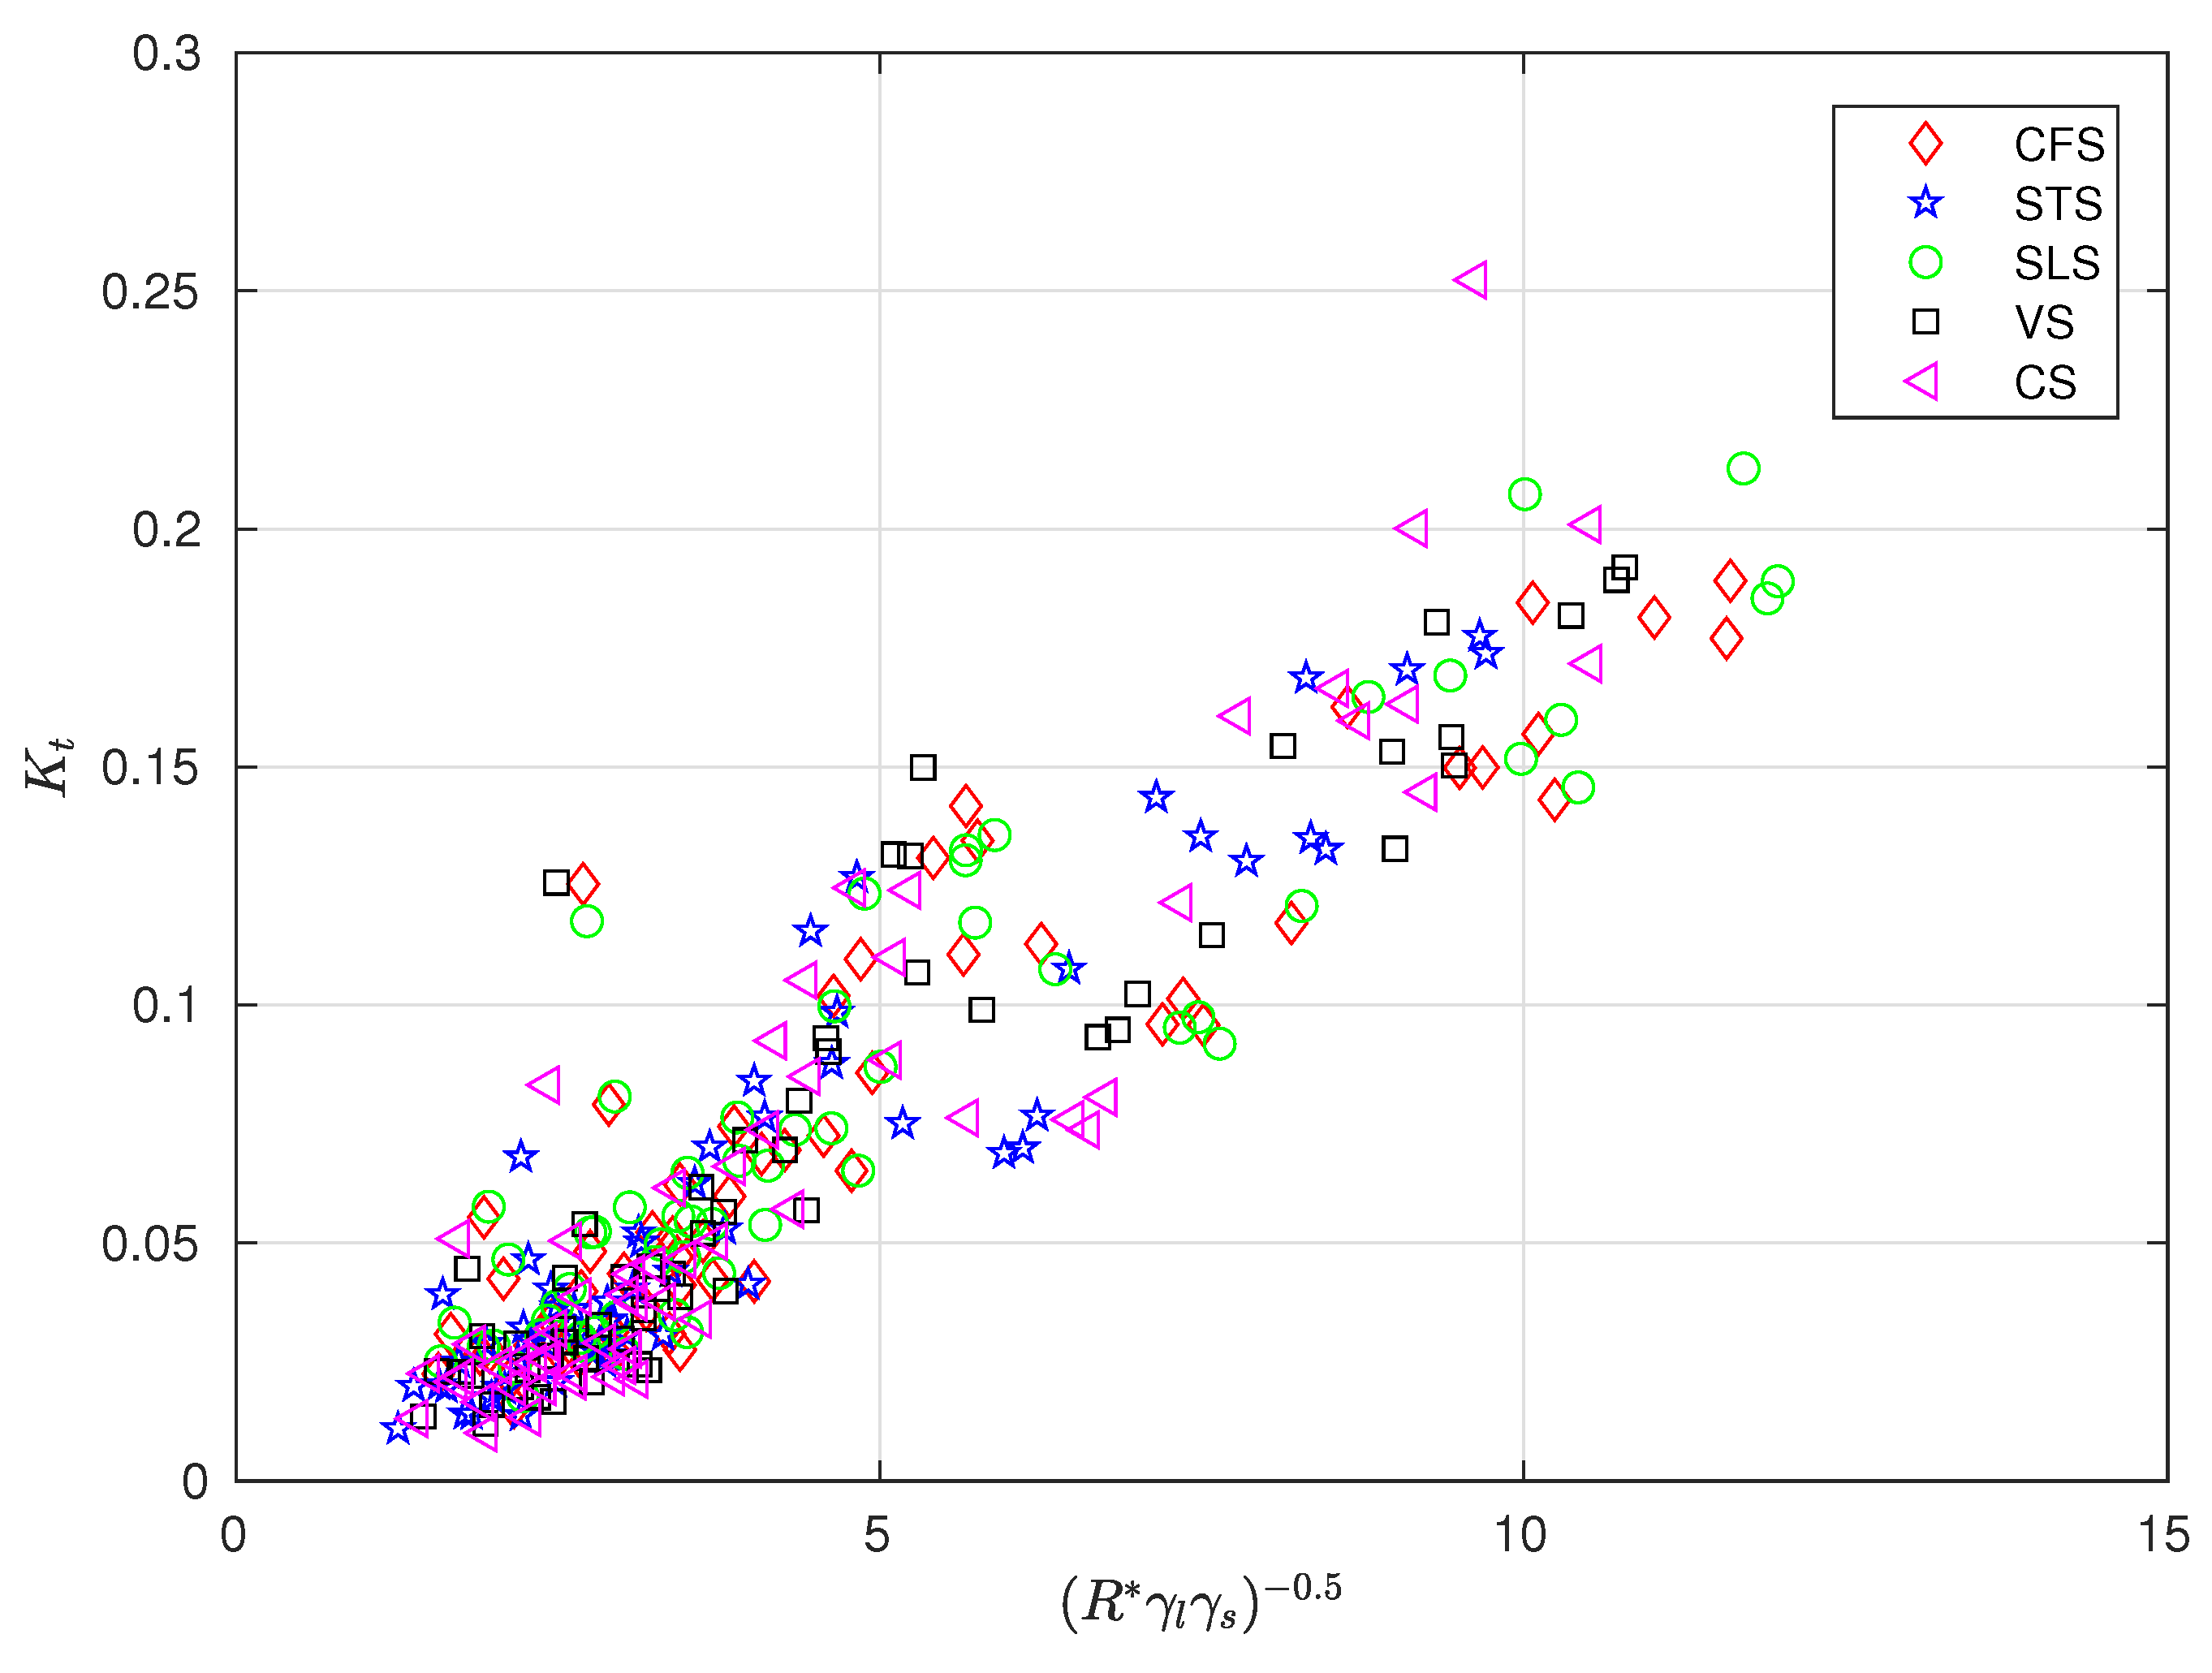
Following previous works carried out on overtopping issues [46,48,53], we propose here an empirical formulation aiming to predict the transmission coefficient as a function of the external parameters of the system. We first define the dimensionless freeboard as
where is freeboard. Two reductions factors and are formed to account for the effect of the berm width and the seawall shape, respectively, defined as:
where X and are the cross-shore distances between the seawall and the reef crest, and the wave length on the reef flat. The best predicting model is obtained for
The shape factor is fixed at 0.85, 0.9, 1, 1.1, and 1.3 for SLS, CFS, VS, CS, and STS, respectively, based on an optimization of the linear determination coefficient between and .
Figure 6 depicts the relationship between and . The linear determination coefficient is 0.85, confirming the validity of the parameterization for the whole dataset.
4. Discussion
Building upon previous research on seawall–wave interactions, this study presents a detailed quantification of wave attenuation by a single seawall defence deployed on an archetypal reef flat. The study has been carried out in controlled laboratory experiments, which currently remains the only possible approach, allowing for a careful assessment of the seawall effect at the complete reef system scale. The seawall efficiency is addressed here in terms of the wave transmission coefficient , in order to cover a large range of submersion conditions forced by irregular wave fields and varying mean water levels. The main findings can be summarized as follows:
- The seawall efficiency, measured in terms of the transmission coefficient, is intrinsically linked to its level of exposure, and therefore, to the coupled dynamics of wave and water depth across the reef system.
- Higher efficiencies are reached for a low water level and a low incoming wave height.
- As a consequence, the more onshore the seawall, the stronger the wave attenuation.
- The experimental results confirm the recent numerical observations [18] showing that that a stepped seawall shape is more efficient than vertical, sloping, and curved seawall shapes.
- The additional compound seawall shape tested here shows good performance, but it does not surpass the results reached with a stepped seawall.
- A simple monotonic prediction formula is proposed to represent the overall effect of the main external factor controlling the seawall efficiency: the freeboard, the incoming wave height, the berm width, and the seawall shape.
The observations presented here result from bulk observations over a complete irregular wave run, ensuring robust statistics. The detailed dynamics of each individual wave impact are not isolated by the measurements. However, the overall results are in agreement with the qualitative observations performed during the experiments. In particular, it has been observed that the most reflective shapes (vertical and curved) are actually the most efficient in reflecting most individual wave impacts. However, placed in an irregular wave field, this does not systematically result in lower overtopping and energy transmission due to the complex local interactions between the incident and reflected wave fronts just upstream of the seawall, regularly leading to the opposite effect. The sloping seawall showed much lower reflection, but also a clear ramp effect, inducing an increase in overtopping and wave transmission for nearly all conditions. The stepped and compound seawalls showed visually more regular but weaker overtopping than the vertical and curved seawalls. The stepped/compound seawalls do not establish a impassable obstacle, but they are very efficient in buffering the wave energy by increased breaking-induced dissipation, whatever the depth and wave conditions.
In the general context of global sea level rises and increases in the vulnerability of low-lying coral islands, the present database can be used for operational engineering purposes, but it may also be helpful in calibrating numerical wave models for which the representation of wave dynamics in such complex environments remains a major challenge. The present study was totally focused on hydrodynamics, and did not consider wave load and stability issues. However, it is worthwhile to mention that the most effective configurations, in terms of shape and position, are certainly those for which the loads are minimized.
Author Contributions
Conceptualization, D.S.; methodology, G.R. and D.S.; validation, G.R. and D.S.; investigation, G.R. and D.S; resources, D.S.; data curation, G.R.; writing—original draft preparation, G.R.; writing—review and editing, D.S.; visualization, D.S.; supervision, D.S.; project administration, D.S.; funding acquisition, D.S. All authors have read and agreed to the published version of the manuscript.
Funding
This research was funded by LE MINISTERE DE L’EQUIPEMENT DE POLYNESIE FRANCAISE, grant number 20/21/MAPA/MGT.
Institutional Review Board Statement
Not applicable.
Informed Consent Statement
Not applicable.
Data Availability Statement
The data presented in this study are available on request from the corresponding author. The data are not publicly available due to MINISTERE DE L’EQUIPEMENT DE POLYNESIE FRANCAISE’s ownership.
Conflicts of Interest
The authors declare no conflict of interest.
References
- Comeau, S.; Cornwall, C.; DeCarlo, T.M.; Doo, S.; Carpenter, R.; McCulloch, M. Resistance to ocean acidification in coral reef taxa is not gained by acclimatization. Nat. Clim. Chang. 2019, 9, 477–483. [Google Scholar] [CrossRef] [Green Version]
- Cheal, A.J.; MacNeil, M.A.; Emslie, M.J.; Sweatman, H. The threat to coral reefs from more intense cyclones under climate change. Glob. Chang. Biol. 2017, 23, 1511–1524. [Google Scholar] [CrossRef] [PubMed]
- Lartaud, F.; Meistertzheim, A.; Reichert, J.; Ziegler, M.; Peru, E.; Ghiglione, J. Plastics: An additional threat for coral ecosystems. In Perspectives on the Marine Animal Forests of the World; Springer: Berlin/Heidelberg, Germany, 2020; pp. 469–485. [Google Scholar]
- Fernando, H.; McCulley, J.; Mendis, S.; Perera, K. Coral poaching worsens tsunami destruction in Sri Lanka. Eos Trans. Am. Geophys. Union 2005, 86, 301–304. [Google Scholar] [CrossRef] [Green Version]
- Paldor, A.; Michael, H. Storm surges cause simultaneous salinization and freshening of coastal aquifers, exacerbated by climate change. Water Resour. Res. 2021, 57, e2020WR029213. [Google Scholar] [CrossRef]
- Ehlert, R.A. Coral concrete at bikini atoll. Concr. Int. 1991, 13, 19–24. [Google Scholar]
- Sainflou, G. Essai sur les digues maritimes verticales. Ann. Ponts Chauss. 1928, 98, 5–48. [Google Scholar]
- Allsop, N.; McKenna, J.; Vicinanza, D.; Whittaker, T. New design formulae for wave loadings on vertical breakwaters and seawalls. In Proceedings of the 25th ICCE, Conference on Coastal Engineering, Orlando, FL, USA, 2–6 September 1996; ASCE: New York, NY, USA, 1996. [Google Scholar]
- Allsop, N.; Vicinanza, D. Wave impact loadings on vertical breakwaters: Development of new prediction formulae. In Proceedings of the 11th International Harbour Congress, Antewerp, Belgium, 17–21 June 1996. [Google Scholar]
- Klammer, P.; Kortenhaus, A.; Oumeraci, H. Wave impact loading of vertical face structures for dynamic stability analysis-prediction formulae. In Proceedings of the 25th Conference on Coastal Engineering, Orlando, FL, USA, 2–6 September 1996. [Google Scholar]
- Kortenhaus, A.; Oumeraci, H. Classification of wave loading on monolithic coastal structures. In Proceedings of the Coastal Engineering, Copenhagen, Denmark, 22–26 June 1998. [Google Scholar]
- Oumeraci, H.; Kortenhaus, A.; Allsop, W.; de Groot, M.; Crouch, R.; Vrijling, H.; Voortman, H. Probabilistic Design Tools for Vertical Breakwaters; CRC Press: Boca Raton, FL, USA, 2001. [Google Scholar]
- Takahashi, S. Design of Vertical Breakwaters; PHRI Reference Document nr. 34; PARI: Yokosuka, Japan, 2002. [Google Scholar]
- Cuomo, G.; Allsop, W.; Bruce, T.; Pearson, J. Breaking wave loads at vertical seawalls and breakwaters. Coast. Eng. 2010, 57, 424–439. [Google Scholar] [CrossRef] [Green Version]
- Goda, Y. Random Seas and Design of Maritime Structures; World Scientific Publishing Company: Singapore, 2010. [Google Scholar]
- Thomas, R.S.; Hall, B. Seawall Design; Butterworth-Heinemann: Oxford, UK, 2015. [Google Scholar]
- Tsinker, G. Handbook of Port and Harbor Engineering: Geotechnical and Structural Aspects; Springer: Berlin/Heidelberg, Germany, 2014. [Google Scholar]
- Dang, B.L.; Nguyen-Xuan, H.; Wahab, M.A. Numerical study on wave forces and overtopping over various seawall structures using advanced SPH-based method. Eng. Struct. 2021, 226, 111349. [Google Scholar] [CrossRef]
- CERC. Shore Protection Manual; US Army Coastal Engineering Research Center: Montgomery, AL, USA, 1973; Volume 1.
- Manual, E. Design of Coastal Revetments, Seawalls, and Bulkheads; Department of the Army, Corps of Engineers: Washington, DC, USA, 1995.
- Marukami, K.; Irie, I.; Kamikubo, Y. Experiments on a non-wave overtopping type of seawall. In Proceedings of the Coastal Engineering, Orlando, FL, USA, 2–6 September 1996. [Google Scholar]
- Pullen, T.; Allsop, N.; Bruce, T.; Kortenhaus, A.; Schüttrumpf, H.; Van der Meer, J. EurOtop Wave Overtopping of Sea Defences and Related Structures: Assessment Manual; Boyens Medien GmbH: Groningen, The Netherlands, 2007. [Google Scholar]
- Stagonas, D.; Ravindar, R.; Sriram, V.; Schimmels, S. Experimental evidence of the influence of recurves on wave loads at vertical seawalls. Water 2020, 12, 889. [Google Scholar] [CrossRef] [Green Version]
- Hosseinzadeh, N.; Ghiasian, M.; Andiroglu, E.; Lamere, J.; Rhode-Barbarigos, L.; Sobczak, J.; Sealey, K.S.; Suraneni, P. Concrete seawalls: A review of load considerations, ecological performance, durability, and recent innovations. Ecol. Eng. 2022, 178, 106573. [Google Scholar] [CrossRef]
- Martin-Medina, M.; Abadie, S.; Mokrani, C.; Morichon, D. Numerical simulation of flip-through impacts of variable steepness on a vertical breakwater. Appl. Ocean. Res. 2018, 75, 117–131. [Google Scholar] [CrossRef]
- Zapata, M.U.; Zhang, W.; Marois, L.; Hammouti, A.; Van Bang, D.P.; Nguyen, K. Two-phase experimental and numerical studies on scouring at the toe of vertical seawall. Eur. J. Mech.-B/Fluids 2022, 93, 13–28. [Google Scholar] [CrossRef]
- Salauddin, M.; Pearson, J. Experimental study on toe scouring at sloping walls with gravel foreshores. J. Mar. Sci. Eng. 2019, 7, 198. [Google Scholar] [CrossRef] [Green Version]
- Anand, K.V.; Sundar, V.; Sannasiraj, S.A. Dynamic pressures on curved front seawall models under random wave. J. Hydrodyn. 2010, 22, 521–527. [Google Scholar] [CrossRef]
- Young, I.R. Wave transformation over coral reefs. J. Geophys. Res. Ocean. 1989, 94, 9779–9789. [Google Scholar] [CrossRef]
- Smith, E.R.; Kraus, N.C. Laboratory study of wave-breaking over bars and artificial reefs. J. Waterw. Port Coast. Ocean. Eng. 1991, 117, 307–325. [Google Scholar] [CrossRef]
- Gourlay, M.R.; Colleter, G. Wave-generated flow on coral reefs—An analysis for two-dimensional horizontal reef-tops with steep faces. Coast. Eng. 2005, 52, 353–387. [Google Scholar] [CrossRef]
- Yao, Y.; Zhang, Q.; Chen, S.; Tang, Z. Effects of reef morphology variations on wave processes over fringing reefs. Appl. Ocean. Res. 2019, 82, 52–62. [Google Scholar] [CrossRef]
- Lowe, R.; Altomare, C.; Buckley, M.; da Silva, R.; Hansen, J.; Rijnsdorp, D.; Domínguez, J.; Crespo, A. Smoothed Particle Hydrodynamics simulations of reef surf zone processes driven by plunging irregular waves. Ocean Model. 2022, 171, 101945. [Google Scholar] [CrossRef]
- Lowe, R.J.; Falter, J.L.; Bandet, M.D.; Pawlak, G.; Atkinson, M.J.; Monismith, S.G.; Koseff, J.R. Spectral wave dissipation over a barrier reef. J. Geophys. Res. Ocean. 2005, 110, 1–16. [Google Scholar] [CrossRef]
- Monismith, S.G. Hydrodynamics of coral reefs. Annu. Rev. Fluid Mech. 2007, 39, 37–55. [Google Scholar] [CrossRef]
- Péquignet, A.C.; Becker, J.; Merrifield, M.; Boc, S. The dissipation of wind wave energy across a fringing reef at Ipan, Guam. Coral Reefs 2011, 30, 71–82. [Google Scholar] [CrossRef]
- Sous, D.; Tissier, M.; Rey, V.; Touboul, J.; Bouchette, F.; Devenon, J.L.; Chevalier, C.; Aucan, J. Wave transformation over a barrier reef. Cont. Shelf Res. 2019, 184, 66–80. [Google Scholar] [CrossRef] [Green Version]
- Reidenbach, M.A.; Monismith, S.G.; Koseff, J.R.; Yahel, G.; Genin, A. Boundary layer turbulence and flow structure over a fringing coral reef. Limnol. Oceanogr. 2006, 51, 1956–1968. [Google Scholar] [CrossRef]
- Rosman, J.H.; Hench, J.L. A framework for understanding drag parameterizations for coral reefs. J. Geophys. Res. Ocean. 2011, 116, 1–15. [Google Scholar] [CrossRef] [Green Version]
- Monismith, S.G.; Rogers, J.S.; Koweek, D.; Dunbar, R.B. Frictional wave dissipation on a remarkably rough reef. Geophys. Res. Lett. 2015, 42, 4063–4071. [Google Scholar] [CrossRef]
- Rogers, J.S.; Maticka, S.A.; Chirayath, V.; Woodson, C.B.; Alonso, J.J.; Monismith, S.G. Connecting flow over complex terrain to hydrodynamic roughness on a coral reef. J. Phys. Oceanogr. 2018, 48, 1567–1587. [Google Scholar] [CrossRef]
- Davis, K.A.; Pawlak, G.; Monismith, S.G. Turbulence and Coral Reefs. Annu. Rev. Mar. Sci. 2020, 13, 1948189. [Google Scholar] [CrossRef]
- Li, Y.; Zhang, C.; Chen, S.; Sui, T.; Chen, D.; Qi, H. Influence of artificial sandbar on nonlinear wave transformation: Experimental investigation and parameterizations. Ocean. Eng. 2022, 257, 111540. [Google Scholar] [CrossRef]
- Bertin, X.; De Bakker Anouk, V.D.A.; Giovanni, C.; Gael, A.; Fabrice, A.; Philippe, B.; Frederic, B.; Bruno, C.; Crawford Wayne, C.; Mark, D.; et al. Infragravity waves: From driving mechanisms to impacts. Earth Sci. Rev. 2018, 177, 774–799. [Google Scholar] [CrossRef] [Green Version]
- Sous, D.; Forsberg, P.L.; Touboul, J.; Nogueira, G.G. Laboratory experiments of surf zone dynamics under on-and offshore wind conditions. Coast. Eng. 2021, 163, 103797. [Google Scholar] [CrossRef]
- Owen, M. Design of Seawalls Allowing for Overtopping; Report EX924; HR Wallingford: Wallingford, UK, 1980. [Google Scholar]
- Besley, P. Wave Overtopping of Seawalls, Design and Assessment Manual; R&D Technical Report W178; HR Wallingford: Wallingford, UK, 1998. [Google Scholar]
- Allsop, W.; Bruce, T.; Pearson, J.; Besley, P. Wave overtopping at vertical and steep seawalls. In Proceedings of the Institution of Civil Engineers; Thomas Telford Ltd. Marit. Eng. 2005, 158, 103–114. [Google Scholar] [CrossRef]
- Buckley, M.L.; Lowe, R.J.; Hansen, J.E.; Van Dongeren, A.R. Dynamics of wave setup over a steeply sloping fringing reef. J. Phys. Oceanogr. 2015, 45, 3005–3023. [Google Scholar] [CrossRef] [Green Version]
- Buckley, M.L.; Lowe, R.J.; Hansen, J.E.; Van Dongeren, A.R. Wave setup over a fringing reef with large bottom roughness. J. Phys. Oceanogr. 2016, 46, 2317–2333. [Google Scholar] [CrossRef]
- Lentz, S.; Churchill, J.; Davis, K.; Farrar, J. Surface gravity wave transformation across a platform coral reef in the R ed S ea. J. Geophys. Res. Ocean. 2016, 121, 693–705. [Google Scholar] [CrossRef] [Green Version]
- Bruch, W.; Cordier, E.; Floc’h, F.; Pearson, S.G. Water Level Modulation of Wave Transformation, Setup and Runup over La Saline Fringing Reef. J. Geophys. Res. Ocean. 2022, 127, e2022JC018570. [Google Scholar] [CrossRef]
- Franco, L.; De Gerloni, M.; Van der Meer, J. Wave overtopping on vertical and composite breakwaters. In Proceedings of the Coastal Engineering, Kobe, Japan, 23–28 October 1994; pp. 1030–1045. [Google Scholar]
Figure 1.
Channel-basin system in the Reao fringing reef French Polynesia—Courtesy of A.Para, ODEWA.
Figure 1.
Channel-basin system in the Reao fringing reef French Polynesia—Courtesy of A.Para, ODEWA.

Figure 2.
Experimental setup. (A): Bed profile and instrumentation. (B) and (C): Reef flat and forereef covered in plastic cubes. (D): Stepped seawall on the reef flat. (E): Tested seawall shapes.
Figure 2.
Experimental setup. (A): Bed profile and instrumentation. (B) and (C): Reef flat and forereef covered in plastic cubes. (D): Stepped seawall on the reef flat. (E): Tested seawall shapes.

Figure 3.
Cross-shore profiles of SW in the no-seawall reference cases (black dashed line) and seawall cases at position (B) (colored solid lines). (A–D): SWL1/W1, SWL1/W5, SWL4/W1, and SWL4/W5 cases, respectively. The zero for the y-axis corresponds to the still water level for each case. The red dot indicates the seawall position, when present. Note that the breaking point in (A,B,D) is located at around cm, i.e., near the mid forereef slope, which is not represented here, see Figure 2 for complete bottom profile.

Figure 4.
SW transmission coefficient vs. reef flat water depth. Water depth, wave condition, seawall position, and seawall shape are depicted with the x-axis, rows, columns, and colored markers, respectively. Note the difference in y-axis scale.
Figure 4.
SW transmission coefficient vs. reef flat water depth. Water depth, wave condition, seawall position, and seawall shape are depicted with the x-axis, rows, columns, and colored markers, respectively. Note the difference in y-axis scale.

Figure 5.
Normalized SW transmission coefficient vs. reef flat water depth. Water depth, wave condition, seawall position, and seawall shape are depicted in x-axis, rows, columns, and colored markers, respectively. Note the difference in y-axis scale.
Figure 5.
Normalized SW transmission coefficient vs. reef flat water depth. Water depth, wave condition, seawall position, and seawall shape are depicted in x-axis, rows, columns, and colored markers, respectively. Note the difference in y-axis scale.

Figure 6.
Transmission coefficient vs. . The symbols denote the seawall type.


Table 1.
Hydrodynamic conditions for the test cases.
| Reef Flat Depth (cm) | Total Depth (cm) | |
|---|---|---|
| SWL1 | 3 | 21 |
| SWL2 | 4.5 | 22.5 |
| SWL3 | 6 | 24 |
| SWL4 | 7.5 | 25.5 |
| (cm) | (s) | |
| W1 | 1.98–2.5 | 0.8 |
| W2 | 3.2–4.28 | 1 |
| W3 | 4.43–5.77 | 1 |
| W4 | 4.74–6.37 | 1.2 |
| W5 | 7.22–8.66 | 1.4 |
Publisher’s Note: MDPI stays neutral with regard to jurisdictional claims in published maps and institutional affiliations. |
© 2022 by the authors. Licensee MDPI, Basel, Switzerland. This article is an open access article distributed under the terms and conditions of the Creative Commons Attribution (CC BY) license (https://creativecommons.org/licenses/by/4.0/).
Share and Cite
MDPI and ACS Style
Rossignol, G.; Sous, D. Coastal Defences on Low-Lying Reef Flats: A Laboratory Study of Seawall Shape and Position. J. Mar. Sci. Eng. 2022, 10, 1652. https://doi.org/10.3390/jmse10111652
AMA Style
Rossignol G, Sous D. Coastal Defences on Low-Lying Reef Flats: A Laboratory Study of Seawall Shape and Position. Journal of Marine Science and Engineering. 2022; 10(11):1652. https://doi.org/10.3390/jmse10111652
Chicago/Turabian StyleRossignol, Goélanne, and Damien Sous. 2022. "Coastal Defences on Low-Lying Reef Flats: A Laboratory Study of Seawall Shape and Position" Journal of Marine Science and Engineering 10, no. 11: 1652. https://doi.org/10.3390/jmse10111652
Note that from the first issue of 2016, this journal uses article numbers instead of page numbers. See further details here.