Article

Geometrical Influence on Material Properties for Ti6Al4V Parts in Powder Bed Fusion

1
Institute of Photonic Technologies (LPT), Friedrich-Alexander-Universität Erlangen-Nürnberg, Konrad-Zuse-Straße 3-5, 91052 Erlangen, Germany
2
Collaborative Research Center 814–Additive Manufacturing (CRC 814), Am Weichselgarten 10, 91058 Erlangen, Germany
3
Erlangen Graduate School in Advanced Optical Technologies (SAOT), Paul-Gordan-Str. 6, 91052 Erlangen, Germany
4
Institute of Applied Mechanics, Friedrich-Alexander-Universität Erlangen-Nürnberg, Egerlandstrasse 5, 91058 Erlangen, Germany
5
Chair of Materials Science and Engineering for Metals, Friedrich-Alexander-Universität Erlangen-Nürnberg, Martensstraße 5, 91058 Erlangen, Germany
6
Institute of Manufacturing Metrology, Friedrich-Alexander-Universität Erlangen-Nürnberg, Nägelsbachstr. 25, 91052 Erlangen, Germany
*
Author to whom correspondence should be addressed.
J. Manuf. Mater. Process. 2023, 7(3), 82; https://doi.org/10.3390/jmmp7030082
Submission received: 31 March 2023 / Revised: 21 April 2023 / Accepted: 22 April 2023 / Published: 25 April 2023
(This article belongs to the Special Issue Progress in Powder-Based Additive Manufacturing)

Abstract

:
One major advantage of additive manufacturing is the high freedom of design, which supports the fabrication of complex structures. However, geometrical features such as combined massive volumes and cellular structures in such parts can lead to an uneven heat distribution during processing, resulting in different material properties throughout the part. In this study, we demonstrate these effects, using a complex structure consisting of three conic shapes with narrow cylinders in between hindering heat flux. We manufacture the parts via powder bed fusion of Ti6Al4V by applying a laser beam (PBF-LB/M) as well as an electron beam (PBF-EB). We investigate the impact of the different thermal regimes on the part density, microstructure and mechanical properties aided by finite element simulations as well as by thermography and X-ray computed tomography measurements. Both simulations and thermography show an increase in inter-layer temperature with increasing part radius, subsequently leading to heat accumulation along the build direction. While the geometry and thermal history have a minor influence on the relative density of the parts, the microstructure is greatly affected by the thermal history in PBF-LB/M. The acicular martensitic structure in the narrow parts is decomposed into a mix of tempered lath-like martensite and an ultrafine α + β microstructure with increasing part radius. The EBM part exhibits a lamellar α + β microstructure for both the cylindric and conic structures. The different microstructures directly influence the hardness of the parts. For the PBF-LB part, the hardness ranges between 400 HV 0.5 in the narrow sections and a maximum hardness of 450 HV 0.5 in the broader sections, while the PBF-EB part exhibits hardness values between 280 and 380 HV 0.5 .

1. Introduction

Driven by the demand of manufacturers for customised components, additive manufacturing (AM) is a fast-developing manufacturing technology used to fabricate three-dimensional parts. It enables a more cost- and resource-efficient production of small-scale components and lightweight structures coupled with a high freedom of design [1,2,3]. Since customisation often goes hand in hand with a more complex-part geometry, AM appears to be a viable alternative. Powder bed fusion (PBF) is one of the most promising AM technologies for manufacturing metallic components [1]. A thin bed of metal powder is raked onto a build plate and is subsequently molten by an energy source. Afterwards, the build plate is lowered by a defined increment before fresh powder is applied again. This process is repeated layer by layer until the part is built [4,5,6].
Laser-based powder bed fusion of metals (PBF-LB/M) utilises a fibre laser energy source and is characterised by high scanning speeds as well as by high cooling rates. The build chamber is filled with shielding gas using purified argon or nitrogen to prevent oxidation and allows for efficient heat conduction as well as convective cooling of the build surface [4,7,8,9]. Although laser beam melting operates at ambient temperatures, most of the PBF-LB/M machines are capable of substrate preheating. The powder particles absorb the photons of the laser beam, and the powder layer is subsequently molten to form the desired geometry. In powder bed fusion of metals using an electron beam (PBF-EB), a beam of high-energy electrons is emitted from an electron gun and is subsequently accelerated by an electric field. A combination of electrostatic and electro-magnetic lenses focuses the electron beam on the powder bed. To prevent scattering of the electron beam due to collision with gas atoms, the system operates under vacuum. During the build process, the build plate is preheated to elevated temperatures of up to 750 °C to reduce the thermal gradient. A defocused electron beam first slightly sinters the powder at a high scan speed to provide sufficient electrical conductivity and to lower the moisture content. Afterwards, the powder layer is selectively molten by a focused electron beam [9,10,11,12]. Since the powder is heated via transfer of the kinetic energy from the incoming electrons into the powder particles, the latter gain an increasingly negative charge. This can cause two possible effects: First, the repulsive force of the neighbouring negatively charged particles can overcome the frictional and gravitational forces holding them in place, leading to a rapid expulsion of the powder particles from the powder bed. Another effect is the possible repulsion of the incoming electrons by the negatively charged powder particles, which results in a more diffused beam [13]. To avoid build up of too much of a negative charge in one location, the aforementioned sintering of the powder layer for a higher conductivity is of great importance. This marks one of several significant differences compared to the laser beam process. The electron beam is more penetrative and diffused in the powder, causing an increased melt pool size and larger heat-affected zone. This results in a higher minimum layer thickness compared to PBF-LB, which directly influences the minimal achievable feature size and surface roughness. On the other hand, the deflection of the electron beam with electro-magnetic lenses leads to far higher scan speeds achievable compared to the galvanometer-based scanning in laser beam melting. Another difference between both processes is the microstructure formed during melting and solidification. The cold or slightly preheated substrate plate used in laser beam melting results in a high heat extraction rate and high cooling speeds. The high preheating temperatures in electron beam melting on the other hand decrease the thermal gradient as well as provide a longer time for microstructure evolution [4].
Several investigations regarding powder bed fusion of metals focus on geometries such as cubic, cuboids or cylindric bodies [14]. However, parts manufactured for application purposes such as lightweight structures often exhibit more complex and irregular shapes. Nonuniform geometries can result in varying heat flow through the part, thus leading to different thermal properties affecting the microstructure and part quality. Therefore, understanding the correlation between thermal history and material properties are the bases of recent investigations [15,16,17,18,19]. Both Williams et al. [15] and Mohr et al. [16] studied the effects of varying inter-layer cooling times during PBF-LB. While shorter cooling times cause the surface temperature of the component to rise, longer cooling times had the opposite effect. Furthermore, the surface temperature directly affects the porosity and microstructure. Additionally, Mohr et al. showed an influence of the part geometry on heat flux leading to an in situ heat accumulation [16]. This effect was further proven by Munk et al. [17], who linked the effect of different part geometries on the microstructure to the tensile strength. For a prediction of part defects dependent on geometrical features, Paulson et al. [18] established machine-learning models that correlate thermal histories of single-track deposits to subsurface porosity formation. Similarly, Yavari et al. [19] introduced a graph theory approach to predict thermal history trends that lead to flaw formation. A correlation between part geometry and thermal history was found, thus influencing the occurrence of build failures, type and severity of porosity as well as morphology of the microstructure. Ogoke et al. [20] introduced a deep reinforcement learning framework to control the thermal history of the generated part by altering the scan velocity during melting. Hagen et al. [21] used a finite element model to calculate the temperature evolution during the processing of a complex structure, showing a connection between heat accumulation and hardness. At last, further investigations focused on the process optimisation of complex geometries using feedforward control of the thermal history [22,23,24]. These studies showed successfully that this approach enables the reduction of heat buildup and prevents subsequent flaw formation for different part geometries in PBF-LB/M.
One of the most investigated materials for PBF is the titanium alloy Ti6Al4V. It is used in a wide range of areas, such as aerospace, automotive or medicine, due to its excellent properties such as high specific strength, corrosion resistance or high bio-compatibility [25,26,27]. Ti6Al4V is typically composed of two primary stable phases α and β , where α -phase precipitates in the β matrix. However, for high cooling rates, Ti6Al4V transforms martensitically, leading to an arcicular α ’-martensitic phase [25,28]. There is extensive research with focus on the processing of Ti6Al4V in PBF using a laser beam [28,29,30,31] and an electron beam [7,12,32,33,34,35] as well as comparing both methods [7,9,14]. The high cooling rates in PBF-LB/M form a primarily martensitic microstructure, resulting in high strength and hardness but also low ductility for the as-built sample. Transforming martensite into an α + β microstructure can lead to higher ductility and reduced residual stresses [36]. Therefore, studies have investigated the effect of post-process heat treatments on the microstructure and mechanical properties of PBF-LB-fabricated parts [37,38,39,40,41]. Similarly, high-temperature preheating during the build process can result in an situ decomposition of the martensite into an α + β microstructure [42,43,44,45]. Several investigations have already provided a comprehensive description of the microstructure for PBF-EBM-fabricated Ti6Al4V parts [7,34,46]. The microstructure consists of a fine lamellar α structure existing in the columnar β phase due to high preheating temperatures during the process. According to Formanoir et al. [47], sub-transus heat treatments of as-built EBM parts only lead to moderate changes in the grain morphology, while supra-transus heat treatment showed transformation from columnar to equiaxed grains. Predicting the thermal history and subsequently the microstructure evolution of Ti6Al4V during PBF is an important research area. Therefore, Yang et al. [48,49,50] presented a process-structure model predicting the solidification morphologies based on the thermal properties during processing and key manufacturing parameters in PBF-LB. The in situ dissolution of α ’ to α and β using the heat accumulated during the thermal cycle was shown. Furthermore, anisotropy of the microstructure due to different thermal conditions can lead to varying mechanical properties in the as-built part.
Therefore, the aim of this study is to investigate the geometrical influence on the material properties for Ti6Al4V parts in powder bed fusion. A complex structure consisting of three conic shapes with narrow cylinders in between hindering heat flux is developed. The parts are manufactured via powder bed fusion by applying a laser beam as well as an electron beam. For the PBF-LB/M part, the thermal history during the build process is recorded via thermography. First, the thermography measurements are compared to finite element simulations, and the effect of the geometry on the thermal history is discussed. Second, the porosity is determined with X-ray computed tomography and is compared to the relative density based on micrographs. For the PBF-LB part, the effect of the thermal history on microstructure evolution is shown quantitatively via simulation and qualitatively via metallographic examination before being subsequently compared to the PBF-EB part. Finally, hardness profiles for both parts are determined and linked to the microstructure.

2. Materials and Methods

2.1. Machines and Materials

The experiments were performed on a PBF-LB/M machine SLM 280HL (SLM Solution Group AG, Luebeck, Germany) and an PBF-EB machine ATHENE (Additive Technology Housing Equipped with New Electron gun). The SLM 280HL machine was equipped with a single mode fibre laser which provides a maximum laser power (P L ) of up to 400 W and a wavelength of λ = 1070 nm. For the conducted experiments, a minimal spot diameter d L of 78 µm on the substrate plate and argon as shielding gas with oxygen values below 0.01 ppm were used. In order to keep the powder consumption low, a customized building envelope reduction was implemented. As a substrate material, 5 mm thick plates made of Ti6Al4V with a diameter of 90 mm were used. During the build job, preheating was turned off, and no support structures were built. The thermal radiation emitted during the PBF-LB/M was monitored with an infrared (IR) camera VarioCAM HD head 600 (Infratec, Dresden, Germany). The camera was mounted on top of the build chamber of the SLM 280HL with an angle of observation of approximately 30° between the detector plane and the substrate plane. The camera used an uncooled microbolometer focal plane array and was sensitive in a spectral range from 7.5 to 14 µm with a calibrated temperature range between −40 and 2000 °C. The spatial resolution was 640 × 480 pixels, and subsequently, the mean surface temperature after full exposure by the laser beam was determined. To shield the detector of the camera from damage, a germanium window was placed in front of the camera. Due to the temperature dependency of the emissivity as well as the surface roughness and temperature of the processing gas, the measured temperatures are not considered as absolute values. However, the influence of part geometry on the thermal regime during the PBF-LB/M process and resulting characteristics can be identified.
The PBF-EB machine ATHENE is an in-house developed system consisting of an Arcam EBM S12 vacuum chamber and an electron beam welding gun by pro-beam AG & Co. KGaA (Planegg, Germany). The gun operates with 60 kV acceleration voltage, and the tungsten filament delivers a maximum power output of 6 kW. A more detailed description of the machine can be found elsewhere [10]. The experiments were conducted with an electron beam spot diameter of 400 µm on the rectangular base plate with dimensions of 250 × 250 mm 2 , and a controlled vacuum of 1.5 × 10 10 mbar of He atmosphere was applied. Furthermore, preheating was set to a target temperature of 750 °C, preventing temperature measurements during the build job.
The material used in this study was Ti6Al4V. For the PBF-LB/M experiments, the powder was obtained from TLS Technik GmbH & Co. Spezialpulver KG (Bitterfeld-Wolfen, Germany) and had a particle size distribution of 20 and 63 µm. The particle morphology of the inert-gas-atomised powder was predominantly spherical. For the PBF-EB experiments, plasma-atomised Ti6Al4V powder supplied by Tekna Plasma Europe (Macon, France) with a particle size distribution of 45 and 105 µm was used.

2.2. Process Parameters

A complex structure consisting of three conic shapes with narrow cylinders in between was built in PBF-LB/M as shown in Figure 1. The cylinders had a diameter of 6 mm while the cones had a maximum diameter of 44 mm. In the experiment conducted with PBF-EB, one third of the structure was built consisting of one cylinder and cone. The parameter sets used for manufacturing the parts are listed in Table 1. The parameters were experimentally developed and enabled the production of parts with relative densities above 99.9% for the PBF-LB/M part. To build without support structures, the overhanging region of the PBF-LB part was produced with a lower energy density than the core region. For the EBM part, 10 mm tall point support structures for the cylinder base were built.

2.3. Characterisation

For characterisation of the relative density, microstructure and hardness, the structures were cut in the middle along the build direction. The cross-sections were grinded (P220–P4000) and polished with 3 µm diamond suspension, followed by a finish consisting of an active oxide polishing suspension (OPS) and hydrogen peroxide. After each step, the specimens were cleaned in an ultrasonic bath. The relative density of the parts was determined by analysis of the polished cross-sections using an optical microscope Olympus BX53M from Zeiss (Oberkochen, Germany). The relative part density was determined based on the binarisation method. An automatic threshold was set to distinguish pores or other defects (dark) from the solidified material (bright). The corresponding pixel ratio was chosen as relative part density. To reveal the microstructure, the samples were etched with H 2 O (189 mL), 3% HNO 3 (8 mL), 4% HF (3 mL) for 10 s and investigated by optical microscope Leica DM 6000 from Leica Microsystems (Wetzlar, Germany). Mircohardness measurements HV 0.5 were conducted on the surface of the polished cross-sections of the specimen with a hardness testing machine KB30S (Hegewald & Peschke, Nossen, Germany). The indentations had a distance of 0.5 mm to each other and were placed in the middle of the specimen along the z-axis.

2.4. X-ray Computed Tomography Set Up

For the evaluation of the component density, the polished specimens were analysed with X-ray computed tomography (CT) using a Metrotom 1500 from Zeiss (Oberkochen, Germany). For the source, a voltage of 210 kV, a current of 100 µA, and a filter material of 0.5 mm copper were used, resulting in a focal spot size of Br: 21 µm. The manipulator was rotated about 360° with a step size of 0.2°, corresponding to 1800 projection images in total. Further parameterisation for the detector was gain: 16×, integration time: 2000 ms, frame to average: off, binning: 1 × 1. Because of the limited field of view, the measurement was split into two tasks, and the volume was grouped together by stitching to increase the magnification. The parameter results in a native voxel size were vx: 26 µm. The images were saved as unit16 format and were reconstructed to a gray value volume data set using a Feldkamp–Davis–Kress algorithm (FDK) with a Shepp–Logan filter. Tese CT parameters are specific to the used system and can differ by use on other CT devices. The metrological measurements were performed with the software VGStudio.Max Version 2022.2 from VolumeGraphics (Heidelberg, Germany), and a surface determination was calculated in advanced (classic) mode (iterative calculation option enabled) with user input of the mean value of the material and background gray value, which were determined with ROIs to increase the separation between the material and the surrounding polymer. With the determined surface, a porosity analysis “Only-Threshold” was executed to inspect defects within the volume data. The gray value threshold was set to −1 standard deviation related to the mean value of the material peak of the gray value histogram. To highlight the results of the porosity analysis, a Hotspot porosity analysis was applied with a threshold of 1% and an area size of 10 vx. For another perspective on porosity, direction variability can be calculated along a normal vector. This method sums up the porosity within a cross-section perpendicular to the defined vector with a resolution of 1 along the building direction (xy-plane) or the micrograph direction (yz-plane).

2.5. Simulation Set Up

For a deeper process understanding, we conducted macroscopic thermal finite element simulations of the PBF-LB/M process [51]. Thereby, we distinguished between the homogeneous powder, solid and melt phases. The resulting temperature field ϑ was further used to determine the microstructure based on the phenomonological local model by [52].
The strong form of the nonlinear heat Equation (1) in the computational domain B is solved for the temperature field ϑ .
h ˙ ϑ ρ = Div q + r
q = λ ( ϑ ) ϑ
ϑ = ϑ ¯ on B ϑ
q · n = q ¯ on B q
The temperature-dependent specific enthalpy, the density, and the outwards pointing surface normal are denoted by h, ρ and n , respectively. Heat conduction follows Fourier’s law (2) with the temperature-dependent heat conductivity λ . The boundary of B can be subdivided into the disjunct Dirichlet B ϑ and Neumann B q parts, where either the temperature (3) or the heat flux (4) are prescribed. The latter can be further decomposed into parts associated with convection and radiation
q ¯ = H ϑ conv ϑ + σ SB ϵ ϑ rad 4 ϑ 4 ,
with the convection coefficient H , the Stefan Boltzmann constant σ SB and the emissivity ϵ . The reference temperatures for convection and radiation are denoted by ϑ conv and ϑ rad . The total energy of the beam applied during the exposure of a single layer can be obtained via
U = ξ P L Δ t e ,
with ξ = 0.5 , P L and Δ t e denoting the absorptivity, the laser beam power and the experimental exposure time, respectively. Following the heat input model by [53], this energy is uniformly applied over the entire cross-section within a shorter period Δ t s as compared to Δ t e . In addition, the layer thickness in the simulation is artificially scaled compared to its experimental counterpart by the lumping factor n l , which is limited to integer values. The heat source during the simulative exposure time Δ t s in the artificially enlarged meta-layer is
r = U n l Δ t s V l ,
with the volume of the meta-layer V l .
The temporal discretisation of the nonlinear heat Equation (1) is conducted using a two-stage Runge–Kutta (SDIRK) scheme. The spatial discretisation follows the finite element method (FEM). Temporal and spatial adaptivity is used to limit the computational effort. For further details, including the used material parameters of Ti6Al4V, the reader is referred to [51].
Based on the simulated temperature field ϑ , the microstructure is evaluated [52]. The underlying model distinguishes within the solid phase between the beta phase and martensite phase, while all remaining phase fractions are summarised in the stable alpha phase, including grain boundary alpha and Widmanstätten alpha:
X sol ϑ = X α s + X α m + X β .
The evolution of the volume-averaged fractions X is purely based on the temperature history. According to the time scales on which the solid state phase transformations take place, they are divided into instantaneous and diffusion-based. The former are modelled via Karush–Kuhn–Tucker conditions, the latter via modified logistic differential equations. For temperatures below the solidification temperature, the unity condition reads
X ˙ α s + X ˙ α m + X ˙ β = 0 .
Taking the underlying microstructural transformations into account, the phase changes can be further partitioned into
X ˙ α s = X ˙ β α s + X ˙ α m α s X ˙ α s β , X ˙ α m = X ˙ β α m X ˙ α m α s X ˙ α m β , X ˙ β = X ˙ α s β + X ˙ α m β X ˙ β α s X ˙ β α m .
The derivation of the individual evolution terms of (10) is presented in detail in [52] and is shortly summarised in Appendix A. The temporal integration of the rates is conducted with the explicit four-stage Runge–Kutta (RK4) scheme.
The presented set up was used to simulate the build of one of the conic shapes, including the narrow cylinders on bottom and top for the SLM process. All material properties for Ti6Al4V used in the numerical simulation were taken from [51,52]. A lumping factor of n l = 2 was used to speed up the computations. The scan path from the experiment excluding the overhang was used to mark cells within a radius of 100 μm for heat source application. Convection and radiation were considered on the top of the powder bed. The heat source model following Equation (7) might lead to an overprediction of maximum temperatures in the simulation due to the reduced exposure time compared to the experiment, while keeping the total energy consistent. Therefore, the cooling phase was extended by the exposure and waiting time difference to match the experiment.

3. Results and Discussion

In the following section, the effect of the geometry is critically evaluated. Firstly, the temperature is investigated via the conducted simulations and measurements. Further, the part quality including the resulting density is analysed. The predicted microstructure based on the simulated temperature history is compared to the experiment. Finally, the effect on hardness is evaluated.

3.1. Effect of Geometry on Thermal History

Figure 2 shows the measured inter-layer temperature of the surface compared to the respective build height and radius for the PBF-LB/M part. In the first narrow cylinder, the inter-layer temperature is almost constant with a slight increase. As the exposed cross-section is enhanced, the inter-layer temperature increases, reaching a first peak at the biggest diameter and decreasing again as the cross-section diminishes again. The trend repeats itself for the next two sections. Additionally, the peak inter-layer temperature rises for each cylindric and conic section with increasing build height. The temperature variation can also be observed on the basis of the tempering colour shown in Figure 1c.
The course of the inter-layer temperature over the build height can be explained by the solid cross-section underneath the processed layer. A larger solid cross-section accelerates the heat conduction in a negative building direction compared to the powder material. For the first layers, the influence of the building plate leads to fast conduction of heat in the z direction. Further, as the exposed cross-section is enhanced, the inter-layer temperature rises due to the increase in the cross-section. As the cross-section decreases again, the opposite effect can be observed.
The inter-layer temperatures ϑ inter obtained via measurements and from the simulations for the first 650 layers are depicted in Figure 3.
The simulated inter-layer temperatures match the experimental values and their trend quiet well. Especially, the decrease towards the second narrow cylinder is captured accurately. Slight differences can be observed in the initial rise of the inter-layer temperature. This can be explained by the neglected overhang exposure in the simulation. The lack of energy leads to a delayed increase in inter-layer temperature for the simulation.

3.2. Effect of Geometry on Part Quality

To determine the effect of the geometry and thermal history on the material properties, the parts were first analysed regarding their density and defects. Therefore, Figure 4 shows a gray value volume image created with X-ray computed tomography (a) as well as general (b) and detailed (c) optical micrographs of the PBF-LB/M part. The Y-scale in (a) is composed of the mean gray values. The minimum gray value is determined from the sum of 25 dark images and the maximum gray value from 100 light images. Afterwards, a 16 bit scaling is performed between both values. The colour scale in the gray value analysis is scaled solely on the available gray values. If no gray value with the value 0 is available, 0 is not used as the start of the color scale, but the scale is oriented to the lightest and the darkest gray value in the volume. For the detailed micrographs, areas from both the narrow and broadest regions were selected. It is evident that in the center core region, a sound part with only minimal gas porosity could be fabricated. With increasing part radius, the gas porosity in the outer core areas slightly increases. Lack of fusion porosity (red arrows) can be identified in the interconnection zone between the core and overhang regions. These result form an insufficient layer connection caused by a slight offset between the core structure and the overhanging contour. The gray value image shows a maximal mean gray value for the narrow structures. As the part radius increases, the gray value drops, mirroring the trend of the thermal history. Since a higher gray value indicates a greater attenuation of the X-rays by the material, a higher density for these areas can be concluded.
Figure 5 compares the polished cross-sections of the PBF-EB part to the first third of the LB part. The slight differences in geometry are attributed to the fact that no separate overhanging area was built for the EB part. PBF-EB was also able to produce a dense part. Compared to the LB part, a slightly higher degree of porosity can be observed as well as some larger gas pores in the bulk of the part (marked by red arrows). The higher number of gas pores in the EB part could be explained by a higher porosity of the powder used for the PBF-EB part. Cunningham et al. showed a correlation between the size distribution of gas pores in the PBF-EB parts and in the plasma-atomised powder used to make these parts [54]. Furthermore, the relative part density based on detailed optical micrographs for the selected areas along the build direction was determined. While the PBF-LB part shows only a slight decrease in density with increasing build height, a larger influence of the geometry on the density can be observed for the EBM part. Similar to the LB part, the highest density is achieved in the narrow cylindric region. The transition zone between THE cylinder and peak radius exhibits the lowest density before it rises again for the maximum part radius.
At last, Figure 6 shows the porosity determined via X-ray computed tomography along the build height for the whole PBF-LB part and a comparison between LB and EB. For the LB part, the porosity matches the trend depicted from the micrographs. There is almost zero porosity in the cylindric sections, and the density decreases at the broadest sections. However, some of the porosity has to be attributed to the layer misconnections since the whole area is analysed in the xy plane while the image analysis was limited to the core regions. The trend in porosity for the EB part is also similar to the optical micrographs, but the highest porosity is reached at the maximum radius. The higher porosity in the broader areas for both parts can be explained with the thermal history shown in Figure 3. The higher temperature leads to an overheating effect, which results in a higher surface roughness, consequently leading to higher local porosity. As shown by Rausch et al. [55], an increase in layer surface roughness triggers the formation of defects for subsequent layers. This is due to balling and wetting effects as well as fluctuations in the effective layer thickness. Similarly, Chu et al. [56] observed the formation of internal defects for rougher surfaces since they lead to a more uneven recoating. This can affect the local heat absorption and therefore the melt pool size as well as the spatter characteristics. Furthermore, the overheating effect could support the formation of keyhole pores in PBF-LB [57,58,59].

3.3. Effect of Geometry on Microstructure

As mentioned in Section 2.5, the maximum temperatures might not be captured accurately in the simulation due to the current heat source model. However, in the temperature range relevant for the microstructure model, the deviations are marginal. In Figure 7a,b, the temperature history over time and the phase fraction evolution at the evaluation point A (see Figure 7c,d for its location) are depicted.
The temperature history shows sharp increases due to the flashed heat input with decreasing amplitude as the part grows in the building direction. The melting temperature of 1674 °C is exceeded in the current and following layers. Due to the large temperature changes in that period, the evolving microstructure is dominated by the martensitic phase with values around X α m = 0.77 . As the build proceeds, the inter-layer temperature rises, as shown in Figure 3 for the top of the powder bed, and the temperature level at point A slightly rises as well. This leads to a decrease in the martensitic phase and an increase in the stable alpha phase until the end of the simulation. Figure 7c,d show the final distribution of the martensitic and stable alpha phase fractions. Especially, the narrow cylinder part the martensitic phase dominates with values close to X α m = 0.9 . Along the rotation axis in the building direction, the martensitic phase fraction decreases as the cross-section increases. As the cross-section decreases again, the martensitic phase fraction increases. An opposite trend can be observed for the stable alpha phase. The largest stable alpha phase fraction along the rotation axis is found below the widest cross-section with a value of X α s = 0.53 . The remaining phase fractions of martensite and beta after cooling to room temperature are X α m = 0.37 and X β = 0.10 , respectively.
Figure 8 shows optical micrographs of the microstructure for the first third of the PBF-LB part as well as its thermal history. While the grains appear to be columnar, the overview micrograph depicts a noticeable evolution of the microstructure changing from bright to dark. This is further proven by the detailed images. The narrow cylinder shows the acicular martensitic α ’ structure with thin needles extending through the prior columnar β grains. The martensitic microstructure is predominantly formed in the PBF-LB of Ti6Al4V, resulting from the high cooling rates and matching previous investigations [28,29].
As the part radius and the surface temperature simultaneously increase, the acicular α ’-martensitic phase is decomposed into a mix of lath-like martensitic phase and α + β structure with additional primary α observed. While the α + β phase is significantly finer than its martensitic counterpart, the grain size appears to be the same. The change in microstructure along the build direction matches the simulation (Figure 7) and can be directly linked to the thermal history of the part, as already seen in Figure 3. The increasing inter-layer temperature leads to an in situ tempering effect. The martensitic lath size increases due to the higher temperatures and fine α phase precipitates in the retained β grains. Although the peak temperatures are below the martensite decomposition range of 600–650 °C [42], Xu et al. [44] reported martensite decomposition starting at annealing temperatures as low as 400 °C. Similarly, Ali et al. [42] achieved α + β -microstructure formation at temperatures around 570 °C. Taking the simulated microstructure into account, the formation of the α phase in the conic parts is reasonable.
For further analysis of microstructure evolution, Figure 9 shows a comparison of the bottom and top conic sections. Similar to Figure 8, coarse acicular α ’-martensite embedded between a fine α + β phase can be observed. For the top area, an increasing amount of α + β phase as well as a diminishing amount of martensitic phase can be seen. This could be attributed to the higher surface temperature in the upper regions of the part leading on one hand to increased grain growth. On the other hand, the higher surface temperature further supports additional decomposition of the martensite into fine α + β phase. Contrary to the microstructure of the conic sections, the acicular martensitic phase in the narrow cylinder remains unaffected along the build height. This further confirms the thermal history throughout the part.
In Figure 10, the microstructures of the PBF-LB and EB parts are compared. As already discussed for the PBF-LB part in Figure 8, the needle-like martensite structure decomposes with increasing build height and part radius. The EB part exhibits a clear columnar α + β structure for both the cylindric and conic sections with grain boundary α , whereby the microstructure coarsens with increasing build height. Additionally, equiaxial primary α embedded in the β phase can be observed in the broad areas. The α + β microstructure of the EBM part results from the high preheating temperatures during the build job and matches previous investigations [7,34]. Another notable difference between the EBM and LB part is the difference in feature size. While having a similar columnar grain size, the α + β in the narrow section of the EBM part appears finer in comparison to the martensitic needles. For the conic section, this characteristic is switched, and the microstructure of the LB part is significantly finer.

3.4. Effect of Geometry on Hardness

At last, the influence of the part geometry on the hardness is analysed. Figure 11 shows the hardness values for the PBF-LB part along the build height and part radius. The hardness measurements were conducted at the centre of the part along the the build direction. The hardness matches the thermal history shown in Figure 2. For the first narrow cylinder, the hardness first slightly increases before dropping again. As the cross-section is enhanced, the hardness increases, reaching a first peak at the biggest radius and decreasing as the cross-section diminishes again. This trend repeats itself for the next two cylindric and conic sections, with two notable characteristics. First, the peak hardness in the second and third conic shapes along the build direction increases in comparison with the first conic structure. Second, the hardness drops sharply to a global bottom as the radius diminishes completely at the maximum build height. The differences in hardness between the cylindric and conic shapes correlate with the change in the microstructure, which was already discussed. The hardness values for the martensitic phase in the cylindric part match the investigations regarding the as-built Ti6Al4V parts [29,30]. The increase in hardness for the decomposed microstructure in the conic structures is surprising since one would expect higher hardness values from a uniform martensitic structure. In addition, studies have observed lower hardness values for α + β microstructure post heat treatment compared to as-built martensitic structures [38,39]. Nevertheless, Ali et al. [42] reported increasing hardness values for increased powder bed temperatures, thus leading to an in situ heat treatment. The increase in hardness was attributed to the amount of β between α / α ’ laths and additional nano β growth inside the α laths. In recent publications, Kaoushik et al. [60] achieved an increase in micro-hardness for heat-treated PBF-LB parts compared to the as-built state. A sub-transus heat treatment was conducted, leading to a decomposition of martensite to α + β and primary α . The increase in hardness was explained due to the partitioning effect of alloying elements during heat treatment and resulting in the formation of plate-like Ti 3 Al precipitates. Such precipitations could also have been formed in the conic regions due to the elevated part temperatures. Another explanation for the increase in hardness could be the finer microstructure in the broader areas. The higher number of laths act as barriers for the dislocations, leading to a hardening effect. This effect was also proposed by Wu et al. [40], who reported an increase in hardness for post heat treatment temperatures between 100 and 500 °C, matching the inter-layer temperatures of the conic section.
Figure 12 compares the hardness values of the first third of the PBF-LB part with the EB part. The LB part has a constant higher hardness than the EB part. The geometry also influences the hardness of the EB part. For larger cross-sections, the hardness increases similarly to the LB part but does not drop steadily at the end, instead rising again. Another notable abnormality is the higher derivations, especially in the conic region for the EB part. The lower hardness for the EB part can be explained with the mainly α + β microstructure, which matches values from previous studies for Ti6Al4V parts fabricated via EB [33,61].

4. Conclusions

This study shows the influence of part geometry on the thermal history and material properties for Ti6Al4V in PBF. A complex structure consisting of three conic shapes with narrow cylinders in between hindering heat flux was manufactured in PBF-LB. Additionally, one third of the structure was fabricated in PBF-EB. In addition to metallographic analysis, finite element simulations as well as thermography and X-ray computed tomography measurements were performed. The main findings of this work are:
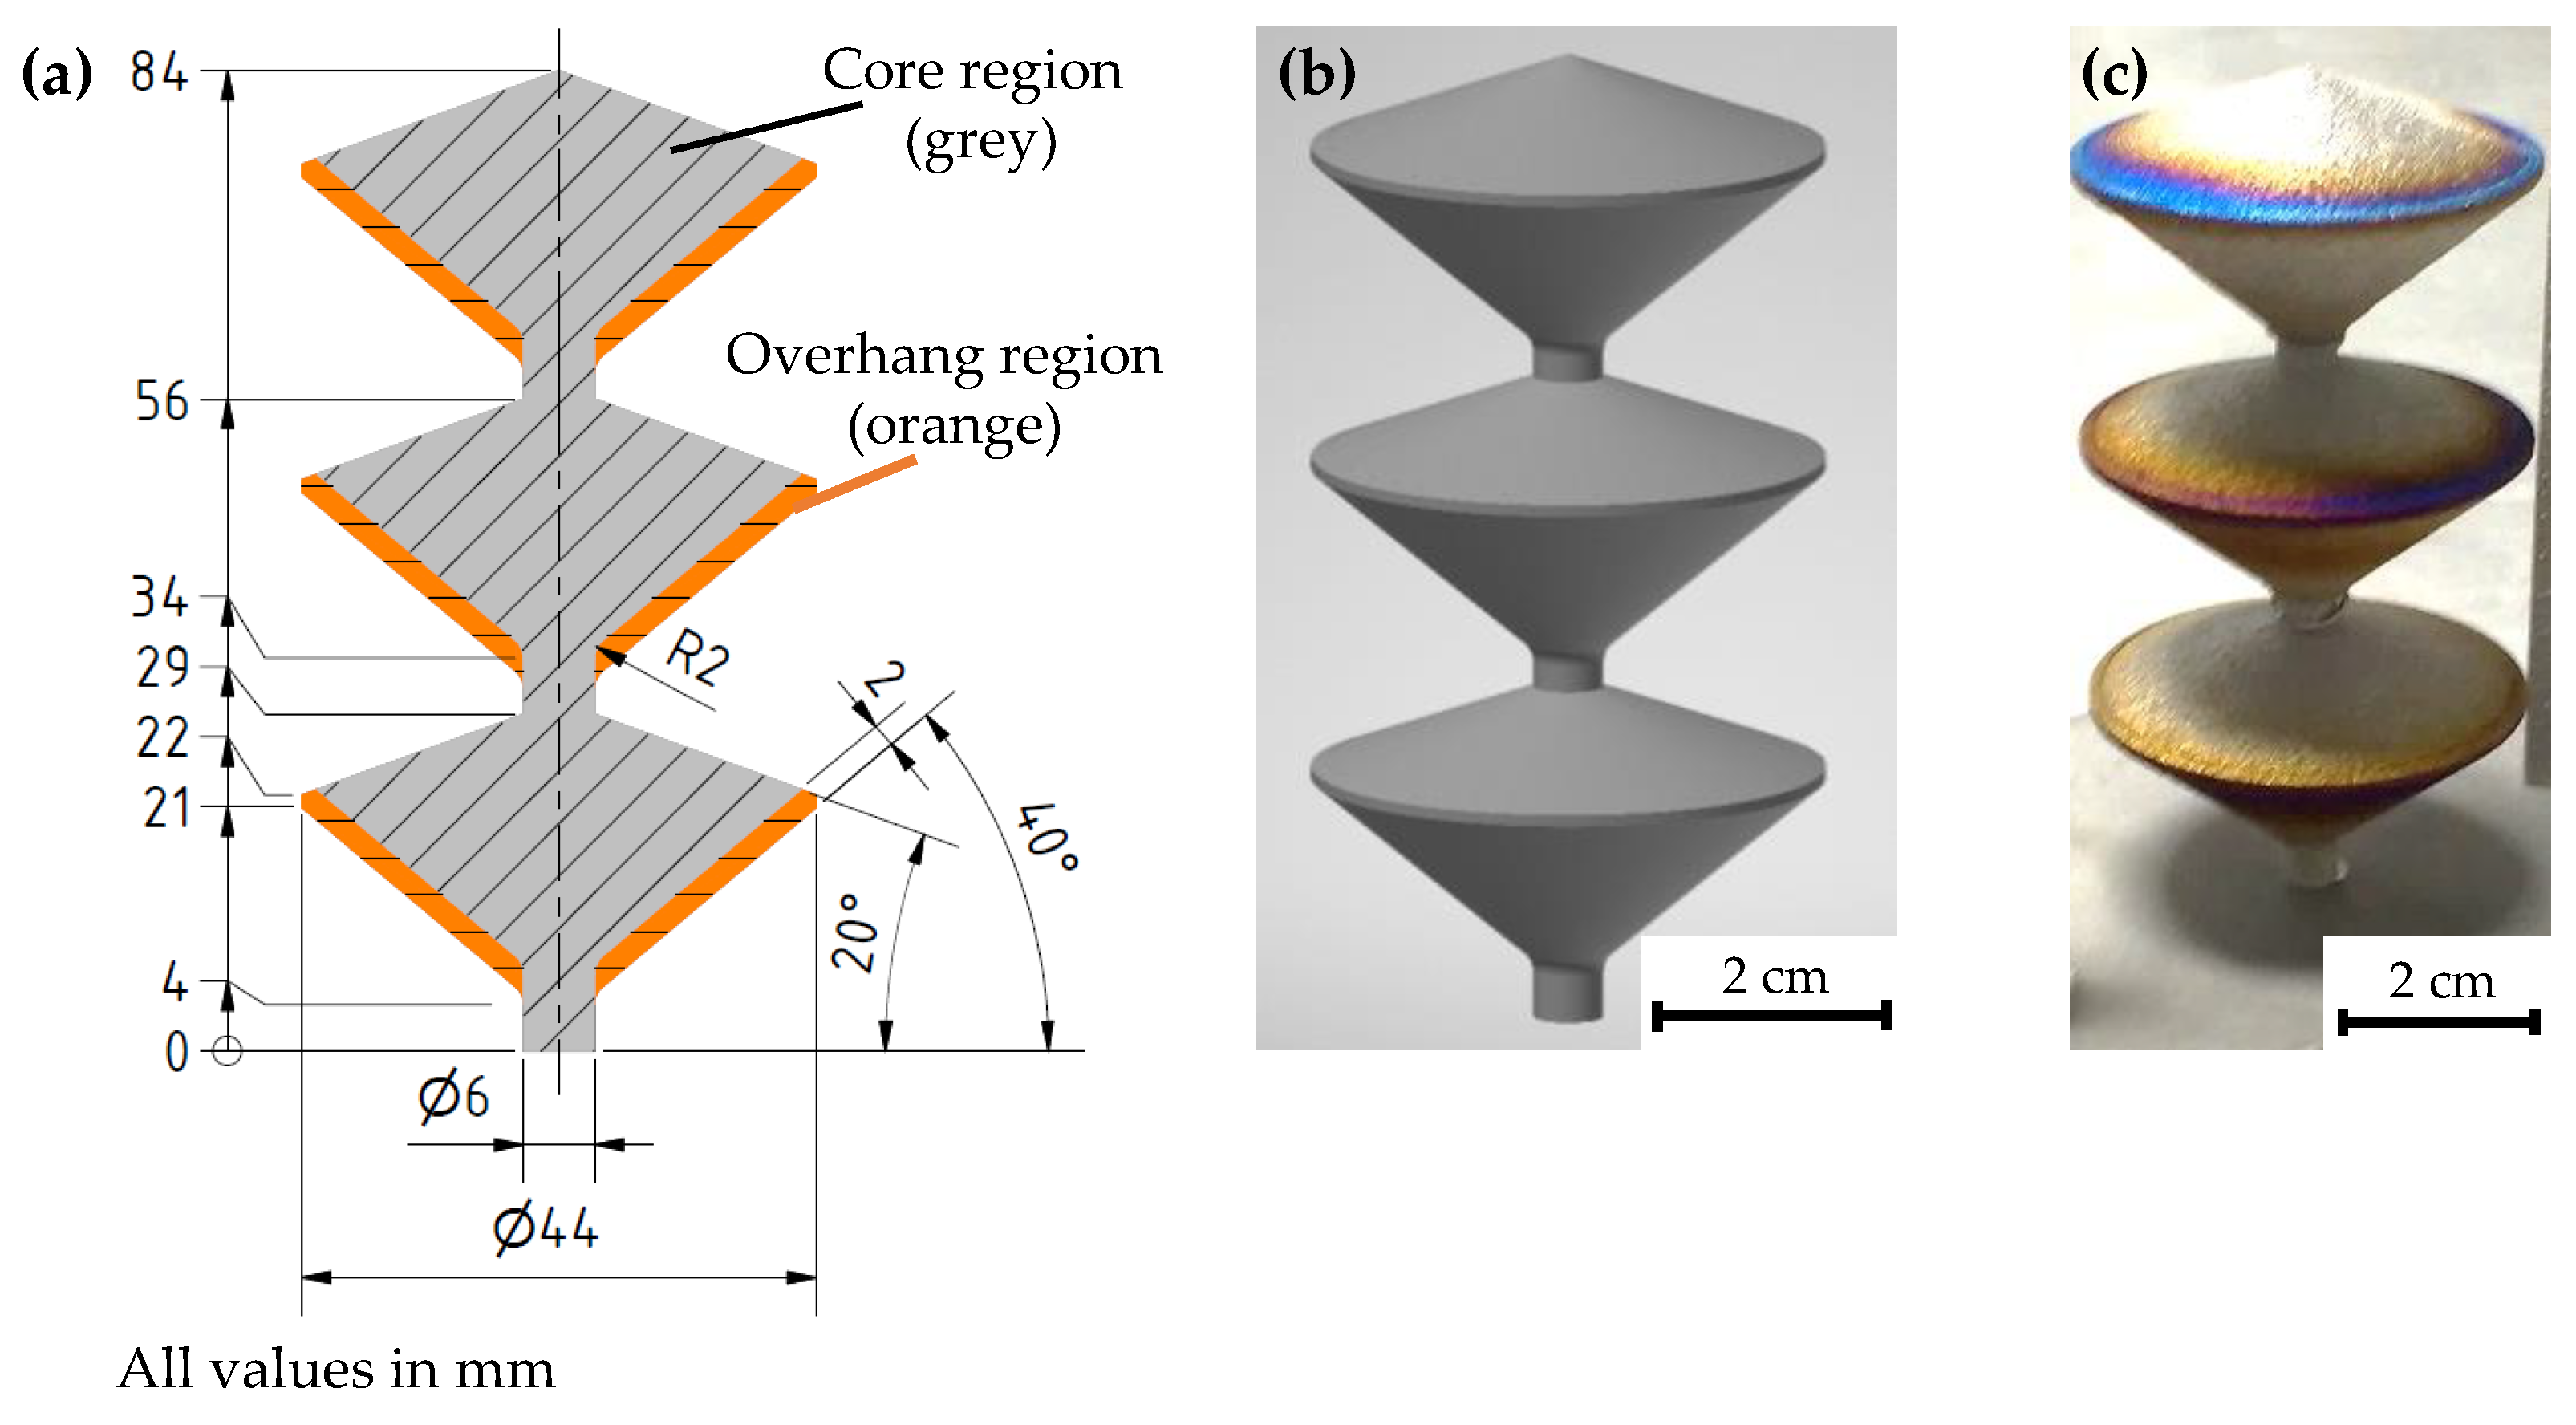
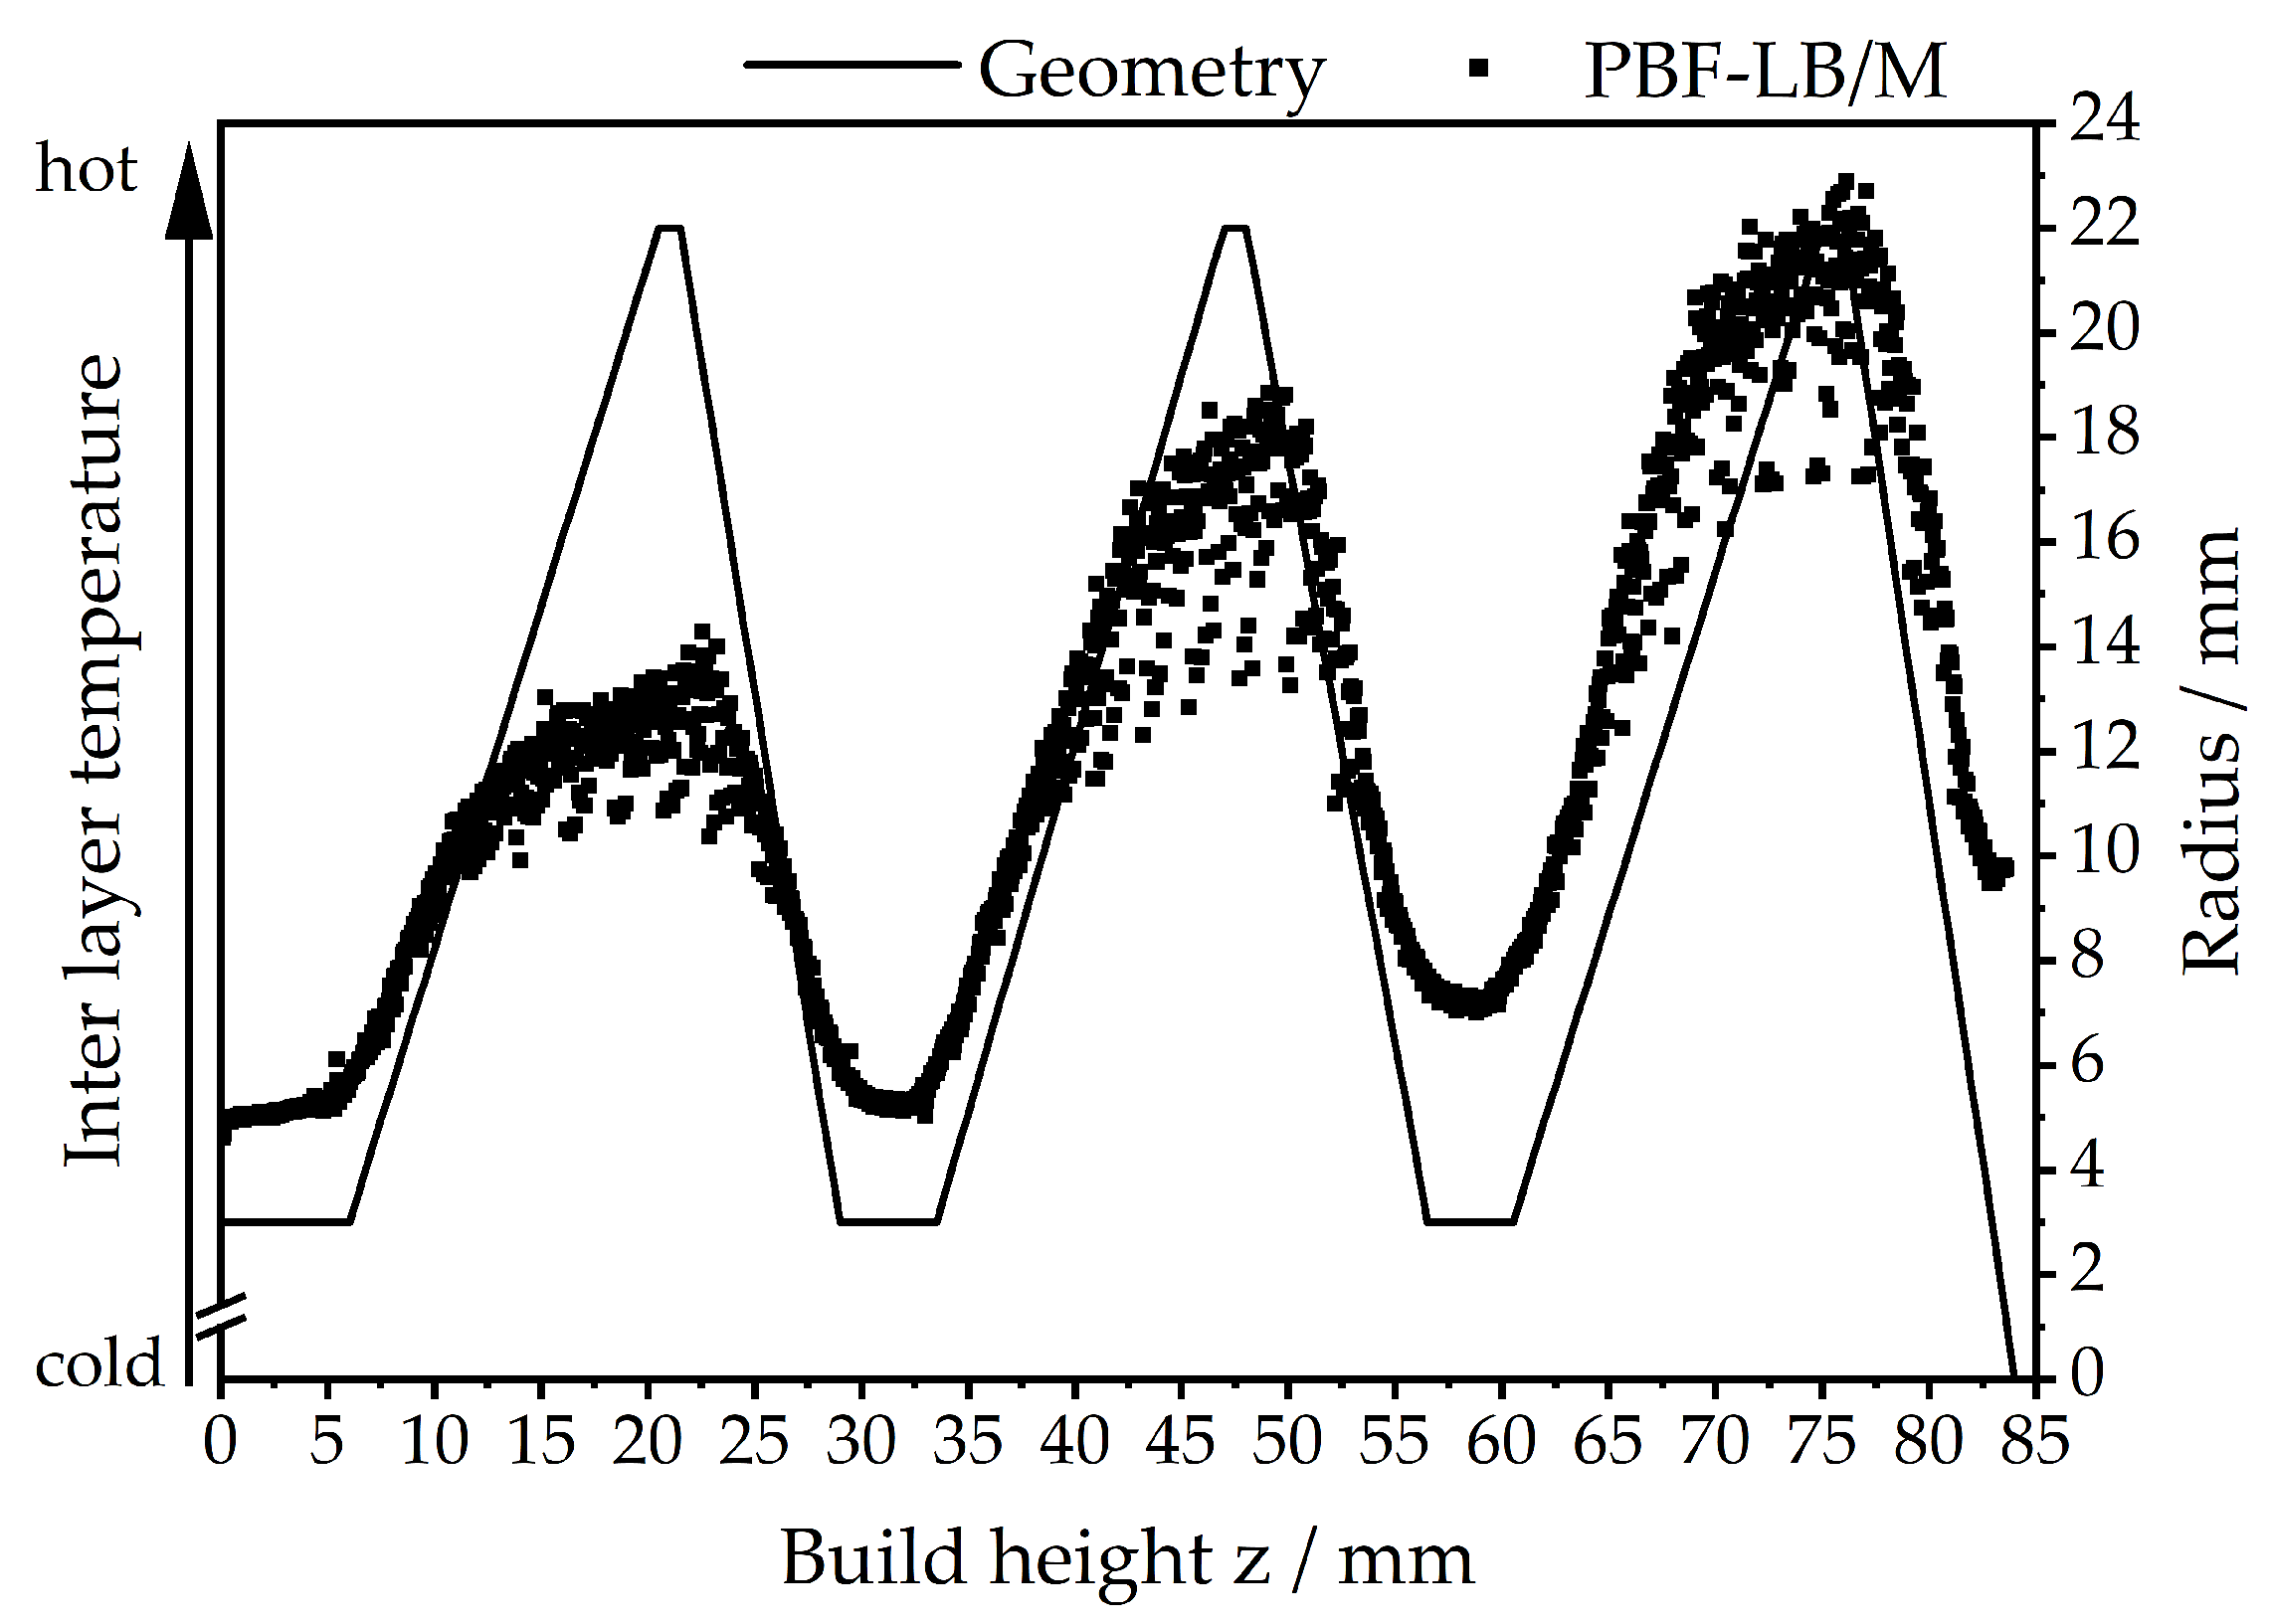
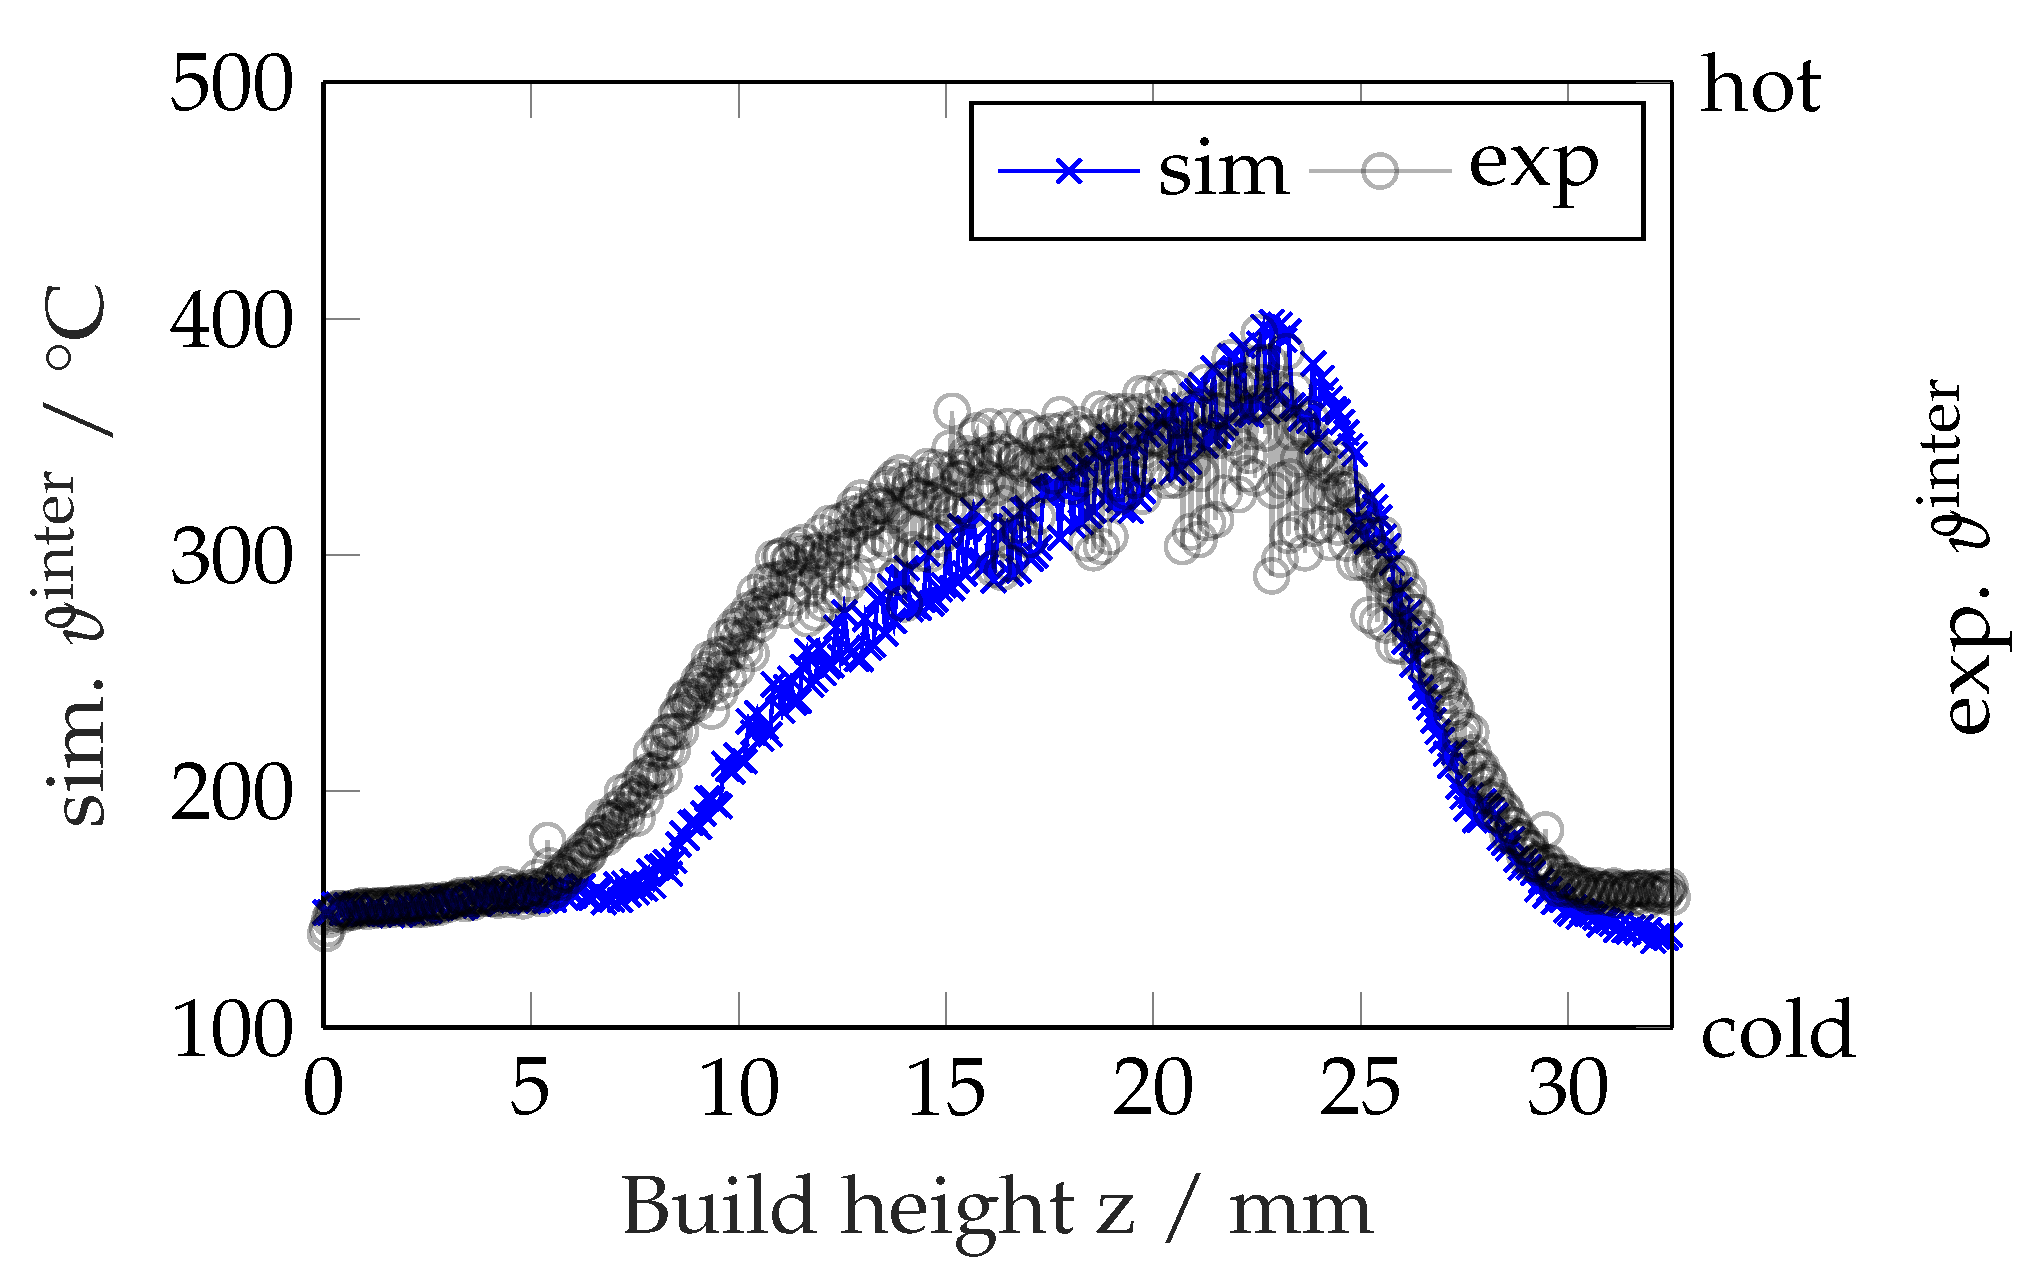
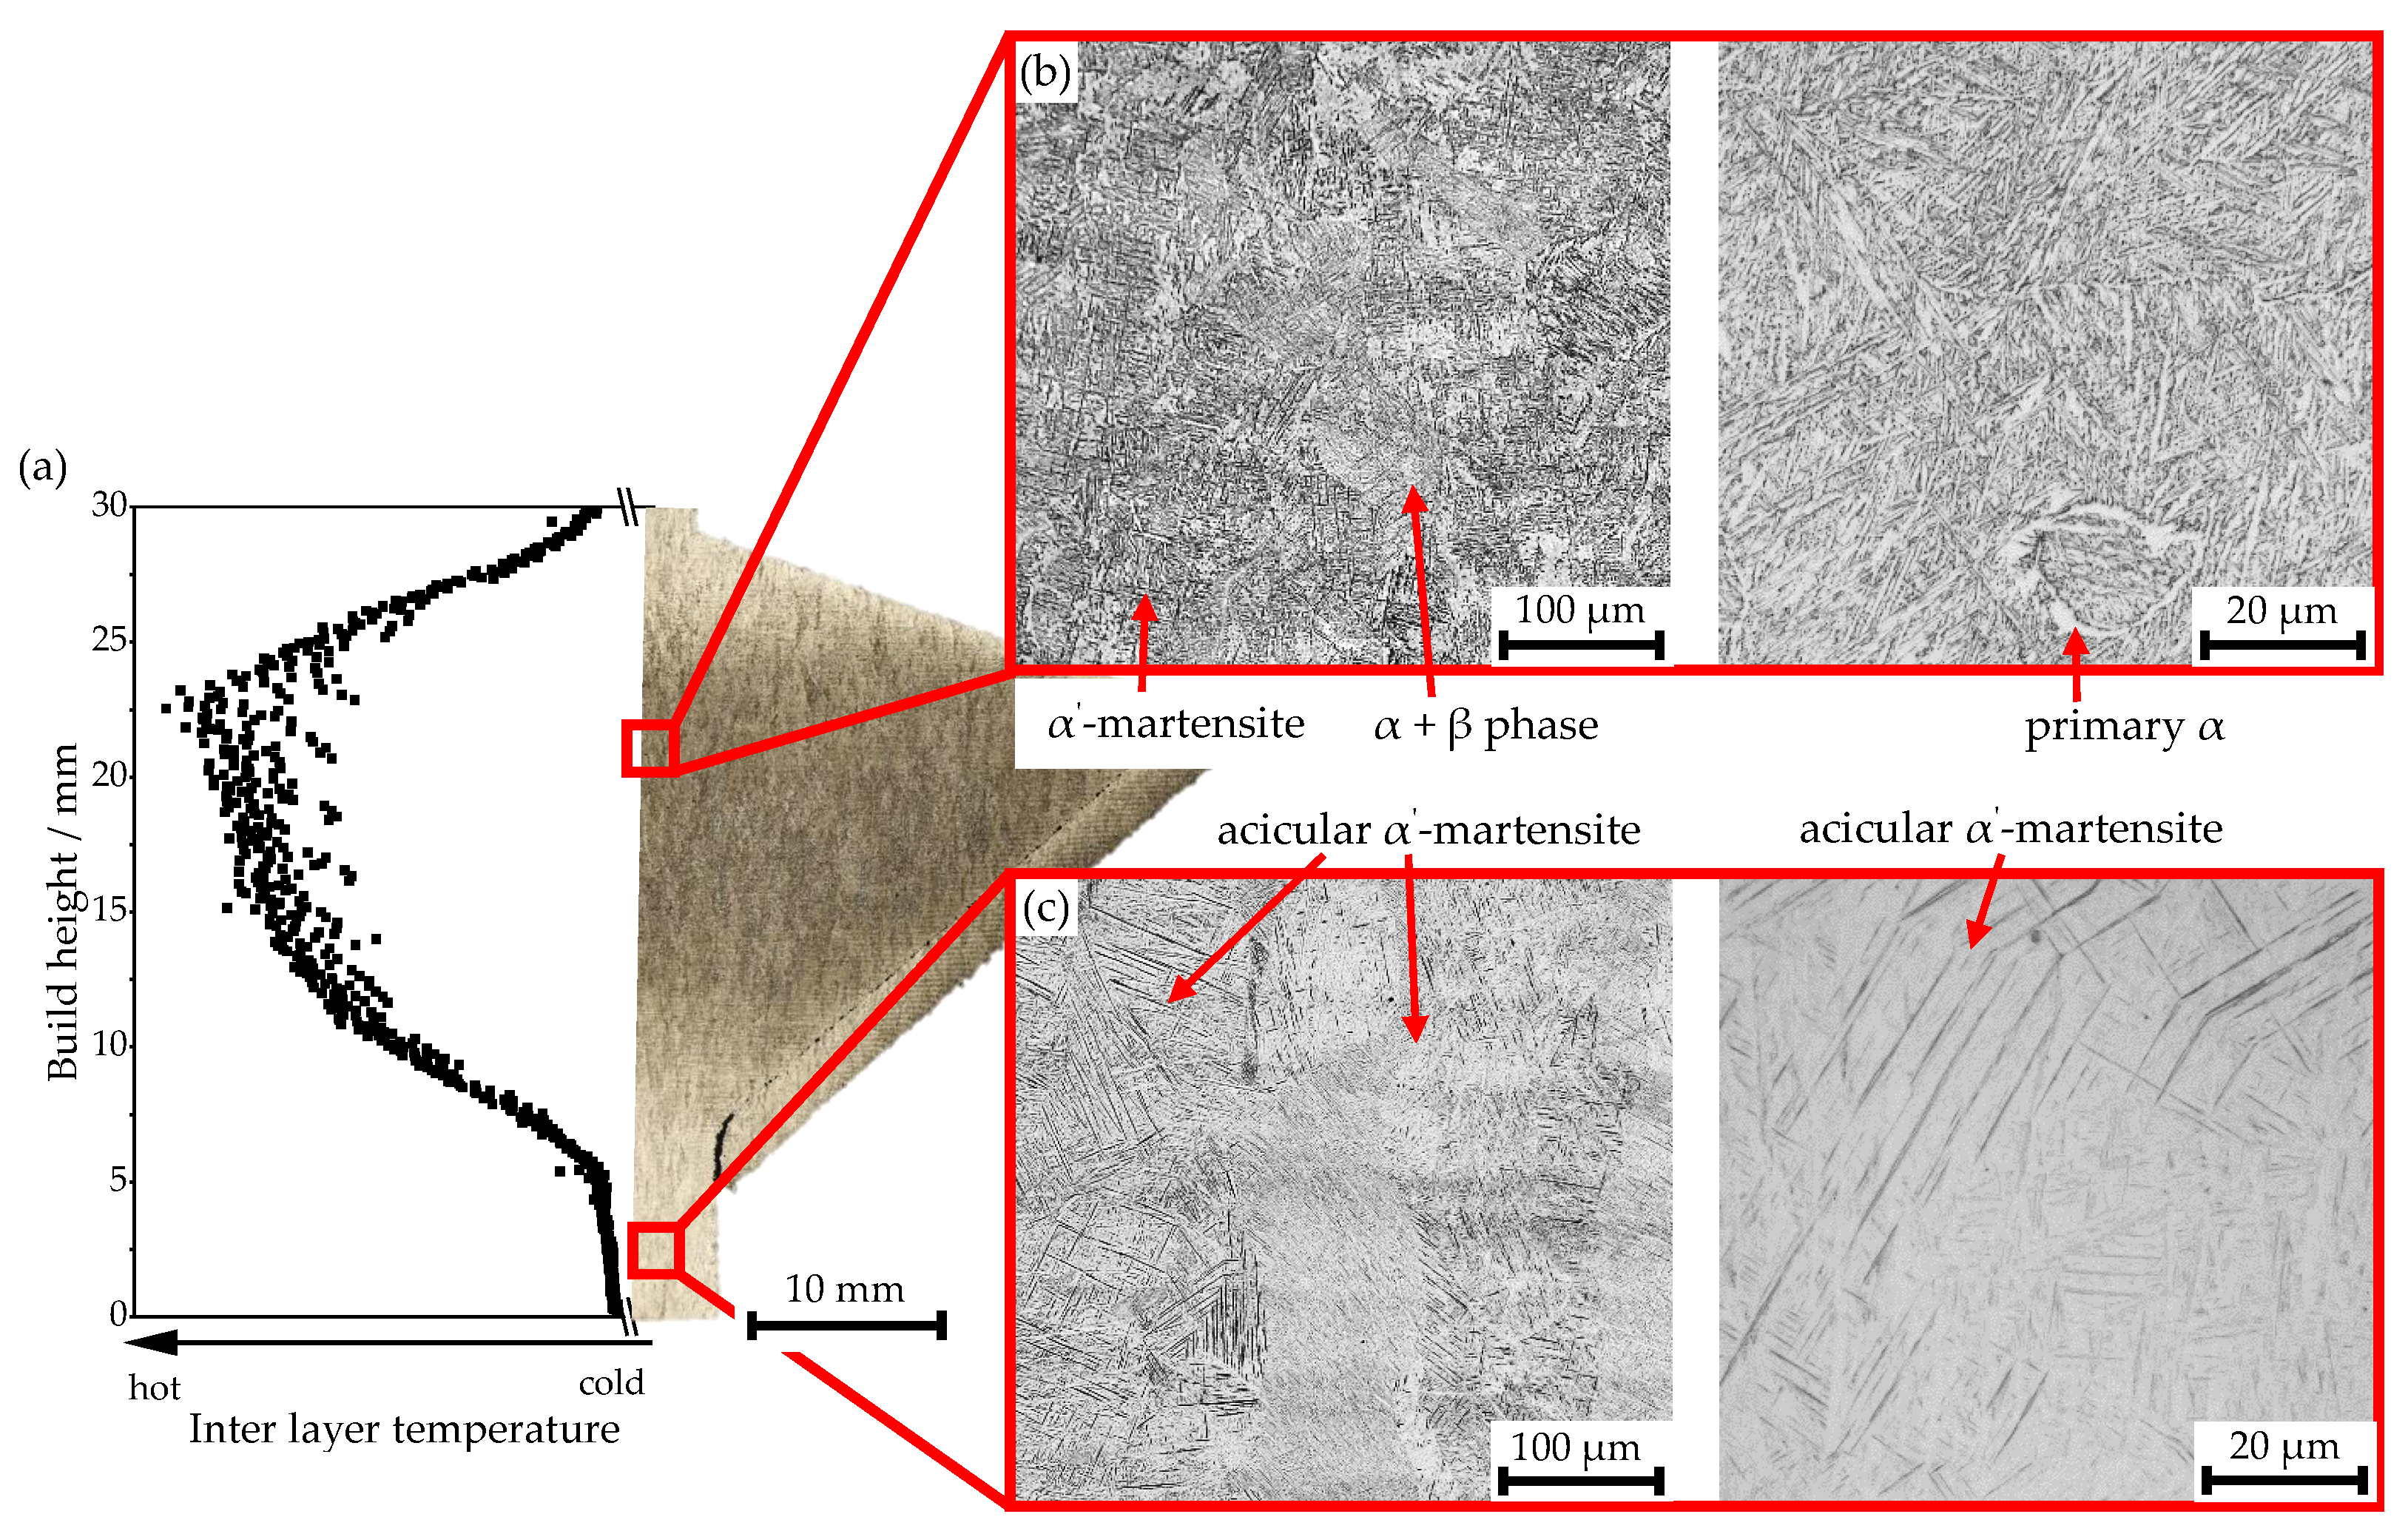
  • The part geometry greatly influences the thermal history during the build process. Both simulation and thermography showed an increase in inter-layer temperature for increasing part radius and thus accumulated heat along the build direction.
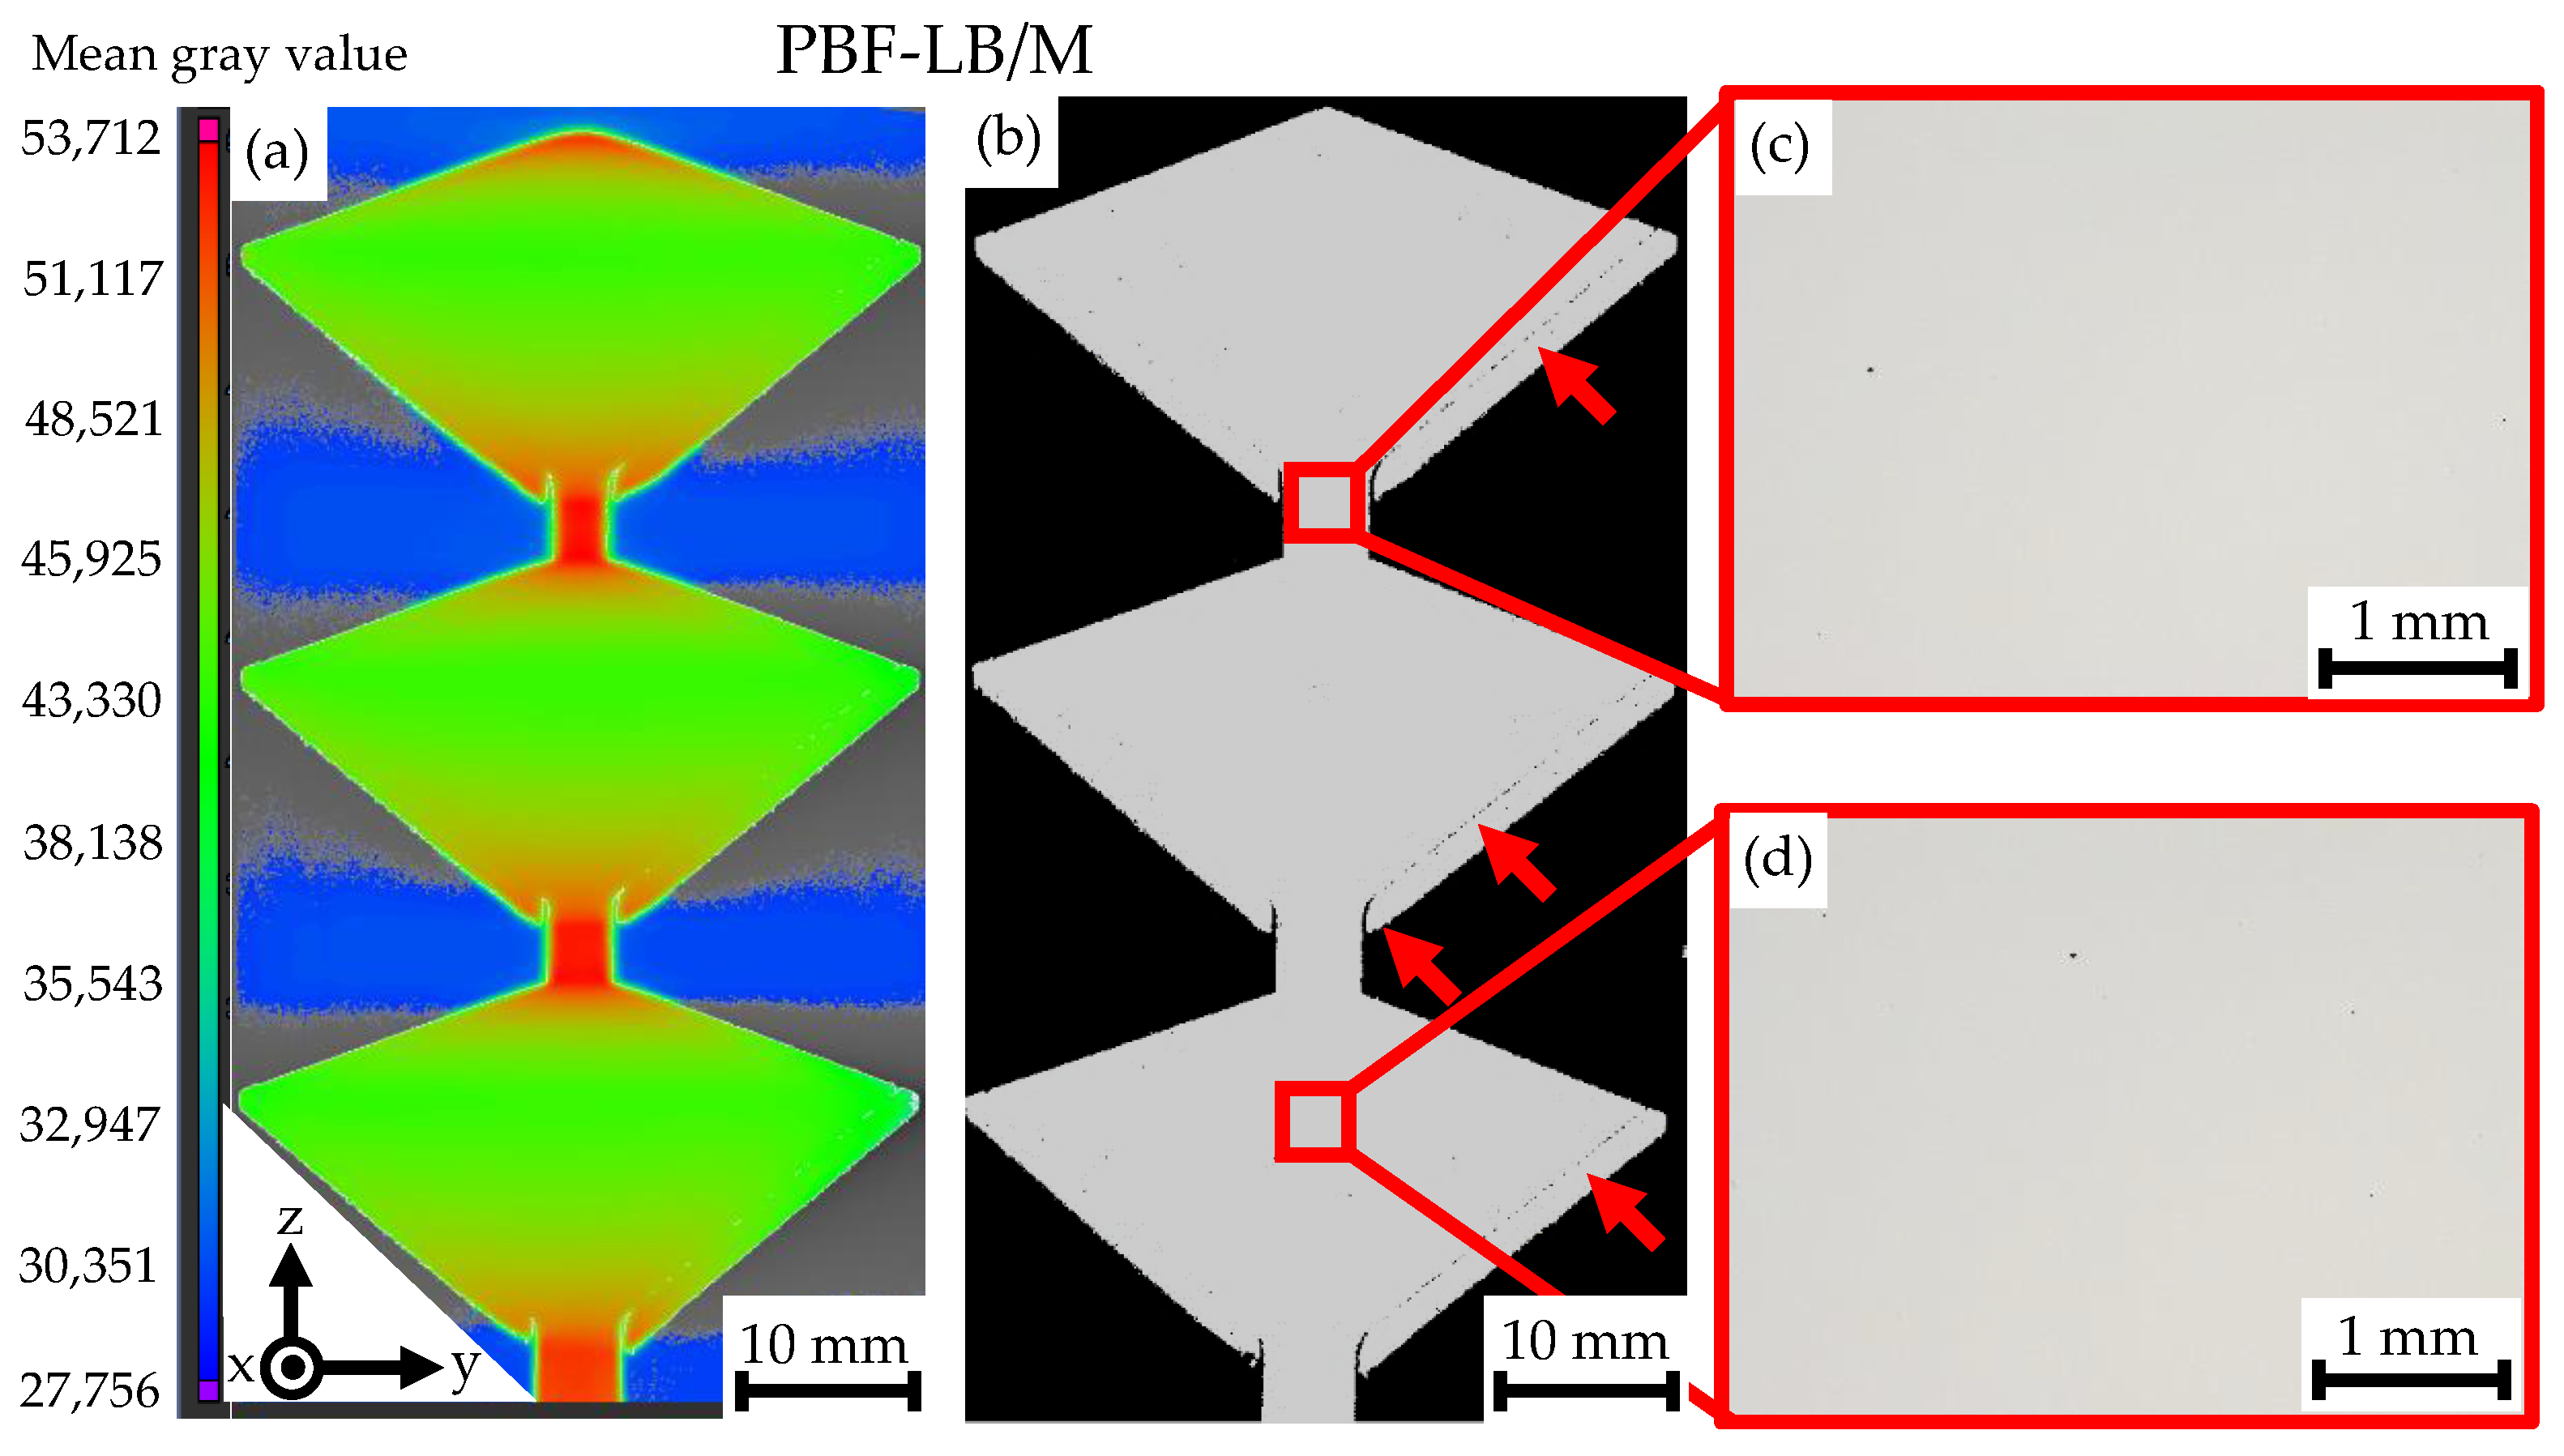
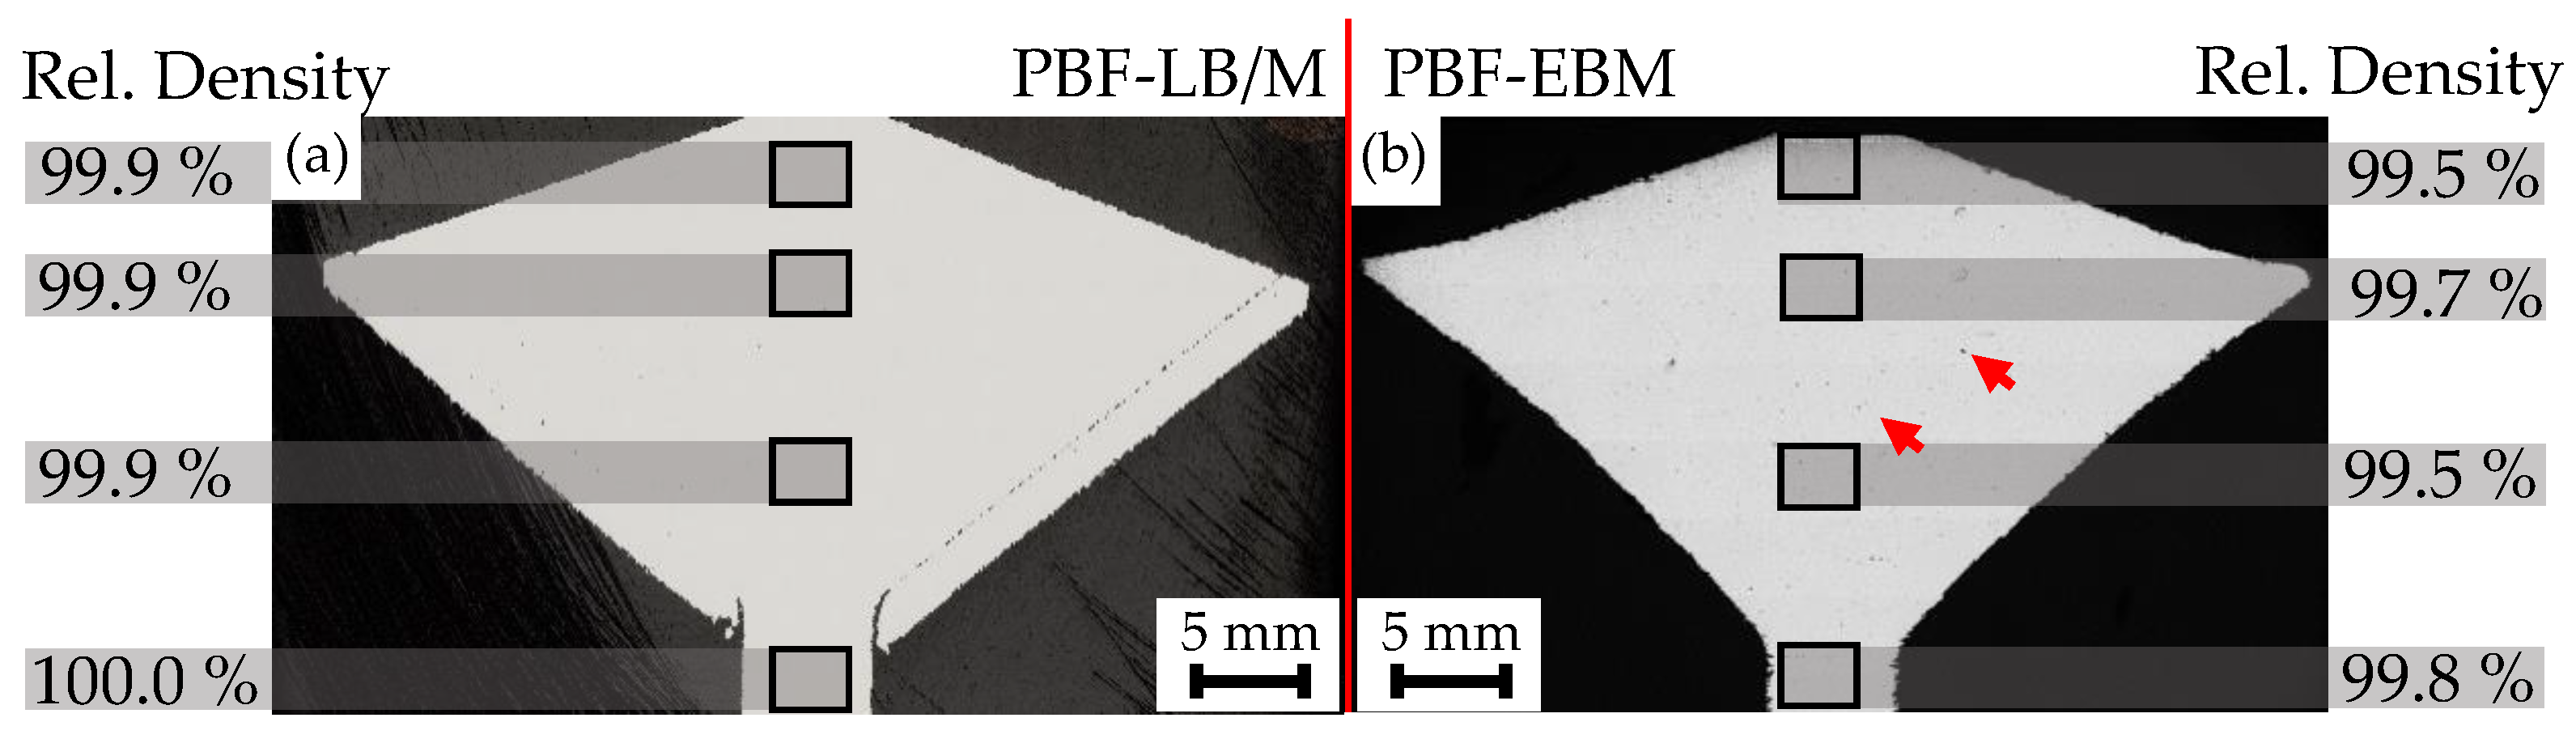
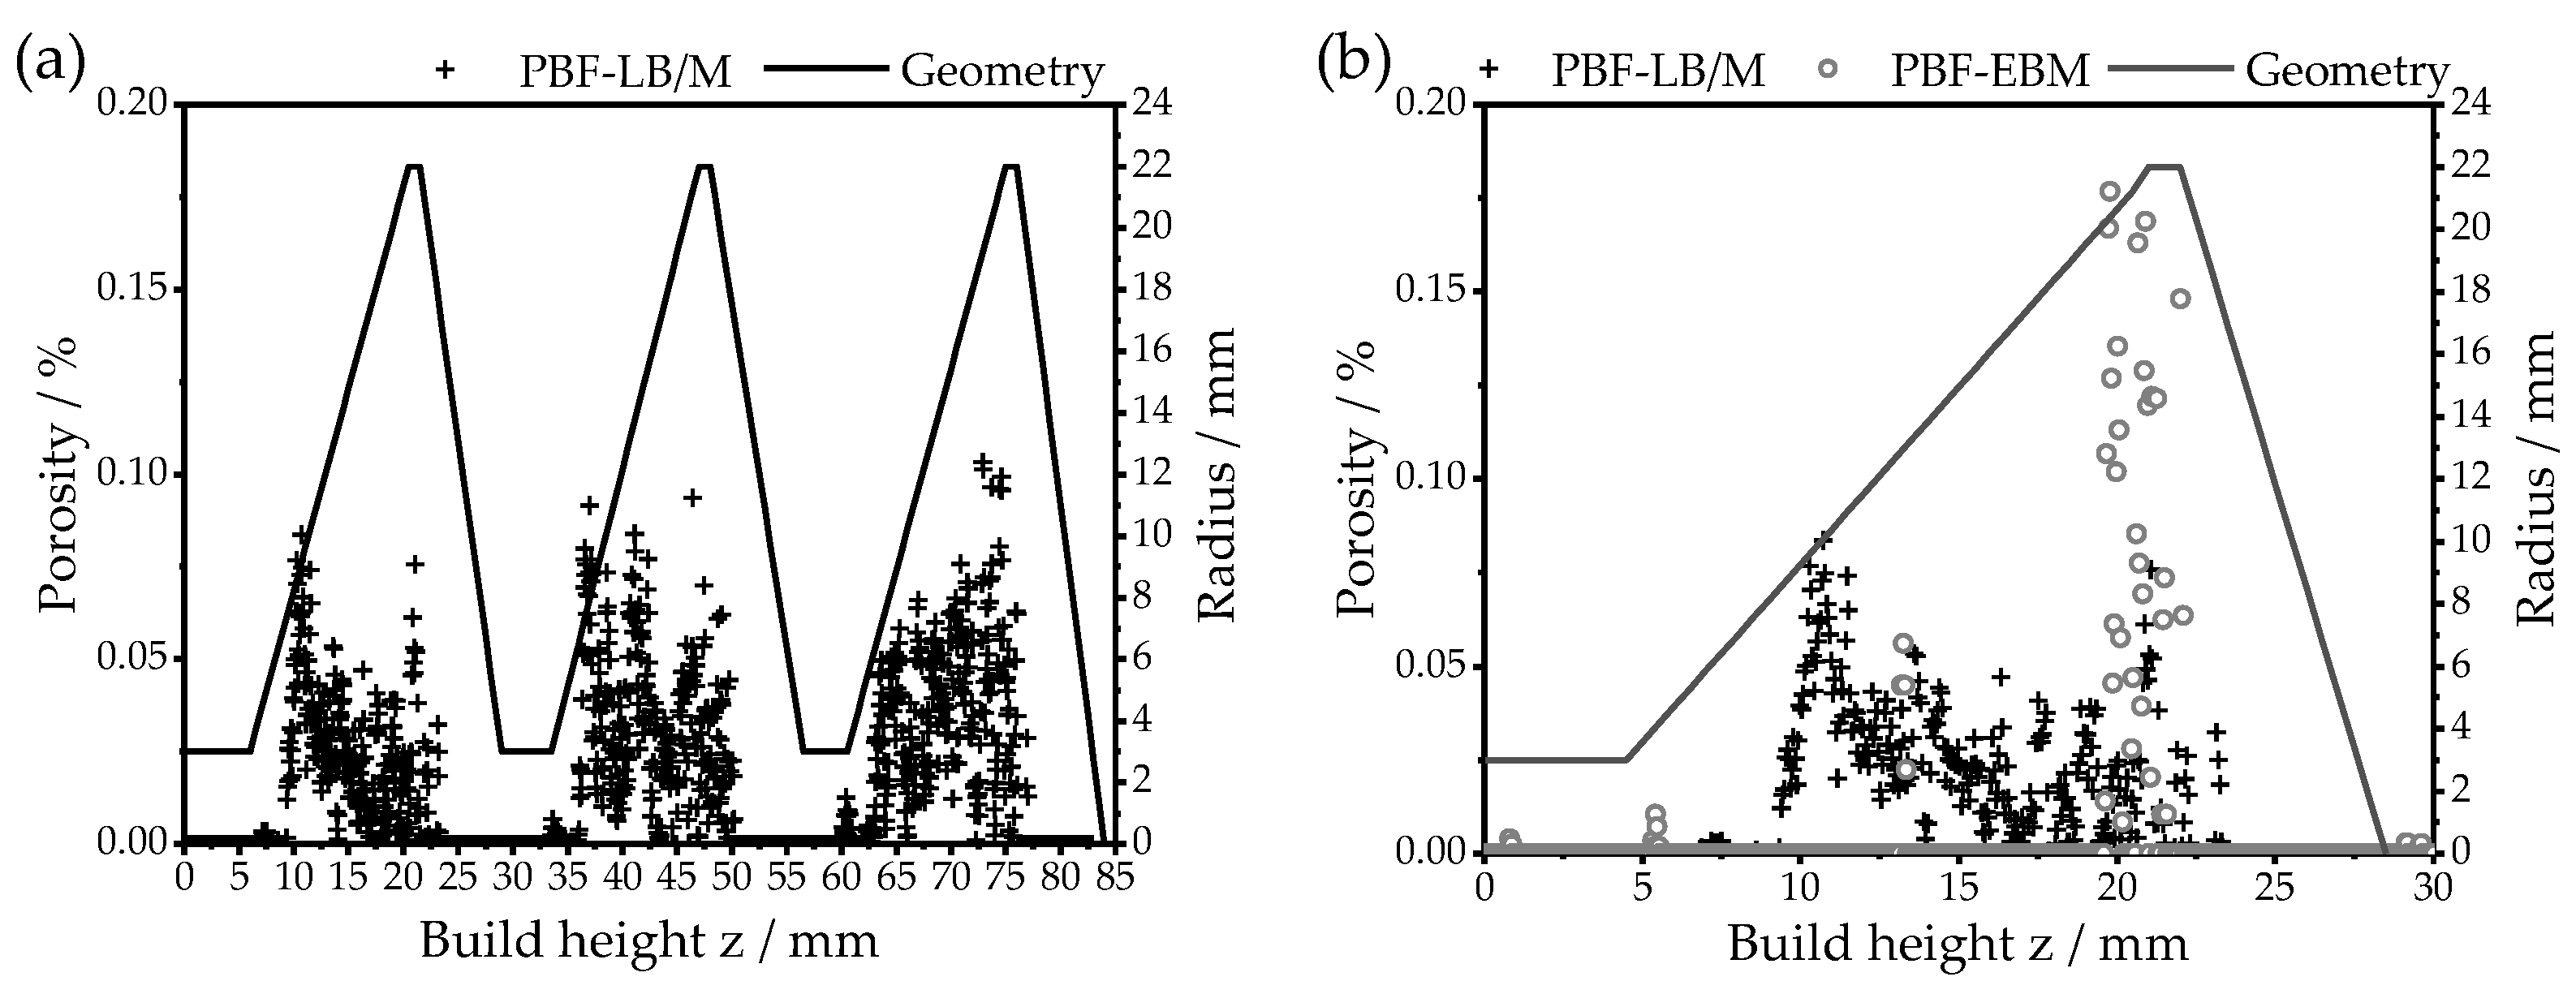
  • For both LB and EB, sound parts could be produced with densities of up to 100% in the narrow sections and up to 99.9% for LB and 99.7% for EB in the conic sections. Therefore, the geometry and temperature history have a minor influence on the part quality.
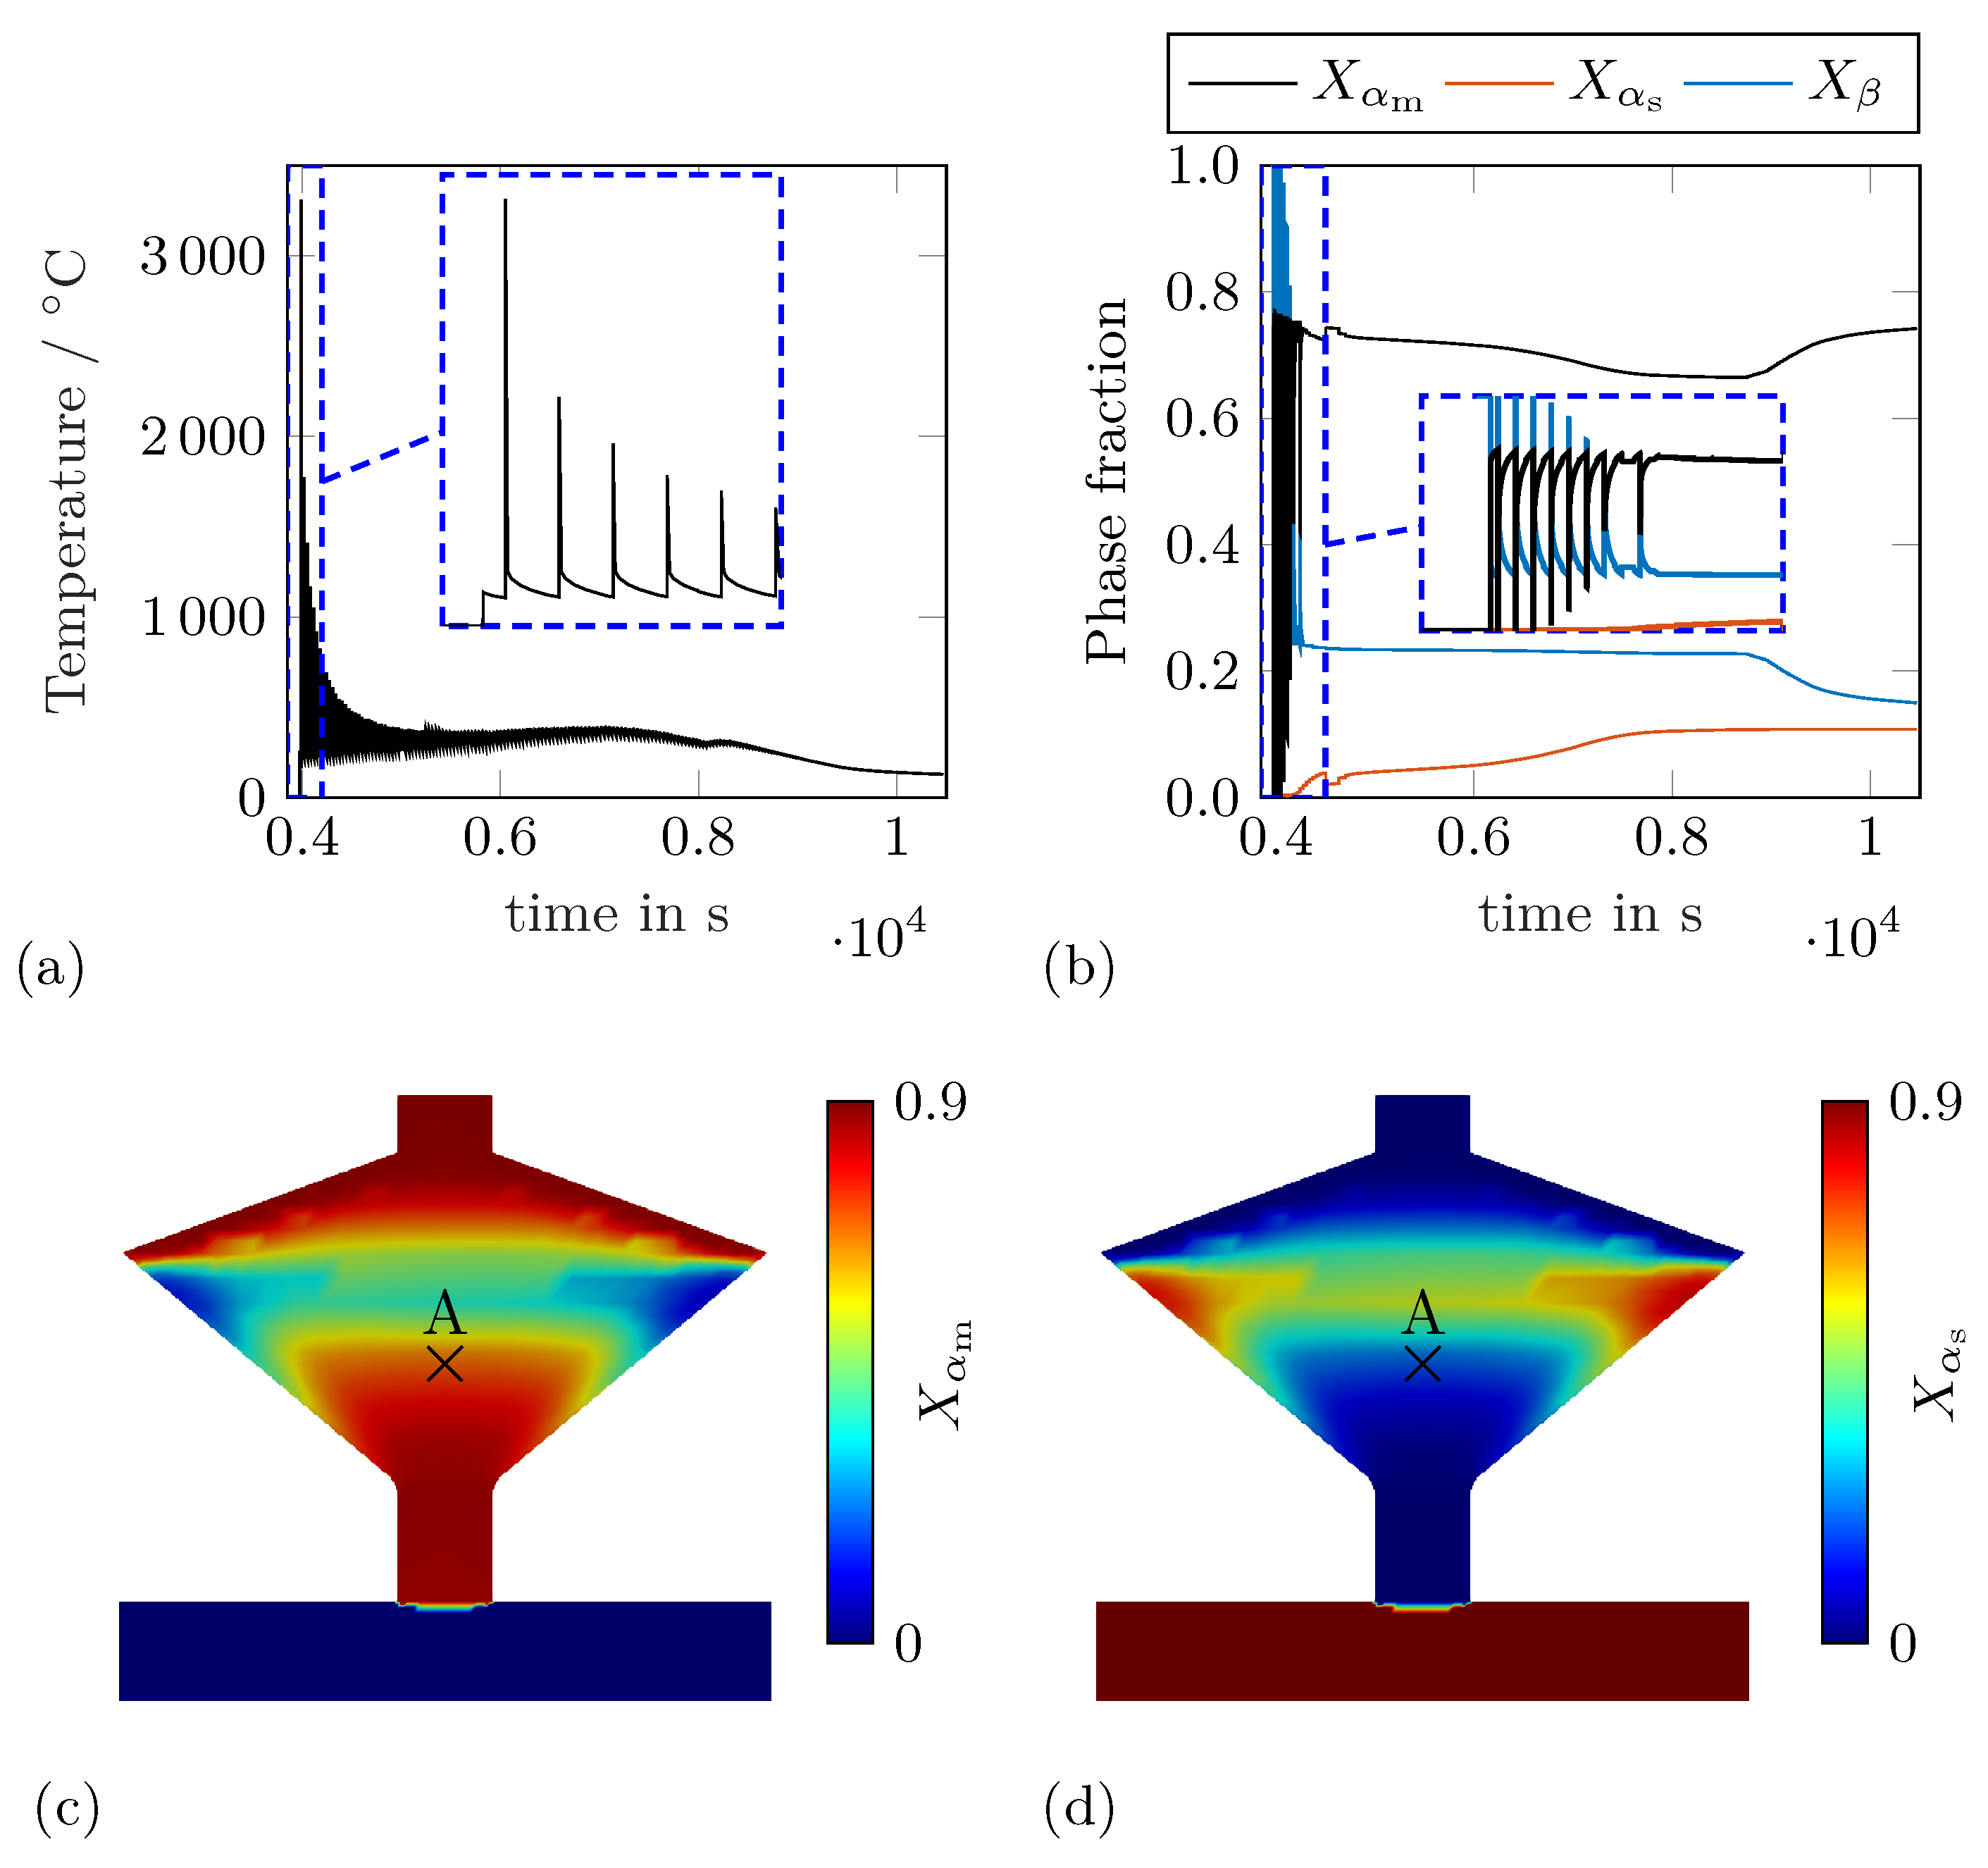
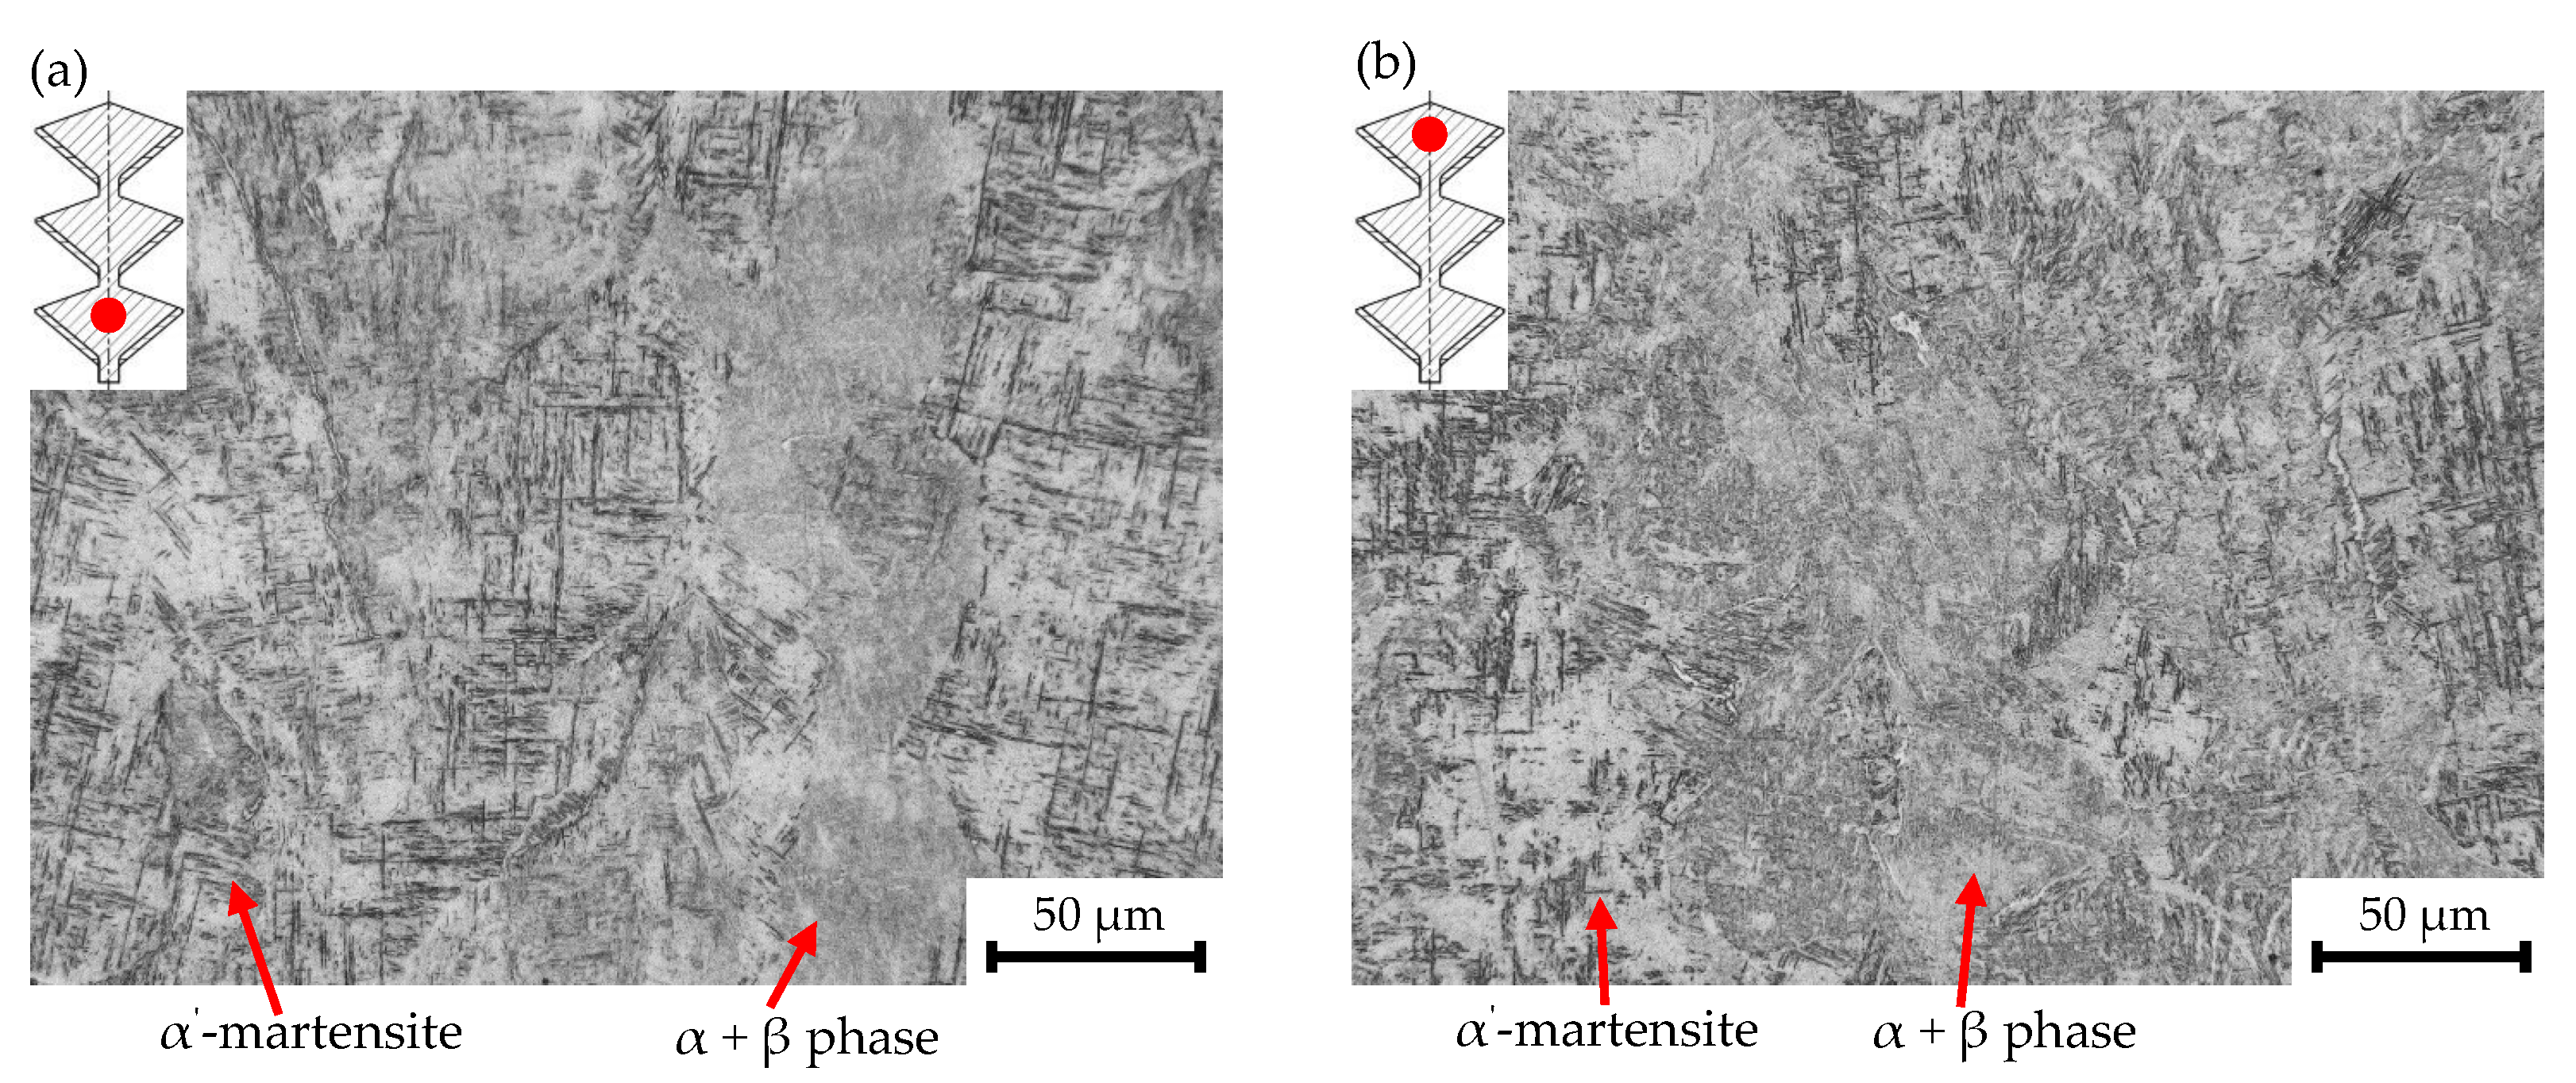
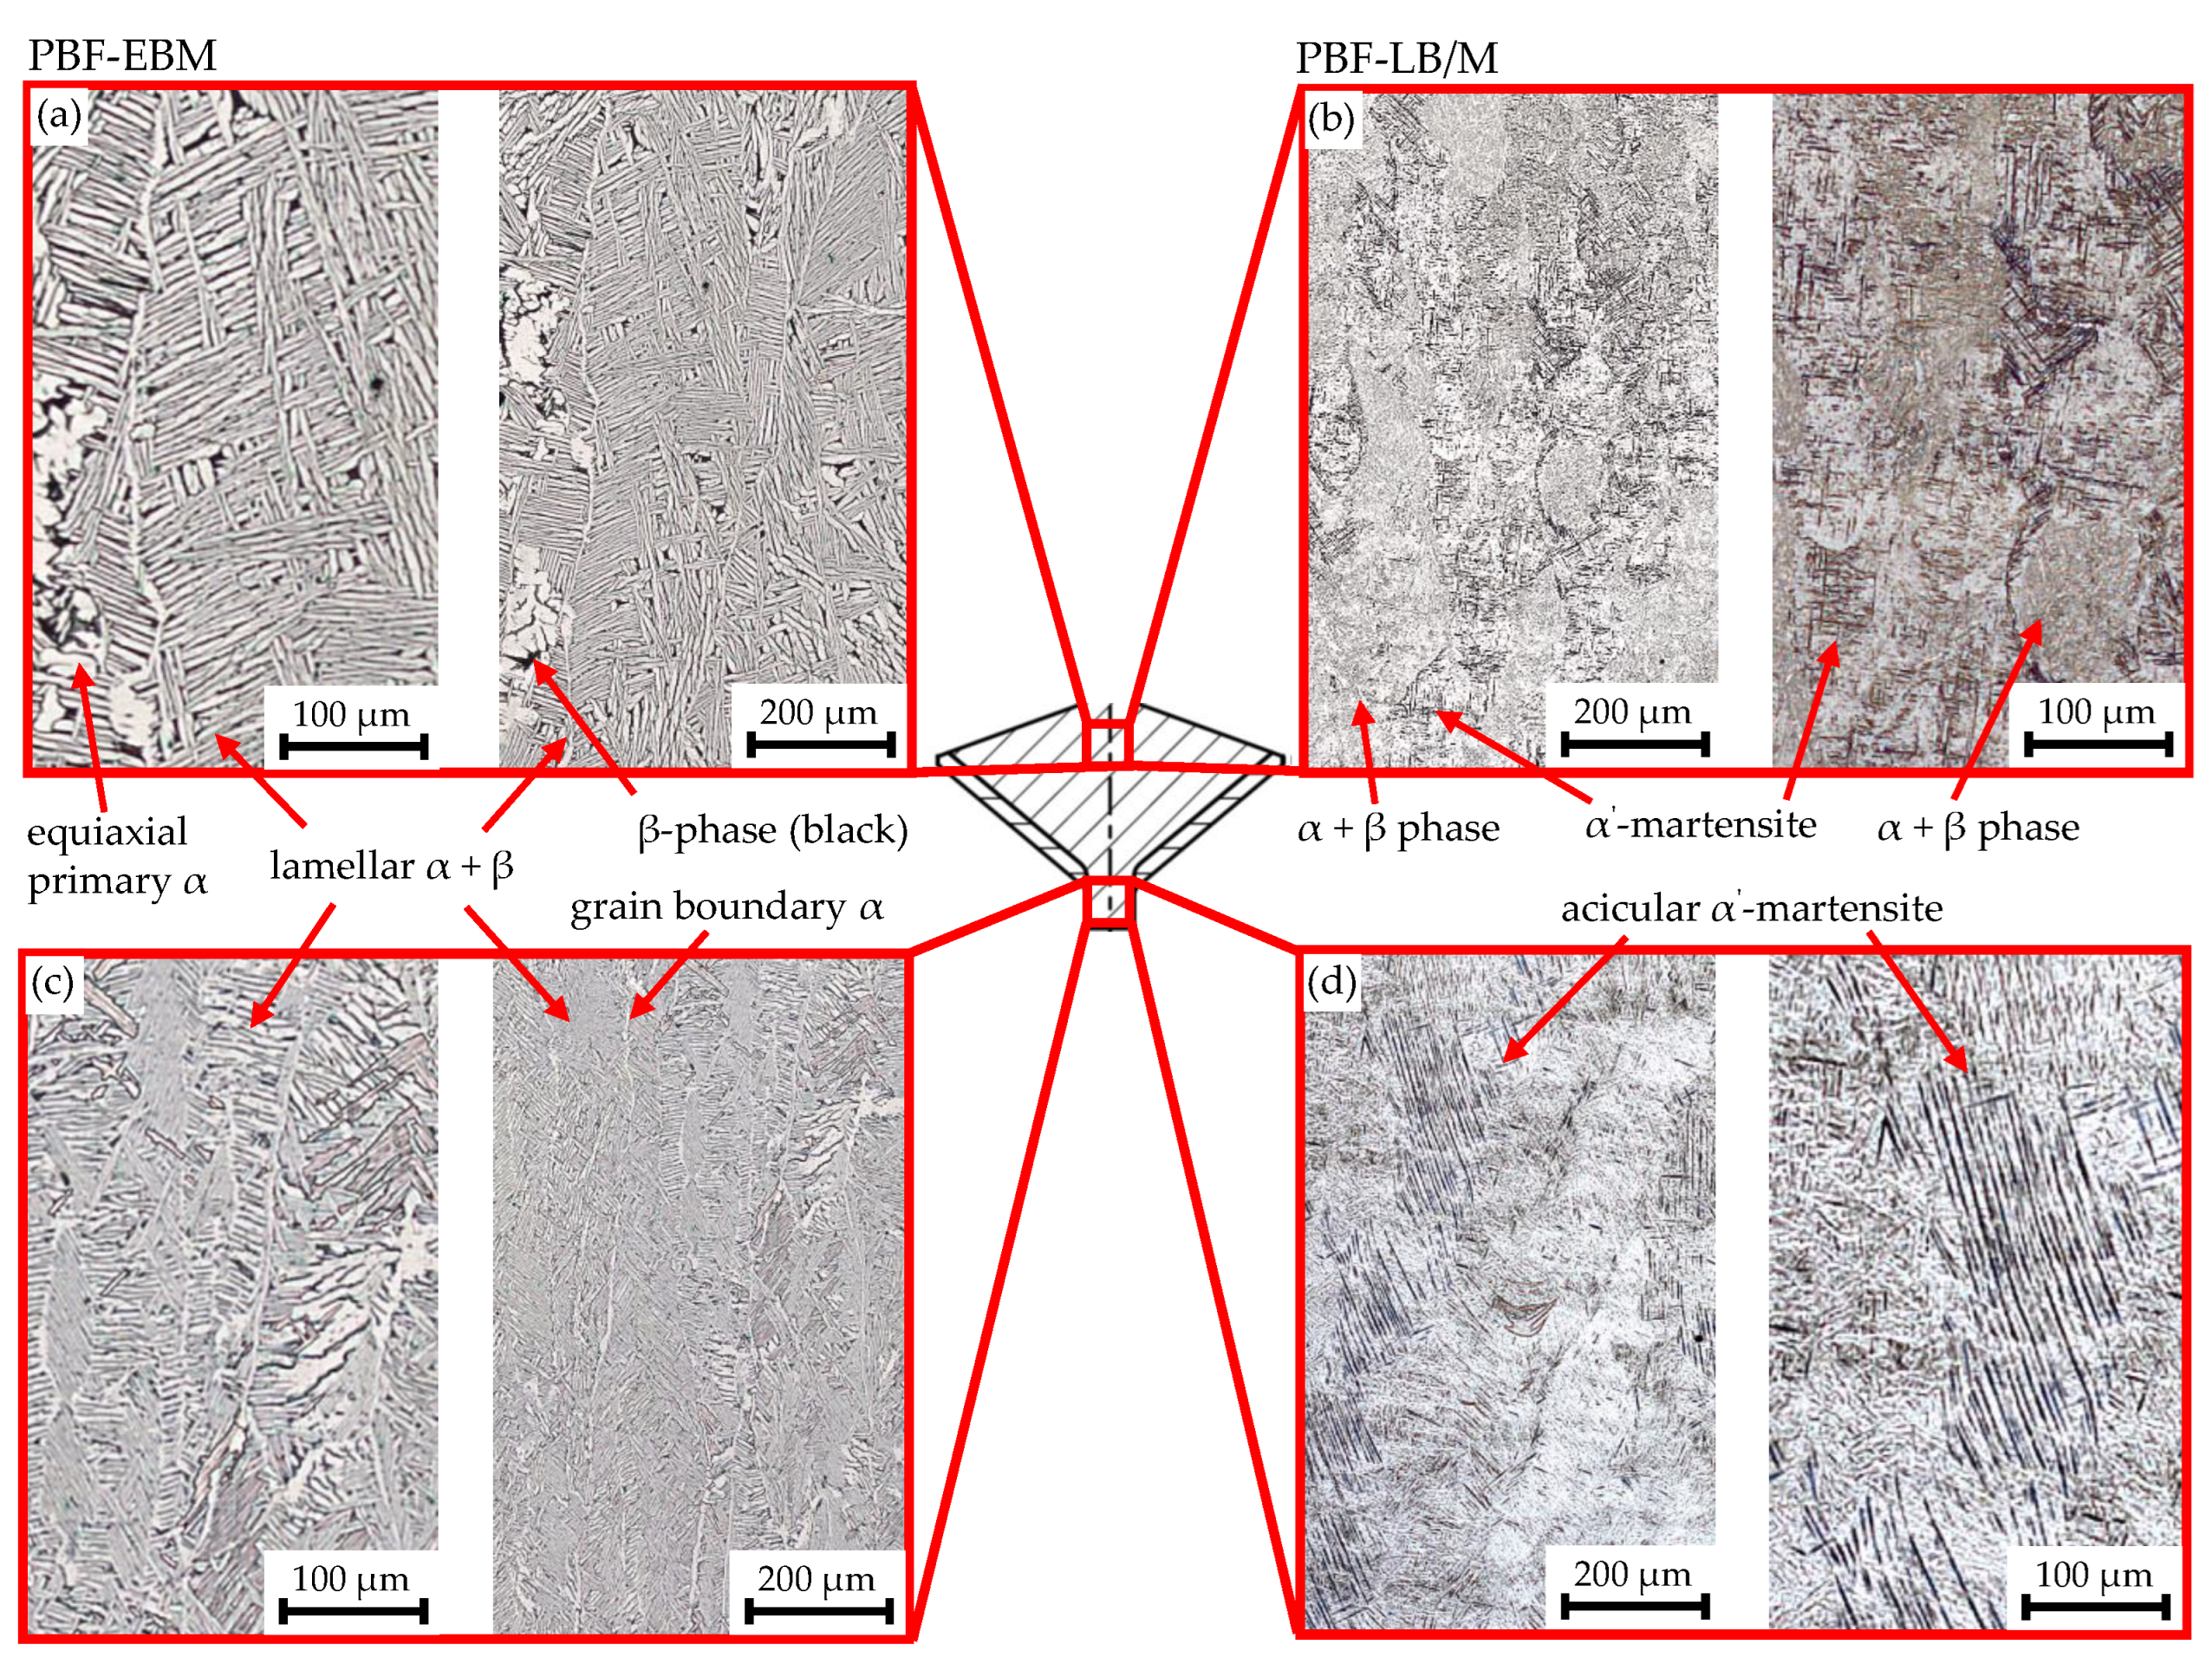
  • For the PBF-LB part, the microstructure is greatly affected by the thermal history as shown by simulations and as confirmed by optical micrographs. The martensitic structure in the narrow cylindric structures decomposes into a mix of tempered lath-like martensite and ultrafine α phase with marginal β phase for increasing the part radius and build height. According to the finite element simulations, the martensitic dominates the cylindric section with a phase fraction of 0.9, while the microstructure below the widest cross-section consists of 0.53 α phase, 0.37 martensitic phase and 0.10 β phase. The EBM part exhibits a clear α + β microstructure for both cylindric and conic structures with a slightly coarser microstructure along the build height due to the preheating temperature.
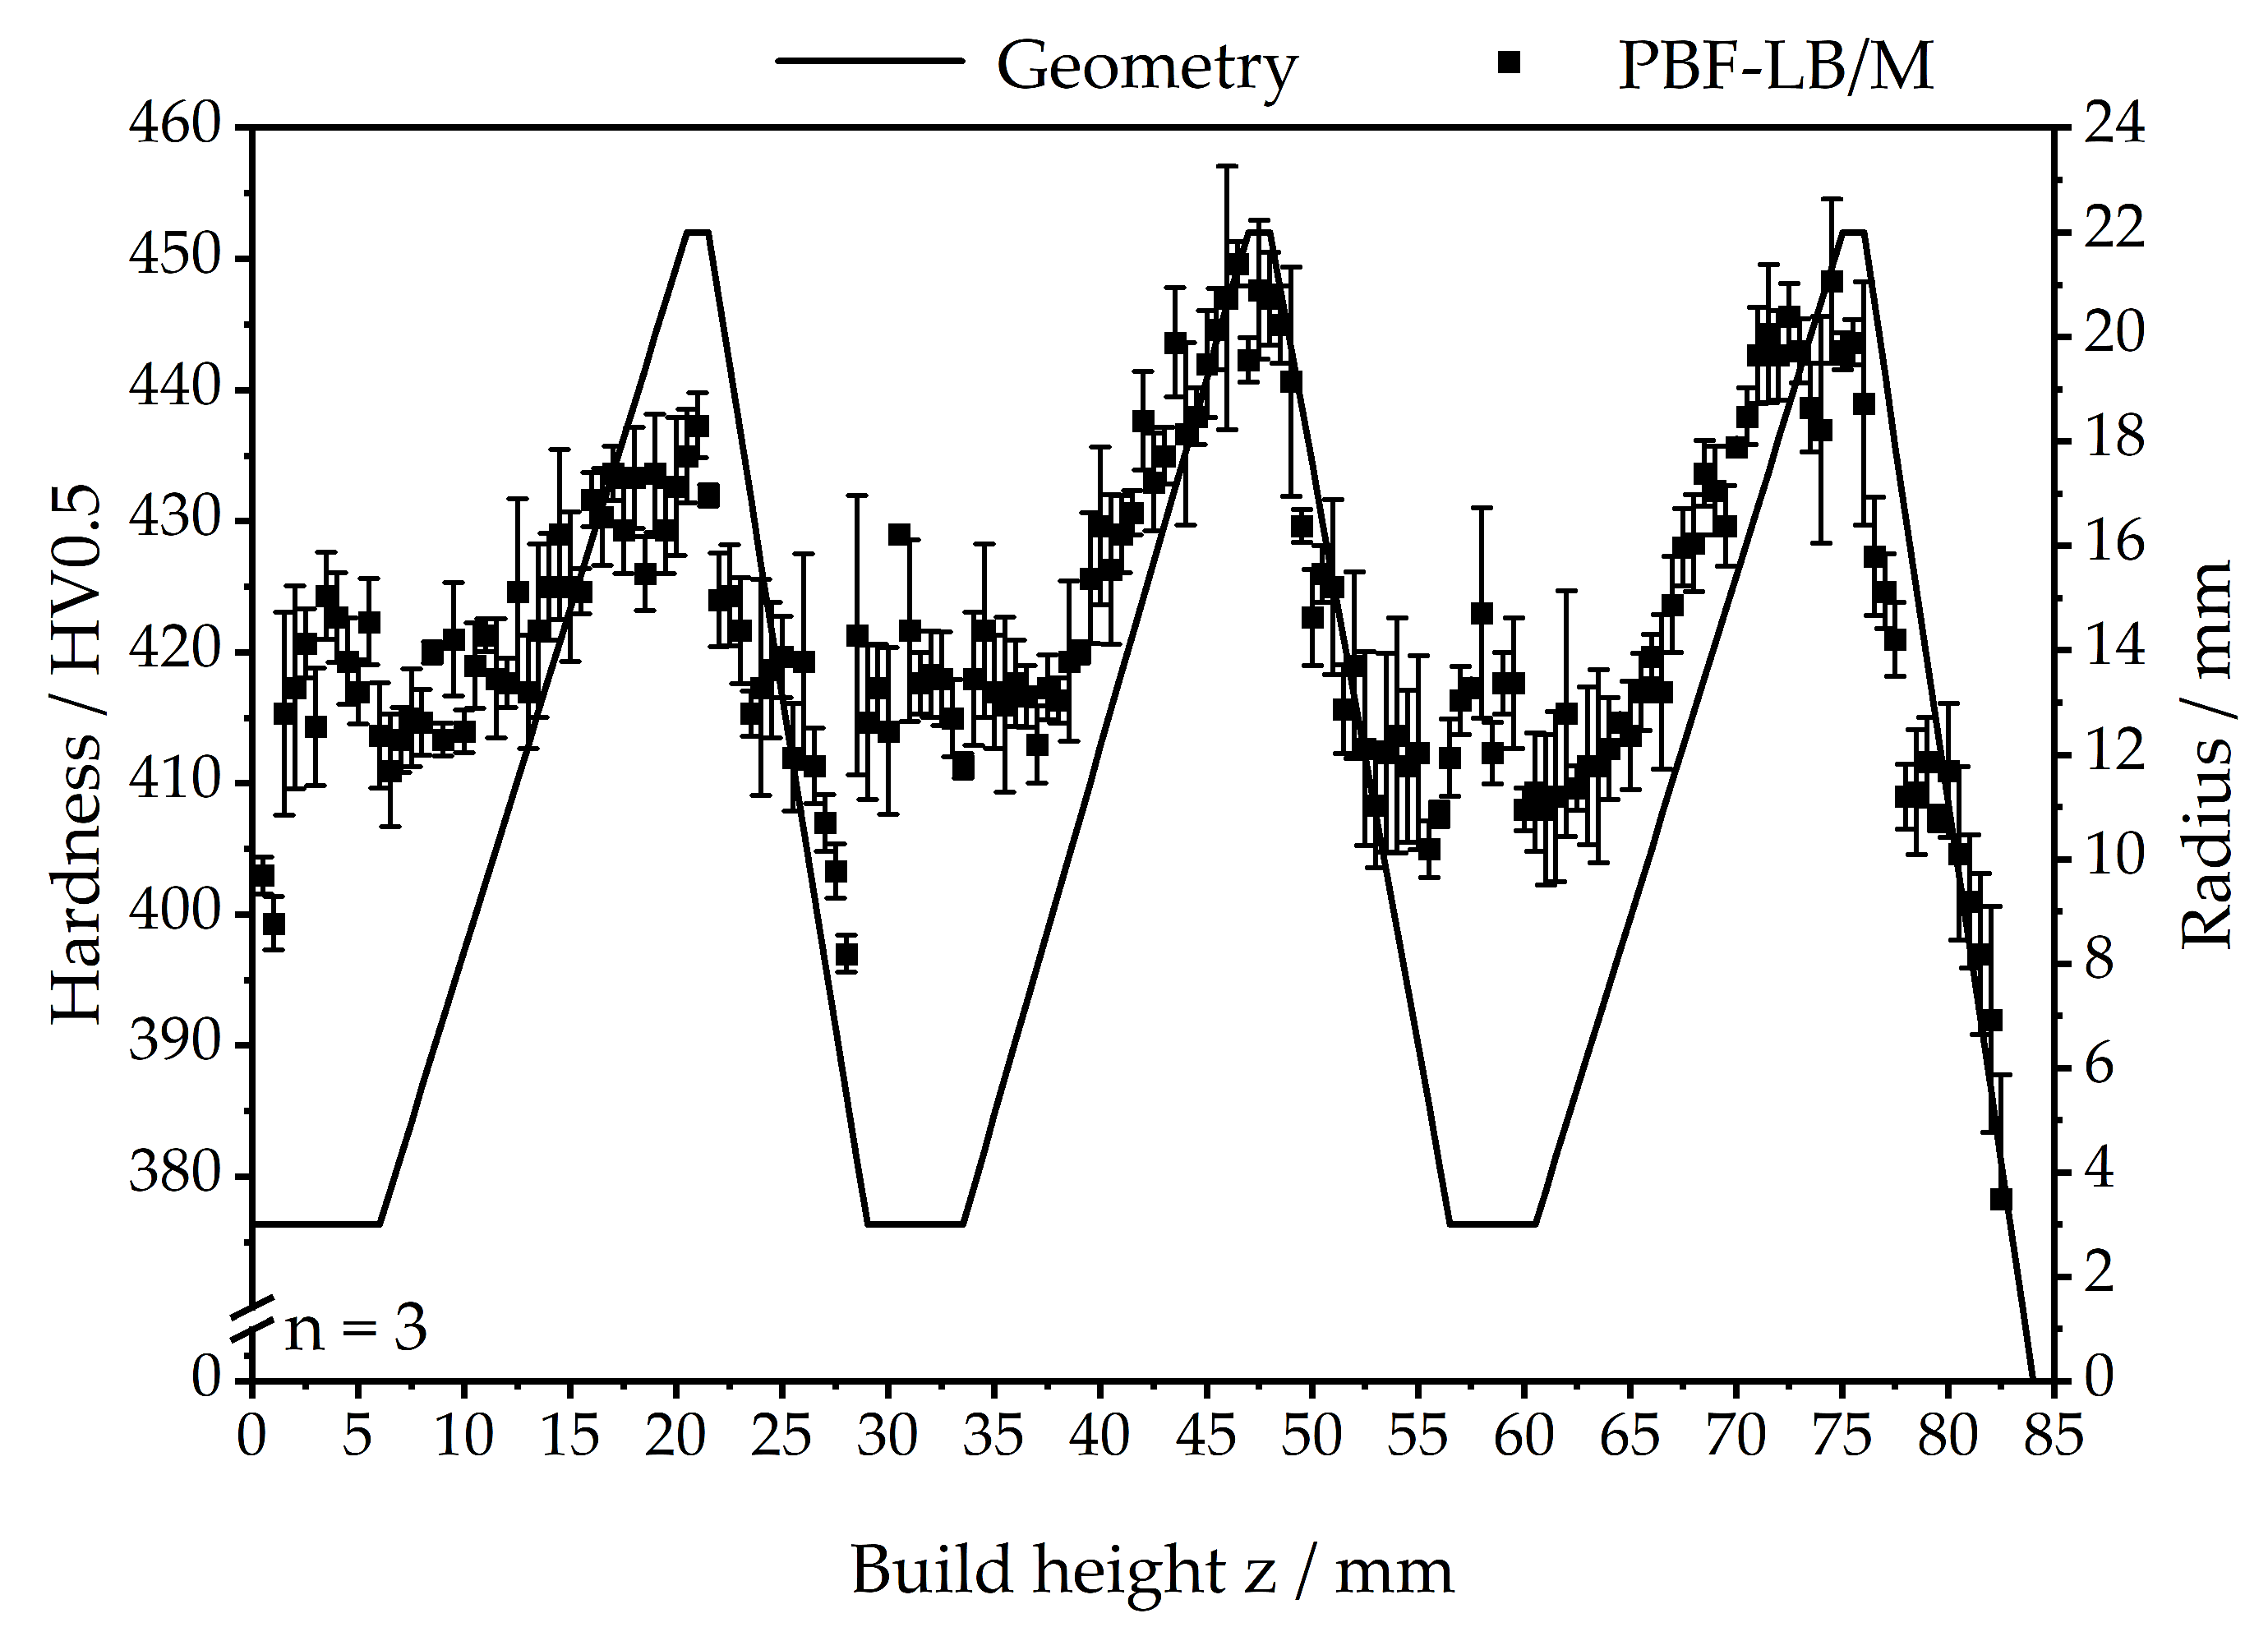
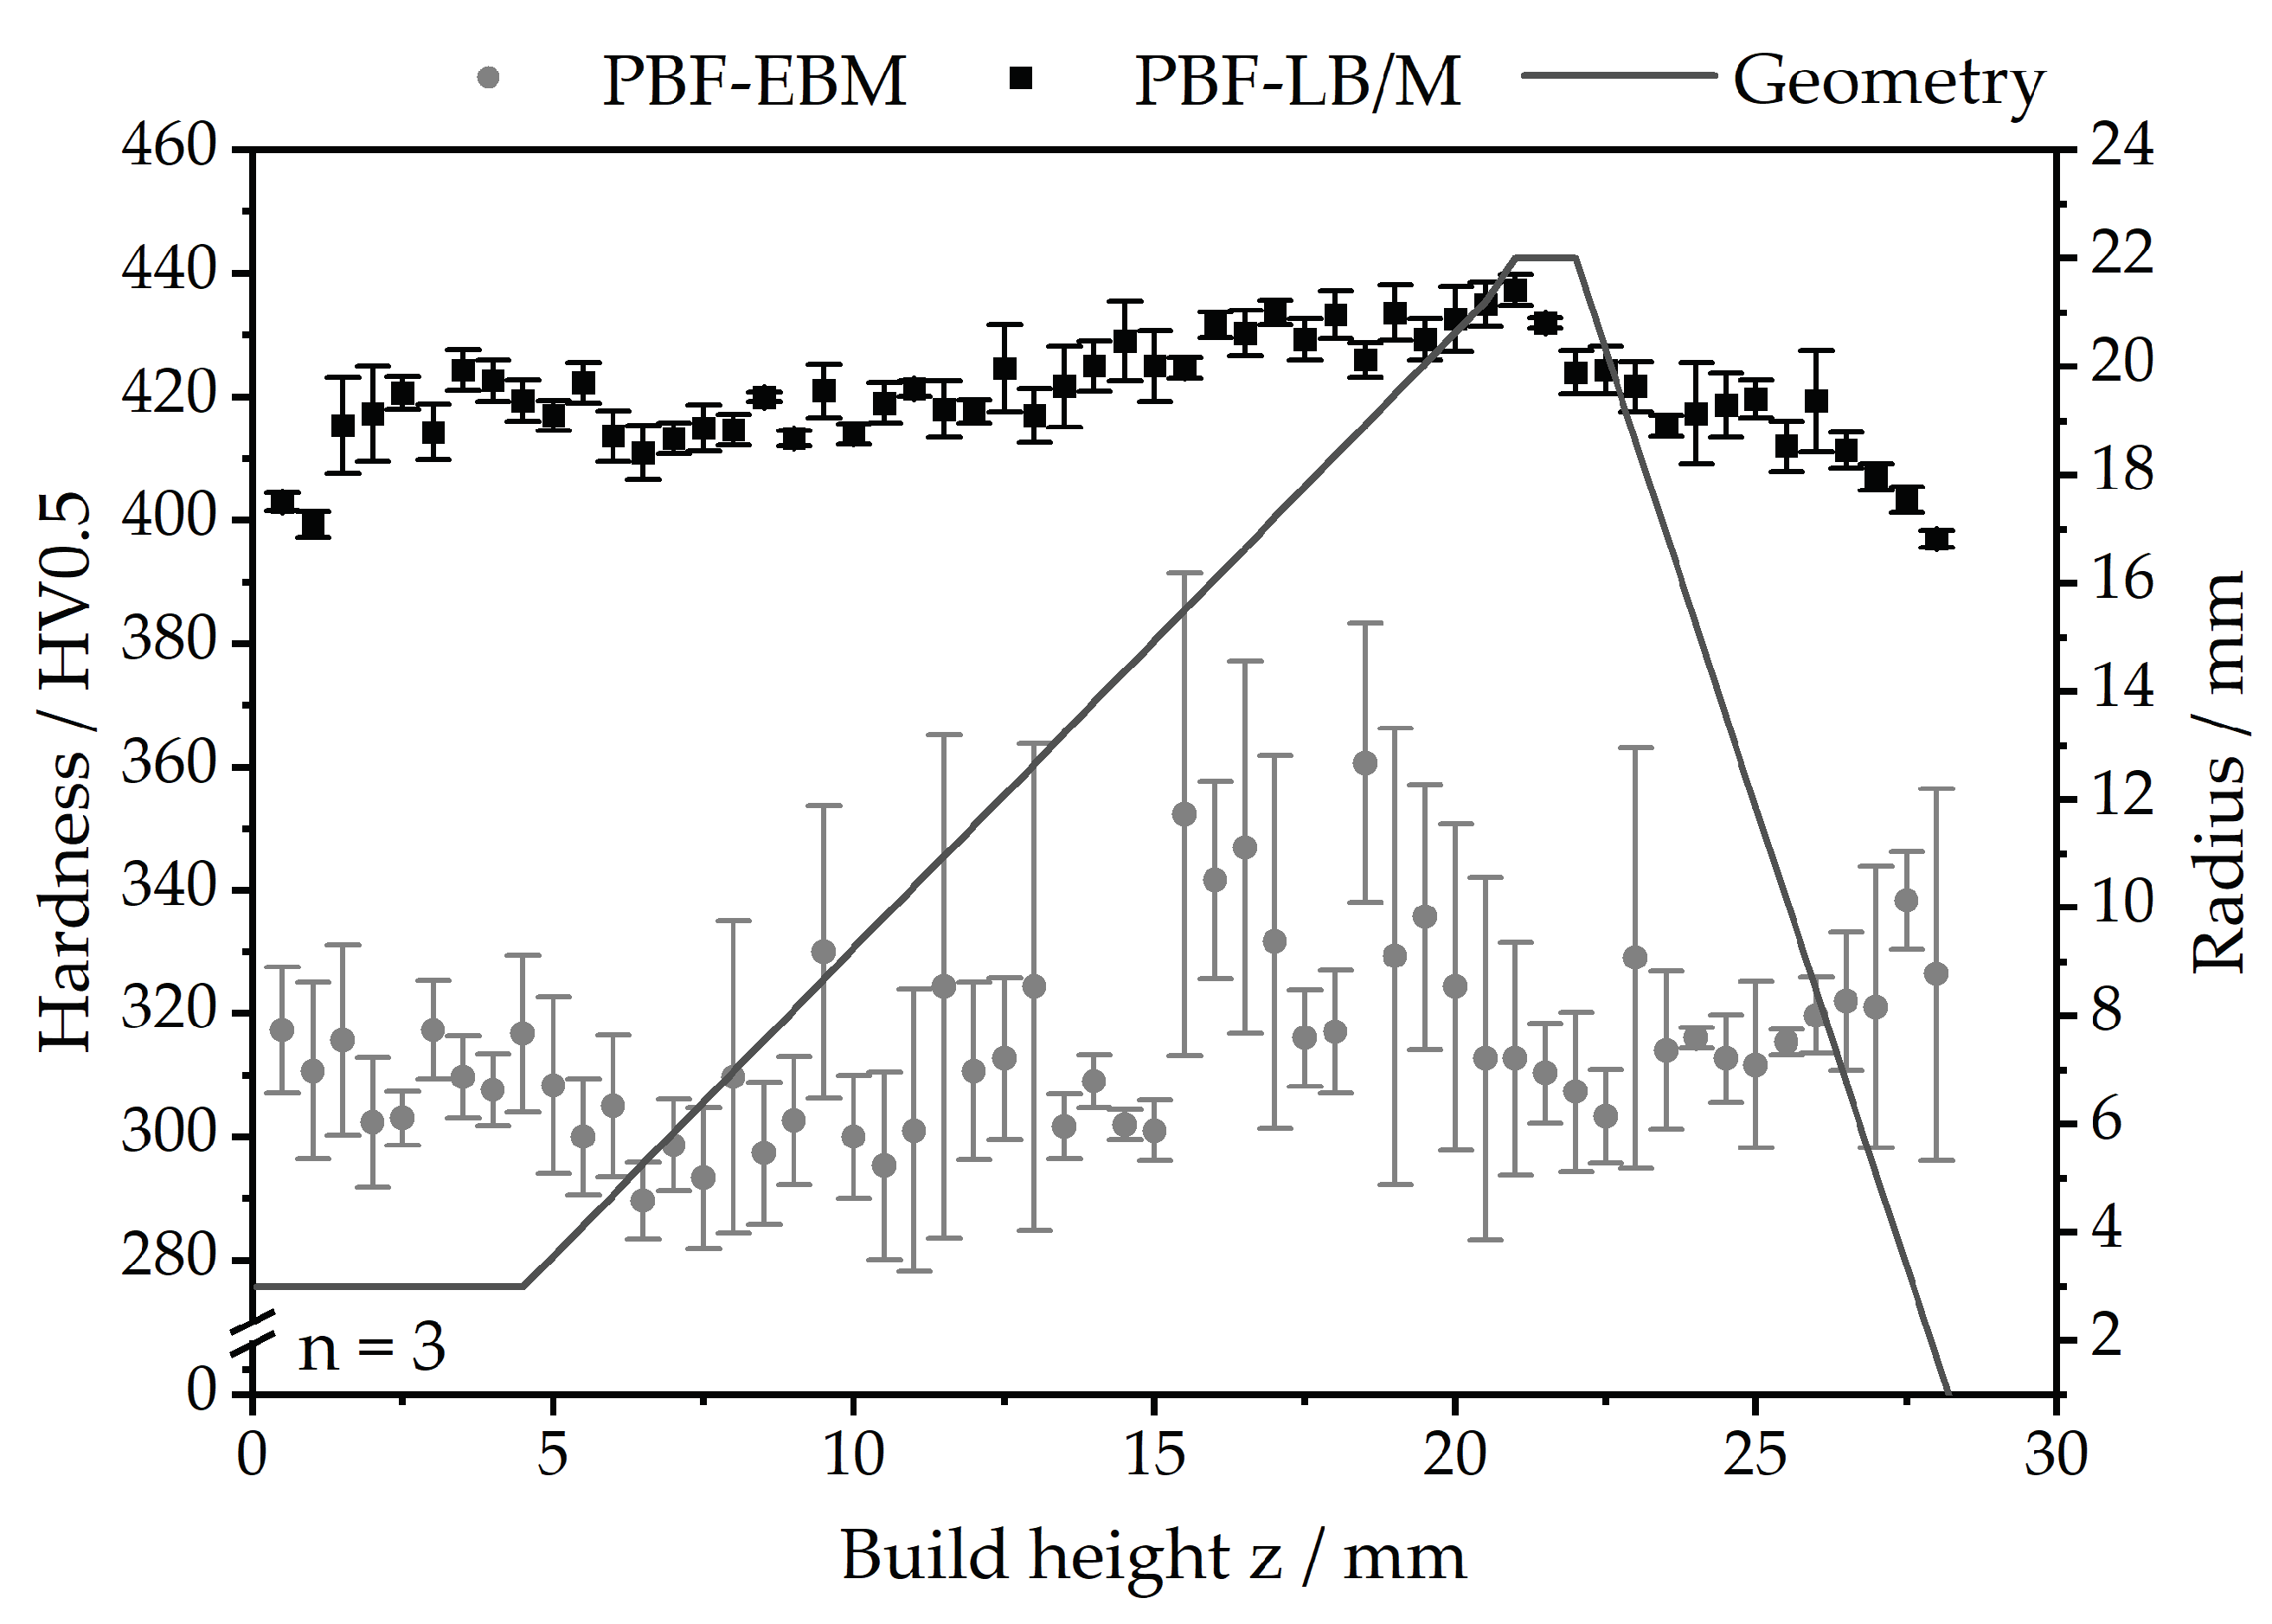
  • The change in microstructure directly influences the hardness of the PBF-LB part. The hardness increases with increasing part radius and inter-layer temperature ranging from 400–420 HV 0.5 in the narrow sections to a maximum of 450 HV 0.5 in the broad conic sections. The hardness of the LB part is higher than that of the EB part with hardness values between 280 and 380 HV 0.5 due to the quantity of the martensitic phase and finer α phase.
Based on the good agreement between the simulated microstructure and the experimental measurements, the simulation environment can be used in further investigations to derive suitable process parameters in order to obtain a desired microstructure. As an example, the effects of adjusting the preheating temperature and the cooling time of individual layers can be investigated simulatively. However, for an investigation of locally adapted exposure strategies by modified scan trajectories, the heat source model has to be replaced by a more detailed model. Furthermore, the in situ heat treatment based on the geometrical properties should be further investigated regarding possible areas of application. Mechanical properties of complex industrial parts could be locally adjusted to suit their specific requirement without intermediate heat treatment steps by varying the local temperature gradient.

Author Contributions

Conceptualisation, F.N., M.R. and C.B.; methodology, F.N.; software, C.B.; validation, F.N., C.B. and J.R.; formal analysis, F.N.; investigation, F.N.; writing—original draft preparation, F.N. and C.B.; writing—review and editing, M.R., T.H., C.K., J.M., P.S., M.S. and M.M.; visualisation, F.N., C.B. and B.B.; supervision, M.M.; project administration, M.M.; funding acquisition, T.H., C.K., J.M., P.S. and M.S. All authors have read and agreed to the published version of the manuscript.

Funding

This research was funded by the German Research Foundation (DFG), Germany (Collaborative Research Center 814: Additive Manufacturing, Project ID 61375930, Subproject A5 as well as B2, C3, C4; Erlangen Graduate School in Advanced Optical Technologies (SAOT)).

Data Availability Statement

The data presented in this study are not publicly available due to ongoing research in this field.

Acknowledgments

The authors gratefully acknowledge funding of the Erlangen Graduate School in Advanced Optical Technologies (SAOT) by the Bavarian State Ministry for Science and Art. The numerical simulations have been computed on the Fritz cluster operated by the Erlangen National High Performance Computing Center (NHR@FAU). NHR funding is provided by federal and Bavarian state authorities. NHR@FAU hardware is partially funded by the German Research Foundation (DFG)–440719683. We acknowledge financial support by Deutsche Forschungsgemeinschaft and Friedrich-Alexander Universität Erlan-gen-Nürnberg within the funding program “Open Access Publication Funding”.

Conflicts of Interest

The authors declare no conflict of interest.

Appendix A

The phase transformation rate X ˙ β α s , which denotes the time-delayed transformation of the β phase to the α s phase, is modelled using modified logistic equations
X ˙ β α s = k α s ( ϑ ) ( X α s ) c α s 1 c α s ( X β X β eq ) c α s + 1 c α s for X β > X β eq 0 else ,
with the temperature-dependent equilibrium fraction of the β phase X β eq , the diffusion coefficient k α s and the exponent c α s . The phase transformation rates for X ˙ α m α s and X ˙ α s β follow in the same manner
X ˙ α m α s = k α s ( ϑ ) ( X α s ) c α s 1 c α s ( X α m X α m eq ) c α s + 1 c α s for X α m > X α m eq 0 else ,
and
X ˙ α s β = k β ( ϑ ) ( X β 0.1 ) c β 1 c β ( X α X α eq ) c β + 1 c β for X α > X α eq 0 else .
The instantaneous transformation of the β phase to the martensite phase is considered using Karush–Kuhn–Tucker conditions
X α m X α m eq 0 , X ˙ β α m 0 , ( X α m X α m eq ) X ˙ β α m = 0 .
Analogously, the reverse transformation follows to
X β X β eq 0 , X ˙ α m β 0 , ( X β X β eq ) X ˙ α m β = 0 .

References

  1. Thomas, D.S.; Gilbert, S.W. Costs and cost effectiveness of additive manufacturing. NIST Spec. Publ. 2014, 1176, 12. [Google Scholar]
  2. Attaran, M. The rise of 3-D printing: The advantages of additive manufacturing over traditional manufacturing. Bus. Horizons 2017, 60, 677–688. [Google Scholar] [CrossRef]
  3. Ford, S.; Despeisse, M. Additive manufacturing and sustainability: An exploratory study of the advantages and challenges. J. Clean. Prod. 2016, 137, 1573–1587. [Google Scholar] [CrossRef]
  4. Ladani, L.; Sadeghilaridjani, M. Review of powder bed fusion additive manufacturing for metals. Metals 2021, 11, 1391. [Google Scholar] [CrossRef]
  5. Praveena, B.A.; Lokesh, N.; Buradi, A.; Santhosh, N.; Praveena, B.L.; Vignesh, R. A comprehensive review of emerging additive manufacturing (3D printing technology): Methods, materials, applications, challenges, trends and future potential. Mater. Today Proc. 2022, 52, 1309–1313. [Google Scholar]
  6. Yap, C.Y.; Chua, C.K.; Dong, Z.L.; Liu, Z.H.; Zhang, D.Q.; Loh, L.E.; Sing, S.L. Review of selective laser melting: Materials and applications. Appl. Phys. Rev. 2015, 2, 041101. [Google Scholar] [CrossRef]
  7. Murr, L.E.; Gaytan, S.M.; Ramirez, D.A.; Martinez, E.; Hernandez, J.; Amato, K.N.; Shindo, P.W.; Medina, F.R.; Wicker, R.B. Metal fabrication by additive manufacturing using laser and electron beam melting technologies. J. Mater. Sci. Technol. 2012, 28, 1–14. [Google Scholar] [CrossRef]
  8. Murr, L.E.; Esquivel, E.V.; Quinones, S.A.; Gaytan, S.M.; Lopez, M.I.; Martinez, E.Y.; Medina, F.; Hernandez, D.H.; Martinez, E.; Martinez, J.L.; et al. Microstructures and mechanical properties of electron beam-rapid manufactured Ti–6Al–4V biomedical prototypes compared to wrought Ti–6Al–4V. Mater. Charact. 2009, 60, 96–105. [Google Scholar] [CrossRef]
  9. Rafi, H.K.; Karthik, N.V.; Gong, H.; Starr, T.L.; Stucker, B.E. Microstructures and mechanical properties of Ti6Al4V parts fabricated by selective laser melting and electron beam melting. J. Mater. Eng. Perform. 2013, 22, 3872–3883. [Google Scholar] [CrossRef]
  10. Arnold, C.; Pobel, C.; Osmanlic, F.; Körner, C. Layerwise monitoring of electron beam melting via backscatter electron detection. Rapid Prototyp. J. 2018, 24, 1401–1406. [Google Scholar] [CrossRef]
  11. Franchitti, S.; Borrelli, R.; Pirozzi, C.; Carrino, L.; Polini, W.; Sorrentino, L.; Gazzerro, A. Investigation on Electron Beam Melting: Dimensional accuracy and process repeatability. Vacuum 2018, 157, 340–348. [Google Scholar] [CrossRef]
  12. Larsson, M.; Lindhe, U.; Harrysson, O.L.A. Rapid manufacturing with Electron Beam Melting (EBM)—A manufacturing revolution? In Proceedings of the 2003 International Solid Freeform Fabrication Symposium, Austin, TX, USA, 14–16 August 2003. [Google Scholar]
  13. Sharabian, E.; Leary, M.; Fraser, D.; Gulizia, S. Electron beam powder bed fusion of copper components: A review of mechanical properties and research opportunities. Int. J. Adv. Manuf. Technol. 2022, 122, 513–532. [Google Scholar] [CrossRef]
  14. Milton, S.; Rigo, O.; LeCorre, S.; Morandeau, A.; Siriki, R.; Bocher, P.; Leroy, R. Microstructure effects on the machinability behaviour of Ti6Al4V produced by Selective Laser Melting and Electron Beam Melting process. Mater. Sci. Eng. 2021, 823, 141773. [Google Scholar] [CrossRef]
  15. Williams, R.J.; Piglione, A.; Rønneberg, T.; Jones, C.; Pham, M.S.; Davies, C.M.; Hooper, P.A. In situ thermography for laser powder bed fusion: Effects of layer temperature on porosity, microstructure and mechanical properties. Addit. Manuf. 2019, 30, 100880. [Google Scholar] [CrossRef]
  16. Mohr, G.; Scheuschner, N.; Hilgenberg, K. In situ heat accumulation by geometrical features obstructing heat flux and by reduced inter layer times in laser powder bed fusion of AISI 316L stainless steel. Procedia CIRP 2020, 94, 155–160. [Google Scholar] [CrossRef]
  17. Munk, J.; Breitbarth, E.; Siemer, T.; Pirch, N.; Häfner, C. Geometry effect on microstructure and mechanical properties in laser powder bed fusion of Ti-6Al-4V. Metals 2022, 12, 482. [Google Scholar] [CrossRef]
  18. Paulson, N.H.; Gould, B.; Wolff, S.J.; Stan, M.; Greco, A.C. Correlations between thermal history and keyhole porosity in laser powder bed fusion. Addit. Manuf. 2020, 34, 101213. [Google Scholar] [CrossRef]
  19. Yavari, R.; Smoqi, Z.; Riensche, A.; Bevans, B.; Kobir, H.; Mendoza, H.; Song, H.; Cole, K.; Rao, P. Part-scale thermal simulation of laser powder bed fusion using graph theory: Effect of thermal history on porosity, microstructure evolution, and recoater crash. Mater. Des. 2021, 204, 109685. [Google Scholar] [CrossRef]
  20. Ogoke, F.; Farimani, A.B. Thermal control of laser powder bed fusion using deep reinforcement learning. Addit. Manuf. 2021, 46, 102033. [Google Scholar] [CrossRef]
  21. Hagen, J.F.; Rasch, M.; Kohl, S.; Schmidt, M. Geometry dependent microstructures: Bug or feature? Procedia CIRP 2018, 74, 724–727. [Google Scholar] [CrossRef]
  22. Wang, Q.; Michaleris, P.P.; Nassar, A.R.; Irwin, J.E.; Ren, Y.; Stutzman, C.B. Model-based feedforward control of laser powder bed fusion additive manufacturing. Addit. Manuf. 2020, 31, 100985. [Google Scholar] [CrossRef]
  23. Druzgalski, C.L.; Ashby, A.; Guss, G.; King, W.E.; Roehling, T.T.; Matthews, M.J. Process optimization of complex geometries using feed forward control for laser powder bed fusion additive manufacturing. Addit. Manuf. 2020, 34, 101169. [Google Scholar] [CrossRef]
  24. Riensche, A.; Bevans, B.D.; Smoqi, Z.; Yavari, R.; Krishnan, A.; Gilligan, J.; Piercy, N.; Cole, K.; Rao, P. Feedforward control of thermal history in laser powder bed fusion: Toward physics-based optimization of processing parameters. Mater. Des. 2022, 224, 111351. [Google Scholar] [CrossRef]
  25. Nguyen, H.D.; Pramanik, A.; Basak, A.K.; Dong, Y.; Prakash, C.; Debnath, S.; Buddhi, D. A critical review on additive manufacturing of Ti-6Al-4V alloy: Microstructure and mechanical properties. J. Mater. Res. Technol. 2022, 18, 4661. [Google Scholar] [CrossRef]
  26. Yadroitsev, I.; Krakhmalev, P.; Yadroitsava, I. Selective laser melting of Ti6Al4V alloy for biomedical applications: Temperature monitoring and microstructural evolution. J. Alloys Compd. 2014, 583, 404–409. [Google Scholar] [CrossRef]
  27. Liu, S.; Shin, Y.C. Additive manufacturing of Ti6Al4V alloy: A review. Mater. Des. 2019, 164, 107552. [Google Scholar] [CrossRef]
  28. Dareh Baghi, A.; Nafisi, S.; Ebendorff-Heidepriem, H.; Ghomashchi, R. Microstructural Development of Ti-6Al-4V Alloy via Powder Metallurgy and Laser Powder Bed Fusion. Metals 2022, 12, 1462. [Google Scholar] [CrossRef]
  29. Thijs, L.; Verhaeghe, F.; Craeghs, T.; Van Humbeeck, J.; Kruth, J.P. A study of the microstructural evolution during selective laser melting of Ti–6Al–4V. Acta Mater. 2010, 58, 3303–3312. [Google Scholar] [CrossRef]
  30. Khorasani, A.; Gibson, I.; Awan, U.S.; Ghaderi, A. The effect of SLM process parameters on density, hardness, tensile strength and surface quality of Ti-6Al-4V. Addit. Manuf. 2019, 25, 176–186. [Google Scholar] [CrossRef]
  31. Cepeda-Jiménez, C.M.; Potenza, F.; Magalini, E.; Luchin, V.; Molinari, A.; Pérez-Prado, M.T. Effect of energy density on the microstructure and texture evolution of Ti-6Al-4V manufactured by laser powder bed fusion. Mater. Charact. 2020, 163, 110238. [Google Scholar] [CrossRef]
  32. Pirozzi, C.; Franchitti, S.; Borrelli, R.; Diodati, G.; Vattasso, G. Experimental study on the porosity of electron beam melting-manufactured Ti6Al4V. J. Mater. Eng. Perform. 2019, 28, 2649–2660. [Google Scholar] [CrossRef]
  33. Silvestri, A.T.; Foglia, S.; Borrelli, R.; Franchitti, S.; Pirozzi, C.; Astarita, A. Electron beam melting of Ti6Al4V: Role of the process parameters under the same energy density. J. Manuf. Process. 2020, 60, 162–179. [Google Scholar] [CrossRef]
  34. Davids, W.J.; Chen, H.; Nomoto, K.; Wang, H.; Babu, S.; Primig, S.; Liao, X.; Breen, A.; Ringer, S.P. Phase transformation pathways in Ti-6Al-4V manufactured via electron beam powder bed fusion. Acta Mater. 2021, 215, 117131. [Google Scholar] [CrossRef]
  35. Pobel, C.R.; Arnold, C.; Osmanlic, F.; Fu, Z.; Körner, C. Immediate development of processing windows for selective electron beam melting using layerwise monitoring via backscattered electron detection. Mater. Lett. 2019, 249, 70–72. [Google Scholar] [CrossRef]
  36. Cao, S.; Chu, R.; Zhou, X.; Yang, K.; Jia, Q.; Lim, C.V.S.; Huang, A.; Wu, X. Role of martensite decomposition in tensile properties of selective laser melted Ti-6Al-4V. J. Alloys Compd. 2018, 744, 357–363. [Google Scholar] [CrossRef]
  37. Vrancken, B.; Thijs, L.; Kruth, J.P.; Van Humbeeck, J. Heat treatment of Ti6Al4V produced by Selective Laser Melting: Microstructure and mechanical properties. J. Alloys Compd. 2012, 541, 177–185. [Google Scholar] [CrossRef]
  38. Khorasani, A.; Gibson, I.; Goldberg, M.; Littlefair, G. On the role of different annealing heat treatments on mechanical properties and microstructure of selective laser melted and conventional wrought Ti-6Al-4V. Rapid Prototyp. J. 2017, 23, 295–304. [Google Scholar] [CrossRef]
  39. Lekoadi, P.; Tlotleng, M.; Annan, K.; Maledi, N.; Masina, B. Evaluation of heat treatment parameters on microstructure and hardness properties of high-speed selective laser melted Ti6Al4V. Metals 2021, 11, 255. [Google Scholar] [CrossRef]
  40. Wu, S.Q.; Lu, Y.J.; Gan, Y.L.; Huang, T.T.; Zhao, C.Q.; Lin, J.J.; Guo, X.; Lin, J.X. Microstructural evolution and microhardness of a selective-laser-melted Ti–6Al–4V alloy after post heat treatments. J. Alloys Compd. 2016, 672, 643–652. [Google Scholar] [CrossRef]
  41. Zhao, Z.Y.; Li, L.; Bai, P.K.; Jin, Y.; Wu, L.Y.; Li, J.; Guan, R.G.; Qu, H.Q. The heat treatment influence on the microstructure and hardness of TC4 titanium alloy manufactured via selective laser melting. Materials 2018, 11, 1318. [Google Scholar] [CrossRef]
  42. Ali, H.; Ma, L.; Ghadbeigi, H.; Mumtaz, K. In-situ residual stress reduction, martensitic decomposition and mechanical properties enhancement through high temperature powder bed pre-heating of Selective Laser Melted Ti6Al4V. Mater. Sci. Eng. 2017, 695, 211–220. [Google Scholar] [CrossRef]
  43. Motyka, M. Martensite formation and decomposition during traditional and AM processing of two-phase titanium alloys—An overview. Metals 2021, 11, 481. [Google Scholar] [CrossRef]
  44. Xu, W.; Brandt, M.; Sun, S.; Elambasseril, J.; Liu, Q.; Latham, K.; Xia, K.; Qian, M. Additive manufacturing of strong and ductile Ti–6Al–4V by selective laser melting via in situ martensite decomposition. Acta Mater. 2015, 85, 74–84. [Google Scholar] [CrossRef]
  45. Xu, W.; Sun, S.; Elambasseril, J.; Liu, Q.; Brandt, M.; Qian, M. Ti-6Al-4V additively manufactured by selective laser melting with superior mechanical properties. JOM 2015, 67, 668–673. [Google Scholar] [CrossRef]
  46. Zhang, M.; Yang, Y.; Wang, D.; Xiao, Z.; Song, C.; Weng, C. Effect of heat treatment on the microstructure and mechanical properties of Ti6Al4V gradient structures manufactured by selective laser melting. Mater. Sci. Eng. A 2018, 736, 288–297. [Google Scholar] [CrossRef]
  47. Formanoir, C.D.; Michotte, S.; Godino, M.; Godet, S. Titanium Alloy (Ti-6Al-4V) Processed by Electron Beam Melting: Microstructure and Mechanical Behavior of the As-Built and Heat-Treated Material. In Proceedings of the 13th World Conference on Titanium, San Diego, CA, USA, 16–20 August 2016; pp. 1389–1394. [Google Scholar]
  48. Yang, X.; Barrett, R.A.; Tong, M.; Harrison, N.M.; Leen, S.B. Prediction of microstructure evolution for additive manufacturing of Ti-6Al-4V. Procedia Manuf. 2020, 47, 1178–1183. [Google Scholar] [CrossRef]
  49. Yang, X.; Barrett, R.A.; Harrison, N.M.; Leen, S.B. A physically-based structure-property model for additively manufactured Ti-6Al-4V. Mater. Des. 2021, 205, 109709. [Google Scholar] [CrossRef]
  50. Yang, X.; Barrett, R.A.; Tong, M.; Harrison, N.M.; Leen, S.B. Towards a process-structure model for Ti-6Al-4V during additive manufacturing. J. Manuf. Process. 2021, 61, 428–439. [Google Scholar] [CrossRef]
  51. Burkhardt, C.; Steinmann, P.; Mergheim, J. Thermo-mechanical simulations of powder bed fusion processes: Accuracy and efficiency. Adv. Model. Simul. Eng. Sci. 2022, 9, 1–31. [Google Scholar] [CrossRef]
  52. Nitzler, J.; Meier, C.; Müller, K.W.; Wall, W.A.; Hodge, N.E. A novel physics-based and data-supported microstructure model for part-scale simulation of laser powder bed fusion of Ti-6Al-4V. Adv. Model. Simul. Eng. Sci. 2021, 8, 1–39. [Google Scholar] [CrossRef]
  53. Bayat, M.; Klingaa, C.G.; Mohanty, S.; De Baere, D.; Thorborg, J.; Tiedje, N.S.; Hattel, J.H. Part-scale thermo-mechanical modelling of distortions in Laser Powder Bed Fusion—Analysis of the sequential flash heating method with experimental validation. Addit. Manuf. 2020, 36, 142–149. [Google Scholar] [CrossRef]
  54. Cunningham, R.; Nicolas, A.; Madsen, J.; Fodran, E.; Anagnostou, E.; Sangid, M.D.; Rollet, A.D. Analyzing the effects of powder and post-processing on porosity and properties of electron beam melted Ti-6Al-4V. Mater. Res. Lett. 2017, 5, 516–525. [Google Scholar] [CrossRef]
  55. Rausch, A.M.; Markl, M.; Körner, C. Predictive simulation of process windows for powder bed fusion additive manufacturing: Influence of the powder size distribution. Comput. Math. Appl. 2019, 78, 2351–2359. [Google Scholar] [CrossRef]
  56. Chu, F.; Zhang, K.; Shen, H.; Liu, M.; Huang, W.; Zhang, X.; Liang, E.; Zhou, Z.; Lei, L.; Hou, J.; et al. Influence of satellite and agglomeration of powder on the processability of AlSi10Mg powder in Laser Powder Bed Fusion. J. Mater. Res. Technol. 2021, 11, 2059–2073. [Google Scholar] [CrossRef]
  57. Kasperovich, G.; Haubrich, J.; Gussone, J.; Requena, G. Correlation between porosity and processing parameters in TiAl6V4 produced by selective laser melting. Mater. Des. 2016, 105, 160–170. [Google Scholar] [CrossRef]
  58. Bayat, M.; Thanki, A.; Mohanty, S.; Witvrouw, A.; Yang, S.; Thorborg, J.; Tiedje, N.S.; Hattel, J.H. Keyhole-induced porosities in Laser-based Powder Bed Fusion (L-PBF) of Ti6Al4V: High-fidelity modelling and experimental validation. Addit. Manuf. 2019, 30, 100835. [Google Scholar] [CrossRef]
  59. King, W.E.; Barth, H.D.; Castillo, V.M.; Gallegos, G.F.; Gibbs, J.W.; Hahn, D.E.; Kamath, C.; Rubenchik, A.M. Observation of keyhole-mode laser melting in laser powder-bed fusion additive manufacturing. J. Mater. Process. Technol. 2014, 214, 2915–2925. [Google Scholar] [CrossRef]
  60. Kaoushik, V.M.; Nichul, U.; Chavan, V.; Hiwarkar, V. Development of microstructure and high hardness of Ti6Al4V alloy fabricated using laser beam powder bed fusion: A novel sub-transus heat treatment approach. J. Alloys Compd. 2023, 937, 168387. [Google Scholar] [CrossRef]
  61. Sharma, H.; Parfitt, D.; Syed, A.K.; Wimpenny, D.; Muzangaza, E.; Baxter, G.; Chen, B. A critical evaluation of the microstructural gradient along the build direction in electron beam melted Ti-6Al-4V alloy. Mater. Sci. Eng. A 2019, 744, 182–194. [Google Scholar] [CrossRef]
Figure 1. (a) Geometry and dimension of the PBF-LB/M part. The part is composed of a core (gray) and overhang (orange) region with different parameter sets. (b) Three-dimensional illustration of the part. (c) Finished part.
Jmmp 07 00082 g001
Figure 2. The measured inter-layer temperature of the surface for the PBF-LB/M part is plotted against the build height and part radius.
Jmmp 07 00082 g002
Figure 3. Qualitative comparison of the simulated inter-layer temperature (sim. ϑ inter ) and the experimental measurement (exp. ϑ inter ) up to a building height of 32.5 mm. Note the different ordinates for the simulation and the experimental measurement.
Jmmp 07 00082 g003
Figure 4. (a) Gray value volume of the PBF-LB/M part as well as an overview of the polished longitudinal cross-section (b) and detailed images of the cylindric (c) and conic shapes (d).
Jmmp 07 00082 g004
Figure 5. Comparison of the polished longitudinal cross-sections of the first third of the PBF-LB/M (a) part and the whole PBF-EB (b) part. Furthermore, the relative part density measured for selected areas is given.
Jmmp 07 00082 g005
Figure 6. Porosity measured via X-ray computed to tomography along the build for the LB part (a) and a comparison between the LB and EBM parts (b).
Jmmp 07 00082 g006
Figure 7. (a) Simulated temperature at point A over time, see (c,d) for its location. (b) Phase fractions at point A over time. (c) Resulting martensite phase fraction X α m distribution in the xz plane. (d) Resulting stable alpha phase fraction X α s distribution in the xz plane.
Jmmp 07 00082 g007
Figure 8. Microstructure evolution along the build height for the first third of the PBF-LB part. Overview micrograph with the thermal history (a) and the microstructure for the conic (b) and cylindric sections (c).
Jmmp 07 00082 g008
Figure 9. Comparison of the microstructure between the bottom (a) and top (b) conic section areas.
Jmmp 07 00082 g009
Figure 10. Comparison of the microstructure between the EBM and LB parts for the conic (a,b) and cylindric sections (c,d).
Jmmp 07 00082 g010
Figure 11. Hardness of the PBF-LB/M part over the build height.
Jmmp 07 00082 g011
Figure 12. Comparison of hardness for the EBM and LB parts over build height.
Jmmp 07 00082 g012
Table 1. Used parameters for the PBF experiments.
Beam Power (W)Scanspeed (mm/s)Hatch Distance (µm)Layer Thickness (µm)
Laser Beam (Core)25090012050
Laser Beam (Overhang)17590012050
Electron Beam (Core)210–900 13200–12,000 1120100
Electron Beam (Supports)420--100
1 The process parameters were adjusted at various layers in the area of 100 J/m to account for the area increase due to the specimen geometry.
Disclaimer/Publisher’s Note: The statements, opinions and data contained in all publications are solely those of the individual author(s) and contributor(s) and not of MDPI and/or the editor(s). MDPI and/or the editor(s) disclaim responsibility for any injury to people or property resulting from any ideas, methods, instructions or products referred to in the content.

