
Long-Term Assessment of the In Vitro Corrosion Resistance of Biomimetic ACP Coatings Electrodeposited from an Acetate Bath


Abstract
:1. Introduction
2. Materials and Methods
2.1. Substrate Preparation
2.2. ECAD of CaP Coatings
2.3. Materials Characterization
2.4. In Vitro Corrosion Resistance Measurements
2.5. Work Function Measurements
3. Results and Discussion
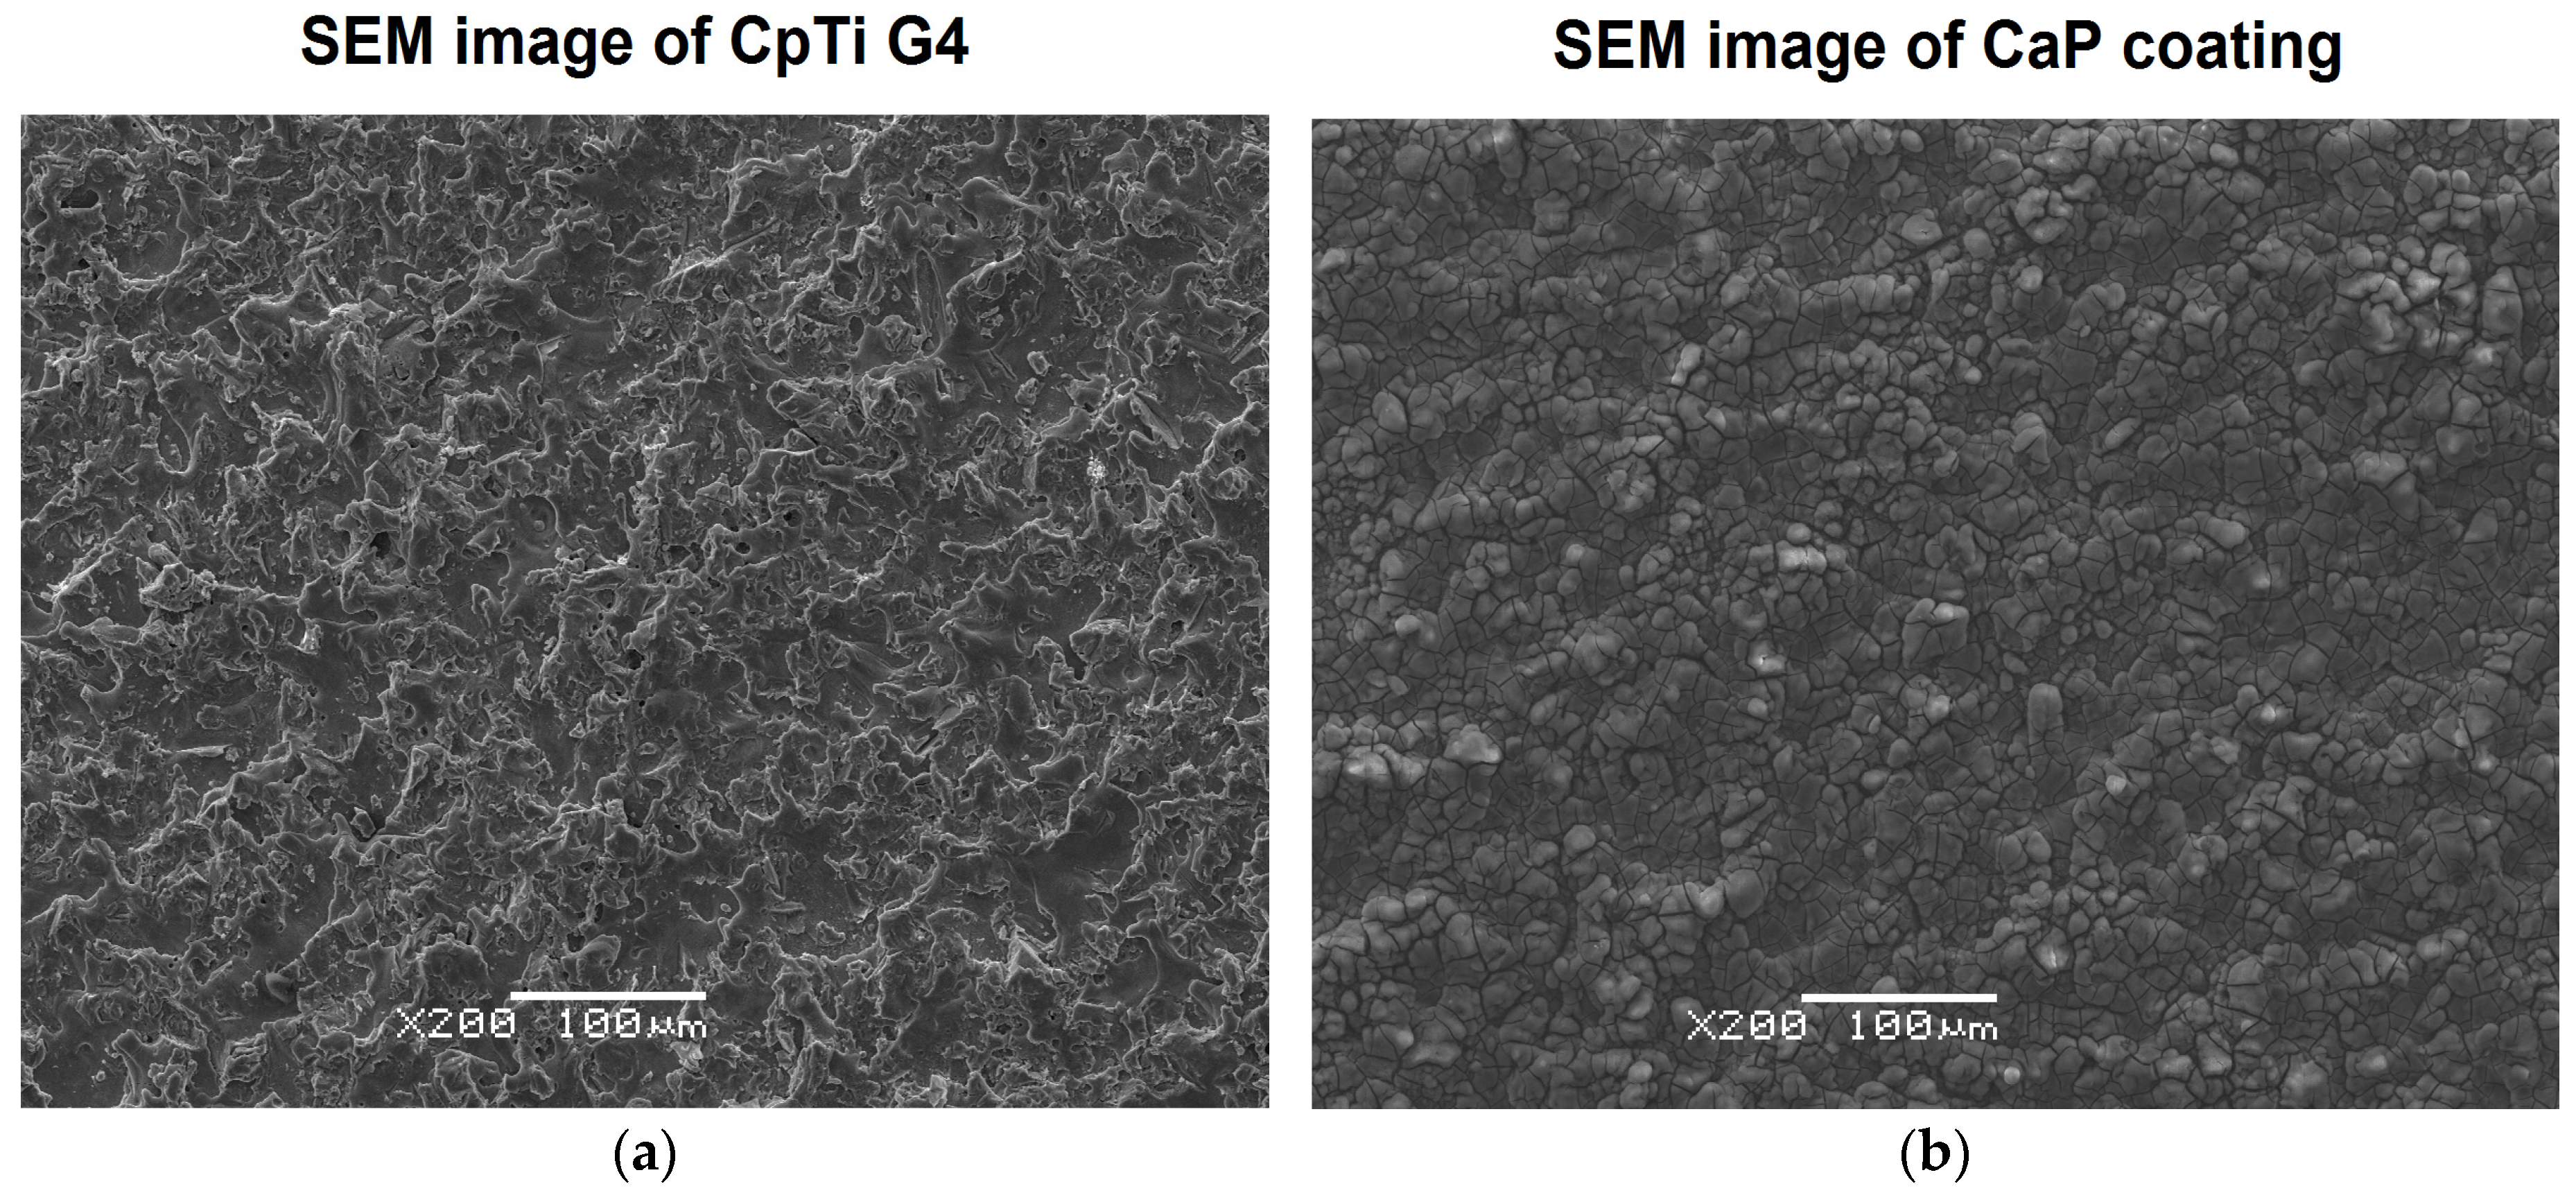
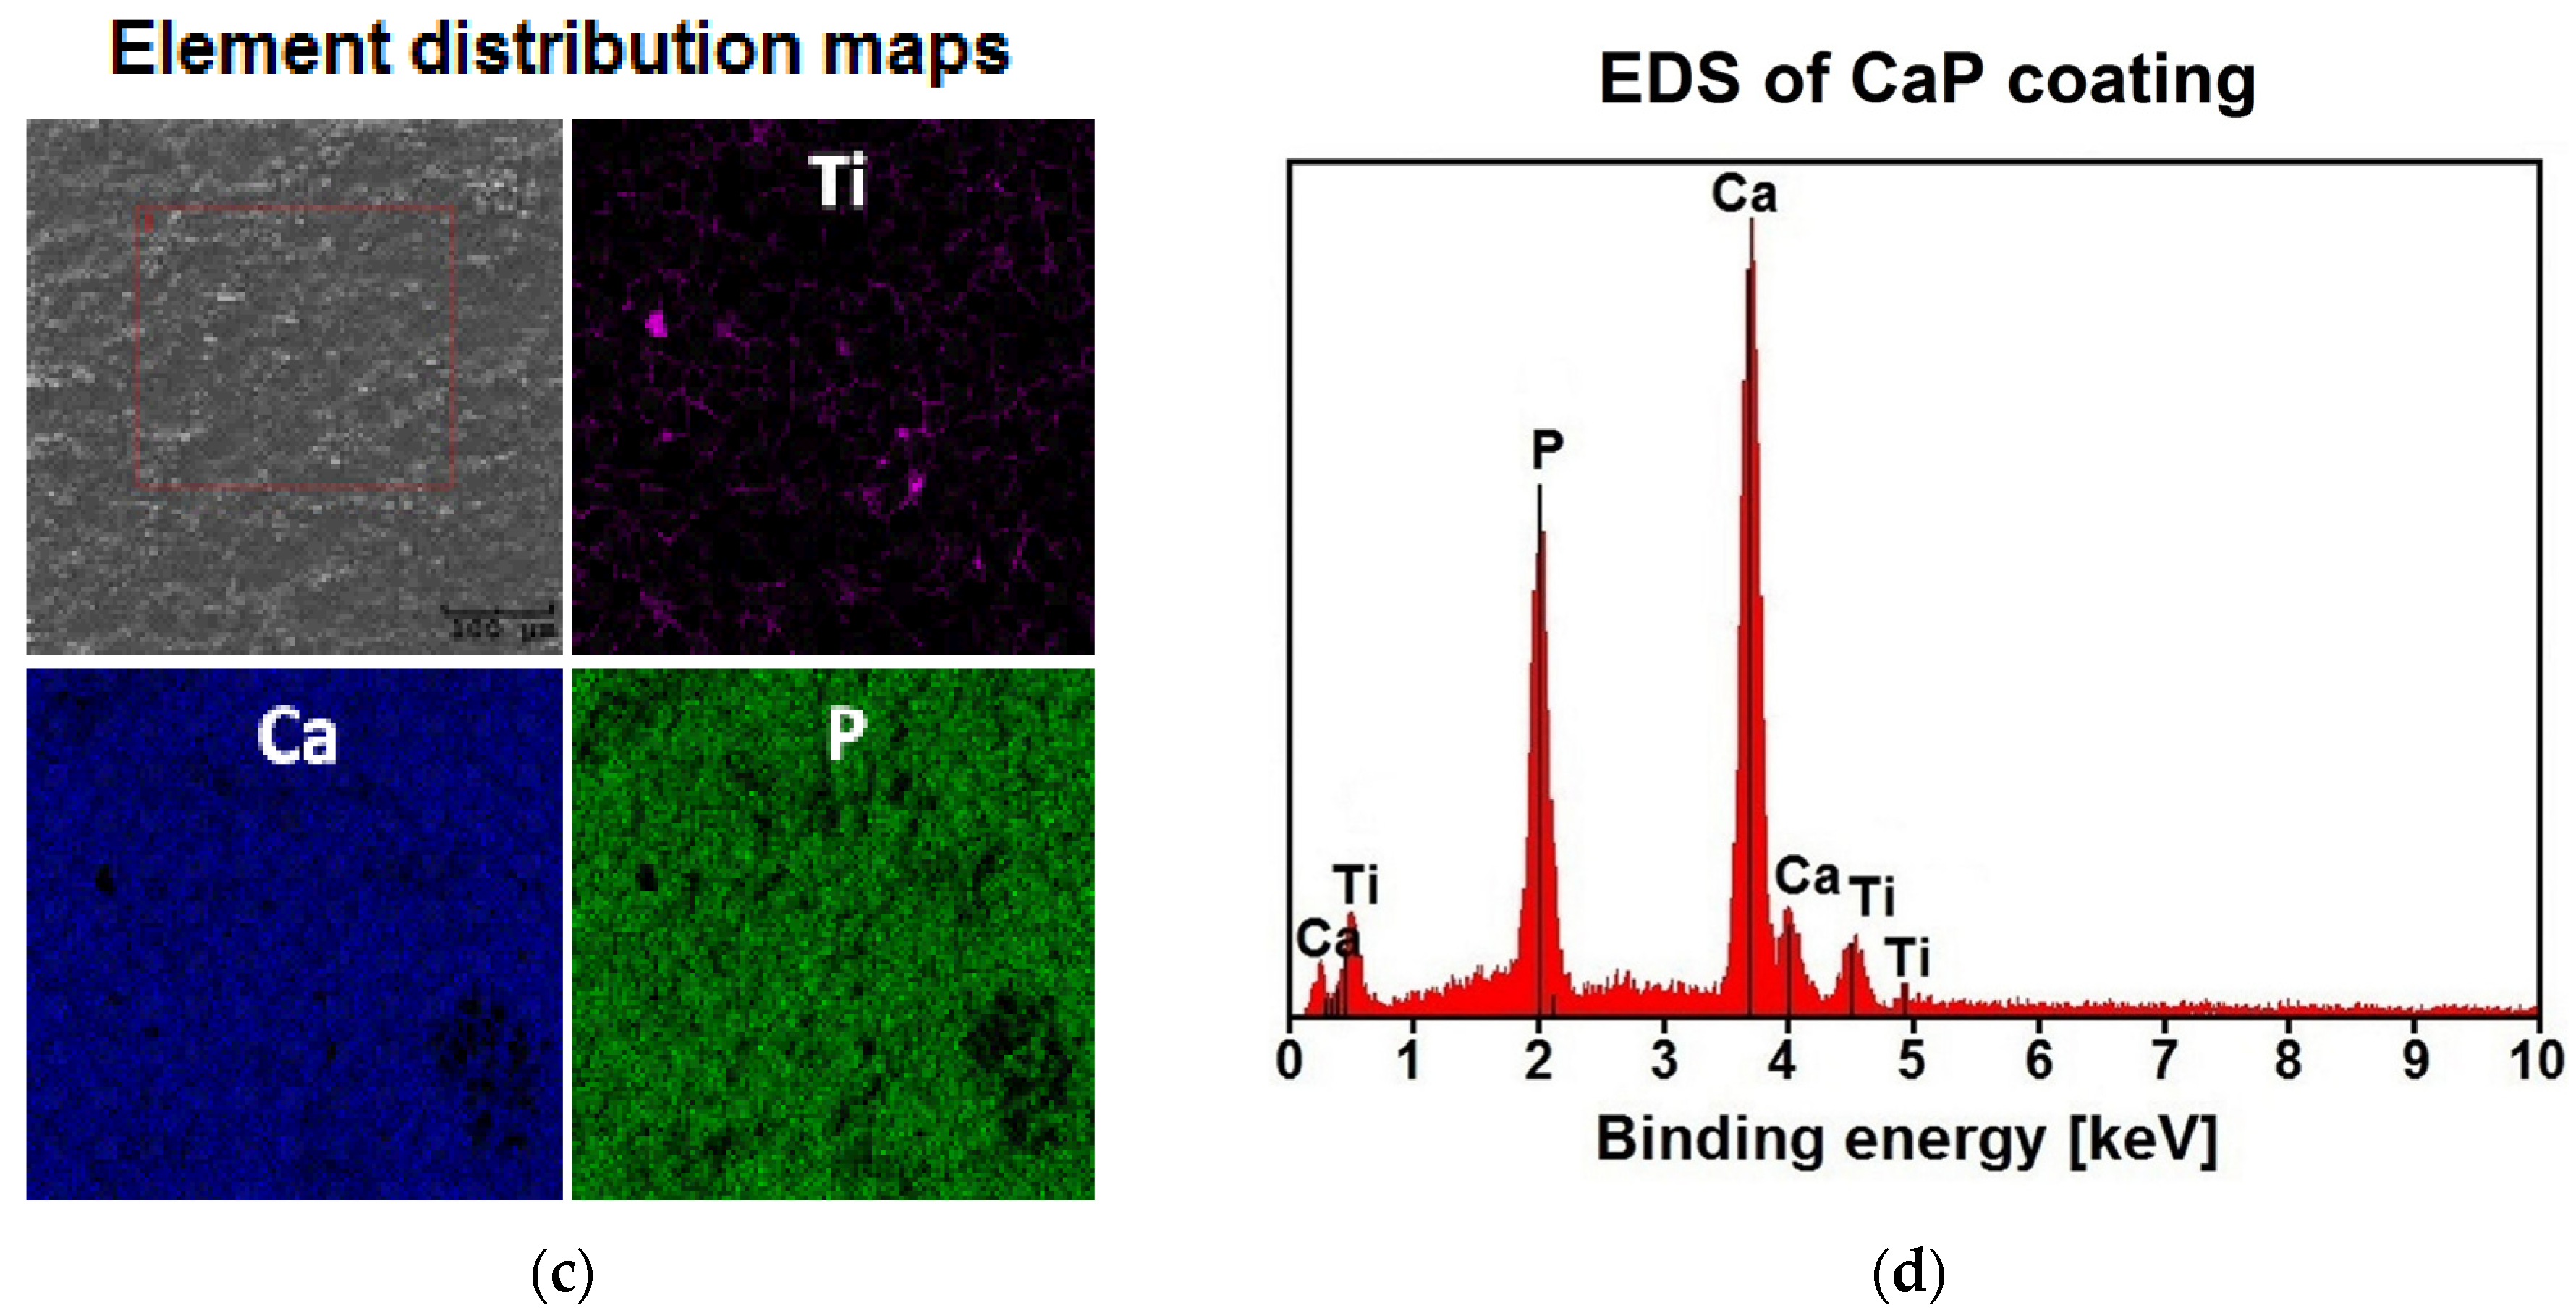
3.1. Microstructure Study
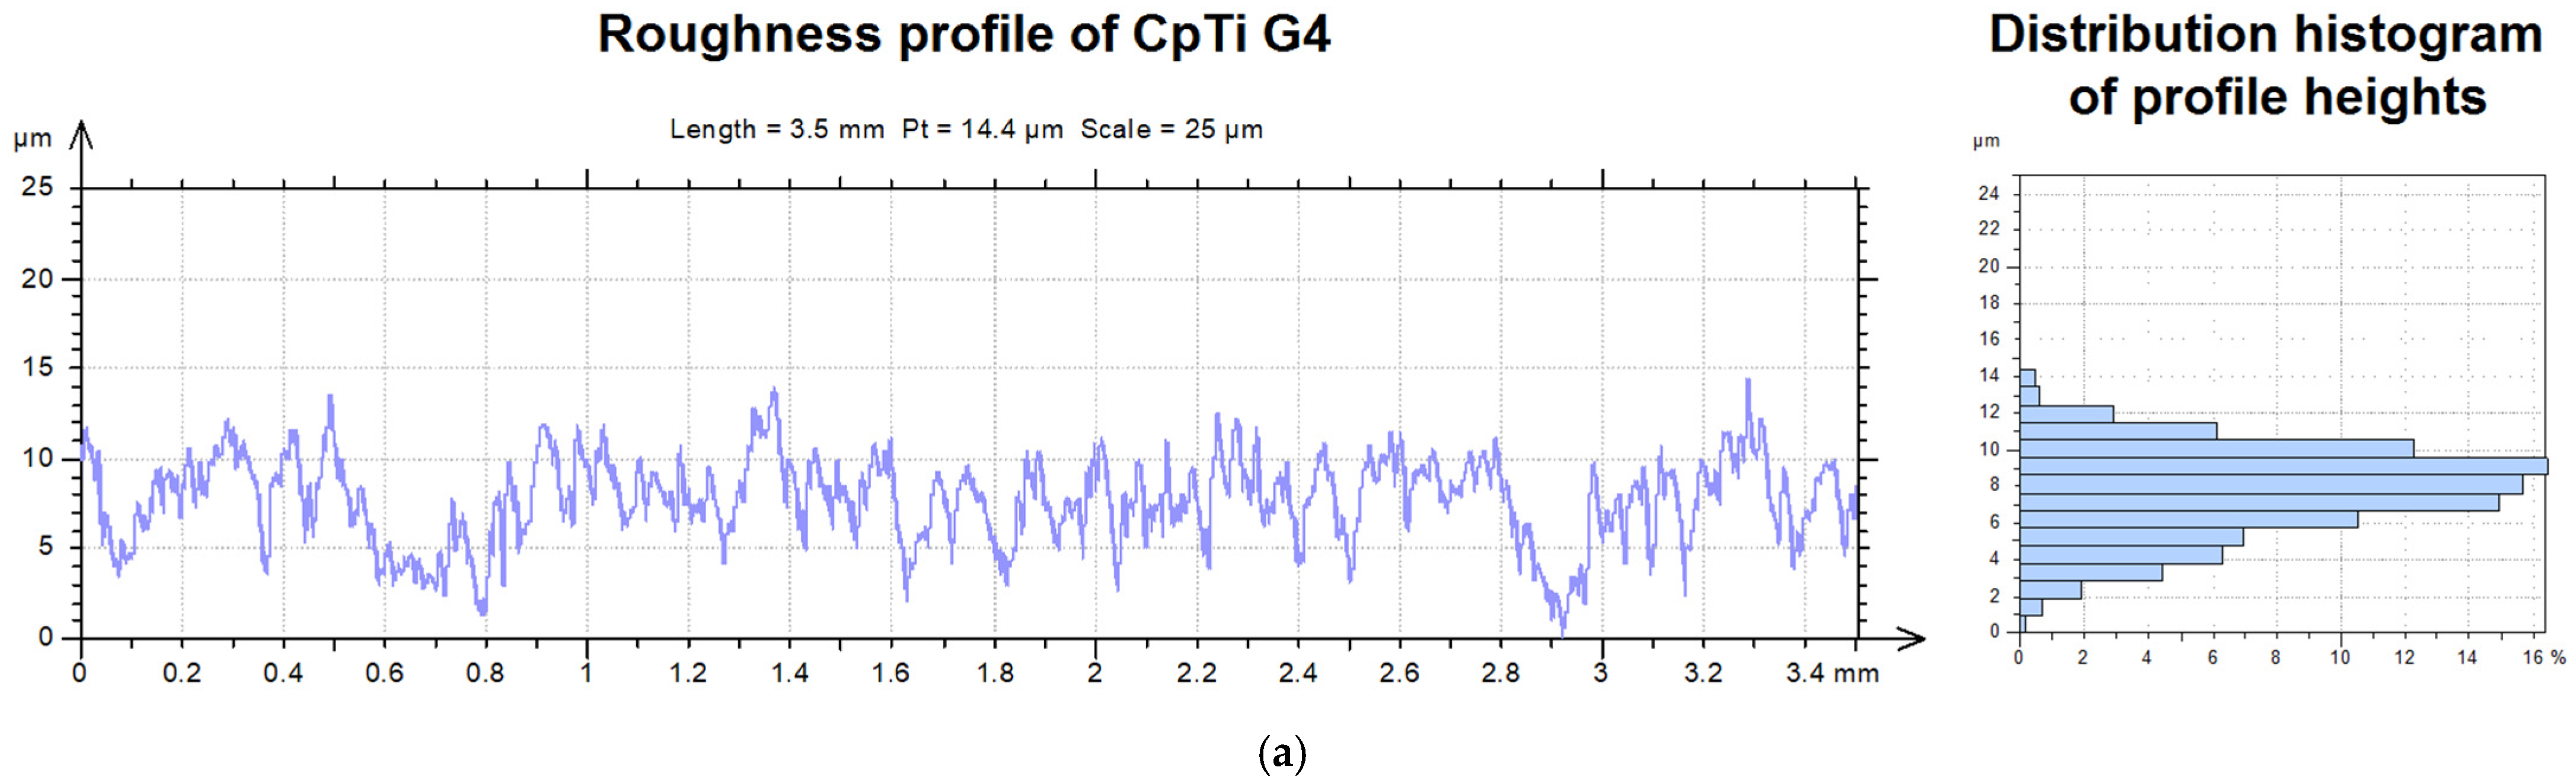
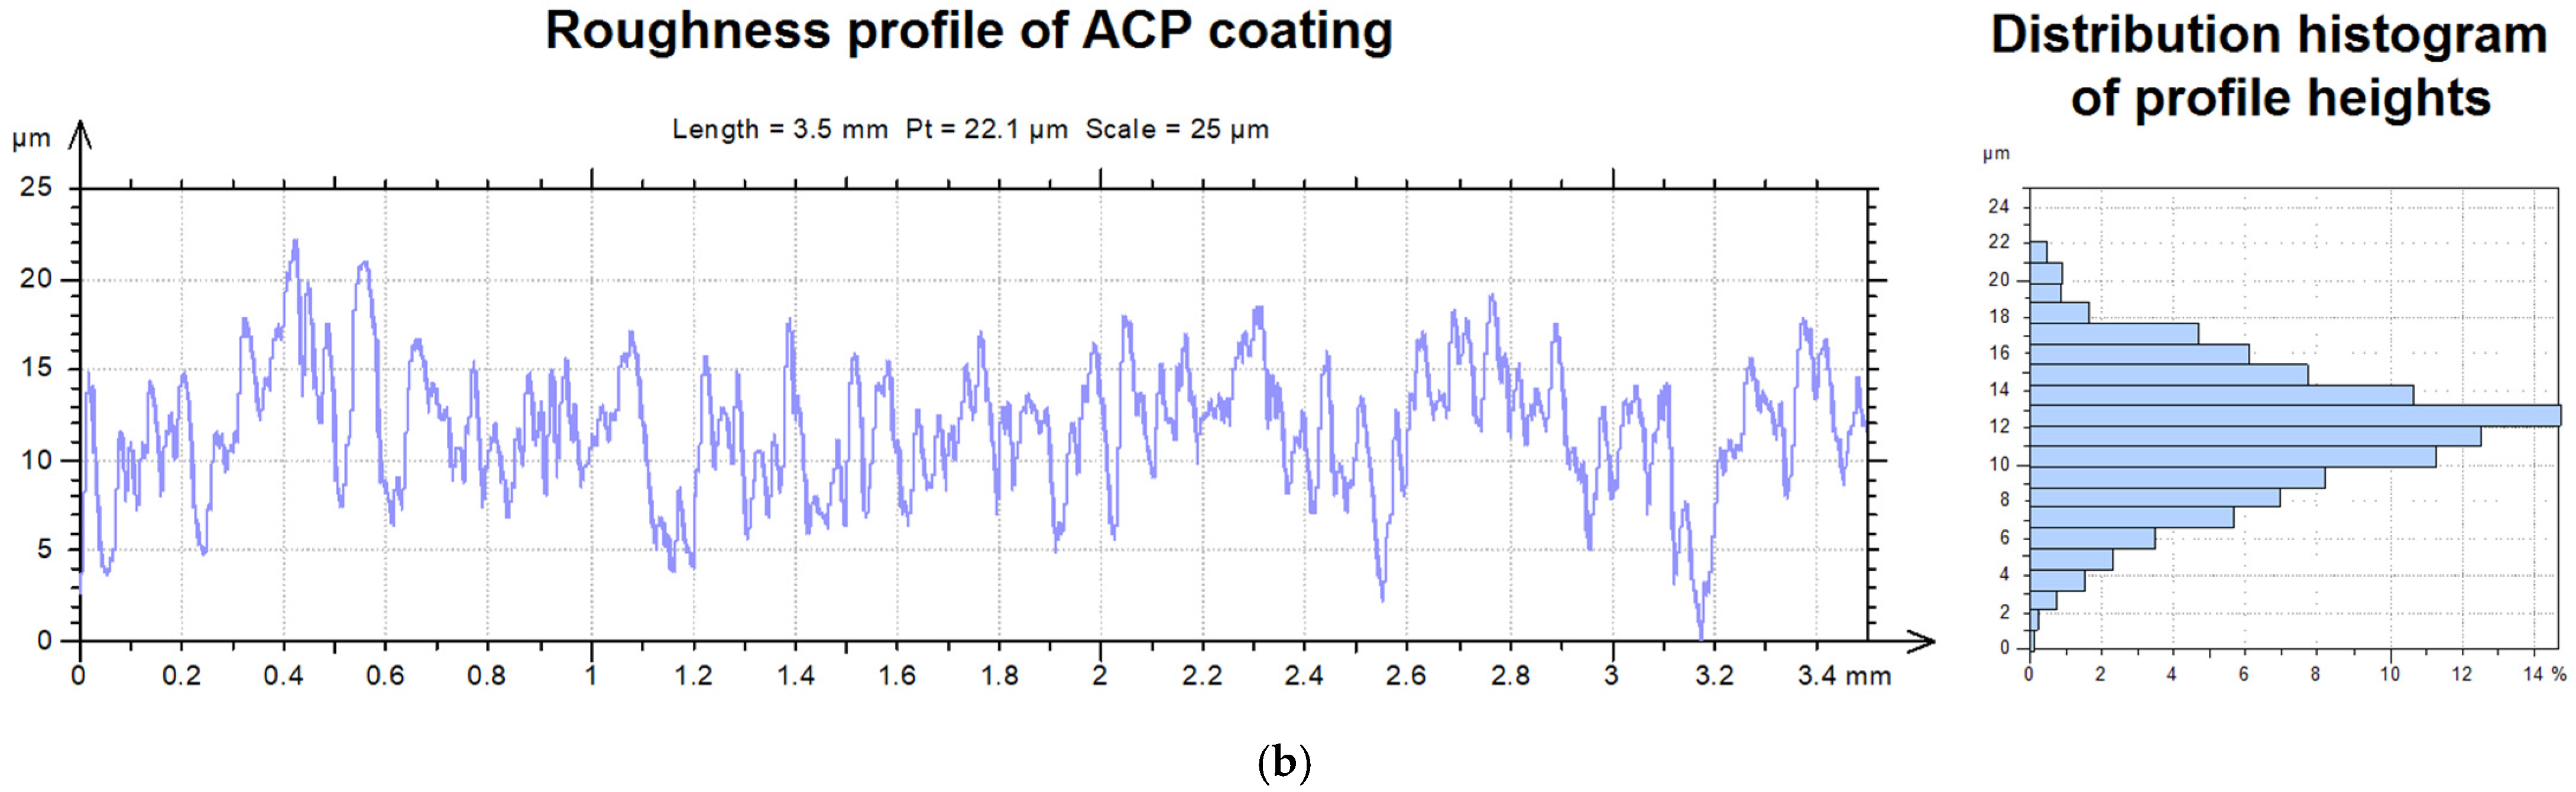
3.2. Surface Roughness Study
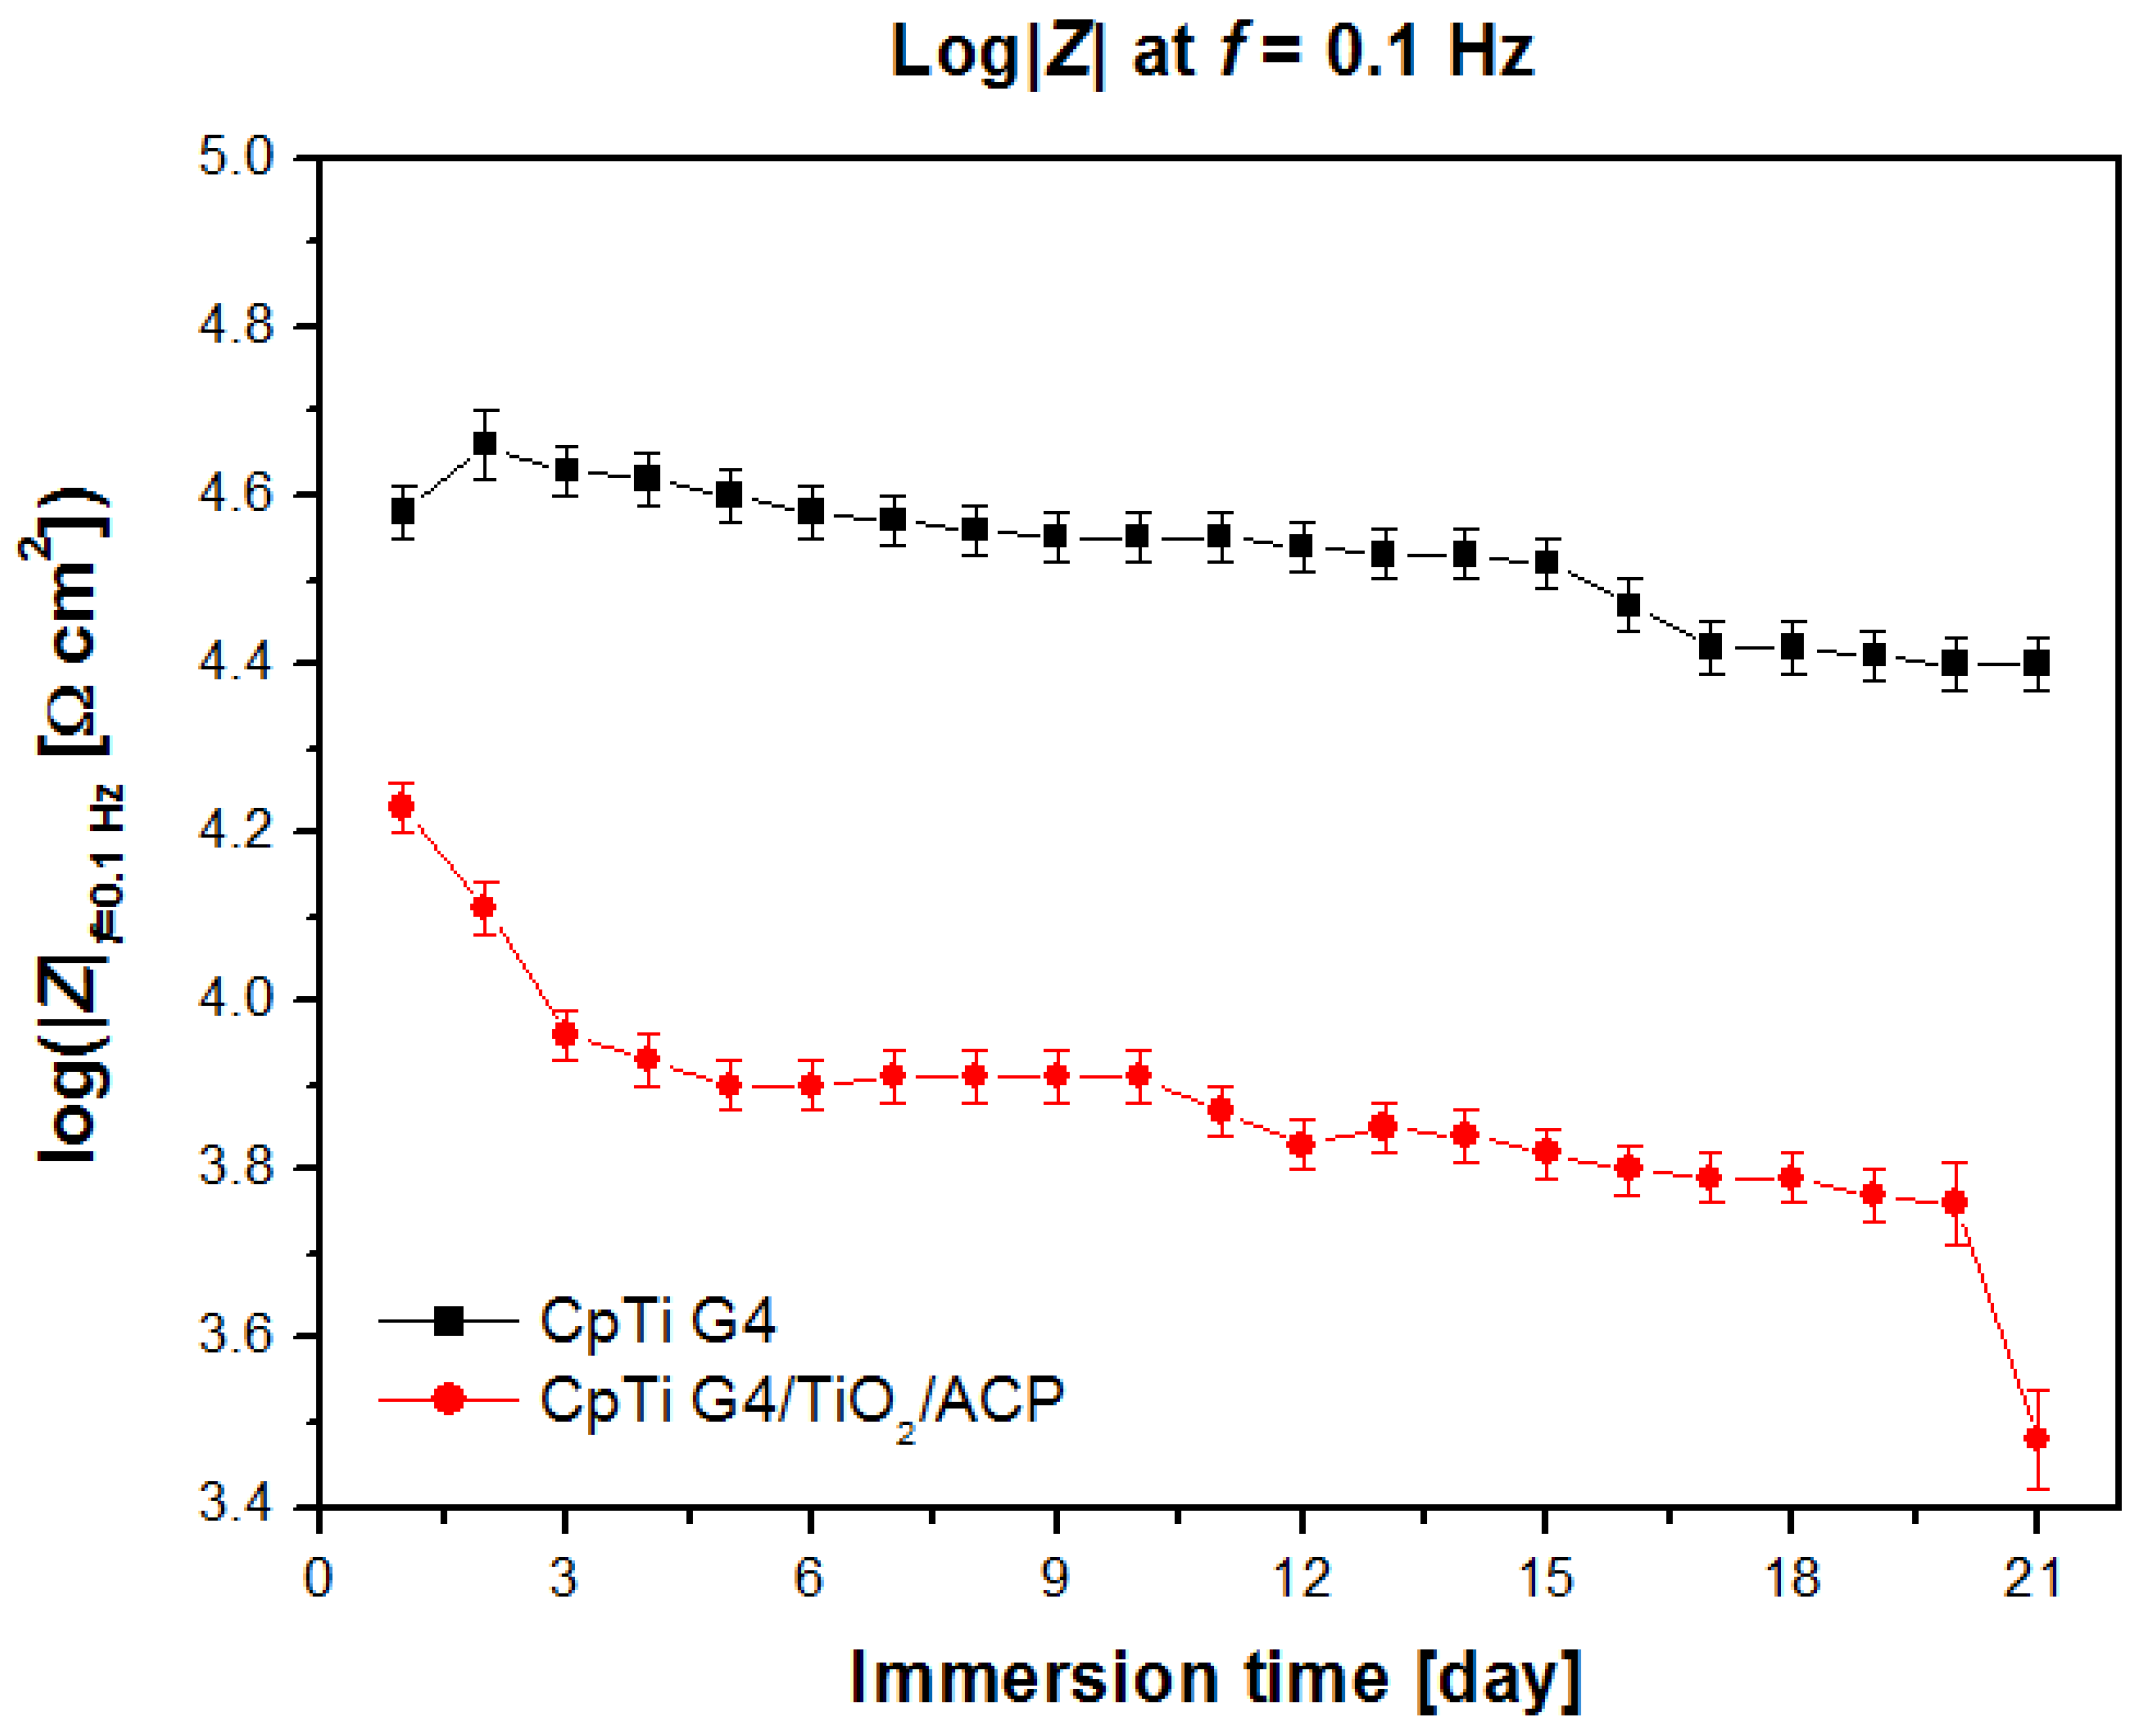
3.3. Electrochemical Impedance Spectroscopy Study
3.4. Anodic Polarization Curves Study
3.5. Work Function Study
4. Conclusions
Author Contributions
Funding
Institutional Review Board Statement
Informed Consent Statement
Data Availability Statement
Acknowledgments
Conflicts of Interest
References
- Gilbert, J.L. Electrochemical Behavior of Metals in the Biological Milieu. In Comprehensive Biomaterials II, 2nd ed.; Elsevier: Amsterdam, The Netherlands, 2017; pp. 19–49. [Google Scholar] [CrossRef]
- Prasad, S.; Ehrensberger, M.; Gibson, M.P.; Kim, H.; Monaco, E.A., Jr. Biomaterial Properties of Titanium in Dentistry. J. Oral Biosci. 2015, 57, 192–199. [Google Scholar] [CrossRef] [Green Version]
- Kirmanidou, Y.; Sidira, M.; Drosou, M.-E.; Bennani, V.; Bakopoulou, A.; Tsouknidas, A.; Michailidis, N.; Michalakis, K. New Ti-Alloys and Surface Modifications to Improve the Mechanical Properties and the Biological Response to Orthopedic and Dental Implants: A Review. BioMed Res. Int. 2016, 2016, 1–21. [Google Scholar] [CrossRef] [Green Version]
- Ninomi, M. Recent Research and Development in Titanium Alloys for Biomedical Aplications and Health Care Goods. Sci. Technol. Adv. Mater. 2003, 4, 445–454. [Google Scholar] [CrossRef] [Green Version]
- Jokstad, A.; Braegger, U.; Brunski, J.B.; Carr, A.B.; Naert, I.; Wennerberg, A. Quality of Dental Implants. Int. Dent. J. 2003, 53, 409–443. [Google Scholar] [CrossRef] [PubMed]
- Guehennec, L.L.; Soueidan, A.; Layeolle, P.; Amourinq, Y. Surface Treatments of Titanium Dental Implants for Rapid Osseointegration. Dent. Mater. 2007, 23, 844–854. [Google Scholar] [CrossRef]
- Abrahamsson, I.; Zitzmann, N.U.; Berglundh, T.; Wennerberg, A.; Lindhe, J. Bone and Soft Tissue Integration to Titanium Implants with Different Surface Topography: An Experimental Study in the Dog. Int. J. Oral Maxillofac. Implants 2001, 16, 323–332. [Google Scholar]
- Youns-Seok, P.; Ki-Young, Y.; Chong-Hyun, H.; Young-Chul, J. The Effects of Ion Beam–Assisted Deposition of Hydroxyapatite on the Grit-Blasted Surface of Endosseous Implants in Rabbit Tibiae. Int. J. Oral Maxillofac. Implants 2005, 20, 31–38. [Google Scholar] [PubMed]
- Hu, Z.; Wang, X.; Xia, W.; Wang, Z.; Zhang, P.; Xia, L.; Lin, K.; Zhu, M. Nano-Structure Designing Promotion Osseointegration of Hydroxyapatite Coated Ti–6Al–4V Alloy Implants in Diabetic Model. J. Biomed. Nanotechnol. 2019, 15, 1701–1713. [Google Scholar] [CrossRef]
- İzmir, M.; Ercan, B. Anodization of titanium alloys for orthopedic applications. Front. Chem. Sci. Eng. 2019, 13, 28–45. [Google Scholar] [CrossRef]
- Dorozhkin, S.V. Functionalized Calcium Orthophosphates (CaPO4) and Their Biomedical Applications. J. Mater. Chem. B 2019, 7, 7471–7489. [Google Scholar] [CrossRef]
- Zhao, J.; Liu, Y.; Sun, W.; Yang, X. First Detection, Characterization, and Application of Amorphous Calcium Phosphate in Dentistry. J. Dent. Sci. 2012, 7, 316–323. [Google Scholar] [CrossRef] [Green Version]
- Zhang, F.; Allen, A.J.; Levine, L.E.; Vaudin, M.D.; Skrtic, D.; Antonucci, J.M.; Hoffman, K.M.; Giuseppetti, A.A.; Ilavsky, J. Structural and Dynamical Studies of Acid-Mediated Conversion in Amorphous-Calcium-Phosphate Based Dental Composites. Dent. Mater. 2014, 30, 1113–1125. [Google Scholar] [CrossRef] [Green Version]
- Combes, C.; Rey, C. Amorphous Calcium Phosphates: Synthesis, Properties and Uses in Biomaterials. Acta Biomater. 2010, 6, 3362–3378. [Google Scholar] [CrossRef] [Green Version]
- Gelli, R.; Ridi, F.; Baglioni, P. The Importance of Being Amorphous: Calcium and Magnesium Phosphates in the Human Body. Adv. Colloid Interface Sci. 2019, 269, 219–235. [Google Scholar] [CrossRef]
- Hu, C.; Ashok, D.; Nisbet, D.R.; Gautam, V. Bioinspired Surface Modification of Orthopedic Implants for Bone Tissue Engineering. Biomaterials 2019, 219, 119366. [Google Scholar] [CrossRef] [PubMed]
- Roblegg, E.; Coughran, A.; Sirjani, D. Saliva: An All-Rounder of Our Body. Eur. J. Pharm. Biopharm. 2019, 133–141. [Google Scholar] [CrossRef]
- Rodrigues Neves, C.; Buskermolen, J.; Roffel, S.; Waaijman, T.; Thon, M.; Veerman, E.; Gibbs, S. Human Saliva Stimulates Skin and Oral Wound Healing In Vitro. J. Tissue Eng. Regen. Med. 2019, 13, 1079–1092. [Google Scholar] [CrossRef] [Green Version]
- Marsh, P. Dental Plaque as a Biofilm and a Microbial Community—Implications for Health and Disease. BMC Oral Health 2006, 6, S14. [Google Scholar] [CrossRef] [PubMed] [Green Version]
- Marsh, P. Microbiology of Dental Plaque Biofilms and Their Role in Oral Health and Caries. Dent. Clin. 2010, 54, 441–454. [Google Scholar] [CrossRef]
- Fawcett, D.; Brundavanam, S.; Poinern, G.E.J. Growth and Corrosion Behaviour of Amorphous Micrometre Scale Calcium Phosphate Coatings on Magnesium Substrates. Int. J. Mater. Eng. 2015, 5, 10–16. [Google Scholar] [CrossRef]
- León, B.; Jansen, J. Thin Calcium Phosphate Coatings for Medical Implants; Springer Science+Business Media, LLC: New York, NY, USA, 2009; ISBN 978-0-387-77719-1. [Google Scholar]
- Osak, P.; Łosiewicz, B. EIS Study on Interfacial Properties of Passivated Nitinol Orthodontic Wire in Saliva Modified with Eludril® Mouthwash. Prot. Met. Phys. Chem. Surf. 2018, 54, 680–688. [Google Scholar] [CrossRef]
- Stróż, A.; Łosiewicz, B.; Zubko, M.; Chmiela, B.; Balin, K.; Dercz, G.; Gawlikowski, M.; Goryczka, T. Production, Structure and Biocompatible Properties of Oxide Nanotubes on Ti13Nb13Zr Alloy for Medical Applications. Mater. Charact. 2017, 132, 363–372. [Google Scholar] [CrossRef]
- Freitag, M.; Łosiewicz, B.; Goryczka, T.; Lelątko, J. Application of EIS to Study the Corrosion Resistance of Passivated NiTi Shape Memory Alloy in Simulated Body Fluid. Solid State Phenom. 2012, 183, 57–64. [Google Scholar] [CrossRef]
- Łosiewicz, B.; Popczyk, M.; Smołka, A.; Szklarska, M.; Osak, P.; Budniok, A. Localized Electrochemical Impedance Spectroscopy for Studying the Corrosion Processes in a Nanoscale. Solid State Phenom. 2015, 228, 383–393. [Google Scholar] [CrossRef]
- FEPA Standard 42-1. Macrogrits F4~F220 for Grains of Fused Aluminium Oxide, Silicon Carbide and Other Abrasive Materials for Bonded Abrasives; Federation of European Producers of Abrasive: Courbevoie, France, 2006. [Google Scholar]
- Łosiewicz, B.; Osak, P.; Maszybrocka, J.; Kubisztal, J.; Stach, S. Effect of Autoclaving Time on Corrosion Resistance of Sandblasted Ti G4 in Artificial Saliva. Materials 2020, 13, 4154. [Google Scholar] [CrossRef]
- ASTM F67-13. Standard Specification for Unalloyed Titanium, for Surgical Implant Applications (UNS R50250, UNS R50400, UNS R50550, UNS R50700); ASTM International: West Conshohocken, PA, USA, 2017. [Google Scholar]
- ISO 5832-2. Implants for Surgery—Metallic Materials—Part 2: Unalloyed Titanium; International Organization for Standardization: Geneva, Switzerland, 2018. [Google Scholar]
- ISO 4287. Geometrical Product Specifications (GPS)—Surface Texture: Profile Method—Terms, Definitions and 903 Surface Texture Parameters; International Organization for Standardization: Geneva, Switzerland, 1997. [Google Scholar]
- ISO 10271. Dentistry—Corrosion Test Methods for Metallic Materials; International Organization for Standardization: Geneva, Switzerland, 2011. [Google Scholar]
- Boukamp, B.A. A Linear Kronig-Kramers Transform Test for Immittance Data Validation. J. Electrochem. Soc. 1995, 142, 1885–1894. [Google Scholar] [CrossRef]
- Kubisztal, J.; Losiewicz, B.; Dybal, P.; Kozik, V.; Bak, A. Water-induced Corrosion Damage of Carbon Steel in Sulfolane. Energies 2020, 13, 4580. [Google Scholar] [CrossRef]
- Łosiewicz, B.; Osak, P.; Dercz, G.; Gierlotka, D.; Kubisztal, J. The Manner of Deposition of Bioactive Coating of Calcium Phosphate on Element Made of Titanium Alloy. Patent No. 233,784, 13 August 2019. The Patent Office of the Republic of Poland, Poland. [Google Scholar]
- Yazan, M.; Kocyigit, I.D.; Atil, F.; Tekin, U.; Gonen, Z.B.; Onder, M.E. Effect of Hyaluronic Acid on the Osseointegration of Dental Implants. Br. J. Oral Maxillofac. Surg. 2019, 57, 53–57. [Google Scholar] [CrossRef]
- Szklarska, M.; Łosiewicz, B.; Dercz, G.; Zubko, M.; Albrecht, R.; Stróż, D. Characterization of Long-Term Corrosion Performance of Ti15Mo Alloy in Saline Solution. Arch. Metall. Mater. 2019, 64, 773–778. [Google Scholar] [CrossRef]
- Golasiński, K.M.; Detsch, R.; Szklarska, M.; Łosiewicz, B.; Zubko, M.; Mackiewicz, S.; Pieczyska, E.A.; Boccaccini, A.R. Evaluation of Mechanical Properties, In Vitro Corrosion Resistance and Biocompatibility of Gum Metal in the Context of Implant Applications. J. Mech. Behav. Biomed. Mater. 2020, 115, 104289. [Google Scholar] [CrossRef] [PubMed]
- Dudek, K.; Dulski, M.; Łosiewicz, B. Functionalization of the NiTi Shape Memory Alloy Surface by HAp/SiO2/Ag Hybrid Coatings Formed on SiO2-TiO2 Glass Interlayer. Materials 2020, 13, 1648. [Google Scholar] [CrossRef] [PubMed] [Green Version]
- Szklarska, M.; Dercz, G.; Simka, W.; Łosiewicz, B. Ac Impedance Study on the Interfacial Properties of Passivated Ti13Zr13Nb Alloy in Physiological Saline Solution. Surf. Interface Anal. 2014, 46, 698–701. [Google Scholar] [CrossRef]
- Lasia, A. Electrochemical Impedance Spectroscopy and Its Applications; Springer Science+Business Media: New York, NY, USA, 2014; ISBN 978-1-4614-8932-0. [Google Scholar] [CrossRef]
- Osak, P.; Goryczka, T.; Łosiewicz, B. Effect of Polarization Scan Rate on the Pitting Potential of the Self-Passivated NiTi Shape Memory Alloy in a Simulated Body Fluid. Solid State Phenom. 2015, 227, 443–446. [Google Scholar] [CrossRef]


| Element | Concentration (at.%) | Standard Deviation |
|---|---|---|
| Ca | 45.932 | (0.970) |
| P | 30.920 | (0.660) |
| Ti | 23.148 | (0.878) |
| Immersion (Day) | R1 (Ω cm2) | CPE-T1 (F cm−2 sϕ−1) | CPE-ϕ1 | R2 (Ω cm2) |
|---|---|---|---|---|
| 1 | 184(1) | 3.03(33) × 10−5 | 0.834(30) | 2.52(47) × 106 |
| 2 | 184(1) | 3.53(63) × 10−5 | 0.830(24) | 8.42(71) × 105 |
| 7 | 185(1) | 3.44(74) × 10−5 | 0.780(26) | 4.18(11) × 105 |
| 14 | 187(2) | 3.51(40) × 10−5 | 0.779(25) | 1.42(29) × 105 |
| 21 | 185(1) | 4.19(13) × 10−5 | 0.740(45) | 9.30(90) × 104 |
| Immersion (Day) | R1 (Ω cm2) | CPE-T1 (F cm−2 sϕ−1) | CPE-ϕ1 | R2 (Ω cm2) | CPE-T2 (F cm−2 sϕ−1) | CPE-ϕ2 | R3 (Ω cm2) |
|---|---|---|---|---|---|---|---|
| 1 | 36(2) | 1.04(56) × 10−5 | 0.865(1) | 2.55(21) × 105 | – | – | – |
| 2 | 33(1) | 1.65(13) × 10−5 | 0.832(2) | 2.19(25) × 105 | – | – | – |
| 7 | 33(1) | 1.44(57) × 10−5 | 0.831(1) | 1.64(29) × 105 | – | – | – |
| 14 | 28(3) | 1.99(47) × 10−4 | 0.860(4) | 1.55(17) × 105 | 8.30(18) × 10−4 | 0.720(9) | 229(10) |
| 21 | 29(4) | 4.40(64) × 10−4 | 0.820(58) | 2.58(15) × 104 | 1.16(14) × 10−3 | 0.700(13) | 152(12) |
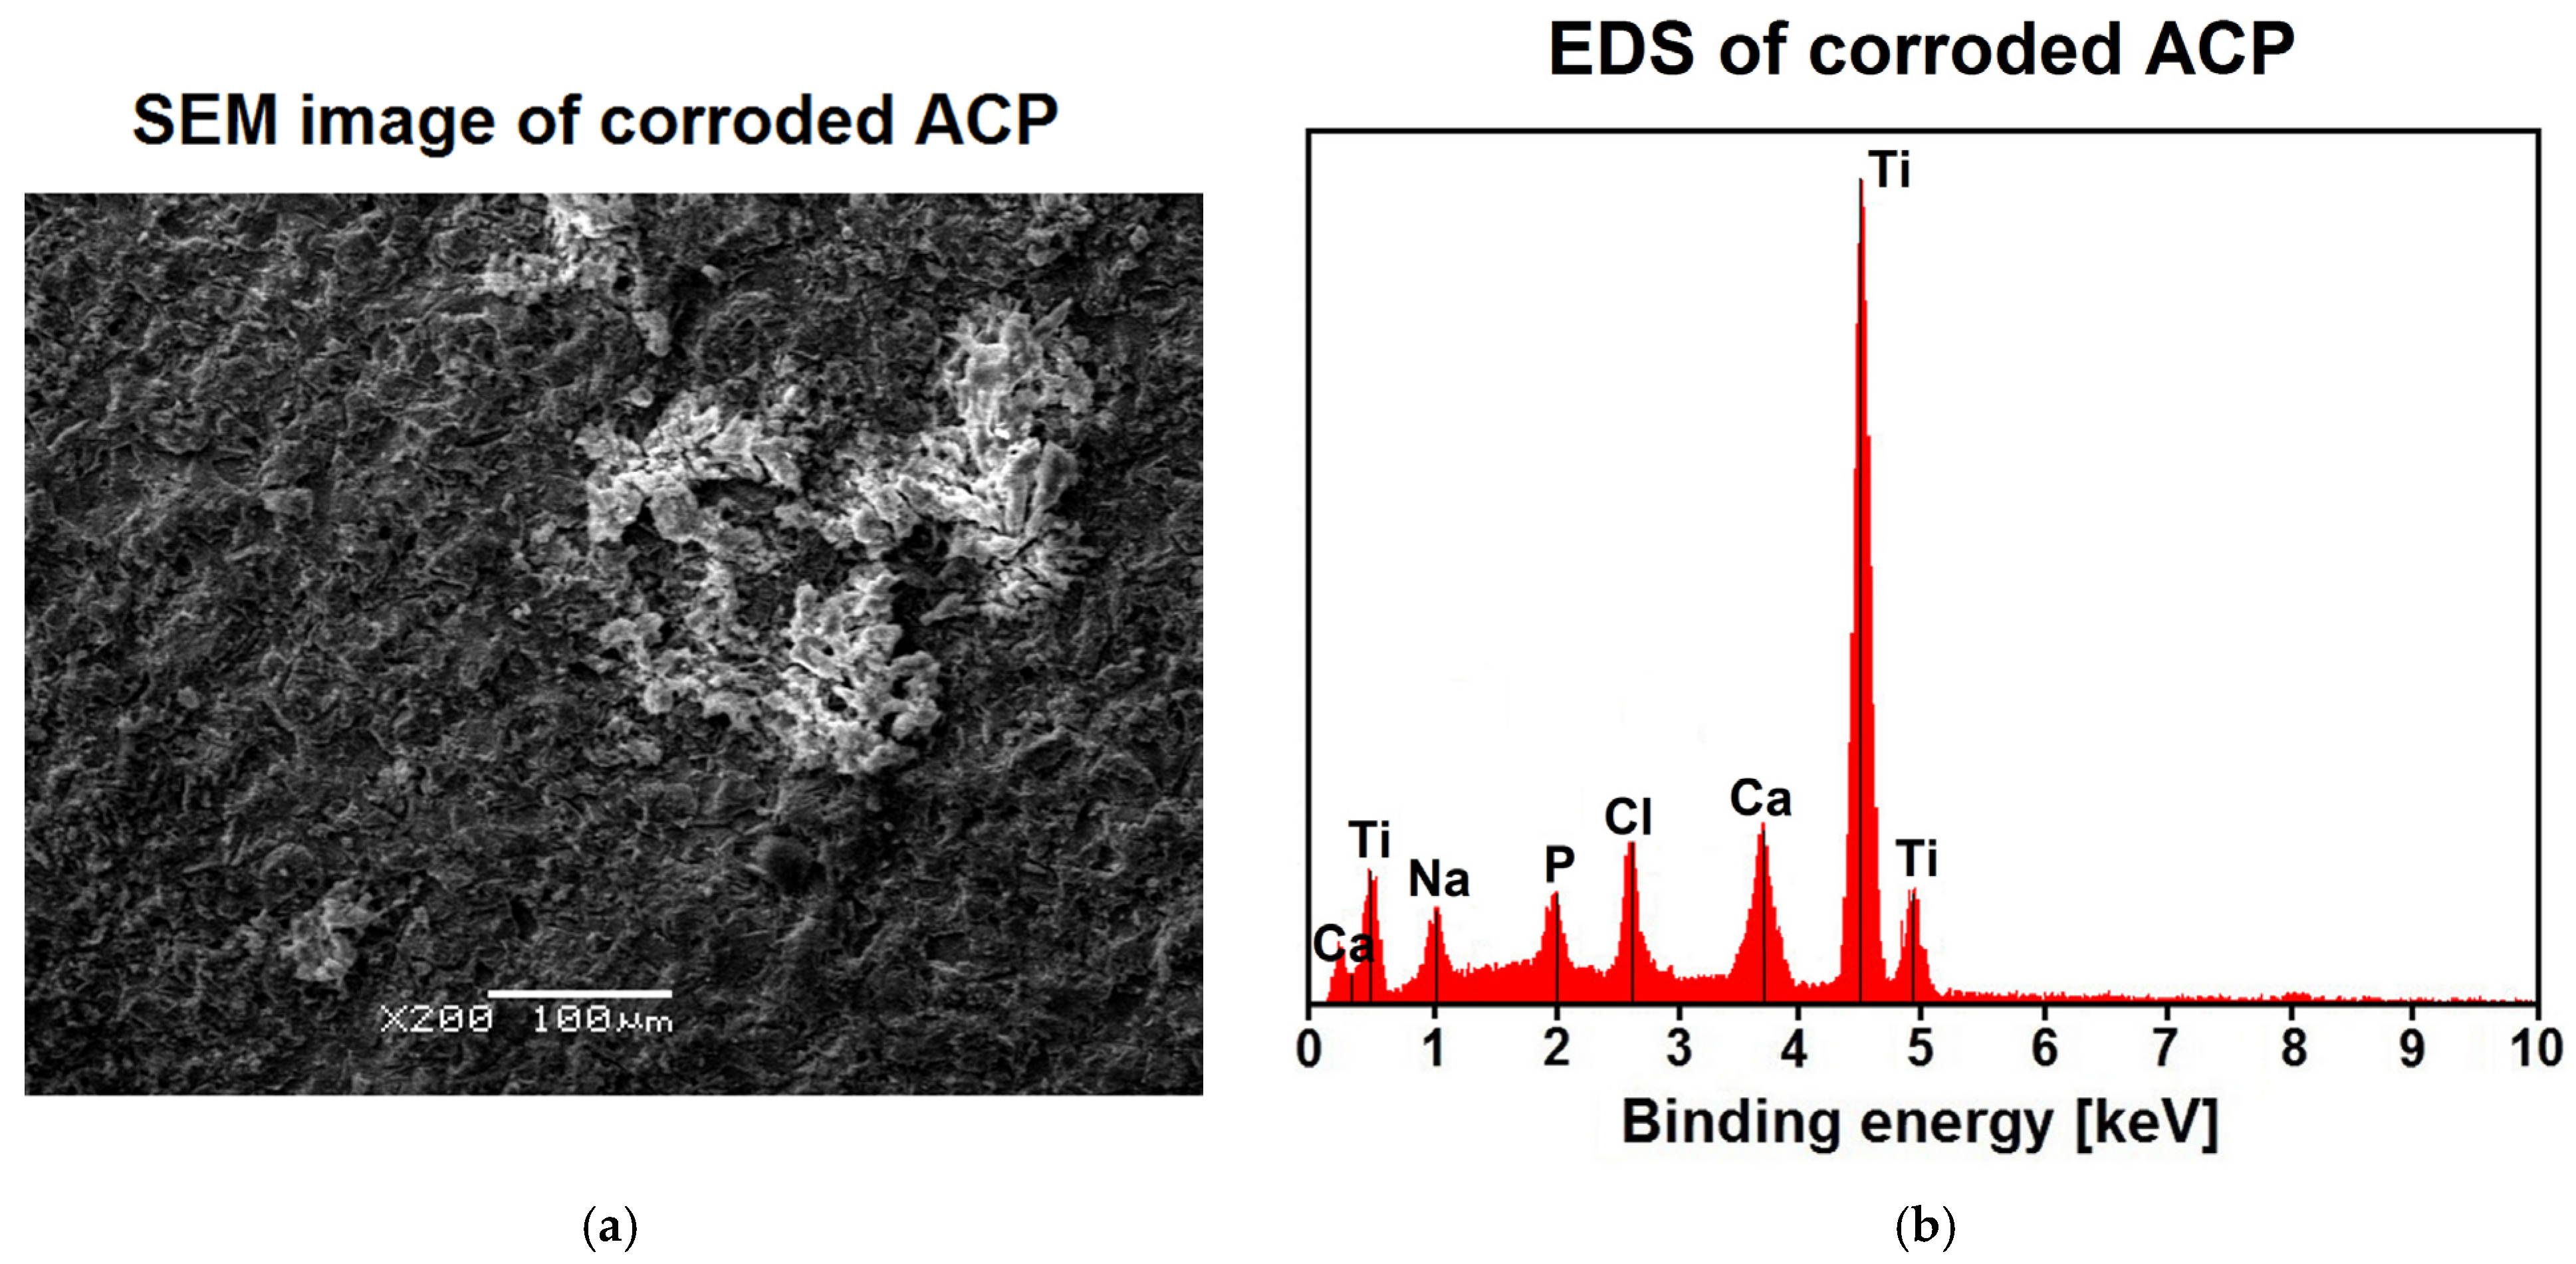
| Element | Concentration (at.%) | Standard Deviation |
|---|---|---|
| Ca | 10.041 | (0.650) |
| P | 4.495 | (0.451) |
| Ti | 62.264 | (0.835) |
| Na | 14.022 | (0.662) |
| Cl | 9.178 | (0.678) |
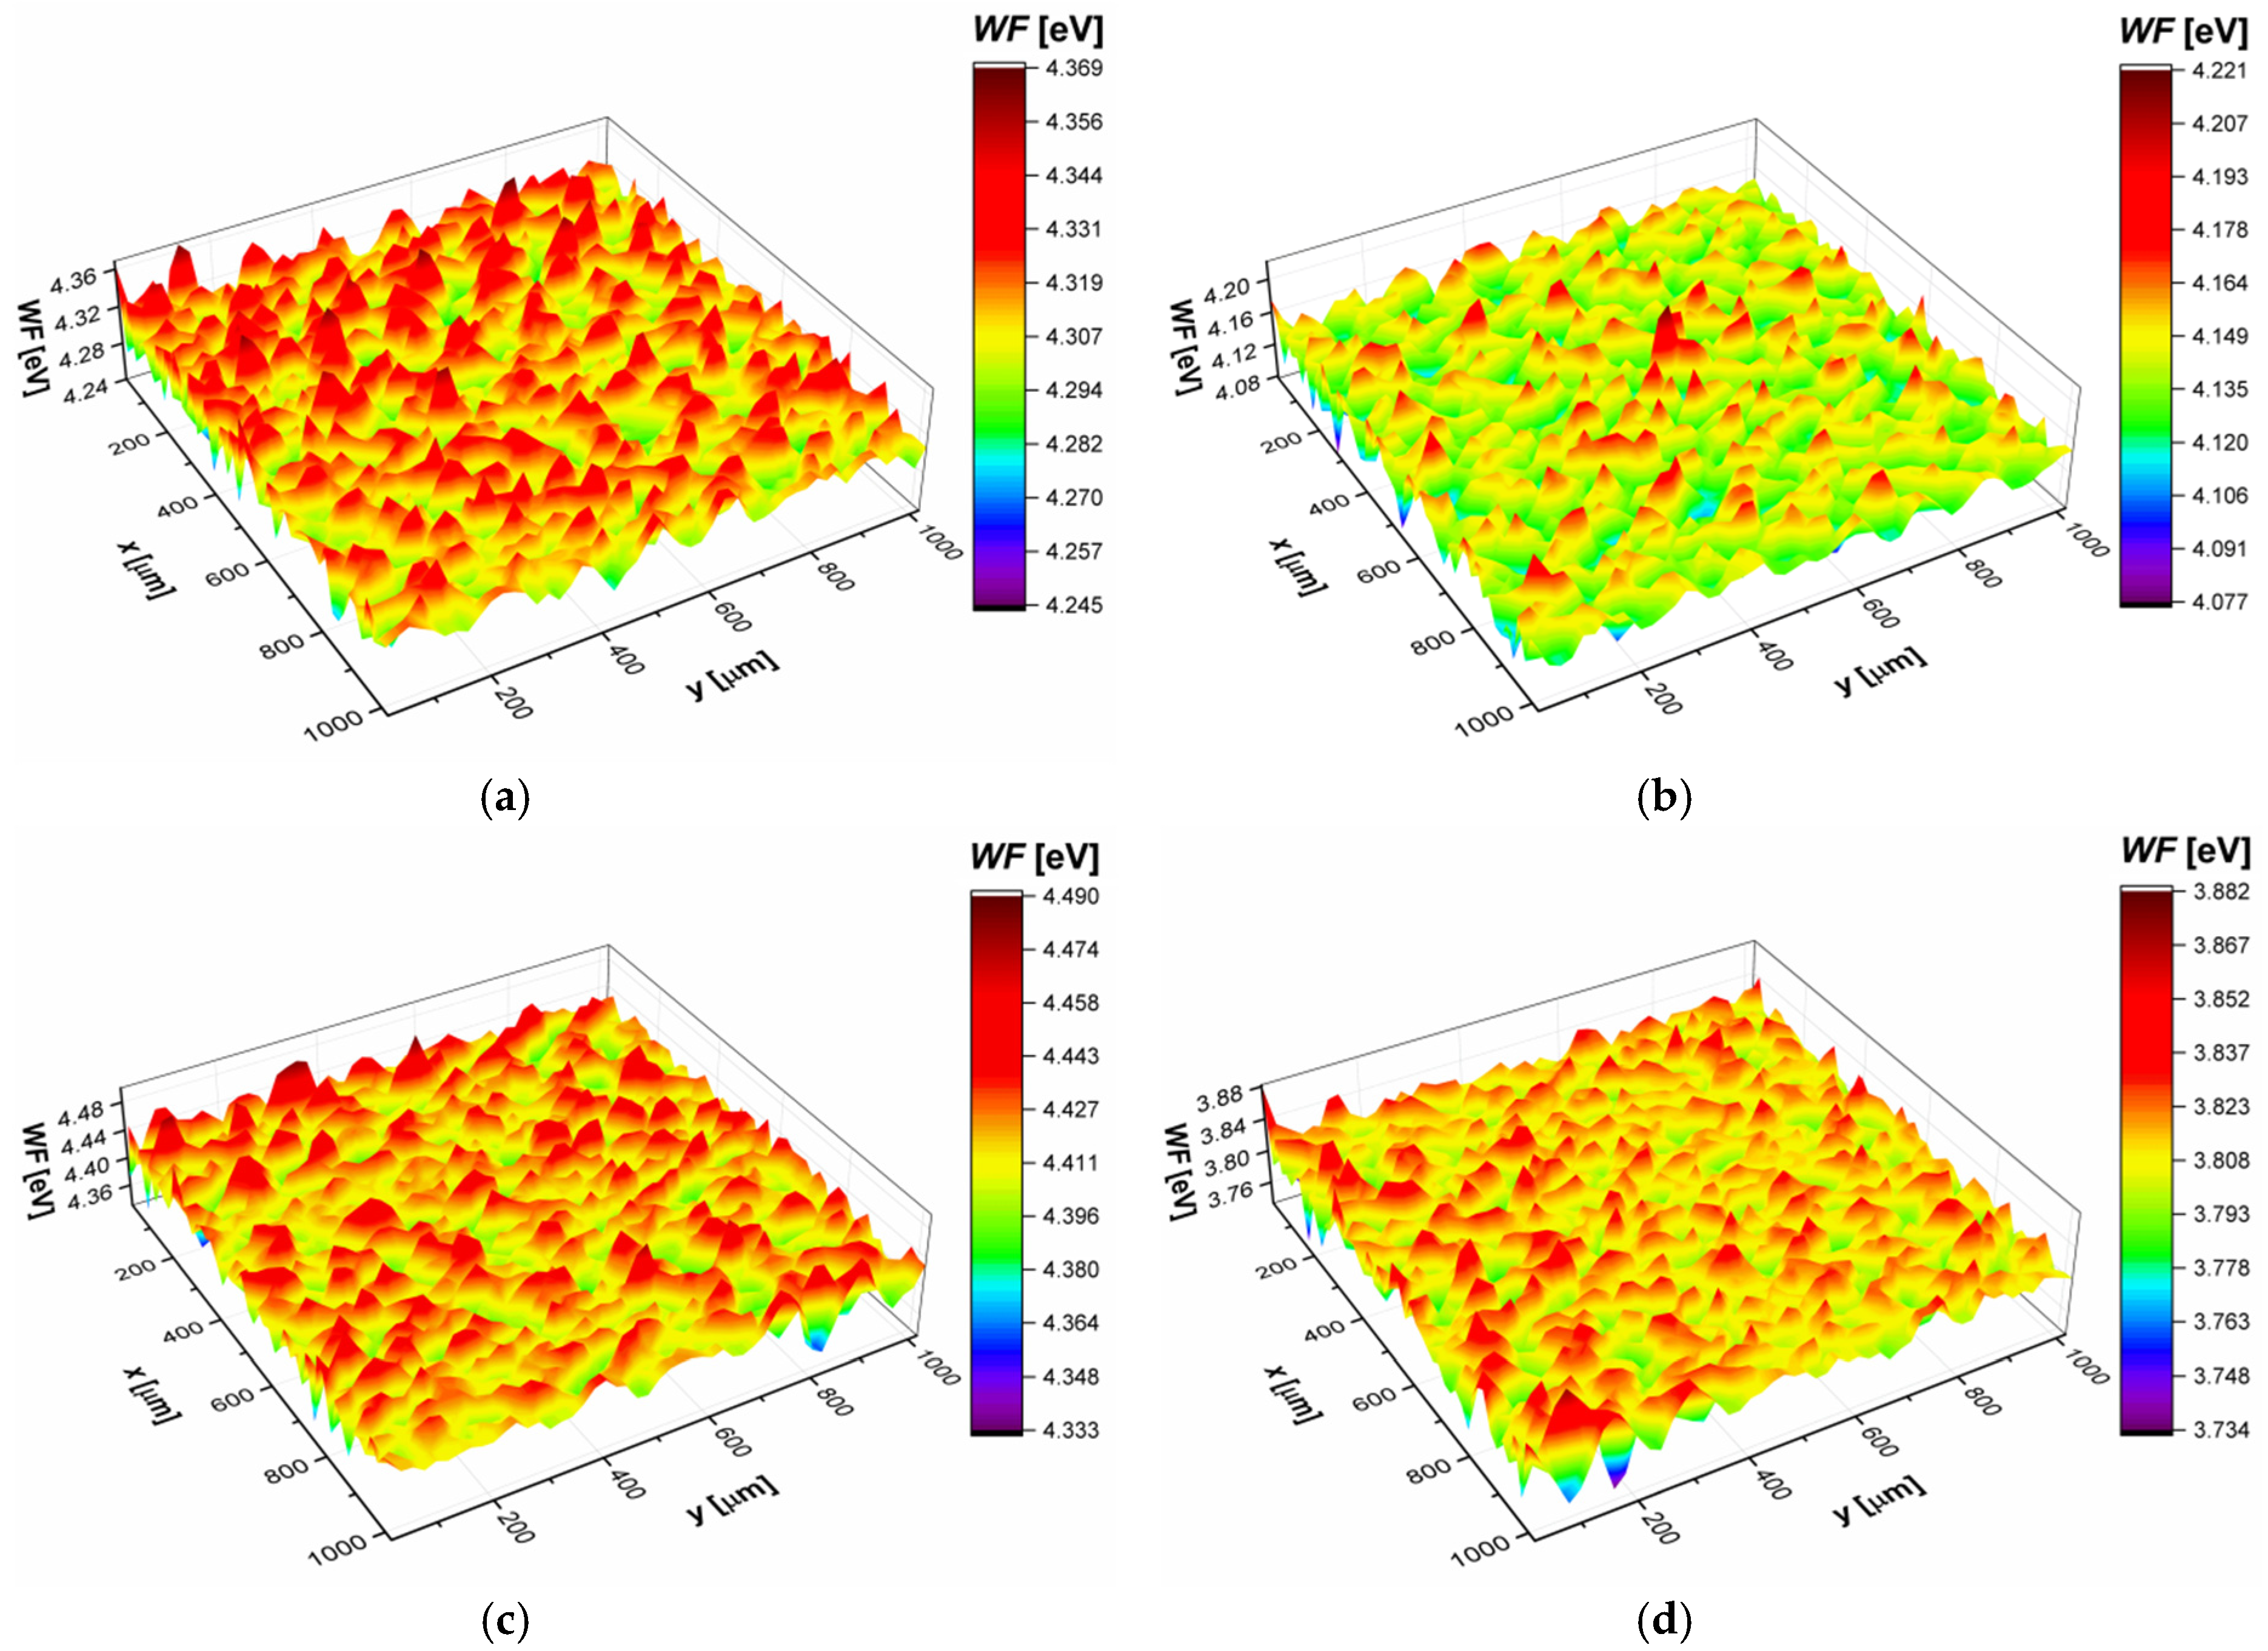
| CpTi G4 | WFav (eV) | WFa (eV) | WFrms (eV) | WFsk | WFku |
|---|---|---|---|---|---|
| sandblasted and autoclaved | 4.31 | 14.2 × 10⁻³ | 18.0 × 10⁻³ | −0.04 | 3.2 |
| sandblasted and autoclaved after 21 days of immersion in artificial saliva | 4.14 | 13.7 × 10⁻³ | 17.1 × 10⁻³ | 0.1 | 3.3 |
| covered by ACP coating | 4.42 | 14.5 × 10⁻³ | 18.6 × 10⁻³ | −0.01 | 3.7 |
| covered by ACP coating after 21 days of immersion in artificial saliva | 3.81 | 11.8 × 10⁻³ | 15.2 × 10⁻³ | −0.1 | 4.1 |
Publisher’s Note: MDPI stays neutral with regard to jurisdictional claims in published maps and institutional affiliations. |
© 2021 by the authors. Licensee MDPI, Basel, Switzerland. This article is an open access article distributed under the terms and conditions of the Creative Commons Attribution (CC BY) license (http://creativecommons.org/licenses/by/4.0/).
Share and Cite
Osak, P.; Maszybrocka, J.; Kubisztal, J.; Ratajczak, P.; Łosiewicz, B. Long-Term Assessment of the In Vitro Corrosion Resistance of Biomimetic ACP Coatings Electrodeposited from an Acetate Bath. J. Funct. Biomater. 2021, 12, 12. https://doi.org/10.3390/jfb12010012
Osak P, Maszybrocka J, Kubisztal J, Ratajczak P, Łosiewicz B. Long-Term Assessment of the In Vitro Corrosion Resistance of Biomimetic ACP Coatings Electrodeposited from an Acetate Bath. Journal of Functional Biomaterials. 2021; 12(1):12. https://doi.org/10.3390/jfb12010012
Chicago/Turabian StyleOsak, Patrycja, Joanna Maszybrocka, Julian Kubisztal, Patryk Ratajczak, and Bożena Łosiewicz. 2021. "Long-Term Assessment of the In Vitro Corrosion Resistance of Biomimetic ACP Coatings Electrodeposited from an Acetate Bath" Journal of Functional Biomaterials 12, no. 1: 12. https://doi.org/10.3390/jfb12010012