Determining the Minimal Clinical Important Difference for Medication Quantification Scale III and Morphine Milligram Equivalents in Patients with Failed Back Surgery Syndrome


Abstract
:1. Introduction
2. Experimental Section
2.1. Data
2.2. Patient-Reported Outcome Measures
2.3. Statistical Analysis
3. Results
3.1. Patient Characteristics
3.2. Distribution-Based Methods
3.3. Anchor-Based Methods
4. Discussion
5. Conclusions
Author Contributions
Funding
Conflicts of Interest
References
- Baber, Z.; Erdek, M. Failed back surgery syndrome: Current perspectives. J. Pain Res. 2016, 9, 979–987. [Google Scholar] [CrossRef] [Green Version]
- Merskey, H.; Bogduk, N. Lumbar Spinal or Radicular Pain after Failed Spinal Surgery. In Classification of Chronic Pain, 2nd ed.; IASP: Washington, DC, USA, 1994. [Google Scholar]
- Wille, F.; Breel, J.S.; Bakker, E.W.; Hollmann, M.W. Altering Conventional to High Density Spinal Cord Stimulation: An Energy Dose-Response Relationship in Neuropathic Pain Therapy. Neuromodul. Technol. Neural Interface 2016, 20, 71–80. [Google Scholar] [CrossRef] [PubMed]
- Pilitsis, J.; Fahey, M.; Custozzo, A.; Chakravarthy, K.; Capobianco, R. Composite Score Is a Better Reflection of Patient Response to Chronic Pain Therapy Compared With Pain Intensity Alone. Neuromodul. Technol. Neural Interface 2020. [Google Scholar] [CrossRef] [PubMed]
- Goudman, L.; De Smedt, A.; Eldabe, S.; Rigoard, P.; Linderoth, B.; De Jaeger, M.; Moens, M. High-dose spinal cord stimulation for patients with failed back surgery syndrome. Pain 2020. [Google Scholar] [CrossRef] [PubMed]
- Pope, J.E.; Fishman, M. Redefining Success: Longitudinal Patient Reported Outcome Measures and the Importance of Psychometric Testing for Optimization in Neuromodulation. Neuromodul. Technol. Neural Interface 2018, 22. [Google Scholar] [CrossRef] [PubMed]
- Goudman, L.; Moens, M. Moving Beyond a Pain Intensity Reporting: The Value of Goal Identification in Neuromodulation. Neuromodul. Technol. Neural Interface 2020, 23, 1057–1058. [Google Scholar] [CrossRef]
- Goldsmith, C.H.; Boers, M.; Bombardier, C.; Tugwell, P. Criteria for clinically important changes in outcomes: Development, scoring and evaluation of rheumatoid arthritis patient and trial profiles. OMERACT Committee. J. Rheumatol. 1993, 20, 561–565. [Google Scholar]
- Wells, G.; Beaton, D.; Shea, B.; Boers, M.; Simon, L.; Strand, V.; Brooks, P.; Tugwell, P. Minimal clinically important differences: Review of methods. J. Rheumatol. 2001, 28, 406–412. [Google Scholar]
- Daniell, J.R.; Osti, O.L. Failed Back Surgery Syndrome: A Review Article. Asian Spine J. 2018, 12, 372–379. [Google Scholar] [CrossRef]
- Pollard, E.M.; Lamer, T.J.; Moeschler, S.M.; Gazelka, H.M.; Hooten, W.M.; Bendel, M.A.; Warner, N.S.; Murad, M.H. The effect of spinal cord stimulation on pain medication reduction in intractable spine and limb pain: A systematic review of randomized controlled trials and meta-analysis. J. Pain Res. 2019, 12, 1311–1324. [Google Scholar] [CrossRef] [Green Version]
- Steedman, S.M.; Middaugh, S.J.; Kee, W.G.; Carson, D.S.; Harden, R.N.; Miller, M.C. Chronic-pain medications: Equivalence levels and method of quantifying usage. Clin. J. Pain 1992, 8, 204–214. [Google Scholar] [CrossRef]
- Gallizzi, M.; Gagnon, C.; Harden, N.R.; Stanos, S.; Khan, A. Medication Quantification Scale Version III: Internal Validation of Detriment Weights Using a Chronic Pain Population. Pain Pract. 2008, 8, 1–4. [Google Scholar] [CrossRef] [PubMed]
- De Jaeger, M.; Van Hooff, R.-J.; Goudman, L.; Espinoza, A.V.; Brouns, R.; Puylaert, M.; Duyvendak, W.; Moens, M. High-Density in Spinal Cord stimulation: Virtual Expert Registry (DISCOVER): Study Protocol for a Prospective Observational Trial. Anesthesiol. Pain Med. 2017, 7, e13640. [Google Scholar] [CrossRef] [PubMed] [Green Version]
- Harden, N.R.; Weinland, S.R.; Remble, T.A.; Houle, T.T.; Colio, S.; Steedman, S.; Kee, W.G. Medication Quantification Scale Version III: Update in Medication Classes and Revised Detriment Weights by Survey of American Pain Society Physicians. J. Pain 2005, 6, 364–371. [Google Scholar] [CrossRef]
- Centers for Disease Control and Prevention. CDC Compilation of Benzodiazepines, Muscle Relaxants, Stimulants, Zolpidem, and Opioid Analgesics with Oral Morphine Milligram Equivalent Conversion Factors. 2017. Available online: https://www.cdc.gov/drugoverdose/resources/data.html (accessed on 10 April 2020).
- Austevoll, I.M.; Gjestad, R.; Grotle, M.; Solberg, T.; Brox, J.I.; Hermansen, E.; Rekeland, F.; Indrekvam, K.; Storheim, K.; Hellum, C. Follow-up score, change score or percentage change score for determining clinical important outcome following surgery? An observational study from the Norwegian registry for Spine surgery evaluating patient reported outcome measures in lumbar spinal stenosis and lumbar degenerative spondylolisthesis. BMC Musculoskelet. Disord. 2019, 20, 1–15. [Google Scholar] [CrossRef] [Green Version]
- Sedaghat, A.R. Understanding the Minimal Clinically Important Difference (MCID) of Patient-Reported Outcome Measures. Otolaryngol. Neck Surg. 2019, 161, 551–560. [Google Scholar] [CrossRef]
- Jaeschke, R.; Singer, J.; Guyatt, G.H. Measurement of health status. Ascertaining the minimal clinically important difference. Control Clin. Trials 1989, 10, 407–415. [Google Scholar] [CrossRef]
- Norman, G.R.; Sloan, J.A.; Wyrwich, K.W. Interpretation of changes in health-related quality of life: The remarkable universality of half a standard deviation. Med. Care 2003, 41, 582–592. [Google Scholar] [CrossRef]
- Copay, A.G.; Subach, B.R.; Glassman, S.D.; Polly, D.W.; Schuler, T.C. Understanding the minimum clinically important difference: A review of concepts and methods. Spine J. 2007, 7, 541–546. [Google Scholar] [CrossRef]
- Samsa, G.; Edelman, D.; Rothman, M.L.; Williams, G.R.; Lipscomb, J.; Matchar, D. Determining Clinically Important Differences in Health Status Measures. PharmacoEconomics 1999, 15, 141–155. [Google Scholar] [CrossRef]
- Schwind, J.; Learman, K.; O’Halloran, B.; Showalter, C.; Cook, C. Different minimally important clinical difference (MCID) scores lead to different clinical prediction rules for the Oswestry disability index for the same sample of patients. J. Man. Manip. Ther. 2013, 21, 71–78. [Google Scholar] [CrossRef] [PubMed] [Green Version]
- Voon, P.; Karamouzian, M.; Nguyen, P. Chronic pain and opioid misuse: A review of reviews. Subst. Abus. Treat. Prev. Policy 2017, 12, 1–9. [Google Scholar] [CrossRef] [PubMed] [Green Version]
- Kalkman, G.A.; Kramers, C.; Van Dongen, R.T.; Brink, W.V.D.; Schellekens, A. Trends in use and misuse of opioids in the Netherlands: A retrospective, multi-source database study. Lancet Public Health 2019, 4, e498–e505. [Google Scholar] [CrossRef] [Green Version]
- Dowell, D.; Haegerich, T.M.; Chou, R. CDC Guideline for Prescribing Opioids for Chronic Pain—United States, 2016. MMWR Recomm. Rep. 2016, 65, 1–49. [Google Scholar] [CrossRef] [PubMed]
- Dowell, D.; Haegerich, T.M. Using the CDC Guideline and Tools for Opioid Prescribing in Patients with Chronic Pain. Am. Fam. Physician 2016, 93, 970–972. [Google Scholar] [PubMed]
- Philpot, L.M.; Ramar, P.; Elrashidi, M.Y.; Mwangi, R.; North, F.; Ebbert, J.O. Controlled Substance Agreements for Opioids in a Primary Care Practice. J. Pharm. Policy Pract. 2017, 10, 29. [Google Scholar] [CrossRef] [Green Version]
- Stratford, P.W.; Binkley, J.M.; Riddle, D.L.; Guyatt, G.H. Sensitivity to Change of the Roland-Morris Back Pain Questionnaire: Part 1. Phys. Ther. 1998, 78, 1186–1196. [Google Scholar] [CrossRef]
- Riddle, D.L.; Stratford, P.W.; Binkley, J.M. Sensitivity to Change of the Roland-Morris Back Pain Questionnaire: Part 2. Phys. Ther. 1998, 78, 1197–1207. [Google Scholar] [CrossRef]
- Salaffi, F.; Stancati, A.; Silvestri, C.A.; Ciapetti, A.; Grassi, W. Minimal clinically important changes in chronic musculoskeletal pain intensity measured on a numerical rating scale. Eur. J. Pain 2004, 8, 283–291. [Google Scholar] [CrossRef]
- Wright, A.A.; Hannon, J.; Hegedus, E.J.; Kavchak, A.E. Clinimetrics corner: A closer look at the minimal clinically important difference (MCID). J. Man. Manip. Ther. 2012, 20, 160–166. [Google Scholar] [CrossRef] [Green Version]
- Wyrwich, K.W.; Tierney, W.M.; Wolinsky, F.D. Further Evidence Supporting an SEM-Based Criterion for Identifying Meaningful Intra-Individual Changes in Health-Related Quality of Life. J. Clin. Epidemiol. 1999, 52, 861–873. [Google Scholar] [CrossRef]


| Approach | Method | Calculation | MQS | MME |
|---|---|---|---|---|
| Distribution-based methods | Standard deviation | MCID = 0.5 × SDbaseline | 4.28 | 33.61 |
| Effect size | MCID ≥ 0.2 × SDbaseline | 1.71 | 13.45 | |
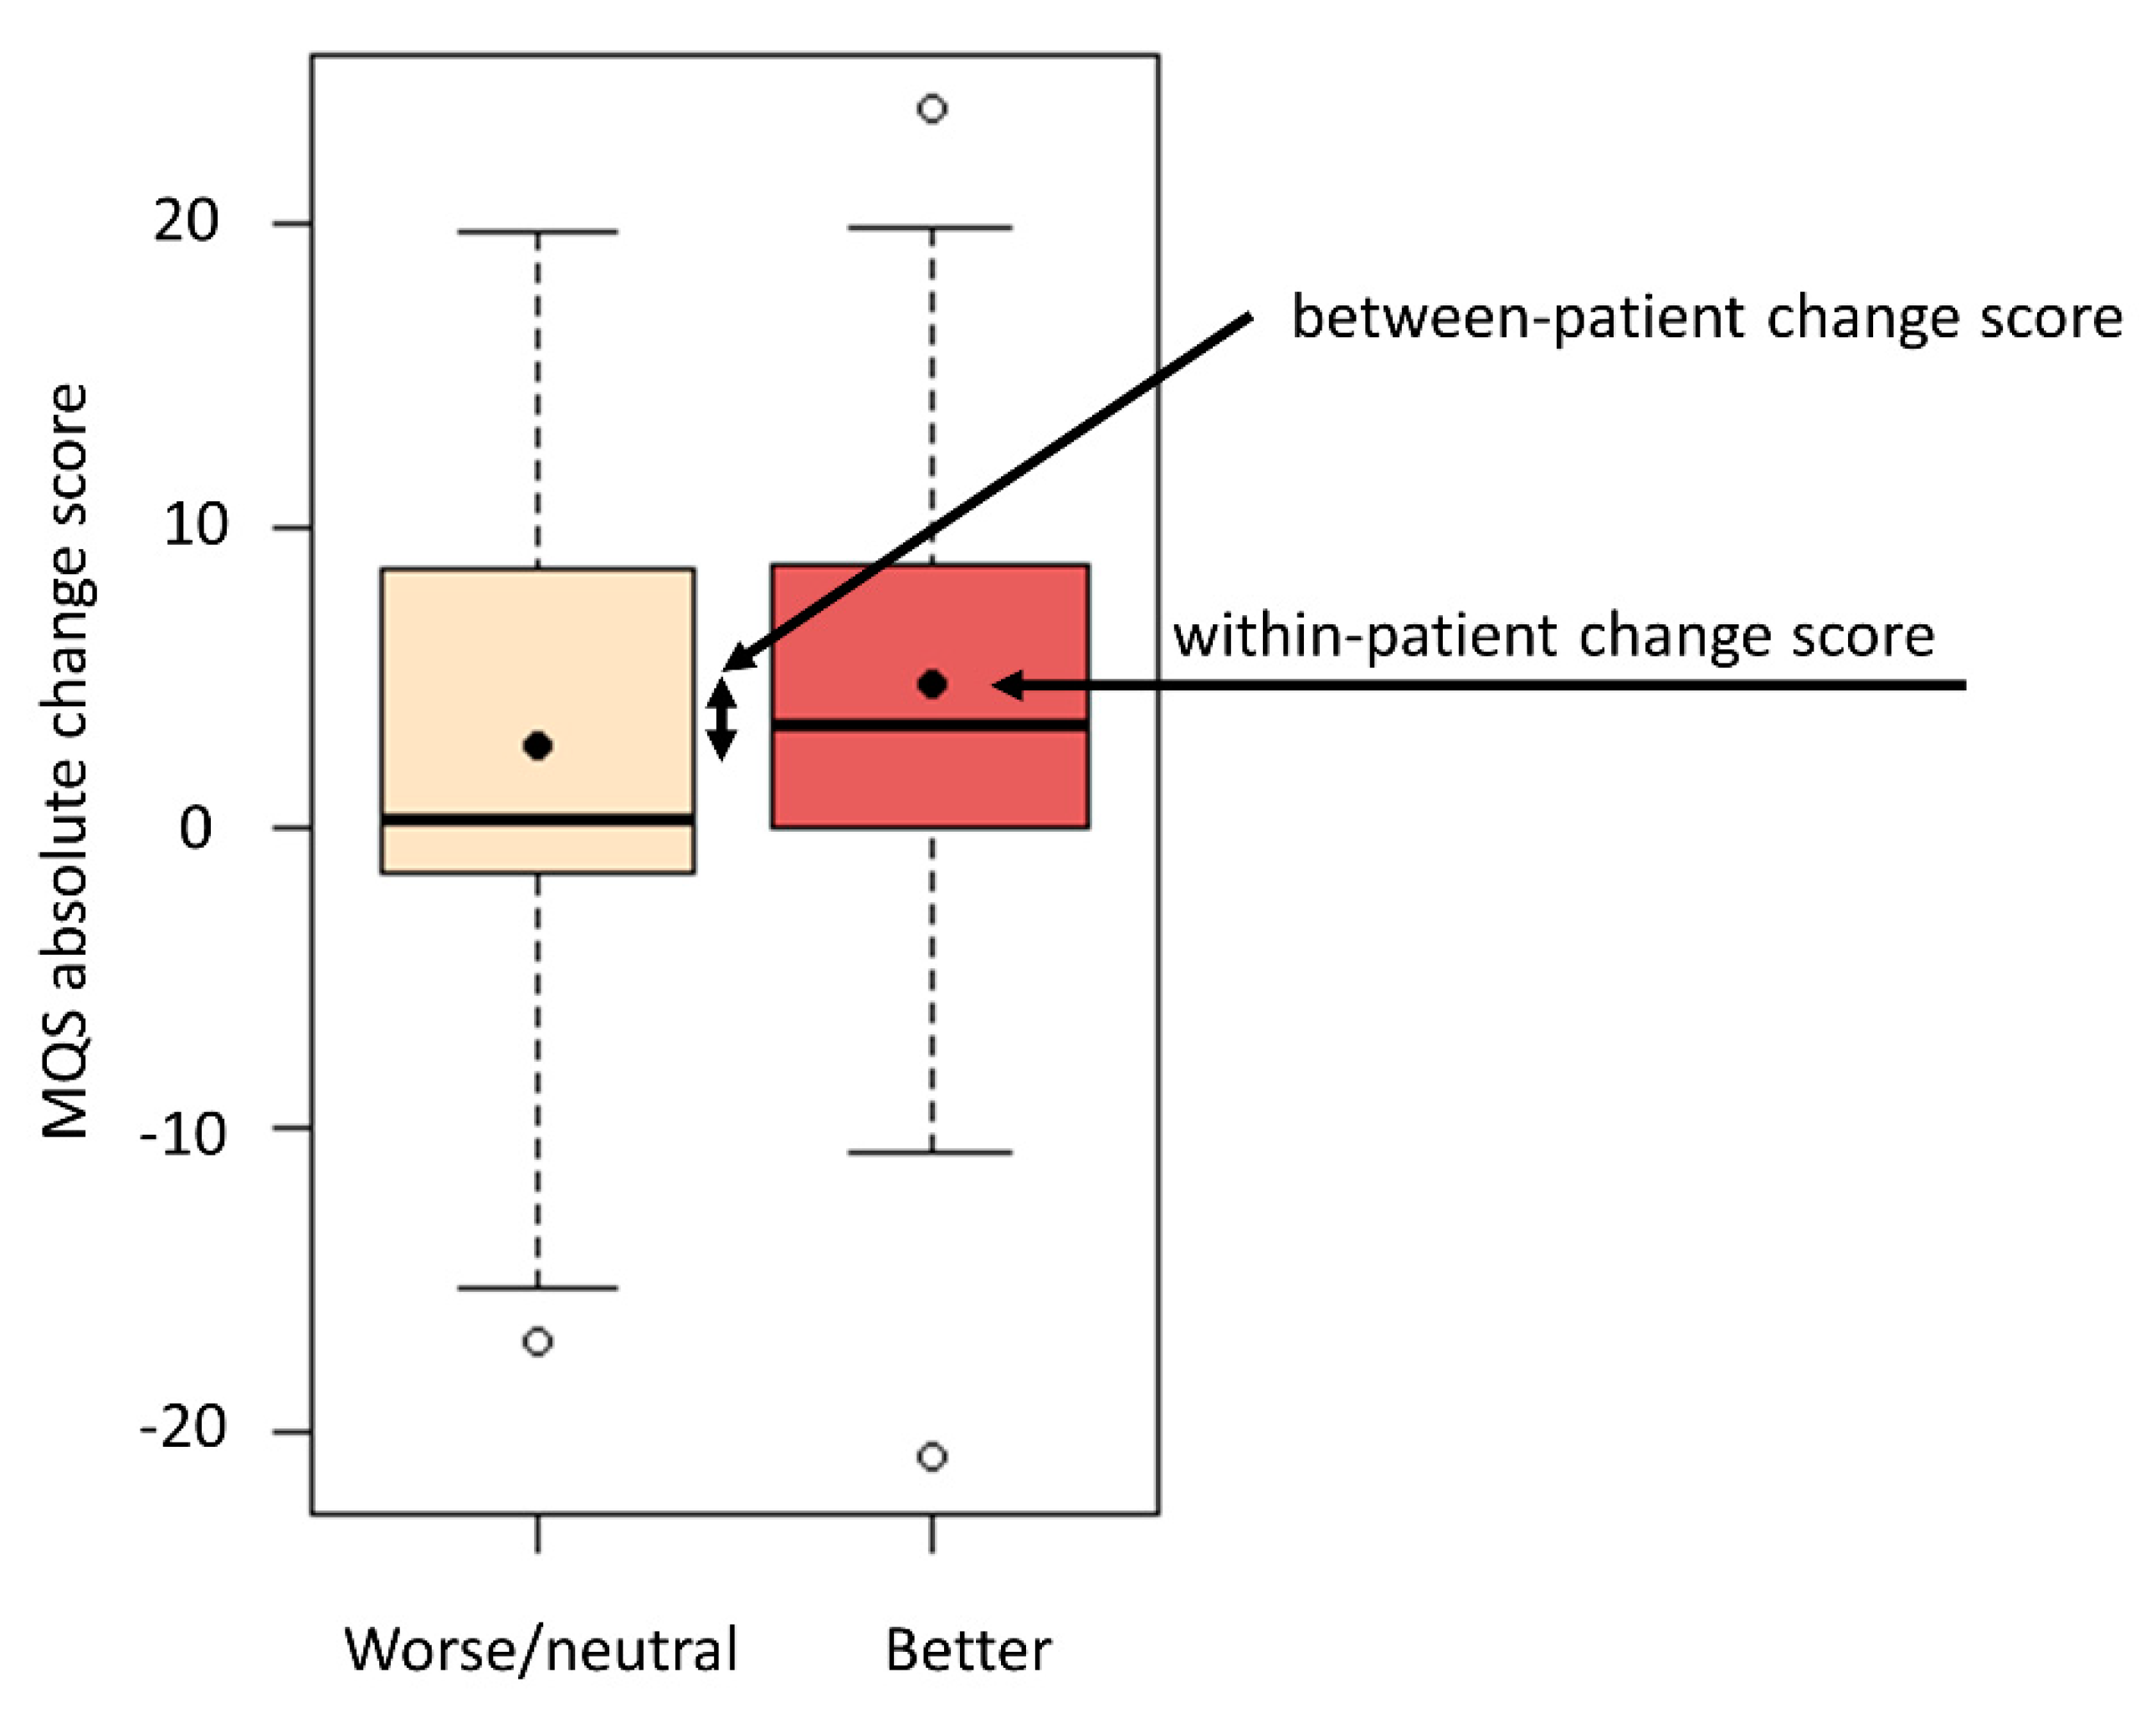
| Anchor-based methods | Within-patient change score | Absolute change score for “better” group | 4.72 | 22.65 |
| Percentage change score for “better” group | 41.2% | 28.2% | ||
| Between-patient change score | Difference in change score between “better” and “worse/neutral” group | 2.03 | 15.18 | |
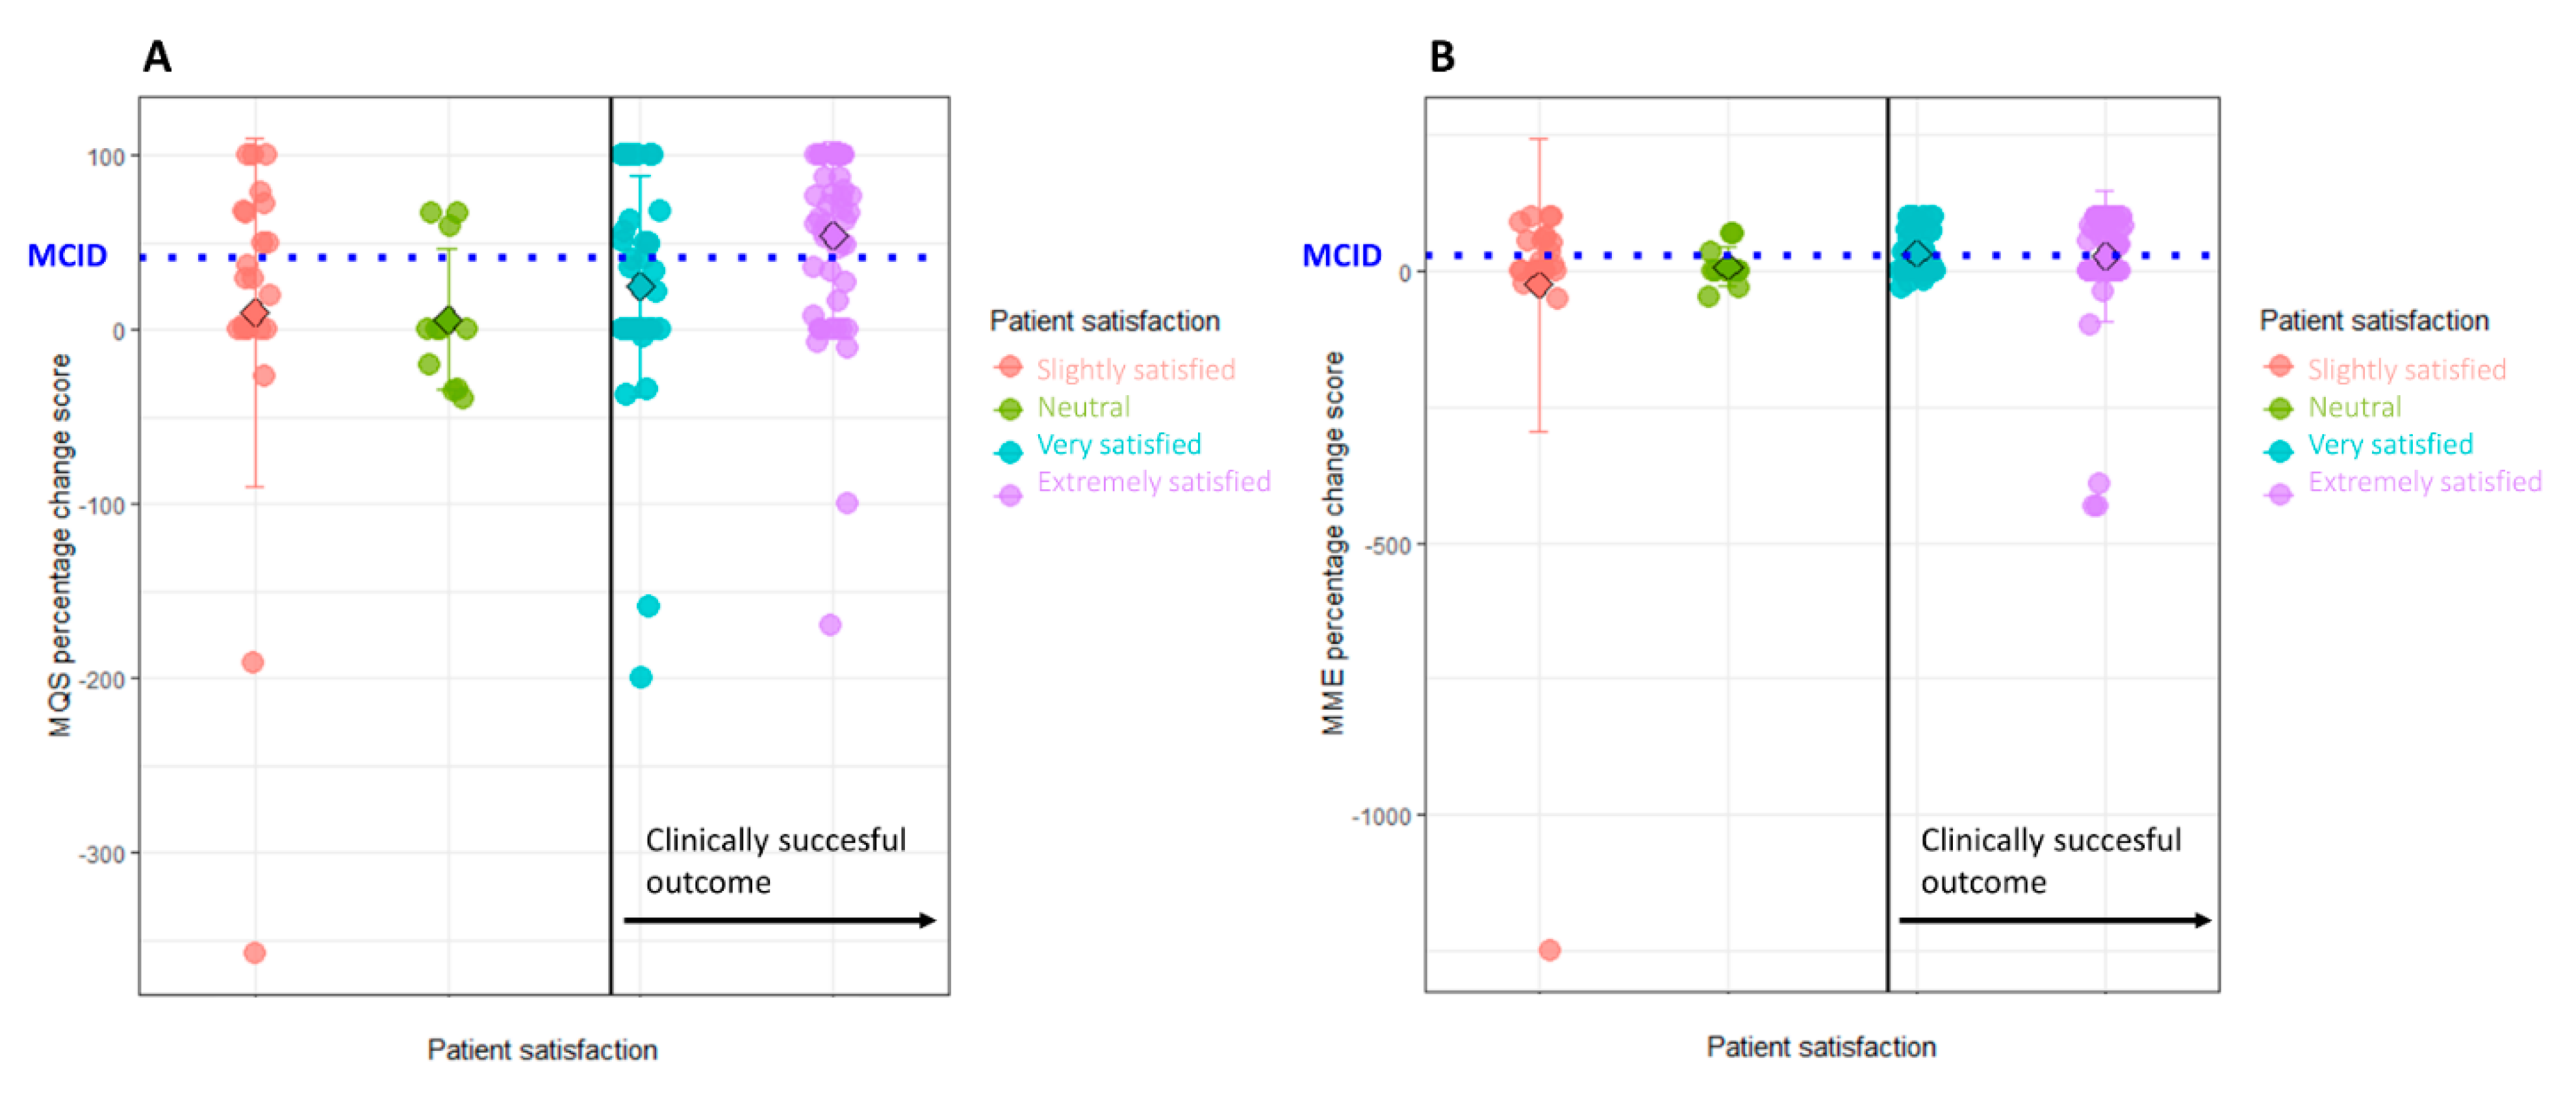
| Sensitivity/Specificity | Absolute change score | 1.4 (52.9% sensitivity and 66.7% specificity) | 8 (61.8% sensitivity and 53.8% specificity) | |
| Percentage change score | 30% (61.8% sensitivity and 62.4% specificity) | 17% (61.8% sensitivity and 57.0% specificity) |
Publisher’s Note: MDPI stays neutral with regard to jurisdictional claims in published maps and institutional affiliations. |
© 2020 by the authors. Licensee MDPI, Basel, Switzerland. This article is an open access article distributed under the terms and conditions of the Creative Commons Attribution (CC BY) license (http://creativecommons.org/licenses/by/4.0/).
Share and Cite
Goudman, L.; Smedt, A.D.; Forget, P.; Moens, M. Determining the Minimal Clinical Important Difference for Medication Quantification Scale III and Morphine Milligram Equivalents in Patients with Failed Back Surgery Syndrome. J. Clin. Med. 2020, 9, 3747. https://doi.org/10.3390/jcm9113747
Goudman L, Smedt AD, Forget P, Moens M. Determining the Minimal Clinical Important Difference for Medication Quantification Scale III and Morphine Milligram Equivalents in Patients with Failed Back Surgery Syndrome. Journal of Clinical Medicine. 2020; 9(11):3747. https://doi.org/10.3390/jcm9113747
Chicago/Turabian StyleGoudman, Lisa, Ann De Smedt, Patrice Forget, and Maarten Moens. 2020. "Determining the Minimal Clinical Important Difference for Medication Quantification Scale III and Morphine Milligram Equivalents in Patients with Failed Back Surgery Syndrome" Journal of Clinical Medicine 9, no. 11: 3747. https://doi.org/10.3390/jcm9113747