C1q/TNF-Related Protein-3 (CTRP-3) and Pigment Epithelium-Derived Factor (PEDF) Concentrations in Patients with Gestational Diabetes Mellitus: A Case-Control Study


Abstract
:1. Introduction
2. Experimental Section
Statistical Methods
3. Results
3.1. The Characteristics and Comparison of Selected Clinical and Laboratory Variables Depending on the Occurrence of Diabetes during Pregnancy and the Implemented Treatment (A Diet or an Insulin Therapy)
3.2. Correlations between the Selected Clinical and Laboratory Variables as Well as PEDF Marker and CTRP3 in the Groups of: Healthy Respondents, Patients with Gestational Diabetes Mellitus (GDM), Gestational Diabetes Mellitus Treated by Means of Diet (GDM1) and by Means of Insulin Therapy (GDM2)
4. Discussion
4.1. CTRP-3
4.2. PEDF
5. Conclusions
Author Contributions
Funding
Conflicts of Interest
References
- World Health Organization. Diagnostic Criteria and Classification of Hyperglycaemia First Detected in Pregnancy; World Health Organization: Geneva, Switzerland, 2013; pp. 1–62. [Google Scholar]
- Guariguata, L.; Linnenkamp, U.; Beagley, J.; Whiting, D.R.; Cho, N.H. Global estimates of the prevalence of hyperglycaemia in pregnancy. Diabetes Res. Clin. Pract. 2014, 103, 176–185. [Google Scholar] [CrossRef] [PubMed]
- Wu, L.; Han, L.; Zhan, Y.; Cui, L.; Chen, W.; Ma, L.; Lv, J.; Pan, R.; Zhao, D.; Xiao, Z. Prevalence of gestational diabetes mellitus and associated risk factors in pregnant Chinese women: A cross-sectional study in Huangdao. Qingdao. China. Asia Pac. J. Clin. Nutr. 2018, 27, 383–388. [Google Scholar]
- Catalano, P.M.; McIntyre, H.D.; Cruickshank, J.K.; McCance, D.R.; Dyer, A.R.; Metzger, B.E.; Lowe, L.P.; Trimble, E.R.; Coustan, D.R.; Hadden, D.R. The hyperglycemia and adverse pregnancy outcome study: Associations of GDM and obesity with pregnancy outcomes. Diabetes Care 2012, 35, 780–786. [Google Scholar] [CrossRef] [PubMed] [Green Version]
- Ovesen, P.G.; Jensen, D.M.; Damm, P.; Rasmussen, S.; Kesmodel, U.S. Maternal and neonatal outcomes in pregnancies complicated by gestational diabetes. A nation-wide study. J. Matern. Fetal. Neonatal Med. 2015, 28, 1720–1724. [Google Scholar] [CrossRef] [PubMed]
- Barker, D.J.P. The origins of the developmental origins theory. J. Intern. Med. 2007, 261, 412–417. [Google Scholar] [CrossRef] [PubMed]
- Bellamy, L.; Casas, J.P.; Hingorani, A.D.; Williams, D. Type 2 diabetes mellitus after gestational diabetes: A systematic review and meta-analysis. Lancet 2009, 373, 1773–1779. [Google Scholar] [CrossRef]
- Buchanan, T.A.; Xiang, A.H. Gestational diabetes mellitus. J. Clin. Investig. 2005, 115, 485–491. [Google Scholar] [CrossRef] [Green Version]
- Wong, G.W.; Krawczyk, S.A.; Kitidis-Mitrokostas, C.; Revett, T.; Gimeno, R.; Lodish, H.F. Molecular, biochemical and functional characterizations of C1q/TNF family members: Adipose-tissue-selective expression patterns, regulation by PPAR-gamma agonist, cysteine-mediated oligomerizations, combinatorial associations and metabolic functions. Biochem. J. 2008, 416, 161–177. [Google Scholar] [CrossRef] [Green Version]
- Wong, G.W.; Wang, J.; Hug, C.; Tsao, T.S.; Lodish, H.F. A family of Acrp30/adiponectin structural and functional paralogs. Proc. Natl. Acad. Sci. USA 2004, 101, 10302–10307. [Google Scholar] [CrossRef] [Green Version]
- Li, W.; Cowley, A.; Uludag, M.; Gur, T.; McWilliam, H.; Squizzato, S.; Park, Y.M.; Buso, N.; Lopez, R. The EMBL-EBI bioinformatics web and programmatic tools framework. Nucleic Acids Res. 2015, 43, 580–584. [Google Scholar] [CrossRef] [Green Version]
- Peterson, J.M.; Wei, Z.; Wong, G.W. C1q/TNF-related protein-3 (CTRP3) a novel adipokine that regulates hepatic glucose output. J. Biol. Chem. 2010, 285, 39691–39701. [Google Scholar] [CrossRef] [PubMed] [Green Version]
- Wang, S.; Ling, Y.; Liang, W.; Shen, L. Association of serum C1q/TNF-related protein-3 (CTRP-3) in patients with coronary artery disease. BMC Cardiovasc. Disord. 2017, 17, 210. [Google Scholar] [CrossRef] [Green Version]
- Svestak, M.; Sporova, L.; Hejduk, P.; Lacnak, B.; Stejskal, D. Collagenous repeatcontaining sequence of 26 kDa protein-a newly discovered adipokine-sensu lato-A minireview. Biomed. Pap. Med. Fac. Univ. Palacky Olomouc Czech. Repub. 2010, 154, 199–202. [Google Scholar] [CrossRef] [PubMed] [Green Version]
- Famulla, S.; Lamers, D.; Hartwig, S.; Passlack, W.; Horrighs, A.; Cramer, A. Pigment epithelium-derived factor (PEDF) is one of the most abundant proteins secreted by human adipocytes and induces insulin resistance and inflammatory signaling in muscle and fat cells. Int. J. Obes. 2011, 35, 762–772. [Google Scholar] [CrossRef] [PubMed] [Green Version]
- He, X.; Cheng, R.; Benyajati, S.; Ma, J. PEDF and its roles in physiological and pathological conditions: Implication in diabetic and hypoxia-induced angiogenic diseases. Clin. Sci. 2015, 128, 805–823. [Google Scholar] [CrossRef] [Green Version]
- Becerra, S.P. Structure-function studies on PEDF. A noninhibitory serpin with neurotrophic activity. Adv. Exp. Med. Biol. 1997, 425, 223–237. [Google Scholar]
- Tombran-Tink, J.; Mazuruk, K.; Rodriguez, I.R.; Chung, D.; Linker, T.; Englander, E.; Chader, G.J. Organization, evolutionary conservation, expression and unusual Alu density of the human gene for pigment epithelium-derived factor, a unique neurotrophic serpin. Mol. Vis. 1996, 2, 11. [Google Scholar]
- Uhlen, M.; Fagerberg, L.; Hallstrom, B.M.; Lindskog, C.; Oksvold, P.; Mardinoglu, A.; Sivertsson, A.; Kampf, C.; Sjostedt, E.; Asplund, A. Proteomics. Tissue-based map of the human proteome. Science 2015, 347, 1260419. [Google Scholar] [CrossRef]
- Tombran-Tink, J.; Chader, G.G.; Johnson, L.V. PEDF: A pigment epithelium-derived factor with potent neuronal differentiative activity. Exp. Eye Res. 1991, 53, 411–414. [Google Scholar] [CrossRef] [Green Version]
- Notari, L.; Baladron, V.; Aroca-Aguilar, J.D.; Balko, N.; Heredia, R.; Meyer, C.; Notario, P.M.; Saravanamuthu, S.; Nueda, M.L.; Sanchez-Sanchez, F.; et al. Identification of a lipase-linked cell membrane receptor for pigment epithelium-derived factor. J. Biol. Chem. 2006, 281, 38022–38037. [Google Scholar] [CrossRef] [Green Version]
- Nelson, J.; McFerran, N.V.; Pivato, G.; Chambers, E.; Doherty, C.; Steele, D.; Timson, D.J. The 67 kDa laminin receptor: Structure, function and role in disease. Biosci. Rep. 2008, 28, 33–48. [Google Scholar] [CrossRef] [PubMed] [Green Version]
- Chuderland, D.; Ben-Ami, I.; Bar-Joseph, H.; Shalgi, R. Role of pigment epithelium-derived factor in the reproductive system. Reproduction 2014, 148, 53–61. [Google Scholar] [CrossRef] [Green Version]
- Borg, M.L.; Andrews, Z.B.; Duh, E.J.; Zechner, R.; Meikle, P.J.; Watt, M.J. Pigment epithelium-derived factor regulates lipid metabolism via adipose triglyceride lipase. Diabetes 2011, 60, 1458–1466. [Google Scholar] [CrossRef] [PubMed] [Green Version]
- Li, T.H.; Qiu, C.J.; Yu, X.J.; Liu, D.D.; Zhou, P.F.; Wu, L. Increased Serum Pigment Epithelium-Derived Factor in Women with Gestational Diabetes Is Associated with Type 2 Diabetes. Intl. J. Endocrinol. 2015, 2015, 346938. [Google Scholar] [CrossRef] [PubMed] [Green Version]
- Metzger, B.E.; Gabbe, S.G.; Persson, B.; Buchanan, T.A.; Catalano, P.A.; Damm, P.; Dyer, A.R.; Leiva, A.; Hod, M.; Kitzmiler, J.L.; et al. International association of diabetes and pregnancy study groups recommendations on the diagnosis and classification of hyperglycemia in pregnancy. Diabetes Care 2010, 33, 676–682. [Google Scholar] [CrossRef] [Green Version]
- Anna, V.; van der Ploeg, H.P.; Cheung, N.W.; Huxley, R.R.; Bauman, A.E. Sociodemographic correlates of the increasing trend in prevalence of gestational diabetes mellitus in a large population of women between 1995 and 2005. Diabetes Care 2008, 31, 2288–2293. [Google Scholar] [CrossRef] [Green Version]
- Ferrara, A.; Kahn, H.S.; Quesenberry, C.P.; Riley, C.; Hedderson, M.M. An increase in the incidence of gestational diabetes mellitus: Northern California, 1991–2000. Obstet. Gynecol. 2004, 103, 526–533. [Google Scholar] [CrossRef]
- American Diabetes Association. Diagnosis and classification of diabetes mellitus. Diabetes Care. 2017, 40, 11–24. [Google Scholar] [CrossRef] [Green Version]
- Bener, A.; Saleh, N.M.; Al-Hamaq, A. Prevalence of gestational diabetes and associated maternal and neonatal complications in a fast-developing community: Global comparisons. Int. J. Womens Health 2011, 3, 367–373. [Google Scholar] [CrossRef] [Green Version]
- Nahavandi, S.; Price, S.; Sumithran, P.; Ekinci, E.I. Exploration of the shared pathophysiological mechanisms of gestational diabetes and large for gestational age offspring. World J. Diabetes 2019, 10, 333–340. [Google Scholar] [CrossRef]
- Contreras-Duarte, S.; Carvajal, L.; Garchitorena, M.J.; Subiabre, M.; Fuenzalida, B.; Cantin, C.; Farías, M.; Leiva, A. Gestational Diabetes Mellitus Treatment Schemes Modify Maternal Plasma Cholesterol Levels Dependent to Women´s Weight: Possible Impact on Feto-Placental Vascular Function. Nutrients 2020, 12, 506. [Google Scholar] [CrossRef] [PubMed] [Green Version]
- HAPO Study Cooperative Research Group. The hyperglycemia and adverse pregnancy outcome (HAPO) study. Int. J. Gynaecol. Obstet. 2002, 78, 69–77. [Google Scholar] [CrossRef]
- Shah, B.R.; Retnakaran, R.; Booth, G.L. Increased risk of cardiovascular disease in young women following gestational diabetes mellitus. Diabetes Care 2008, 31, 1668–1669. [Google Scholar] [CrossRef] [PubMed] [Green Version]
- Teede, H.J.; Harrison, C.L.; Teh, W.T.; Paul, E.; Allan, C.A. Gestational diabetes: Development of an early risk prediction tool to facilitate opportunities for prevention. Aust. N. Zeal. J. Obstet. Gynaecol. 2011, 51, 499–504. [Google Scholar] [CrossRef]
- Fasshauer, M.; Blüher, M.; Stumvoll, M. Adipokines in gestational diabetes. Lancet Diabetes Endocrinol. 2014, 2, 488–499. [Google Scholar] [CrossRef]
- Xiang, A.H.; Peters, R.K.; Trigo, E.; Kjos, S.L.; Lee, W.P.; Buchanan, T.A. Multiple metabolic defects during late pregnancy in women at high risk for type 2 diabetes. Diabetes 1999, 48, 848–854. [Google Scholar] [CrossRef]
- Hofmann, C.; Chen, N.; Obermeier, F.; Paul, G.; Büchler, C.; Kopp, A.; Falk, W.; Schäffler, A. C1q/TNF-related protein-3 (CTRP-3) is secreted by visceral adipose tissue and exerts antiinflammatory and antifibrotic effects in primary human colonic fibroblasts. Inflamm. Bowel Dis. 2011, 17, 2462–2471. [Google Scholar] [CrossRef]
- Ban, B.; Bai, B.; Zhang, M.; Hu, J.; Ramanjaneya, M.; Tan, B.K.; Chen, J. Low serum cartonectin/CTRP3 concentrations in newly diagnosed type 2 diabetes mellitus: In vivo regulation of cartonectin by glucose. PLoS ONE 2014, 9, e112931. [Google Scholar] [CrossRef] [Green Version]
- Li, X.; Jiang, L.; Yang, M.; Wu, Y.W.; Sun, J.Z.; Sun, S.X. CTRP3 improves the insulin sensitivity of 3T3-L1 adipocytes by inhibiting inflammation and ameliorating insulin signalling transduction. Endokrynol. Polska 2014, 65, 252–258. [Google Scholar] [CrossRef] [Green Version]
- Li, X.; Jiang, L.; Yang, M.; Wu, Y.; Sun, S.; Sun, J. GLP-1 receptor agonist increases the expression of CTRP3, a novel adipokine, in 3T3-L1 adipocytes through PKA signal pathway. J. Endocrinol. Investig. 2015, 38, 73–79. [Google Scholar] [CrossRef]
- Qu, H.; Deng, M.; Wang, H.; Wei, H.; Liu, F.; Wu, J.; Deng, H. Plasma CTRP-3 concentrations in Chinese patients with obesity and type II diabetes negatively correlate with insulin resistance. J. Clin. Lipidol. 2015, 9, 289–294. [Google Scholar] [CrossRef] [PubMed]
- Choi, K.M.; Hwang, S.Y.; Hong, H.C.; Yang, S.J.; Choi, H.Y.; Yoo, H.J.; Lee, K.W.; Nam, M.S.; Park, Y.S.; Woo, J.T.; et al. C1q/TNF-related protein-3 (CTRP-3) and pigment epithelium-derived factor (PEDF) concentrations in patients with type 2 diabetes and metabolic syndrome. Diabetes 2012, 61, 2932–2936. [Google Scholar] [CrossRef] [PubMed] [Green Version]
- Wei, H.; Qu, H.; Wang, H.; Deng, H. Plasma C1q/TNF-Related Protein-3 (CTRP-3) and High-Mobility Group Box-1 (HMGB-1) Concentrations in Subjects with Prediabetes and Type 2 diabetes. J. Diabetes Res. 2016, 2016, 9438760. [Google Scholar] [CrossRef] [PubMed] [Green Version]
- Wolf, R.M.; Steele, K.E.; Peterson, L.A.; Magnuson, T.H.; Schweitzer, M.A.; Wong, G.W. Lower Circulating C1q/TNF-Related Protein-3 (CTRP3) Levels Are Associated with Obesity: A Cross-Sectional Study. PLoS ONE 2015, 10, e0133955. [Google Scholar] [CrossRef] [PubMed]
- Wagner, R.M.; Sivagnanam, K.; Clark, W.A.; Peterson, J.M. Divergent relationship of circulating CTRP3 levels between obesity and gender: A cross-sectional study. PeerJ 2016, 4, e2573. [Google Scholar] [CrossRef] [Green Version]
- Moradi, N.; Fadaei, R.; Khamseh, M.E.; Nobakht, A.; Rezaei, M.J.; Aliakbary, F.; Vatannejad, A.; Hosseini, J. Serum levels of CTRP3 in diabetic nephropathy and its relationship with insulin resistance and kidney function. PLoS ONE 2019, 14, e0215617. [Google Scholar] [CrossRef] [Green Version]
- Huang, N.; Zhang, X.; Jiang, Y.; Mei, H.; Zhang, L.; Zhang, Q.; Hu, J.; Chen, B. Increased levels of serum pigment epithelium-derived factor aggravate proteinuria via induction of podocyte actin rearrangement. Int. Urol. Nephrol. 2019, 51, 359–367. [Google Scholar] [CrossRef] [Green Version]
- Anastas, J.N.; Moon, R.T. WNT signalling pathways as therapeutic targets in cancer. Nat. Rev. Cancer 2013, 13, 11–26. [Google Scholar] [CrossRef]
- Chen, H.; Zheng, Z.; Li, R.; Lu, J.; Bao, Y.; Ying, X.; Zeng, R.; Jia, W. Urinary pigment epithelium-derived factor as a marker of diabetic nephropathy. Am. J. Nephrol. 2010, 32, 47–56. [Google Scholar] [CrossRef]
- Jenkins, A.J.; Zhang, S.X.; Rowley, K.G.; Karschimkus, C.S.; Nelson, C.L.; Chung, J.S.; O’Neal, D.N.; Januszewski, A.S.; Croft, K.D.; Mori, T.A.; et al. Increased serum pigment epithelium-derived factor is associated with microvascular complications. vascular stiffness and inflammation in Type 1 diabetes. Diabet. Med. 2007, 24, 1345–1351. [Google Scholar] [CrossRef]
- Nakamura, K.; Yamagishi, S.; Adachi, H.; Kurita-Nakamura, Y.; Matsui, T.; Inoue, H. Serum levels of pigment epithelium-derived factor (PEDF) are positively associated with visceral adiposity in Japanese patients with type 2 diabetes. Diabetes Metab. Res. Rev. 2009, 25, 52–56. [Google Scholar] [CrossRef] [PubMed]
- Yang, S.; Li, Q.; Zhong, L.; Song, Y.; Tian, B.; Cheng, Q. Serum pigment epithelium-derived factor is elevated in women with polycystic ovary syndrome and correlates with insulin resistance. J. Clin. Endocrinol. Metab. 2011, 96, 831–836. [Google Scholar] [CrossRef] [PubMed] [Green Version]
- Chen, C.; Tso, A.W.; Law, L.S.; Cheung, B.M.; Ong, K.L.; Wat, N.M. Plasma level of pigment epithelium-derived factor is independently associated with the development of the metabolic syndrome in Chinese men: A 10-year prospective study. J. Clin. Endocrinol. Metab. 2010, 95, 5074–5081. [Google Scholar] [CrossRef] [PubMed] [Green Version]
- Jenkins, A.; Zhang, S.X.; Gosmanova, A.; Aston, C.; Dashti, A.; Baker, M.Z.; Lyons, T.; Ma, J.X. Increased serum pigment epithelium derived factor levels in Type 2 diabetes patients. Diabetes Res. Clin. Prac. 2008, 82, 5–7. [Google Scholar] [CrossRef] [PubMed] [Green Version]
- Huang, K.T.; Lin, C.C.; Tsai, M.C.; Chen, K.D.; Chiu, K.W. Pigment epithelium-derived factor in lipid metabolic disorders. Biomed. J. 2018, 41, 102–108. [Google Scholar] [CrossRef]
- Sinclair, S.H.; Schwartz, S.S. Diabetic Retinopathy–An Underdiagnosed and Undertreated Inflammatory, Neuro-Vascular Complication of Diabetes. Front. Endocrinol. 2019, 10, 843. [Google Scholar] [CrossRef] [Green Version]
- Sabater, M.; Moreno-Navarrete, J.M.; Ortega, F.J.; Pardo, G.; Salvador, J.; Ricart, W.; Frühbeck, G.; Fernández-Real, J.M. Circulating pigment epithelium-derived factor levels are associated with insulin resistance and decrease after weight loss. J. Clin. Endocrinol. Metab. 2010, 95, 4720–4728. [Google Scholar] [CrossRef]
- Wang, P.; Smit, E.; Brouwers, M.C.; Goossens, G.H.; van der Kallen, C.J.; van Greevenbroek, M.M.; Mariman, E.C. Plasma pigment epithelium-derived factor is positively associated with obesity in Caucasian subjects, in particular with the visceral fat depot. Eur. J. Endocrinol. 2008, 159, 713–718. [Google Scholar] [CrossRef] [Green Version]
- Ahima, R.S. Adipose tissue as an endocrine organ. Obesity 2006, 14, 242–249. [Google Scholar] [CrossRef] [PubMed]
- Crowe, S.; Wu, L.E.; Economou, C.; Turpin, S.M.; Matzaris, M.; Hoehn, K.L.; Hevener, A.L.; James, D.E.; Duh, E.J.; Watt, M.J. Pigment epithelium-derived factor contributes to insulin resistance in obesity. Cell Metab. 2009, 10, 40–47. [Google Scholar] [CrossRef] [PubMed] [Green Version]
- Yamagishi, S.; Adachi, H.; Abe, A.; Yashiro, T.; Enomoto, M.; Furuki, K.; Hino, A.; Jinnouchi, Y.; Takenaka., K.; Matsui, T.; et al. Elevated serum levels of pigment epithelium-derived factor in the metabolic syndrome. J. Clin. Endocrinol. Metab. 2006, 91, 2447–2450. [Google Scholar] [CrossRef] [PubMed]
- Filleur, S.; Nelius, T.; de Riese, W.; Kennedy, R.C. Characterization of PEDF: A multi-functional serpin family protein. J. Cell. Biochem. 2009, 106, 769–775. [Google Scholar] [CrossRef] [PubMed]


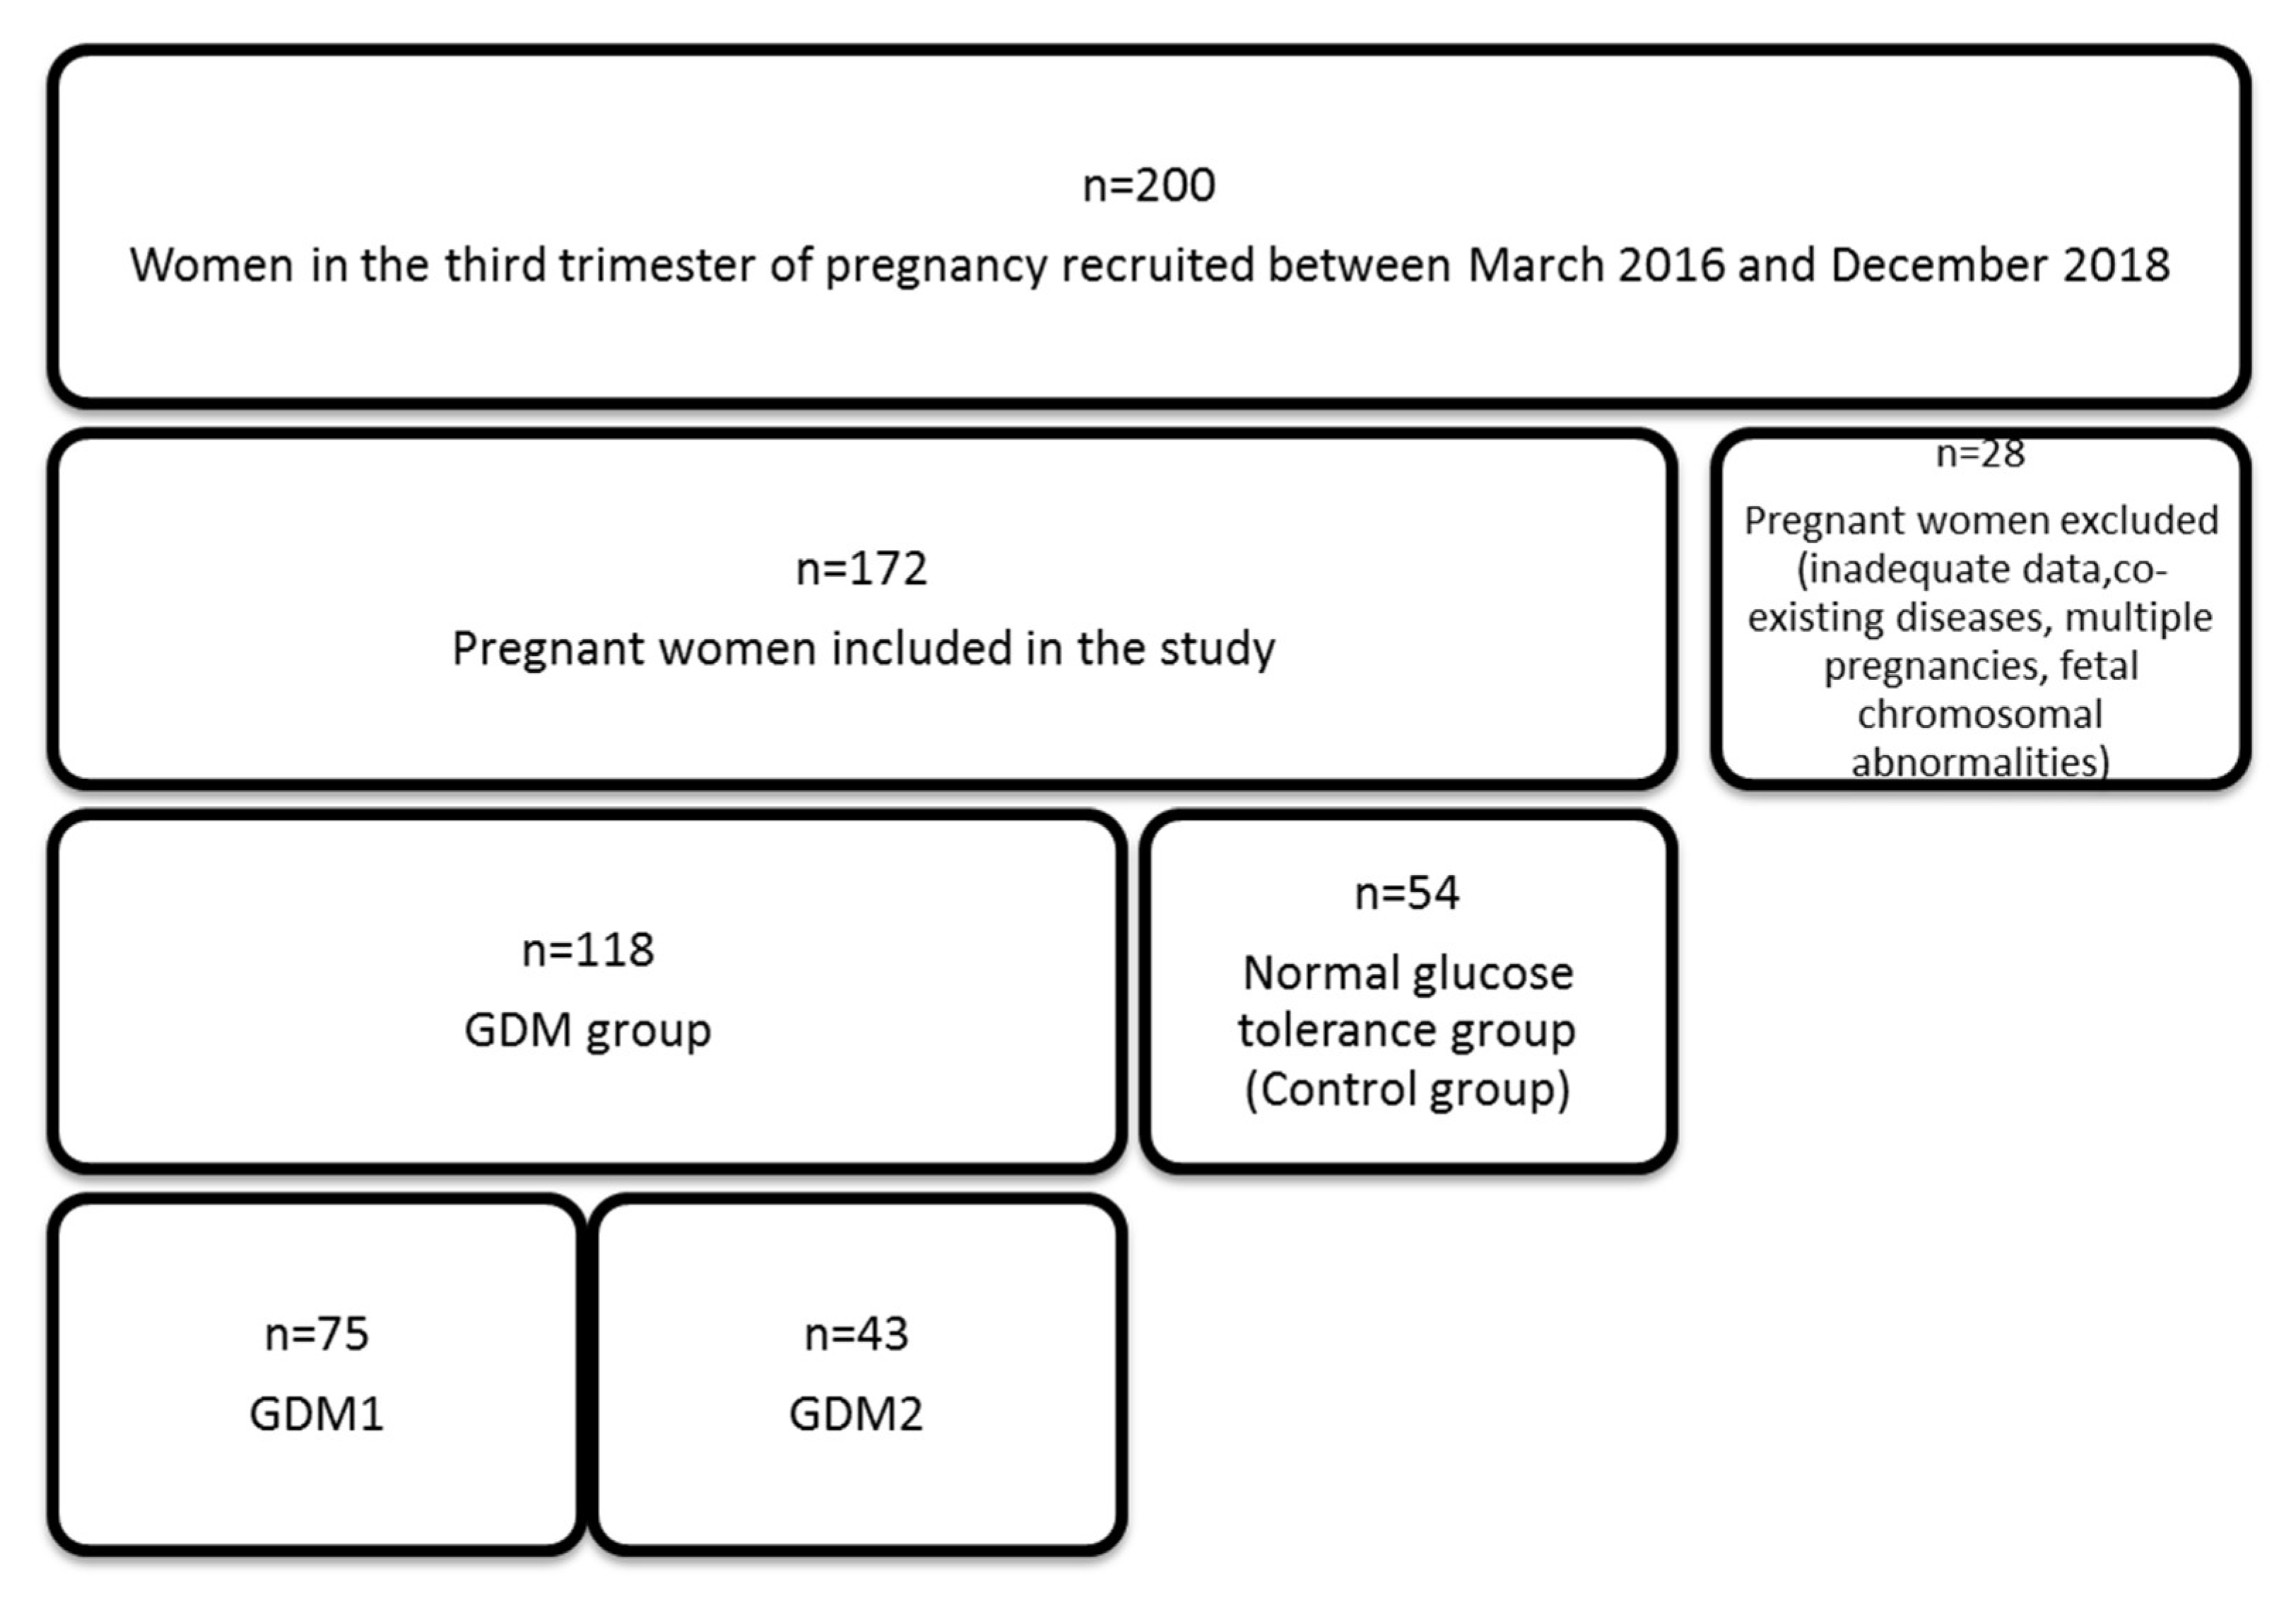
| Variable | Control (C) | GDM1 | GDM2 | GDM (1 + 2) | C vs. GDM (1 + 2) | C vs. GDM1 | C vs. GDM 2 | GDM1 vs. GDM2 |
|---|---|---|---|---|---|---|---|---|
| n = 54 (%) | n = 75 (%) | n = 43 (%) | n = 118 (%) | p | ||||
| Pregnancy [n] | 0.4871 | 0.1312 | 0.3586 | 0.0115 | ||||
| 1 | 26 (48.15) | 49 (65.33) | 16 (37.21) | 65 (55.08) | ||||
| 2 | 18 (33.33) | 15 (20.00) | 14 (32.56) | 29 (24.58) | ||||
| >2 | 10 (18.52) | 11 (14.67) | 13 (30.23) | 24 (20.34) | ||||
| Labor [n] | 0.7852 | 0.2368 | 0.4006 | 0.0138 | ||||
| 1 | 32 (59.26) | 55 (73.33) | 20 (46.51) | 75 (63.56) | ||||
| 2 | 15 (27.78) | 13 (17.33) | 14 (32.56) | 27 (22.88) | ||||
| >2 | 7 (12.96) | 7 (9.33) | 9 (20.93) | 16 (13.56) | ||||
| Labor Type | 0.5117 | 0.4311 | 0.8931 | 0.7283 | ||||
| Vaginal delivery | 22 (40.74) | 37 (49.33) | 19 (44.19) | 56 (47.46) | ||||
| Caesarean section | 32 (59.26) | 38 (50.67) | 24 (55.81) | 62 (52.54) | ||||
| Preterm Labor | 0.1086 | 0.3913 | 0.0282 | 0.1782 | ||||
| No | 53 (98.15) | 70 (93.33) | 36 (83.72) | 106 (89.83) | ||||
| Yes | 1 (1.85) | 5 (6.67) | 7 (16.28) | 12 (10.17) | ||||
| Sex of the Newborn | 0.6354 | 0.9901 | 0.1428 | 0.0815 | ||||
| Girl | 28 (51.85) | 40 (53.33) | 15 (34.88) | 55 (46.61) | ||||
| Boy | 26 (48.15) | 35 (46.67) | 28 (65.12) | 63 (53.39) | ||||
| APGAR 1 | 0.0125 | 0.0006 | 0.6296 | 0.0279 | ||||
| 10 | 36 (66.67) | 26 (33.77) | 25 (58.14) | 51 (43.22) | ||||
| 9 | 15 (27.78) | 35 (45.45) | 14 (32.56) | 49 (41.53) | ||||
| <9 | 3 (5.55) | 16 (20.78) | 4 (9.30) | 18 (15.25) | ||||
| BMI (before Pregnancy) [kg/m 2] | 0.0014 | 0.0055 | 0.0005 | 0.1287 | ||||
| <18.50 | 3 (5.56) | 6 (8.00) | - | 6 (5.08) | ||||
| 18.50–24.99 | 45 (83.33) | 43 (57.33) | 24 (55.81) | 67 (56.78) | ||||
| >24.99 | 6 (11.11) | 26 (34.67) | 19 (44.19) | 45 (38.14) | ||||
| Variable | Control (C) (n = 54) | GDM1 (n = 75) | GDM2 (n = 43) | GDM (1 + 2) (n = 118) | C vs. GDM (1 + 2) | C vs. GDM1 vs. GDM2 |
|---|---|---|---|---|---|---|
| Me (Interquartile Range) | p | |||||
| Age [years] | 29.00 (26.00–34.00) | 32.00 (28.00–35.00) | 31.00 (27.00–36.00) | 32.00 (28.00–35.00) | 0.0733 | 0.1980 |
| Glucose [mg/dL] | 60.04 (52.72–66.21) | 67.11 (51.95–75.21) | 66.43 (55.98–76.75) | 66.62 (54.70–75.92) | 0.0013 | 0.0055 (C vs. GDM1; C vs. GDM2) |
| Insulin [uLU/mL] | 11.77 (7.44–17.98) | 11.40 (6.69–18.44) | 12.94 (8.43–22.68) | 12.50 (8.18–19.67) | 0.6776 | 0.3761 |
| OGTT (Fasting) [mg/dL] | 79.50 (77.00–84.00) | 82.00 (79.00–88.00) | 88.00 (82.00–93.00) | 85.00 (80.00–89.00) | <0.0001 | <0.0001 (C vs. GDM1; C vs. GDM2; GDM1 vs. GDM2) |
| OGTT (75g 2 h) [mg/dL] | 110.00 (93.00–119.00) | 158.00 (155.00–162.00) | 160.00 (155.00–169.00) | 159.00 (155.00–165.50) | <0.0001 | <0.0001 (C vs. GDM1; C vs. GDM2) |
| HOMA-IR | 1.58 (1.22–2.50) | 1.75 (1.15–3.11) | 2.05 (1.48–3.67) | 1.96 (1.18–3.43) | 0.0954 | 0.0857 |
| PEDF [ng/mL] | 40.67 (31.05–119.37) | 38.25 (32.54–163.24) | 54.96 (28.91–186.57) | 42.07 (32.25–163.24) | 0.9789 | 0.8543 |
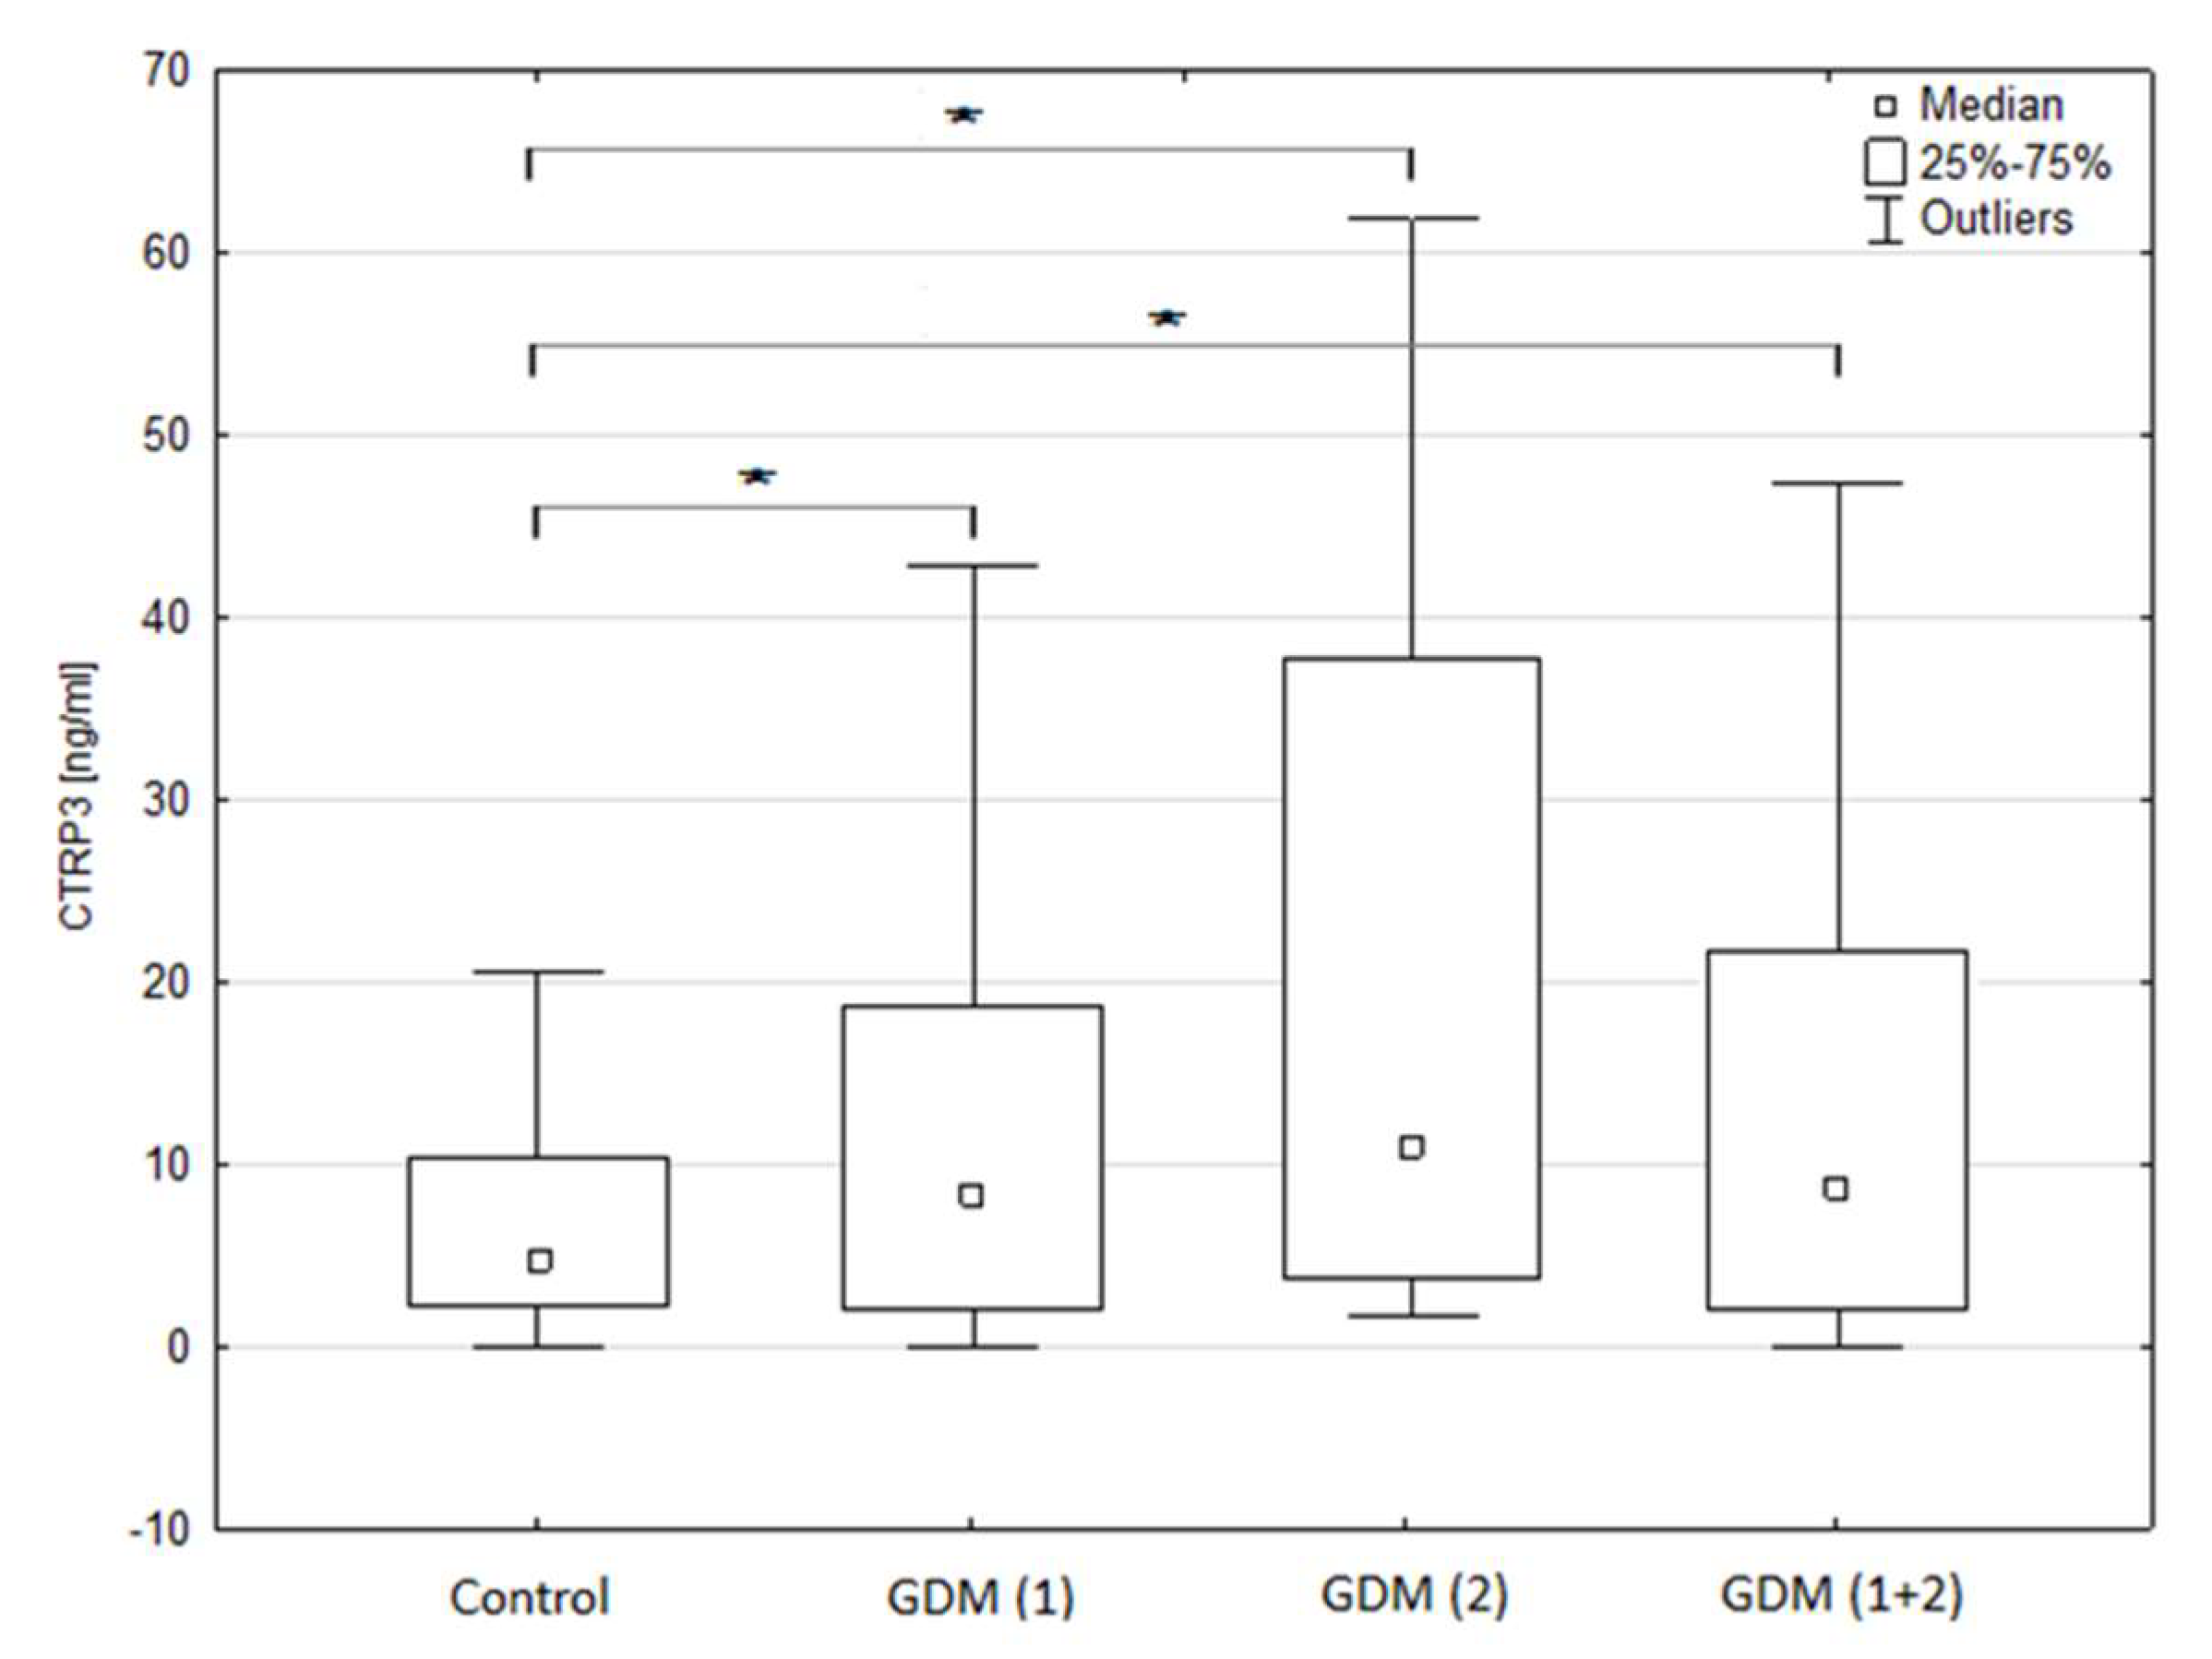
| CTRP3 [ng/mL] | 4.79 (2.74–12.12) | 8.40 (1.99–18.66) | 10.96 (3.17–25.59) | 8.84 (2.60–18.98) | 0.0265 | 0.0178 (C vs. GDM1; C vs. GDM2) |
| Pregnancy [n] | 2.00 (1.00–2.00) | 1.00 (1.00–2.00) | 2.00 (1.00–3.00) | 1.00 (1.00–2.00) | 0.8070 | 0.0421 (GDM1 vs. GDM2) |
| Labor [n] | 1.00 (1.00–2.00) | 1.00 (1.00–2.00) | 1.50 (1.00–2.00) | 1.00 (1.00–2.00) | 0.6349 | 0.1116 |
| Gestational Age at Birth [weeks] | 40.00 (38.60–41.00) | 39.00 (38.00–39.00) | 38.00 (37.00–39.00) | 38.40 (37.55–39.00) | <0.0001 | <0.0001 |
| Birth weight of the Newborn [g] | 3435.00 (3170.00–3840.00) | 3370.00 (3100.00–3790.00) | 3400.00 (3130.00–3650.00) | 3375.00 (3100.00–3780.00) | 0.3698 | 0.6619 |
| APGAR 1 | 10.00 (9.00–10.00) | 9.00 (9.00–10.00) | 10.00 (9.00–10.00) | 9.00 (9.00–10.00) | 0.0590 | 0.0029 (C vs. GDM1; GDM1 vs. GDM2) |
| APGAR 5 | - | - | 10.00 (5.00–10.00) | 10.00 (5.00–10.00) | 1.0000 | 1.0000 |
| BMI (before pregnancy) [kg/m2] | 23.28 (21.48–24.38) | 23.23 (21.48–25.78) | 24.22 (22.77–27.82) | 23.44 (22.09–26.15) | 0.0341 | 0.0164 (C vs. GDM2; GDM1 vs GDM2) |
| Weight (Baseline) [kg] | 65.00 (59.00–69.00) | 65.00 (60.00–75.00) | 66.00 (60.00–76.00) | 65.00 (60.00–75.00) | 0.0566 | 0.1431 |
| Weight (Current) [kg] | 76.50 (72.00–83.00) | 79.50 (74.00–85.00) | 78.50 (72.50–86.50) | 79.00 (74.00–86.00) | 0.1048 | 0.2640 |
| Height [cm] | 167.00 (163.00–171.00) | 167.00 (164.00–170.00) | 166.50 (162.00–170.00) | 167.00 (164.00–170.00) | 0.9945 | 0.7559 |
| Increase of Weight during Pregnancy [kg] | 14.00 (11.00–16.00) | 13.00 (12.00–15.00) | 11.50 (7.00–14.00) | 12.50 (10.00–15.00) | 0.1066 | 0.1213 |
| Variable | Control | GDM1 | GDM2 | GDM (1 + 2) | ||||
|---|---|---|---|---|---|---|---|---|
| rho | p | rho | p | rho | p | rho | p | |
| Age [years] | −0.412 | 0.0020 | −0.074 | 0.5420 | −0.103 | 0.5119 | −0.097 | 0.3053 |
| Glucose [mg/dL] | 0.012 | 0.9306 | 0.024 | 0.8377 | −0.142 | 0.3648 | −0.038 | 0.6860 |
| Insulin [uLU/mL] | 0.008 | 0.9553 | −0.089 | 0.4470 | 0.110 | 0.4820 | 0.008 | 0.9287 |
| OGTT (Fasting) [mg/dL] | 0.041 | 0.7691 | 0.059 | 0.6149 | 0.087 | 0.5817 | 0.046 | 0.6267 |
| OGTT (75 g 2 h) [mg/dL] | −0.086 | 0.5363 | 0.114 | 0.3342 | 0.239 | 0.1268 | 0.156 | 0.0940 |
| HOMA-IR | −0.006 | 0.9657 | −0.061 | 0.6040 | 0.038 | 0.8067 | −0.001 | 0.9878 |
| Pregnancy [n] | −0.205 | 0.1407 | −0.128 | 0.2933 | 0.061 | 0.7026 | −0.033 | 0.7283 |
| Labor [n] | −0.220 | 0.1129 | −0.104 | 0.3967 | −0.001 | 0.9937 | −0.053 | 0.5857 |
| Gestational Age [weeks] | 0.035 | 0.8048 | −0.045 | 0.7089 | 0.001 | 0.9967 | −0.057 | 0.5525 |
| Birth weight of the Newborn [g] | 0.066 | 0.6402 | 0.095 | 0.4356 | 0.042 | 0.7949 | 0.012 | 0.9040 |
| APGAR 1 | −0.146 | 0.3343 | 0.059 | 0.6646 | 0.330 | 0.0699 | 0.172 | 0.1098 |
| APGAR 2 | - | - | - | - | 0.825 | 0.0117 | 0.825 | 0.0117 |
| BMI (before Pregnancy) [kg/m2] | −0.079 | 0.5693 | −0.019 | 0.8748 | −0.351 | 0.0210 | −0.128 | 0.1711 |
| Weight (Initial) [kg] | 0.001 | 0.9961 | −0.295 | 0.0719 | −0.191 | 0.2381 | −0.229 | 0.0438 |
| Weight (Current) [kg] | 0.075 | 0.5920 | −0.019 | 0.8761 | −0.143 | 0.3799 | −0.101 | 0.2930 |
| Height [cm] | 0.226 | 0.0999 | 0.114 | 0.3441 | 0.052 | 0.7504 | 0.056 | 0.5601 |
| Increase of Weight during Pregnancy [kg] | 0.290 | 0.0504 | −0.313 | 0.0556 | 0.095 | 0.5600 | −0.083 | 0.4696 |
| Variable | Control | GDM1 | GDM2 | GDM (1 + 2) | ||||
|---|---|---|---|---|---|---|---|---|
| rho | p | rho | p | rho | p | rho | p | |
| Age [years] | −0.081 | 0.5631 | 0.117 | 0.3382 | −0.014 | 0.9265 | 0.043 | 0.6499 |
| Glucose [mg/dL] | 0.043 | 0.7593 | −0.020 | 0.8654 | −0.087 | 0.5812 | −0.048 | 0.6037 |
| Insulin [uLU/mL] | −0.215 | 0.1225 | 0.145 | 0.2164 | 0.333 | 0.0293 | 0.208 | 0.0243 |
| OGTT (Fasting) [mg/dl] | −0.096 | 0.4953 | 0.095 | 0.4249 | 0.136 | 0.3920 | 0.129 | 0.1706 |
| OGTT (75 g 2 h) [mg/dL] | −0.145 | 0.3003 | −0.136 | 0.2517 | 0.029 | 0.8567 | −0.034 | 0.7155 |
| HOMA-IR | −0.221 | 0.1125 | 0.124 | 0.2943 | 0.240 | 0.1214 | 0.171 | 0.0651 |
| PEDF [ng/mL] | 0.111 | 0.4300 | 0.210 | 0.0731 | 0.252 | 0.1026 | 0.158 | 0.0892 |
| Pregnancy [n] | −0.060 | 0.6729 | −0.001 | 0.9951 | 0.062 | 0.6954 | 0.019 | 0.8417 |
| Labor [n] | −0.088 | 0.5336 | 0.053 | 0.6671 | 0.099 | 0.5449 | 0.077 | 0.4277 |
| Gestational Age [weeks] | 0.005 | 0.9742 | −0.163 | 0.1815 | −0.382 | 0.0126 | −0.254 | 0.0070 |
| Birth Weight of the Newborn [g] | −0.045 | 0.7531 | −0.068 | 0.5809 | 0.000 | 0.9989 | −0.050 | 0.6090 |
| APGAR 1 | 0.115 | 0.4510 | −0.214 | 0.1136 | 0.100 | 0.5935 | −0.052 | 0.6356 |
| APGAR 2 | - | - | - | - | 0.536 | 0.1708 | 0.536 | 0.1708 |
| BMI (before Pregnancy) [kg/m2] | 0.075 | 0.5926 | −0.113 | 0.3433 | −0.037 | 0.8123 | −0.073 | 0.4389 |
| Weight (Baseline) [kg] | −0.132 | 0.3819 | −0.211 | 0.2096 | 0.121 | 0.4568 | −0.011 | 0.9252 |
| Weight (Current) [kg] | 0.008 | 0.9542 | −0.256 | 0.0341 | 0.188 | 0.2465 | −0.080 | 0.4081 |
| Height [cm] | −0.086 | 0.5423 | −0.173 | 0.1512 | 0.236 | 0.1433 | −0.033 | 0.7327 |
| Increase of Weight during Pregnancy [kg] | 0.027 | 0.8610 | −0.352 | 0.0326 | 0.126 | 0.4381 | −0.052 | 0.6507 |
© 2020 by the authors. Licensee MDPI, Basel, Switzerland. This article is an open access article distributed under the terms and conditions of the Creative Commons Attribution (CC BY) license (http://creativecommons.org/licenses/by/4.0/).
Share and Cite
Gęca, T.; Kwiatek, M.; Krzyżanowski, A.; Kwaśniewska, A. C1q/TNF-Related Protein-3 (CTRP-3) and Pigment Epithelium-Derived Factor (PEDF) Concentrations in Patients with Gestational Diabetes Mellitus: A Case-Control Study. J. Clin. Med. 2020, 9, 2587. https://doi.org/10.3390/jcm9082587
Gęca T, Kwiatek M, Krzyżanowski A, Kwaśniewska A. C1q/TNF-Related Protein-3 (CTRP-3) and Pigment Epithelium-Derived Factor (PEDF) Concentrations in Patients with Gestational Diabetes Mellitus: A Case-Control Study. Journal of Clinical Medicine. 2020; 9(8):2587. https://doi.org/10.3390/jcm9082587
Chicago/Turabian StyleGęca, Tomasz, Maciej Kwiatek, Arkadiusz Krzyżanowski, and Anna Kwaśniewska. 2020. "C1q/TNF-Related Protein-3 (CTRP-3) and Pigment Epithelium-Derived Factor (PEDF) Concentrations in Patients with Gestational Diabetes Mellitus: A Case-Control Study" Journal of Clinical Medicine 9, no. 8: 2587. https://doi.org/10.3390/jcm9082587