Article

Neuropilin1 Expression Acts as a Prognostic Marker in Stomach Adenocarcinoma by Predicting the Infiltration of Treg Cells and M2 Macrophages

1
Department of Health Industry, Sookmyung Women’s University, Seoul 04310, Korea
2
Department of Stem Cell and Regenerative Biotechnology, Konkuk University, Seoul 05029, Korea
3
Department of Cosmetic Sciences, Sookmyung Women’s University, Seoul 04310, Korea
4
Nano-Bio Resources Center, Sookmyung Women’s University, Seoul 04310, Korea
*
Author to whom correspondence should be addressed.
These authors contributed equally to this work.
J. Clin. Med. 2020, 9(5), 1430; https://doi.org/10.3390/jcm9051430
Submission received: 7 April 2020 / Revised: 27 April 2020 / Accepted: 9 May 2020 / Published: 12 May 2020
(This article belongs to the Section Oncology)

Abstract

:
Neuropilin1 (NRP1) plays a critical role in tumor progression and immune responses. Although the roles of NRP1 in various tumors have been investigated, the clinical relevance of NRP1 expression in stomach adenocarcinoma (STAD) has not been studied. To investigate the use of NRP1 as a prognostic biomarker of STAD, we analyzed NRP1 mRNA expression and its correlation with patient survival and immune cell infiltration using various databases. NRP1 mRNA expression was significantly higher in STAD than normal tissues, and Kaplan-Meier survival analysis showed that NRP1 expression was significantly associated with poor prognosis in patients with STAD. To elucidate the related mechanism, we analyzed the correlation between NRP1 expression and immune cell infiltration level. In particular, the infiltration of immune-suppressive cells, such as regulatory T (Treg) cells and M2 macrophage, was significantly increased by NRP1 expression. In addition, the expression of interleukin (IL)-35, IL-10, and TGF-β1 was also positively correlated with NRP1 expression, resulting in the immune suppression. Collectively in this study, our integrated analysis using various clinical databases shows that the significant correlation between NRP1 expression and the infiltration of Treg cells and M2 macrophage explains poor prognosis mechanism in STAD, suggesting the clinical relevance of NRP1 expression as a prognostic biomarker for STAD patients.

1. Introduction

Stomach adenocarcinoma (STAD) is one of the most common malignancies and is third in cancer-related deaths worldwide [1]. In addition, its poor prognosis is associated with high invasion, metastasis, and a low early prognosis rate [2]. Recently, advanced surgery and chemotherapy have significantly reduced mortality, however, overall prognosis has not significantly improved [3]. Therefore, the finding of novel biomarkers that allow the prediction of progression and prognosis in patients with STAD have important implications in the development of new drug targets [4,5].
Neuropilin1 (NRP1) is a cell surface glycoprotein involved in various cellular processes, including angiogenesis, cell migration, and axon growth [6]. Especially in various types of tumor, NRP1 has a critical role in cell migration, invasion and angiogenesis, promoting tumor progression [7]. In addition, expression of NRP1 is correlated with poor prognosis in various types of tumor, including lung cancer, colon cancer, ovarian cancer, and prostate cancer [8], implying that NRP1 could be a potential molecular target for treatments of tumor. In gastric cancer, NRP1 also acts as a receptor for major signaling pathways including vascular endothelial growth factor (VEGF), epidermal growth factor (EGF), and semaphorin-3A (SEMA3), showing an important role in tumor development and metastasis [9,10]. NRP1 activates tumor angiogenesis through interaction with VEGF and its receptor and promotes the growth and metastasis of gastric cancer [11,12,13]. Depletion of NRP1 reduces cell proliferation via inhibiting the G1-S phase of cell cycle in gastric cancer cells [11]. Although previous studies have investigated the roles of NRP1 in the progression of gastric cancer in vivo and in vitro, the clinical relevance of NRP1 in gastric cancer has not been fully understood. Therefore, in this study, we performed a comprehensive analysis using various databases and web tools to elucidate NRP1 expression and its correlation with the patient’s clinical outcome in STAD.
In the tumor microenvironment (TME), tumor cells interact with various cells, including immune cells, fibroblasts, and stromal cells [14]. The interaction provides an important environment for tumor immune escape, resulting in the development of various malignant tumors. Particularly, the most abundant immune cells in the TME are known as macrophages [15]. It is well known that macrophages are polarized into two subsets, M1 and M2, which produce a variety of cytokines, proteases and growth factors, acting on the regulation of tumor immunity [16]. M1 macrophages produce type 1 helper T (Th1) cytokines (IL-6, IL-8, IL-12, and tumor necrosis factor (TNF)-α), leading to primarily anti-cancer responses. However, M2 macrophages produce Th2 cytokines such as IL-4, IL-10 and IL-13 to stimulate Th2 immune responses and regulatory T (Treg) cell activation. In the TME, M2 macrophages promote the proliferation of Th2 cells, and induce immune tolerance by activation of Treg cells [17,18,19]. Additionally, it has been reported that M2 macrophages correlate with poor prognosis in gastric cancer. Especially, gastric cancer-derived mesenchymal stromal cells stimulate macrophages to induce M2 macrophage polarization in TME, and the M2 macrophages enhance tumor metastasis, resulting in the poor prognosis of gastric cancer [20]. In addition to M2 macrophages, Treg cells play a critical role in the development and progression of various tumors by their immune-suppressive functions in the TME. A number of studies have shown that a high level of Treg cells acts on innate immune cells and effector T cells to suppress immune responses through secretion of inhibitory cytokines, such as IL-10, TGF-β, and IL-35. In addition, high levels of Treg cells have been observed in patients with various tumors. These are associated with poor prognosis of various types of tumor including gastric cancer, breast cancer and ovarian cancer [19,21,22,23]. Therefore, these studies provide strong evidences that M2 macrophages and Treg cells are highly correlated with tumor immunity and patient prognosis. Moreover, recent studies suggest that the positive feedback between Treg cells and M2 macrophages in TME play an important role in pro-cancer responses and patient prognosis [24,25]. In nasopharyngeal carcinoma (NPC), cancer cells promote M2 macrophage polarization via the release of TGF-β1 and IL-10, and the tumor-infiltrating M2 macrophages induce the recruitment of Treg cells by chemotaxis, resulting in the induction of the density of Treg cells in TME [25].
Interestingly, it has been reported that NRP1 expression increases infiltration of Treg cells in the TME. In vivo study also shows that gene deletion of NRP1 in tumor infiltrating macrophages exerts an anti-cancer function through suppression of an immune suppression mechanism, and is associated with a better prognosis [25,26]. Therefore, in this study, we investigated NRP1 mRNA expression and its correlation with prognosis of cancer patients using various databases. As shown in the results, NRP1 mRNA expression was significantly higher in STAD, compared with normal tissues. The higher expression of NRP1 was associated with poor patient survival in STAD. Furthermore, NRP1 expression showed positive correlation with tumor infiltration of Treg cells and M2 macrophages. Collectively, our study suggests that NRP1 expression could act as an effective prognostic marker by predicting the infiltration of Treg cells and M2 macrophages, indicating the role of NRP1 as a prognosis biomarker in patients with STAD.

2. Experimental Section

2.1. Analysis of NRP1 Expression in Various Types of Tumors and Normal Tissues

NRP1 expression in various cancers and normal tissues was analyzed using the Oncomine, Gene Expression Profiling Analysis (GEPIA2) and Tumor Immune Estimation Resource (TIMER) databases. In the Oncomine database, a tumor microarray database, was used to compare the transcription levels of NRP1 between tumor and corresponding normal tissues in different types of cancer [27,28]. The threshold was determined according to the following values: p-value < 1 × 10⁻⁴, fold-change > 2, and gene ranking top 5%. GEPIA2 can assess the effect of 9736 tumors and 8587 normal samples from The Cancer Genome Atlas (TCGA) and the GTEx projects [29,30]. Expression level of NRP1 across 33 TCGA tumors was compared to normal TCGA and GTEx data using GEPIA2. TIMER database supplies an analysis of relative expression of the gene across tumor and normal tissues [31,32]. NRP1 expression was analyzed in cancers to compare with normal tissues.

2.2. Evaluation of the Relationship between NRP1 Expression and Promoter Methylation in Clinical Characteristics

UALCAN database, using TCGA transcriptome and clinical patient data, provides the expression level of genes and patient characteristics [33,34]. The association between mRNA levels and promoter methylation of NRP1 and clinicopathological features was analyzed to determine the prognostic value of NRP1 in patients with stomach adenocarcinoma (STAD). mRNA levels and promoter methylation of NRP1 were separately analyzed with STAD patient characteristics, including individual cancer stage, age, histological subtype, race, gender, and tumor grade, compared to the normal tissues.

2.3. Evaluation of the Relationship between NRP1 Expression and Patient Survival with Various Tumors

The correlation between NRP1 expression and survival in various cancers was assessed by the GEPIA2 and Kaplan-Meier survival plotter [35]. We used GEPIA to perform overall survival analysis and assessment of the NRP1 expression levels in STAD and lung adenocarcinoma (LUAD) of the TCGA database. NRP1 high and low patient groups were split by median NRP1 expression. We assessed cancer prognosis, including overall survival (OS), first progression (FS), and post progression survival (PPS) using gene chip datasets of Kaplan-Meier survival plotter with best cut off option, which split patient groups at the NRP1 expression level to minimize log rank P-value [36]. These data provide the hazard ratio (HR) value with 95% confidence intervals and log-rank P-values [29].

2.4. Evaluation of the Correlation between NRP1 Expression and Immune Cell Infiltration

We analyzed the correlation between immune cell and NRP1 expression in STAD using the TIMER database. The correlation between NRP1 expression and genetic markers of tumor-infiltrating immune cells was explored through the correlation module [31]. The correlation module generated expression scatter plots between a pair of user-defined genes in a given cancer type, along with the Spearman’s correlation and the estimated statistical significance. NRP1 was used for the x-axis with gene symbols, and related marker genes of tumor-associated macrophages (TAM), M1 macrophages, M2 macrophages, and Treg cells were represented on the y-axis as gene symbols. Gene expression was displayed with log2 RSEM. Correlation of immune signatures and NRP1 expression was also confirmed in Tumor Gastric- Tan-192-fRMA-u133p2 dataset in R2: Genomics Analysis and Visualization platform [37].

3. Results

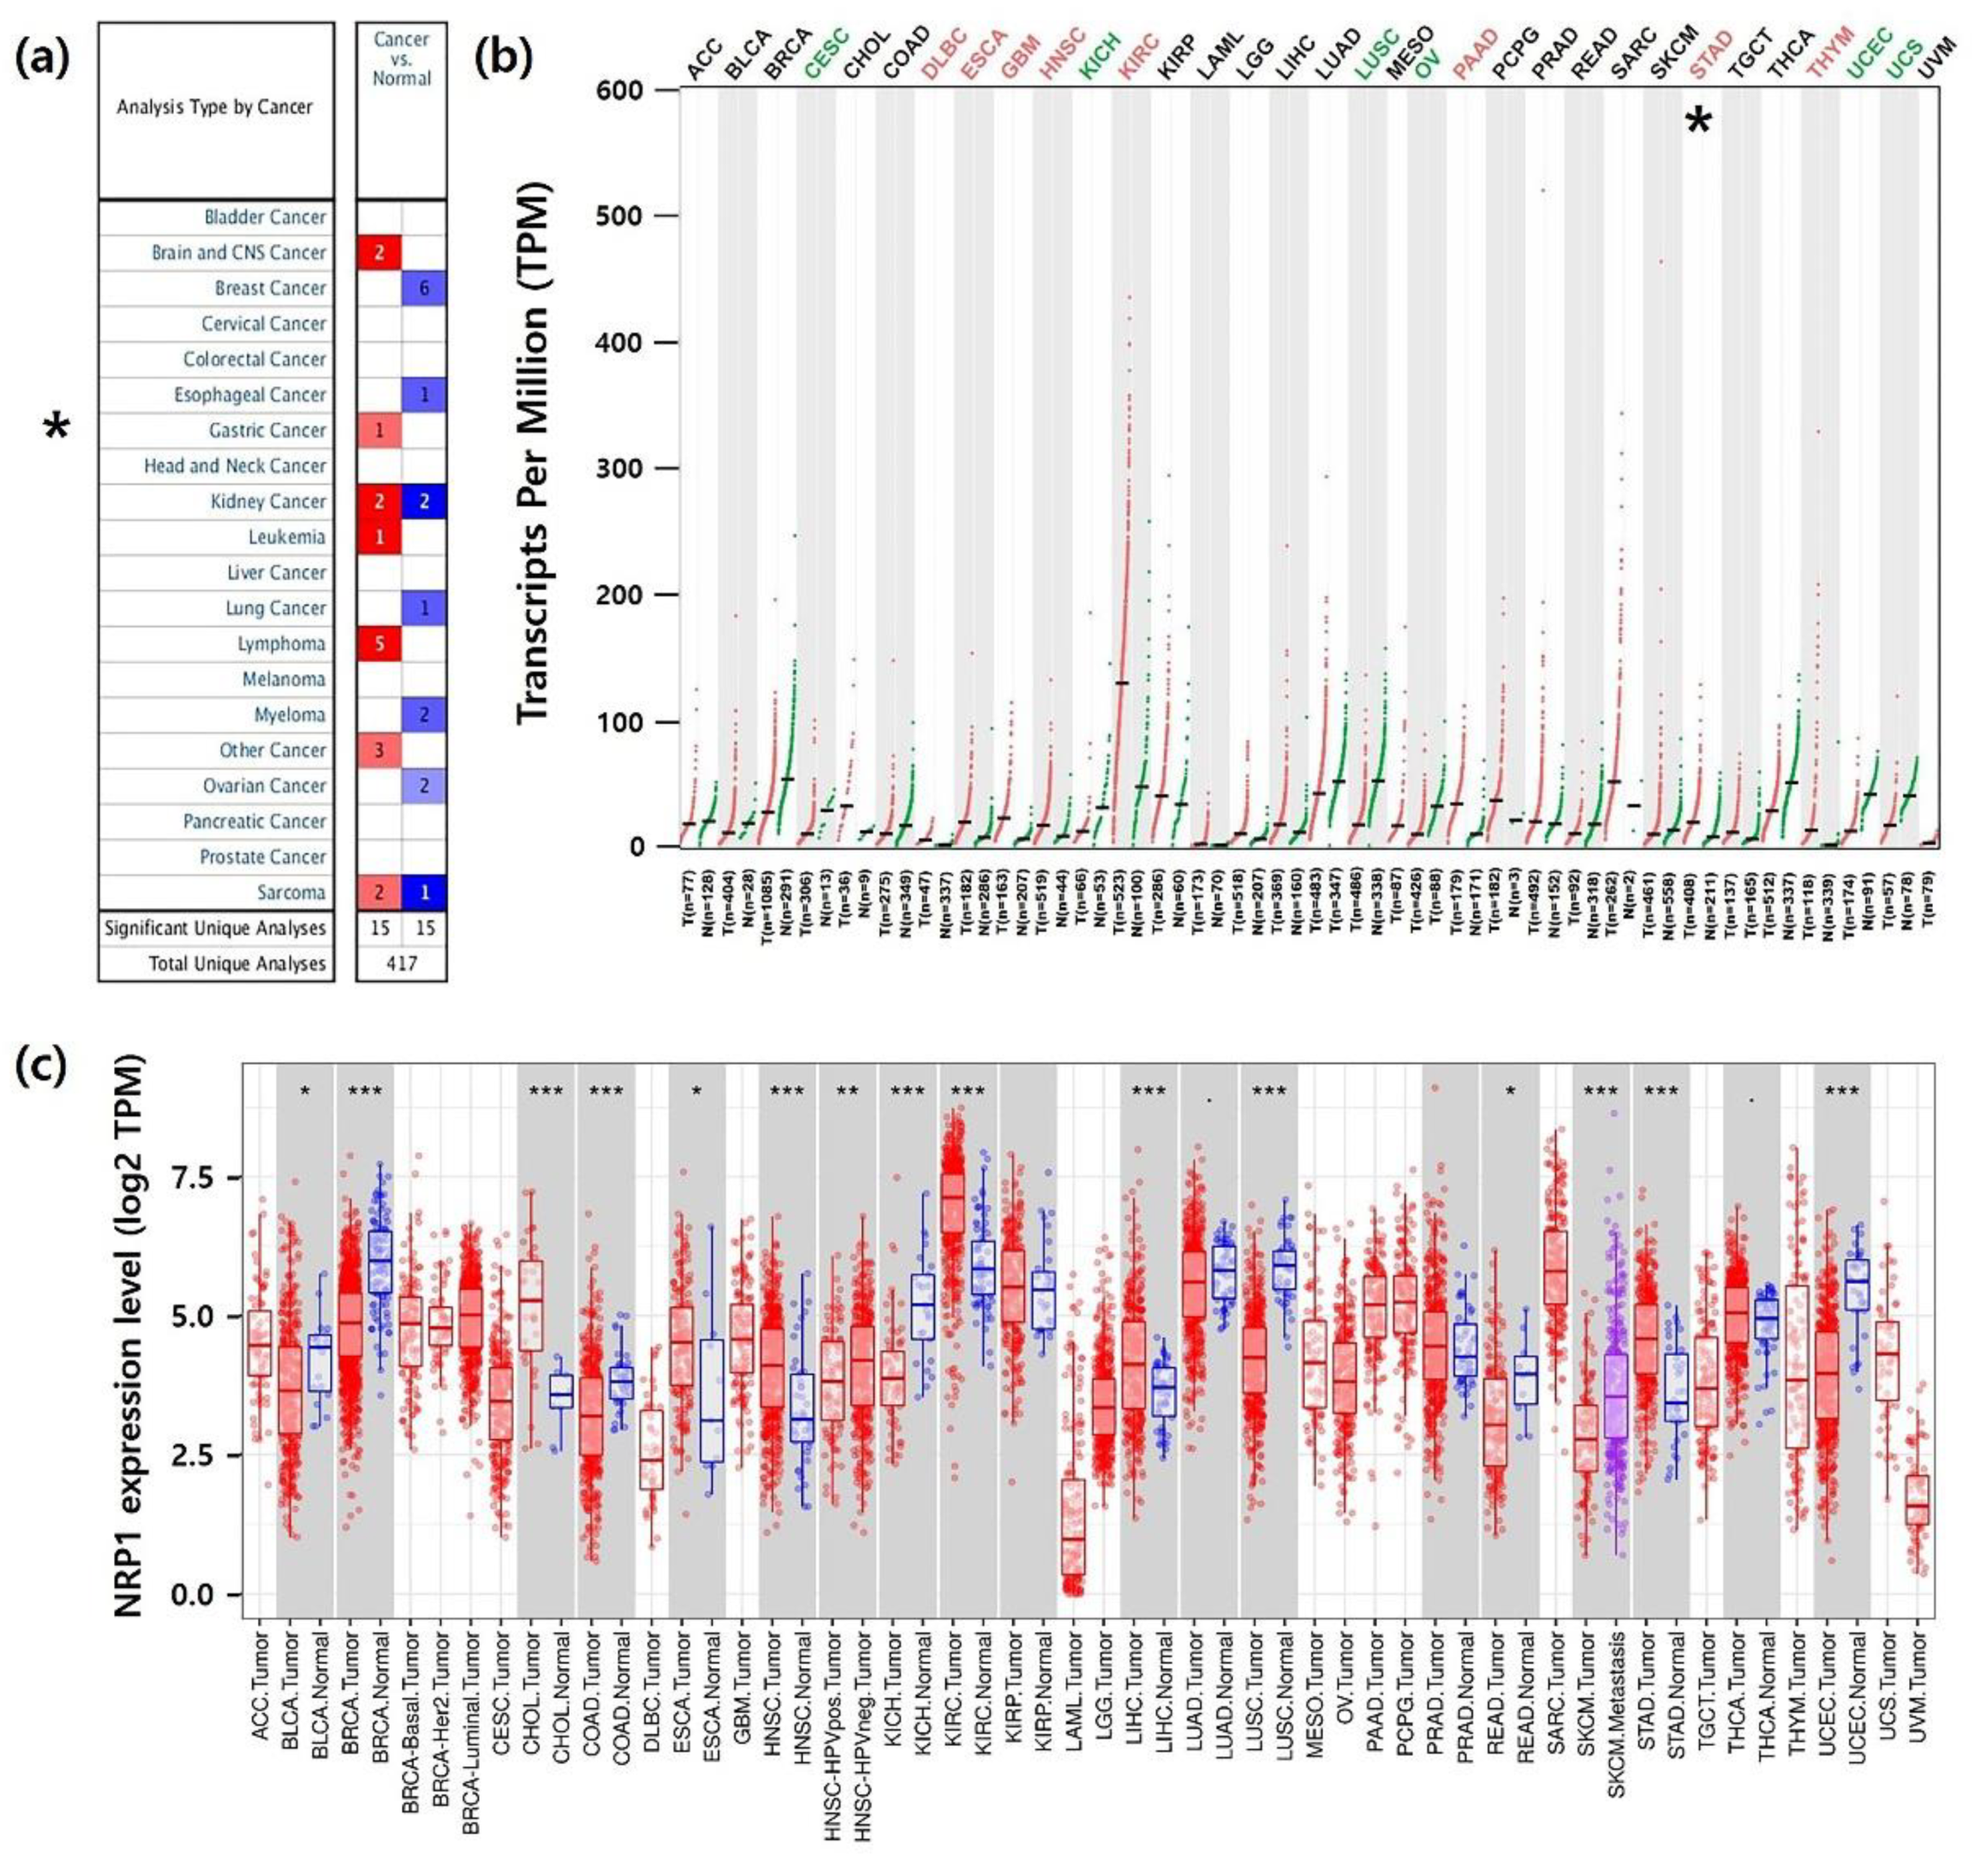
3.1. mRNA Expression Levels of NRP1 in Various Types of Human Cancer

To analyze NRP1 mRNA expression between tumors and normal tissues, we identified NRP1 mRNA levels using three independent bioinformatics databases. In the Oncomine database, NRP1 mRNA expression demonstrated upregulation of NRP1 in lymphoma, brain and central nervous system (CNS), kidney, leukemia, sarcoma, and gastric cancer tissues compared to normal tissues (p-value: 1 × 10⁻⁴, fold-change: 2) (Figure 1a). As shown in Figure 1b, compared with normal tissues, NRP1 transcript levels were significantly lower in CESC (cervical squamous cell carcinoma and endocervical adenocarcinoma), KICH (kidney chromophobe), LUSC (lung squamous cell carcinoma), OV (ovarian serous cystadenocarcinoma), UCEC (uterine corpus endometrial carcinoma), and UCS (uterine carcinosarcoma). However, it was significantly increased in STAD (stomach adenocarcinoma), DLBC (lymphoid neoplasm diffuse large B-cell lymphoma), ESCA (esophageal carcinoma), GBM (glioblastoma multiforme), HNSC (head and neck squamous cell carcinoma), KIRC (kidney renal clear cell carcinoma), PAAD (pancreatic adenocarcinoma), and THYM (thymoma). In addition, we further analyzed the NRP1 expression among 36 types of cancer and normal tissues from TCGA data. Figure 1c shows the upregulation of the NRP1 transcript levels in CHOL (cholangio carcinoma), ESCA (esophageal carcinoma), HNSC (head and neck squamous cell carcinoma), KIRC, and LIHC (liver hepatocellular carcinoma), including STAD. However, downregulation of NRP1 transcription level was confirmed in BRCA (breast invasive carcinoma), COAD (colon adenocarcinoma), KICH, LUSC, READ (rectum adenocarcinoma), and UCEC. Collectively, data from all three databases shows that NRP1 mRNA expression in STAD was significantly higher compared to in normal tissues.

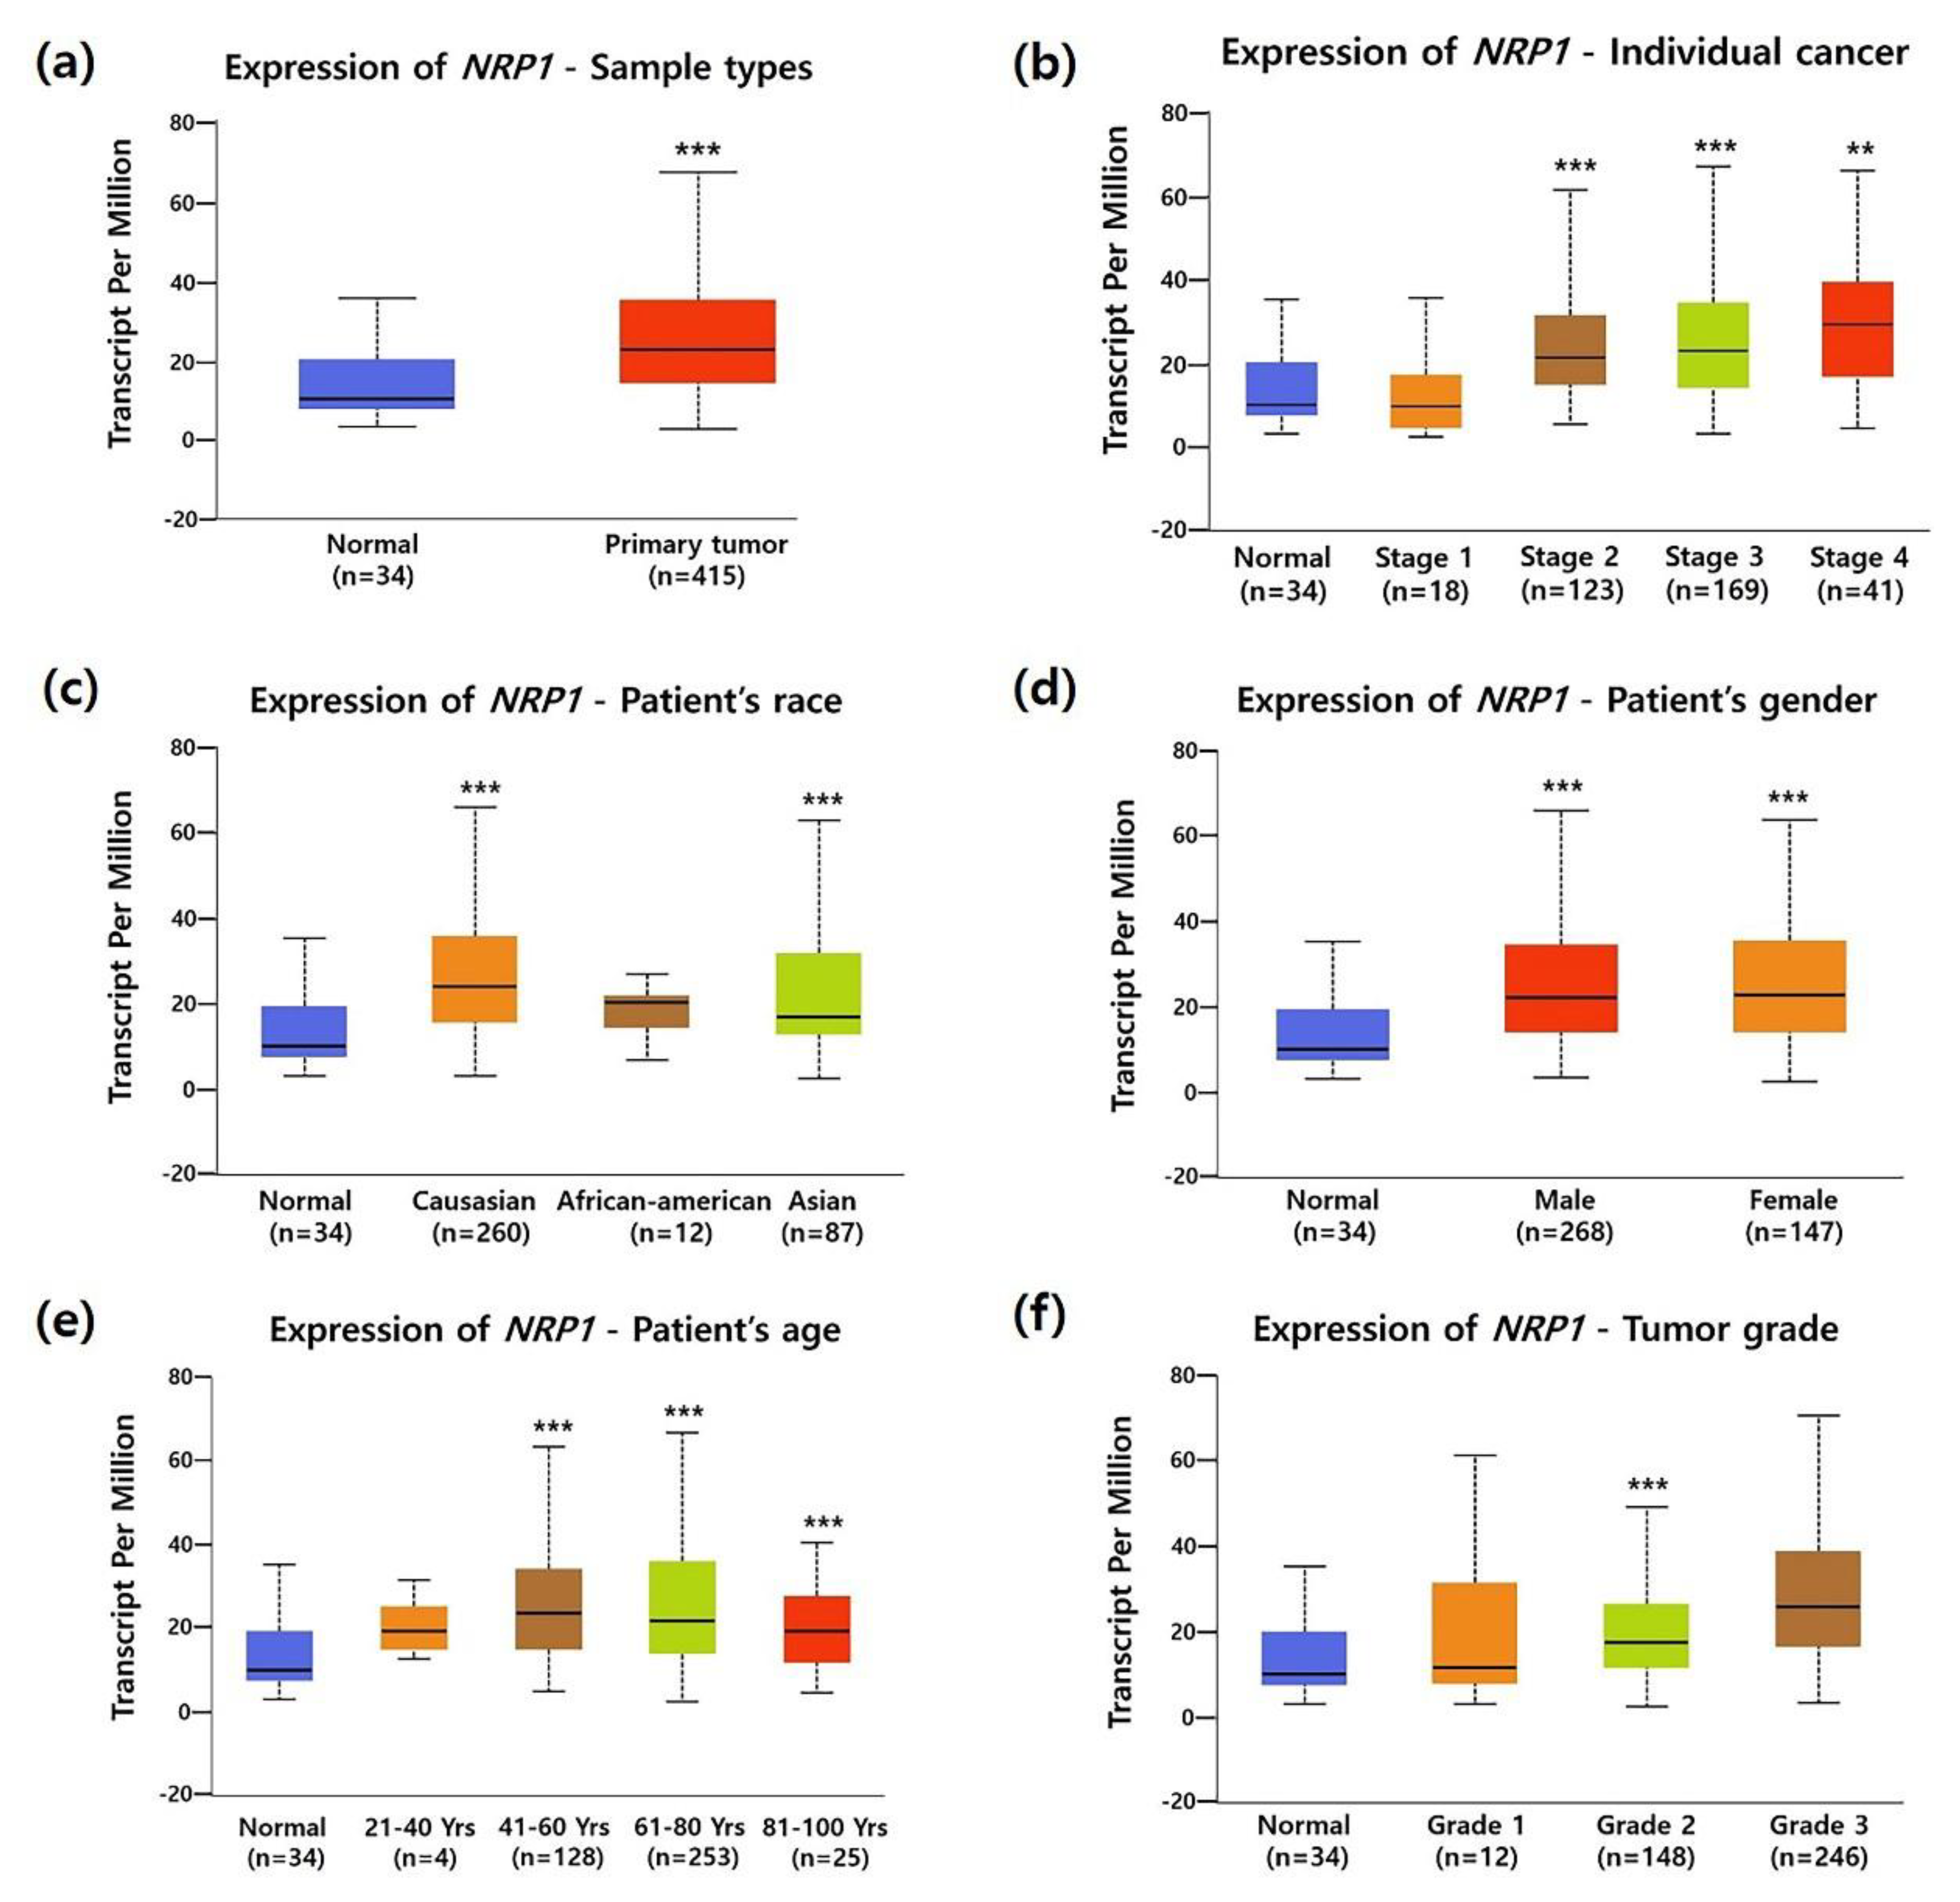
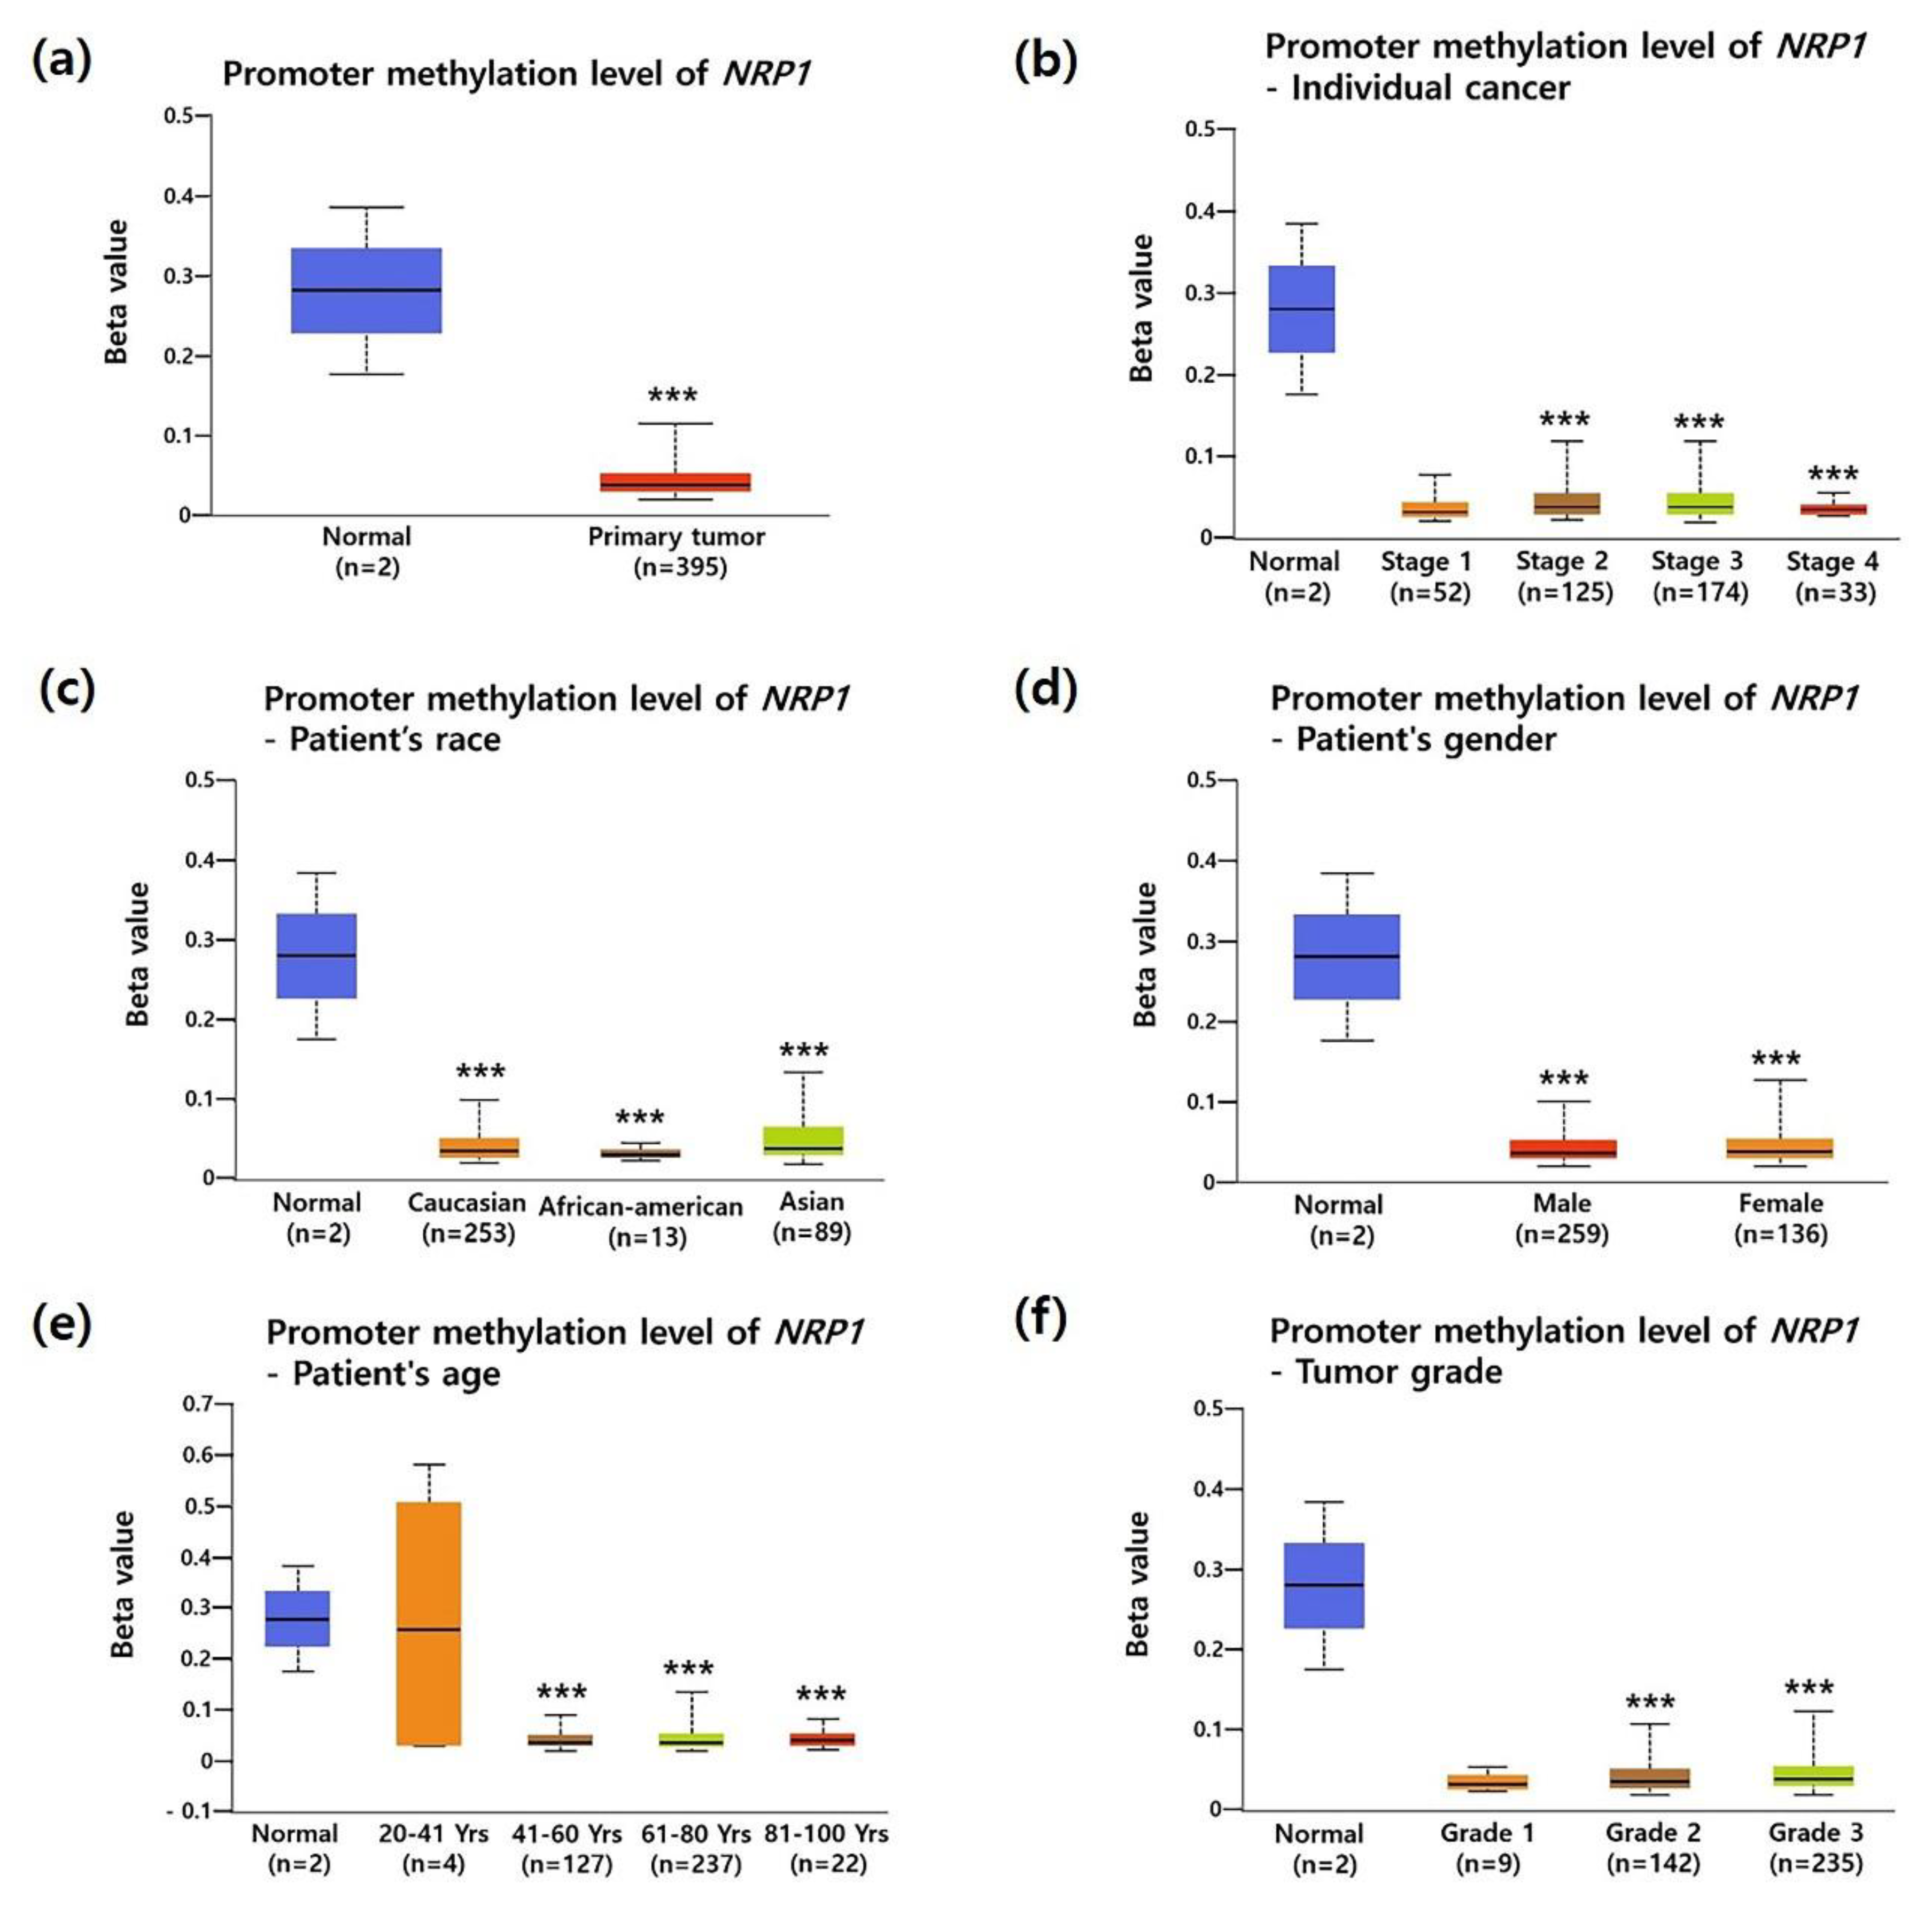
3.2. Association between NRP1 Expression and Clinical Characteristics in STAD Patients

To investigate the association between NRP1 mRNA expression and the clinicopathological characteristics of STAD, we analyzed TCGA data using the UALCAN database. Compared to normal tissues, NRP1 mRNA expression was significantly increased in most clinicopathological characteristics of STAD; tumor stage (Stage 2, Stage 3 and Stage 4), race (Caucasian and Asian), gender (male and female), age (41–60, 61–80, and 81–100 years old), and tumor grade (Grade 2) as shown in Figure 2a–f. Overexpression of NRP1 mRNA in STAD was further confirmed by another two datasets from Oncomine analysis (Supplementary Figure S2). It is known that promotor methylation is an epigenetic regulatory factor and abnormal methylation is evident in tumors [38]. DNA hypomethylation is found to be involved in the invasion and metastasis processes of gastric cancer cells [39]. In particular, hypomethylated NRP1 gene has a positive correlation with poor prognosis in gastric cancer [40]. Here, Figure 3a shows that promoter methylation was significantly reduced in STAD compared to normal tissues. Moreover, promotor methylation levels were significantly reduced regardless of patient characteristics, including tumor stage, gender, race, age, and tumor grade (Figure 3b–f). Taken together, these data confirmed upregulation of NRP1 mRNA expression and downregulation of promoter methylation in STAD.

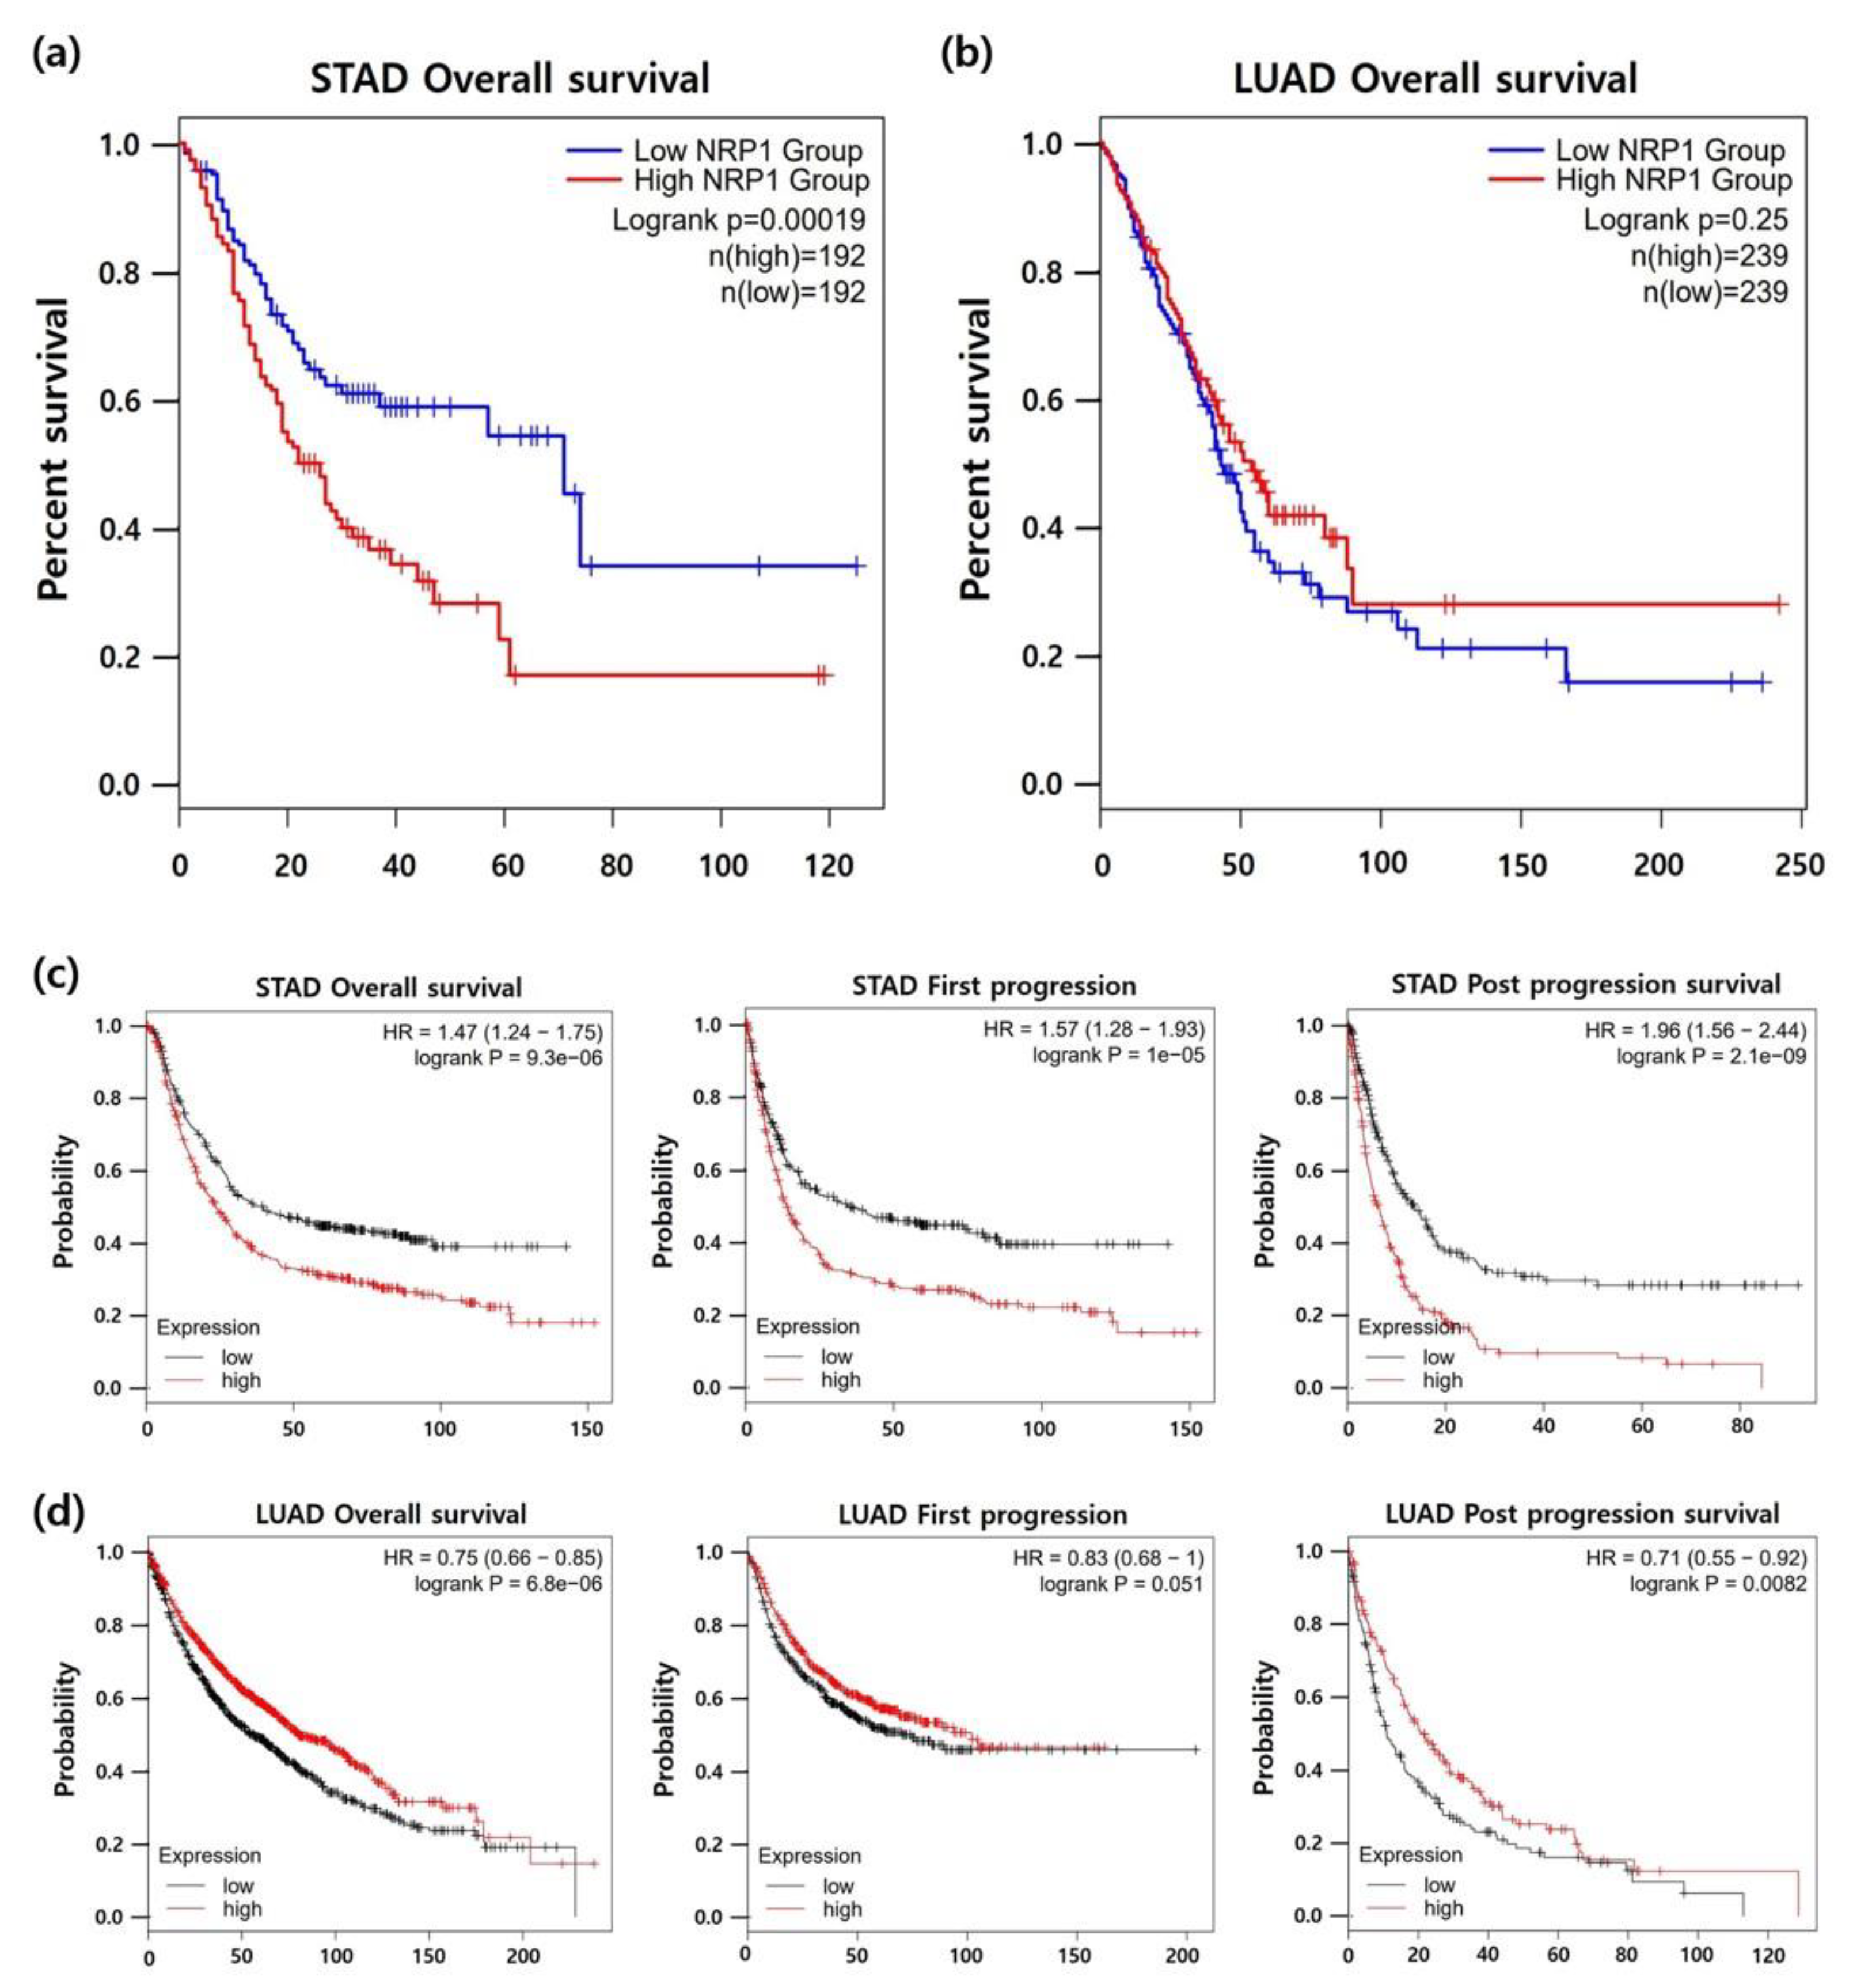
3.3. Association between NRP1 Expression and Prognosis in Patients with STAD

To elucidate the prognostic value of NRP1 expression in STAD, we analyzed the correlation between NRP1 expression and patient survival in STAD using the Kaplan-Meier survival curve. As shown in Figure 4a, high NRP1 expression was significantly correlated with poor prognosis in STAD. To further confirm the correlation between NRP1 expression and patient survival, the Kaplan-Meier plotter database was used. Survival curves of overall survival (OS), first progression (FP), and post progression survival (PPS) showed that patient survival rates were considerably decreased by NRP1 expression (Figure 4c). Interestingly, Figure 4b,d show that there was no association or positive correlation between NRP1 expression and patient survival in lung adenocarcinoma (LUAD) with no difference in expression of NRP1 between tumor tissues and normal tissues as shown in Figure 1b,c. Collectively, NRP1 expression was increased in patients with STAD and had a negative correlation with patient survival in STAD, suggesting that poor prognosis could be predicted through the levels of NRP1 expression.

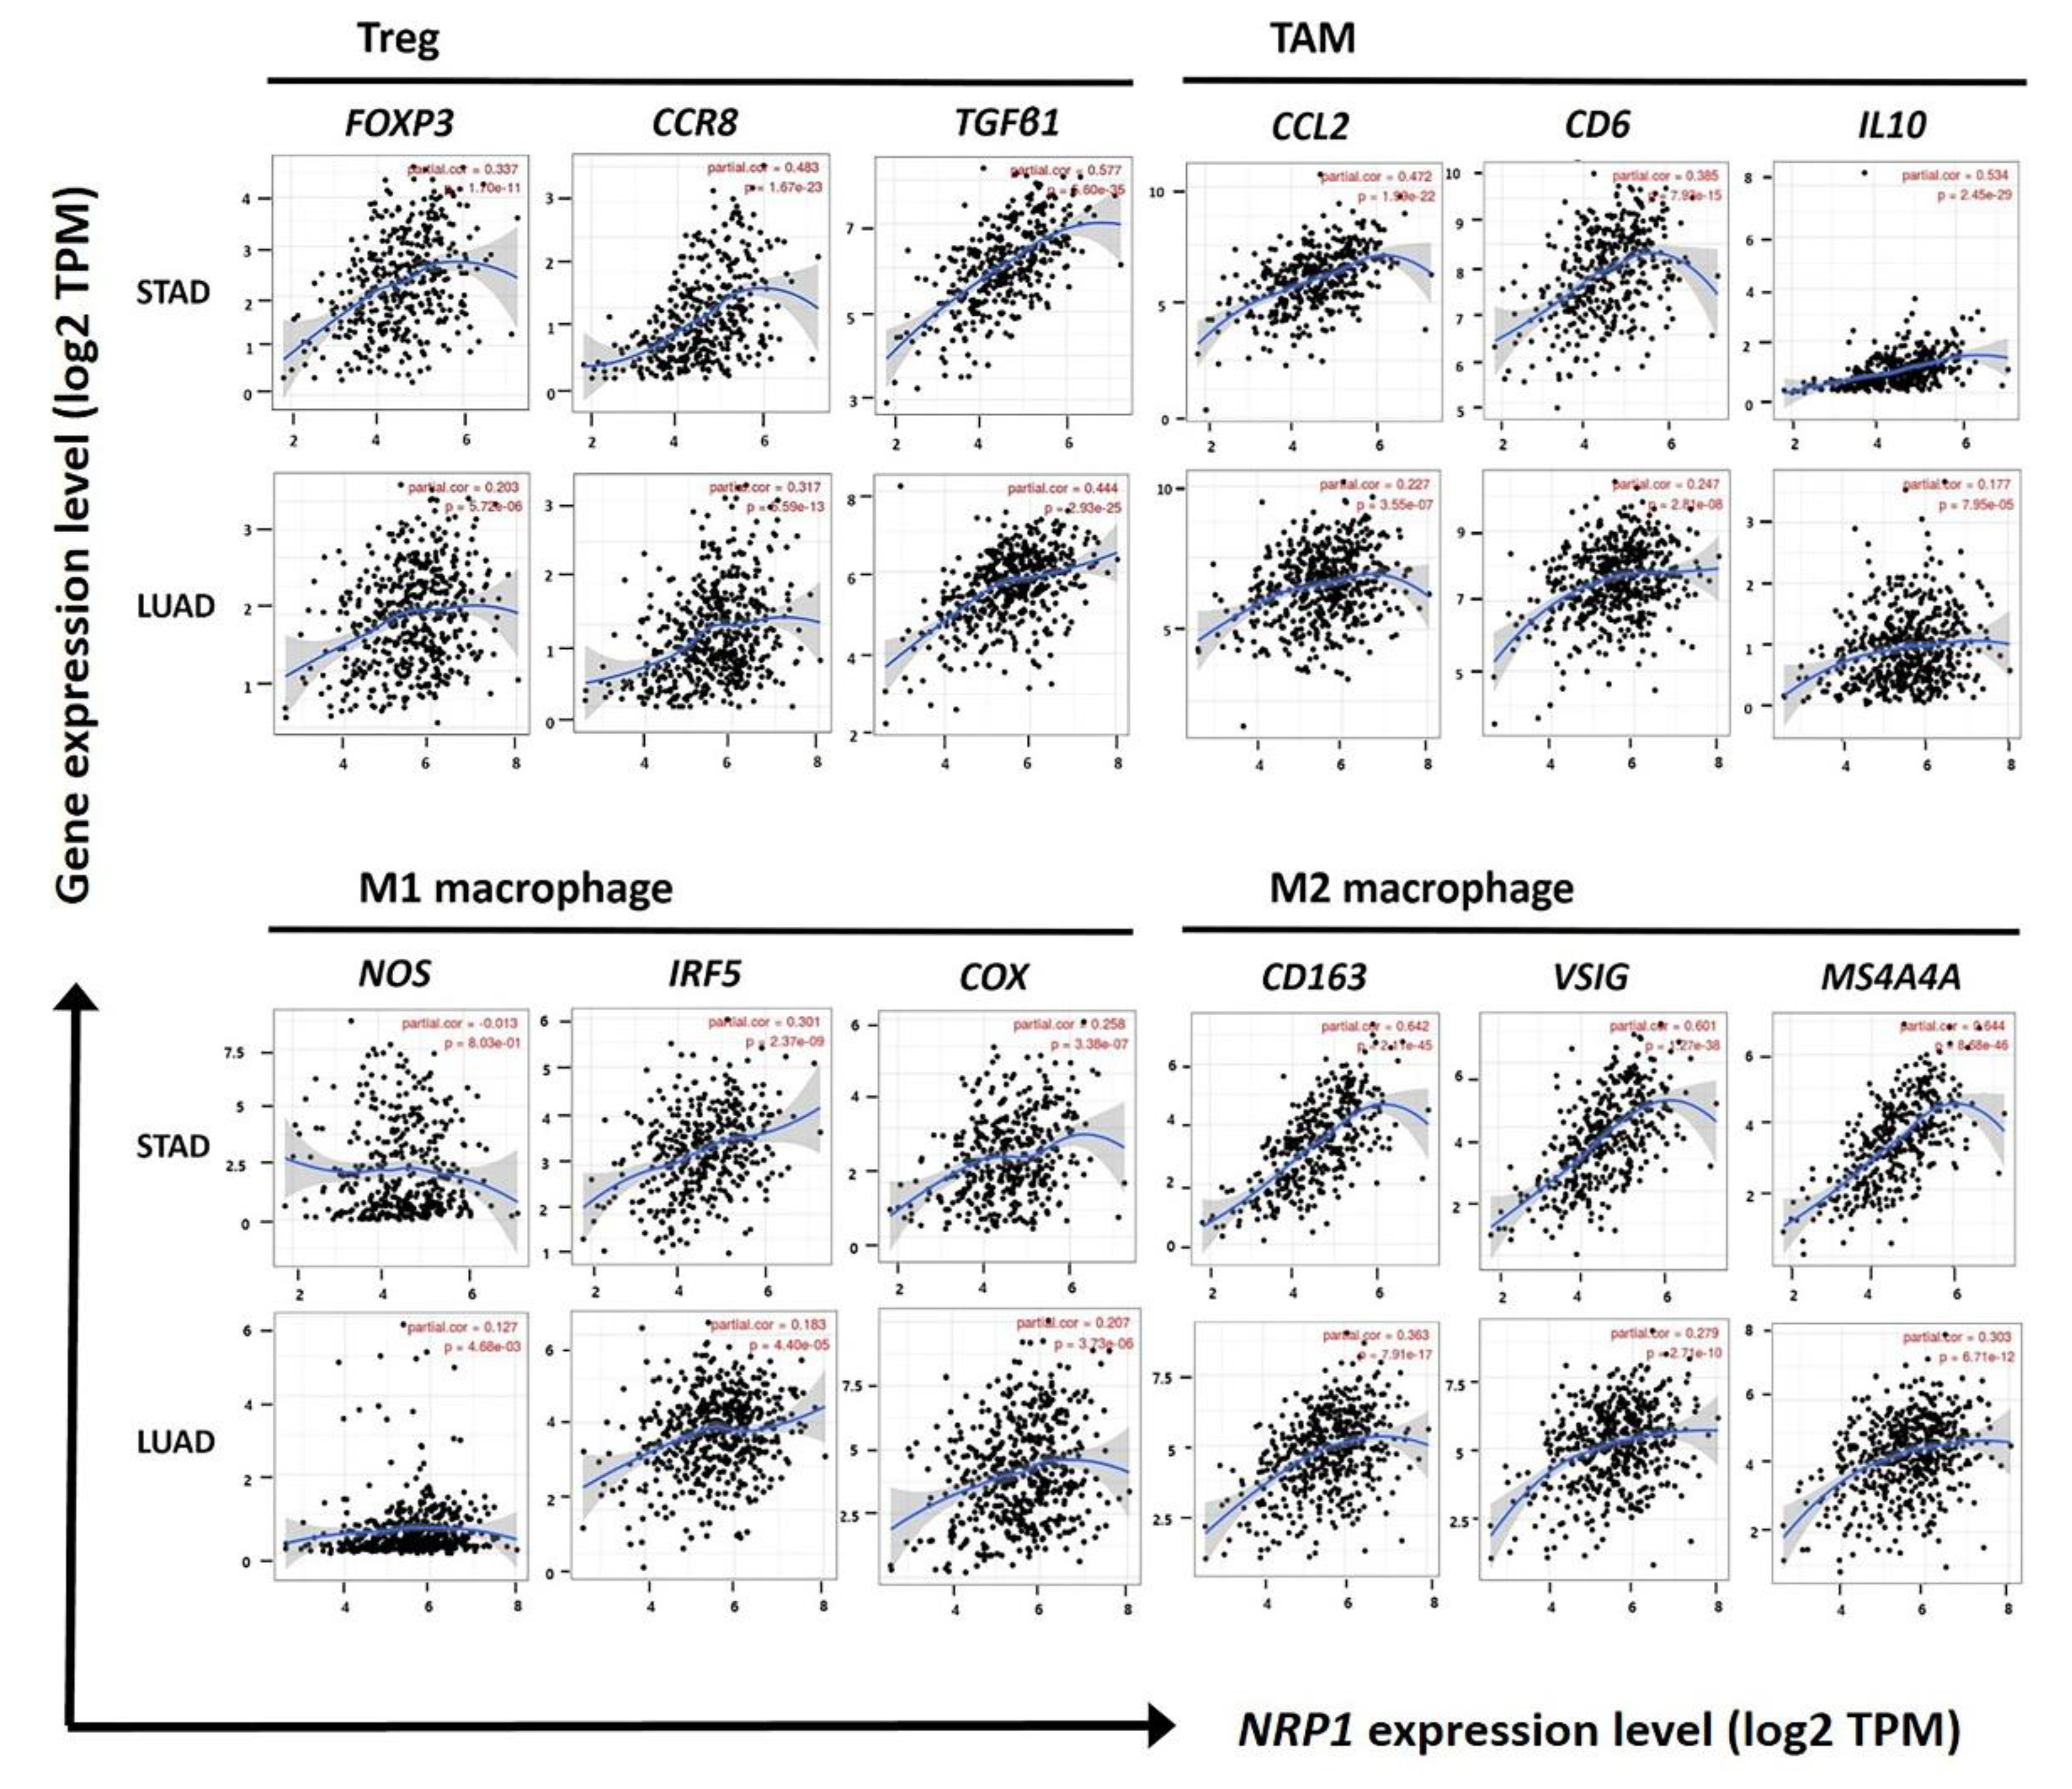
3.4. Correlation of NRP1 Expression with Treg Cells and M2 Macrophages in STAD

Tumor microenvironment (TME) consists of immune cells, stromal cells, and soluble factors, as well as cancer cells. It is known that TME plays an important role in the progression of tumors by interacting with other cells [41,42]. Especially, Treg cells and M2 macrophages are well known as potent immunosuppressive cells. Therefore, in TME, Treg cells and M2 macrophages induce the metastasis and growth of tumor cells by inhibiting the anti-tumor function of various effector cells, such as NK cells, CD8+ T cells, and γδ T cells [21,43,44]. To investigate factors related to patient survival rates that are regulated by NRP1 expression, association of NRP1 expression and infiltration of immune cells was analyzed in STAD. As shown in Figure 5 and Table 1, the correlation between NRP1 expression and various gene expressions of immune cell markers was determined using TIMER web tool. Most of the immune cell marker genes showed a positive correlation with NRP1 expression, but among them the marker gene expression of Treg cells and M2 macrophages showed the most strong positive correlations with NRP1 expression in STAD. Strong positve correlation was confirmed in different dataset using R2 platform as shown in supplementary Table S4. However, there was weak or no significant correlation in LUAD used as negative control compared to STAD.
In immune cells that are generally known to have anti-cancer effects, such as NK cells, CD8+ T cells, and B cells, NRP1 expression also had a weak or moderate positive correlation with their marker gene expression. Additionally, despite the positive correlation between NRP1 expression and the infiltration of effector cells, higher NRP1 expression was associated with lower patient survival in STAD, indicating that the infilrated Treg cells and M2 macrophages might effectively inhibit the anti-cancer functions of effector cells. The anti-cancer effects of M1 macrophage and the pro-cancer effects of M2 macrophages and tumor-associated macrophages (TAM) [45,46] are also well known. Interestingly, our data showed that the positive correlation between NRP1 expression and the infiltration level of TAM and M2 macrophages (CD163; cor. = 0.642, P = 2.11 × 10−45, VSIG4; cor. = 0.601, P = 1.27 × 10−38, MS4A4A; cor. = 0.644, P = 8.68 × 10−46 for M2 macrophages, CCL2; cor. = 0.472, P = 1.99 × 10⁻²², CD68; cor. = 0.384, P = 7.92 × 10⁻¹⁵, IL10; cor. = 0.534, P = 2.45 × 10⁻²⁹ for TAM) was much greater than the correlation between NRP1 expression and the infiltration of M1 macrophages (NOS2; cor. = −0.013, P = 0.080, IRF5; cor. = 0.301, P = 2.37 × 10⁻⁹, PTGS2; cor. = 0.258, P = 3.38 × 10⁻⁷). In addition, high correlation between NRP1 expression and both Treg cells and M2 macrophages was confirmed using the GEPIA database (Table 2). These results suggest that NRP1 expression significantly affects the infiltration of Treg cells and M2 macrophages, and the infiltrated Treg cells and M2 macrophages enhance tumor progression in STAD by immune-suppressive functions, leading to the poor prognosis.

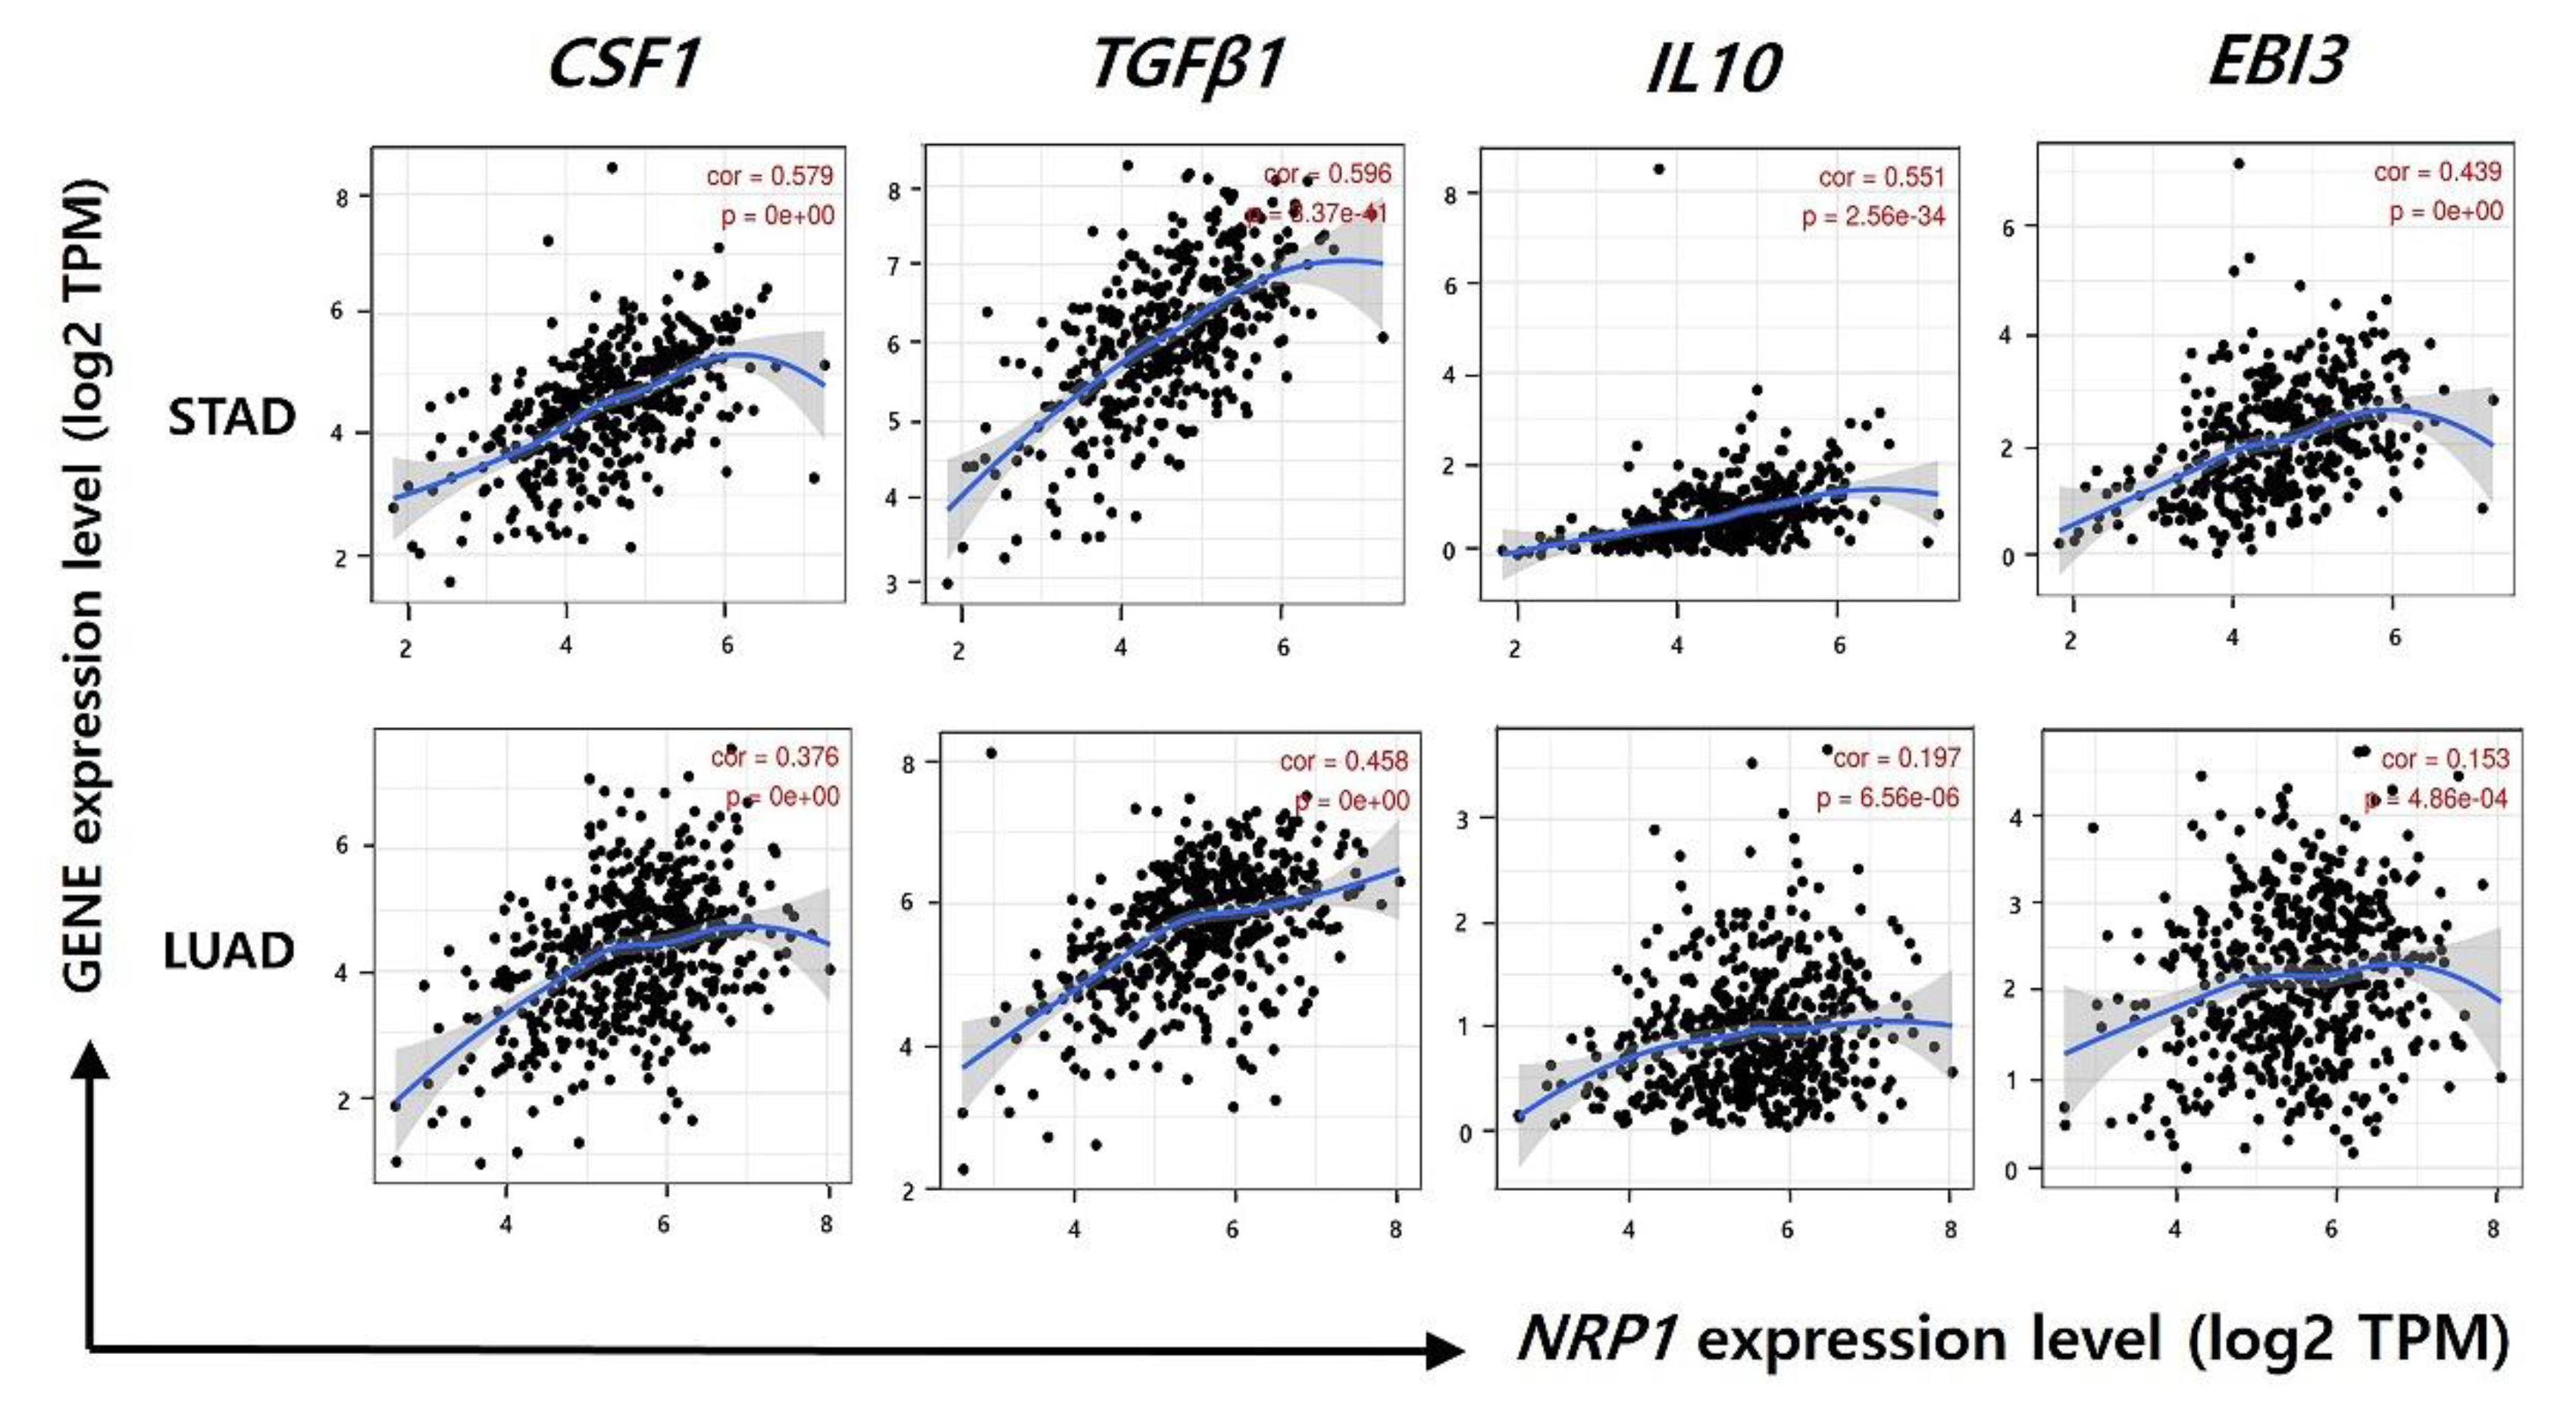
3.5. Correlation between NRP1 Expression and Gene Expression of Immune-Suppressive Cytokines

Immunosuppression is a well-known mechanism for tumor progression, leading to tumor growth and metastasis. Many studies have reported that Treg cells, M2 macrophages, and TAM contribute to suppress effector cells by various mechanisms, and one of these mechanisms is a secretion of inhibitory cytokines, such as transforming growth factor (TGF)-β1, interleukin (IL)-10, and IL-35 [45,47]. These inhibitory cytokines show anti-cancer effects by immune-suppressive functions on effector cells including NK cell and CD8+ T cells [48,49]. In this study, a strong positive correlation was showed between NRP1 expression and gene expression of Treg cell, M2 macrophage, and TAM markers, indicating the increased infiltration of the immune-suppressive cells (Figure 5, Table 1 and Table 2). Therefore, to investigate whether the immune-suppressive cell-derived cytokines are also increased by NRP1 expression in STAD, we analyzed the correlation between NRP1 expression and cytokine gene markers (CSF1, TGFβ1, IL10, EBI3) using the TIMER database (Figure 6). Colony-stimulating factor 1 (CSF1) regulates proliferation and differentiation macrophages, resulting in the increased immune-suppressive M2 macrophages [50]. As shown in Figure 6, NRP1 expression was significantly correlated with the gene expression of immune-suppressive cytokine in STAD (CSF1; cor. = 0.551, P = 1.79 × 10⁻³¹, TGFβ1; cor. = 0.557, P = 5.60 × 10⁻³⁵, IL10; cor. = 0.534, P = 2.48 × 10⁻²⁹, EBI3; cor. = 0.422, P = 7.83 × 10⁻¹⁸). However, NRP1 expression was less correlated with the gene expression of immune-suppressive cytokine in LUAD compared to STAD (CSF1; cor. = 0.353, P = 6.43 × 10⁻¹⁶, TGFβ1; cor. = 0.444, P = 2.93 × 10⁻²⁵, IL10; cor. = 0.177, P = 7.95× 10⁻⁵, EBI3; cor. = 0.114, P = 1.12 × 10⁻²). Collectively, our data indicate that NRP1 expression had a positive correlation with immune-suppressive functions by up-regulating inhibitory cytokines, resulting in the poor prognosis in STAD.

4. Discussion

Neuropilin1 (NRP1) acts as a co-receptor of various growth factors and plays a major role in tumor progression. Overexpression of NRP1 is associated with poor prognosis in various cancers including prostate cancer, lung cancer, and melanoma. However, it has been reported to be associated with favorable prognosis in colon cancer [51,52,53]. The contradictory prognostic value of NRP1 expression among types of cancers might be caused by the tumor-specific roles of NRP1 and its related mechanisms. This study demonstrates that high expression of NRP1 correlates with poor prognosis of stomach adenocarcinoma (STAD). In addition, the expression of NRP1 was highly correlated to the invasion of various immune cells. Particularly there was a clear difference in correlation of NRP1 expression with infiltrated Treg and M2 macrophages between STAD and lung adenocarcinoma (LUAD). Therefore, our study suggests differential TME between STAD and LUAD that affects prognostic value of NRP1 expression. Increased NRP1 mRNA and protein expression in stomach cancer tissue was already suggested in a previous report [11]. We confirmed higher expression of NRP1 mRNA in stomach cancer at multiple datasets using the various databases (Oncomine, GEPIA2, TIMER, and UALCAN) (Figure 1 and Figure 2). In addition, the results using the UALCAN database indicate that NRP1 mRNA expression was significantly increased in tumor tissues compared to in normal tissues, regardless of clinical characteristics, such as tumor stage, age, race, gender, and tumor grade of STAD using TCGA dataset (Figure 2).
Interestingly, the promoter methylation of NRP1 exhibited a significant decrease across almost all clinical characteristics. DNA methylation mainly regulates the level of gene expression. Especially, abnormal methylation is frequently observed in tumors by affecting the cell division cycle, therefore it is associated with tumor malignant biological properties [54]. The cytosine-phosphate-guanine (CpG) island methylator phenotype (CIMP), which exhibits extensive methylation, has been associated with lymph node metastasis in gastric cancer [55]. In particular, NRP1 methylation, among the tumor-related genes, is found to be associated with survival of colon and liver cancers [53,56]. In addition, NRP1 is a hypomethylated and upregulated gene in tumor tissues and is co-expressed with platelet-derived growth factor receptor beta (PDGFRB), which is associated with the malignant phenotype for patients with gastric cancer, thereby potentially serving as a prognostic biomarker of gastric cancer [40]. Here, our data also showed significantly higher expression of NRP1 and lower DNA methylation of NRP1 gene in STAD than in normal control. Taken together, it suggests that the hypomethylation of NRP1 could be associated with poor prognosis of STAD.
Next, to suggest the possibility of NRP1 as a marker to predict the prognosis of STAD, we analyzed the correlation between NRP1 expression and patient survival using the Kaplan-Meire curve. NRP1 expression, as based on the Kaplan-Meier survival curves, was significantly correlated with overall survival (OS), first progression (FP), and post progression survival (PPS) in STAD, showing that NRP1 expression is negatively correlated with patient survival. (Figure 4). NRP1 has been suggested as a therapeutic target for cancers owing to its tumor promoting roles in various cancers [57,58,59,60]. In gastric cancer, NRP1 expression confers cancer stemness with binding to Lin28B [61]. NRP1 induced a JNK-dependent signaling cascade leading to resistance to BRAF, HER2, or MET inhibitors [62]. Knockdown of NRP1 expression by miR-338 inhibited gastric cancer cell migration, invasion, proliferation and promoted apoptosis [63]. NRP1 depletion inhibited cell proliferation and migration by inhibiting multiple receptors in which NRP1 plays a role as coreceptor [11]. However, the value of NRP1 expression in the tumor immune microenvironment in stomach cancer remains to be studied although NRP1 is regarded as an immune-related gene and its expression is negatively correlated with patient OS [64].
This study also demonstrates that NRP1 expression correlates with immune cell infiltration in stomach cancer. As shown in Figure 5 and Table 1, a strong correlation between NRP1 in STAD and various immune cells was confirmed. Interestingly, infiltration levels of effector T cells, CD8+ T cells, NK cells, and B cells, moderately correlated with NRP1 expression compared to Treg cells and M2 macrophages (Table 1). Despite a slight correlation with infiltration level of effector cells, the strong correlation of NRP1 expression with infiltration level of Treg cells and M2 macrophages suggested the possible relation of NRP1 expression to immune suppression in STAD. Tumor associated macrophages (TAM), which present properties of the M2 macrophages in the tumor microenvironment (TEM), are known to induce immune suppression and stimulate tumor progression [65,66]. The common action of M2 macrophages and TAM is presumed to be a major cause of the similar data for the M2 macrophages and TAM in this study. High levels of infiltration of Treg cells and M2 macrophages in the immune environment correlate with the patient prognosis in other type of cancer [67,68]. Treg cells and M2 macrophage have immune suppressive mechanisms including inhibition of antigen presenting cell (APC) maturation and secretion of inhibitory cytokines [68,69,70,71]. Activated Treg cells also evade tumor immunity by inhibiting effector cells, such as CD4+ and CD8+ T cells [72]. In addition, tumor infiltrated M2 macrophages exhibit a tumorigenic effect by producing high levels of IL-10 and TGF-β1 [73]. NRP1 enhances Treg cells for tumor infiltration and promotes macrophage differentiation, as preparation for the activation of immune evasion responses [60,74]. Therefore, this study suggests that NRP1 expression induces the production of the inhibitory cytokines IL-10, IL-35, and TGFβ1 of the Treg cells and M2 macrophages, and the expressed cytokines serve as major signals in the immune suppression mechanism of STAD.
Tumor infiltrated Treg cells and M2 macrophages significantly correlate with the tumor suppressive system in STAD as they produce cytokines such as transforming growth factor beta 1 (TGF-β1), interleukin-10 (IL-10), and colony stimulating factor 1 (CSF1) [16]. CSF1, which regulates the macrophage lineage, has been found to increase the expression of macrophages and TAM, control the differentiation and function of M2 macrophages, and act as an angiogenesis switch [71,75,76]. According to a related study, the gene inhibition of CSF1 in breast cancer cells affects tumor formation in immunodeficient mice [73]. In addition, multiple tumor cell injections in the mouse liver metastasis models were found to increase the number of CD4+ CD25 + Treg cells and the expression of cytokines IL-10 and TGFβ-1 [77]. IL-35, which inhibits the inflammatory response of immune cells, is a dimeric protein with IL-12A and Epstein-Barr Virus-induced 3 (EBI3), which are encoded by IL-12A and EBI3 individual genes [78,79]. The present study confirmed that NRP1 expression correlated with cytokine gene markers (CSF1, TGFβ1, IL10, EBI3) that were secreted from Treg cells and M2 macrophages (Figure 6). Therefore, the expression of NRP1 affects the cytokines produced by Treg cells and M2 macrophage and indicates poor prognosis for patients with STAD by the immune suppression mechanism. Since this study has demonstrated the clinical significance of NRP1, in vitro and in vivo studies are needed to further demonstrate the role of NRP1 in immunosuppression mechanisms.

5. Conclusions

The main finding of this study is that NRP1 expression is positively correlated in Treg cells and M2 macrophages in STAD. Further, we found a significant correlation between NRP1 expression and cytokines in Treg cells and M2 macrophages. High correlation of NRP1 expression with immunosuppressive cells may be one of the causes of the prognostic value of NRP1 in STAD. Thus, this systematic analysis provides evidence suggesting the potential use of NRP1 as an effective biomarker for patient survival in STAD and a therapeutic target modulating the tumor immune microenvironment.

Supplementary Materials

The following are available online at https://www.mdpi.com/2077-0383/9/5/1430/s1. Supplementary Table S1; Tumor Abbreviations, Supplementary Figure S2; Overexpression of NRP1 mRNA in STAD from further Oncomine Analysis, Supplementary Figure S3. The prognostic value of NRP1 using TIMER database. Supplementary Table S4; Correlation analysis between NRP1 and gene markers of immune cells using R2 database, Supplementary Table S5; Correlation constants and p-values in Figure 6.

Author Contributions

Conceptualization, K.E.K.; methodology, J.Y.K. and M.G.; validation, K.E.K.; formal analysis, J.Y.K. and M.G.; investigation, J.Y.K. and M.G.; data curation, K.E.K.; writing—original draft preparation, J.Y.K. and M.G.; writing—review and editing, K.E.K.; supervision, K.E.K.; project administration, K.E.K.; funding acquisition, M.G. and K.E.K. All authors have read and agreed to the published version of the manuscript.

Funding

This research was supported by the Basic Science Research Program through the National Research Foundation of Korea (NRF) funded by the Ministry of Education, Science and Technology (NRF-2017R1D1A1B03036390 and NRF-2017R1D1A1A02018653).

Conflicts of Interest

The authors declare no conflicts of interest.

References

  1. Global Burden of Disease Cancer Collaboration; Fitzmaurice, C.; Abate, D.; Abbasi, N.; Abbastabar, H.; Abd-Allah, F.; Abdel-Rahman, O.; Abdelalim, A.; Abdoli, A.; Abdollahpour, I.; et al. Global, Regional, and National Cancer Incidence, Mortality, Years of Life Lost, Years Lived With Disability, and Disability-Adjusted Life-Years for 29 Cancer Groups, 1990 to 2017: A Systematic Analysis for the Global Burden of Disease Study. JAMA Oncol. 2019. [Google Scholar] [CrossRef] [Green Version]
  2. Song, Z.; Wu, Y.; Yang, J.; Yang, D.; Fang, X. Progress in the treatment of advanced gastric cancer. Tumour Biol. 2017, 39, 4626. [Google Scholar] [CrossRef] [PubMed] [Green Version]
  3. Chon, S.H.; Berlth, F.; Plum, P.S.; Herbold, T.; Alakus, H.; Kleinert, R.; Moenig, S.P.; Bruns, C.J.; Hoelscher, A.H.; Meyer, H.J. Gastric cancer treatment in the world: Germany. Transl. Gastroenterol. Hepatol. 2017, 2, 53. [Google Scholar] [CrossRef] [PubMed] [Green Version]
  4. Tang, C.; Gao, X.; Liu, H.; Jiang, T.; Zhai, X. Decreased expression of SEMA3A is associated with poor prognosis in gastric carcinoma. Int. J. Clin. Exp. Pathol. 2014, 7, 4782–4794. [Google Scholar] [PubMed]
  5. Ren, J.; Niu, G.; Wang, X.; Song, T.; Hu, Z.; Ke, C. Overexpression of FNDC1 in Gastric Cancer and its Prognostic Significance. J. Cancer 2018, 9, 4586–4595. [Google Scholar] [CrossRef]
  6. Jimenez-Hernandez, L.E.; Vazquez-Santillan, K.; Castro-Oropeza, R.; Martinez-Ruiz, G.; Munoz-Galindo, L.; Gonzalez-Torres, C.; Cortes-Gonzalez, C.C.; Victoria-Acosta, G.; Melendez-Zajgla, J.; Maldonado, V. NRP1-positive lung cancer cells possess tumor-initiating properties. Oncol. Rep. 2018, 39, 349–357. [Google Scholar] [CrossRef] [Green Version]
  7. Tse, B.W.C.; Volpert, M.; Ratther, E.; Stylianou, N.; Nouri, M.; McGowan, K.; Lehman, M.L.; McPherson, S.J.; Roshan-Moniri, M.; Butler, M.S.; et al. Neuropilin-1 is upregulated in the adaptive response of prostate tumors to androgen-targeted therapies and is prognostic of metastatic progression and patient mortality. Oncogene 2017, 36, 3417–3427. [Google Scholar] [CrossRef] [Green Version]
  8. Geretti, E.; Klagsbrun, M. Neuropilins: Novel targets for anti-angiogenesis therapies. Cell Adhes. Migr. 2007, 1, 56–61. [Google Scholar] [CrossRef] [Green Version]
  9. Barr, M.P.; Gray, S.G.; Gately, K.; Hams, E.; Fallon, P.G.; Davies, A.M.; Richard, D.J.; Pidgeon, G.P.; O’Byrne, K.J. Vascular endothelial growth factor is an autocrine growth factor, signaling through neuropilin-1 in non-small cell lung cancer. Mol. Cancer 2015, 14, 45. [Google Scholar] [CrossRef] [Green Version]
  10. Rizzolio, S.; Rabinowicz, N.; Rainero, E.; Lanzetti, L.; Serini, G.; Norman, J.; Neufeld, G.; Tamagnone, L. Neuropilin-1-dependent regulation of EGF-receptor signaling. Cancer Res. 2012, 72, 5801–5811. [Google Scholar] [CrossRef] [Green Version]
  11. Li, L.; Jiang, X.; Zhang, Q.; Dong, X.; Gao, Y.; He, Y.; Qiao, H.; Xie, F.; Xie, X.; Sun, X. Neuropilin-1 is associated with clinicopathology of gastric cancer and contributes to cell proliferation and migration as multifunctional co-receptors. J. Exp. Clin. Cancer Res. 2016, 35, 16. [Google Scholar] [CrossRef] [PubMed] [Green Version]
  12. Herzog, B.; Pellet-Many, C.; Britton, G.; Hartzoulakis, B.; Zachary, I.C. VEGF binding to NRP1 is essential for VEGF stimulation of endothelial cell migration, complex formation between NRP1 and VEGFR2, and signaling via FAK Tyr407 phosphorylation. Mol. Biol. Cell 2011, 22, 2766–2776. [Google Scholar] [CrossRef] [PubMed]
  13. Akagi, M.; Kawaguchi, M.; Liu, W.; McCarty, M.F.; Takeda, A.; Fan, F.; Stoeltzing, O.; Parikh, A.A.; Jung, Y.D.; Bucana, C.D.; et al. Induction of neuropilin-1 and vascular endothelial growth factor by epidermal growth factor in human gastric cancer cells. Br. J. Cancer 2003, 88, 796–802. [Google Scholar] [CrossRef] [PubMed] [Green Version]
  14. Chen, Y.; Zhang, S.; Wang, Q.; Zhang, X. Tumor-recruited M2 macrophages promote gastric and breast cancer metastasis via M2 macrophage-secreted CHI3L1 protein. J. Hematol. Oncol. 2017, 10, 36. [Google Scholar] [CrossRef] [PubMed] [Green Version]
  15. Kim, K.J.; Wen, X.Y.; Yang, H.K.; Kim, W.H.; Kang, G.H. Prognostic Implication of M2 Macrophages Are Determined by the Proportional Balance of Tumor Associated Macrophages and Tumor Infiltrating Lymphocytes in Microsatellite-Unstable Gastric Carcinoma. PLoS ONE 2015, 10, e0144192. [Google Scholar] [CrossRef] [Green Version]
  16. Ao, J.Y.; Zhu, X.D.; Chai, Z.T.; Cai, H.; Zhang, Y.Y.; Zhang, K.Z.; Kong, L.Q.; Zhang, N.; Ye, B.G.; Ma, D.N.; et al. Colony-Stimulating Factor 1 Receptor Blockade Inhibits Tumor Growth by Altering the Polarization of Tumor-Associated Macrophages in Hepatocellular Carcinoma. Mol. Cancer Ther. 2017, 16, 1544–1554. [Google Scholar] [CrossRef] [Green Version]
  17. Chanmee, T.; Ontong, P.; Konno, K.; Itano, N. Tumor-associated macrophages as major players in the tumor microenvironment. Cancers 2014, 6, 1670–1690. [Google Scholar] [CrossRef] [Green Version]
  18. Paolino, M.; Penninger, J.M. The Role of TAM Family Receptors in Immune Cell Function: Implications for Cancer Therapy. Cancers 2016, 8, 97. [Google Scholar] [CrossRef] [Green Version]
  19. Traves, P.G.; Luque, A.; Hortelano, S. Macrophages, inflammation, and tumor suppressors: ARF, a new player in the game. Mediat. Inflamm. 2012, 2012, 568783. [Google Scholar] [CrossRef]
  20. Li, W.; Zhang, X.; Wu, F.; Zhou, Y.; Bao, Z.; Li, H.; Zheng, P.; Zhao, S. Gastric cancer-derived mesenchymal stromal cells trigger M2 macrophage polarization that promotes metastasis and EMT in gastric cancer. Cell Death Dis. 2019, 10, 918. [Google Scholar] [CrossRef] [Green Version]
  21. Chang, L.Y.; Lin, Y.C.; Mahalingam, J.; Huang, C.T.; Chen, T.W.; Kang, C.W.; Peng, H.M.; Chu, Y.Y.; Chiang, J.M.; Dutta, A.; et al. Tumor-derived chemokine CCL5 enhances TGF-beta-mediated killing of CD8(+) T cells in colon cancer by T-regulatory cells. Cancer Res. 2012, 72, 1092–1102. [Google Scholar] [CrossRef] [PubMed] [Green Version]
  22. Betts, G.; Jones, E.; Junaid, S.; El-Shanawany, T.; Scurr, M.; Mizen, P.; Kumar, M.; Jones, S.; Rees, B.; Williams, G.; et al. Suppression of tumour-specific CD4(+) T cells by regulatory T cells is associated with progression of human colorectal cancer. Gut 2012, 61, 1163–1171. [Google Scholar] [CrossRef] [PubMed] [Green Version]
  23. Curiel, T.J.; Coukos, G.; Zou, L.; Alvarez, X.; Cheng, P.; Mottram, P.; Evdemon-Hogan, M.; Conejo-Garcia, J.R.; Zhang, L.; Burow, M.; et al. Specific recruitment of regulatory T cells in ovarian carcinoma fosters immune privilege and predicts reduced survival. Nat. Med. 2004, 10, 942–949. [Google Scholar] [CrossRef] [PubMed]
  24. Sun, W.; Wei, F.Q.; Li, W.J.; Wei, J.W.; Zhong, H.; Wen, Y.H.; Lei, W.B.; Chen, L.; Li, H.; Lin, H.Q.; et al. A positive-feedback loop between tumour infiltrating activated Treg cells and type 2-skewed macrophages is essential for progression of laryngeal squamous cell carcinoma. Br. J. Cancer 2017, 117, 1631–1643. [Google Scholar] [CrossRef] [PubMed] [Green Version]
  25. Wang, J.; Huang, H.; Lu, J.; Bi, P.; Wang, F.; Liu, X.; Zhang, B.; Luo, Y.; Li, X. Tumor cells induced-M2 macrophage favors accumulation of Treg in nasopharyngeal carcinoma. Int. J. Clin. Exp. Pathol. 2017, 10, 8389–8401. [Google Scholar] [PubMed]
  26. Chaudhary, B.; Elkord, E. Novel expression of Neuropilin 1 on human tumor-infiltrating lymphocytes in colorectal cancer liver metastases. Expert Opin. Ther. Targets 2015, 19, 147–161. [Google Scholar] [CrossRef]
  27. Rhodes, D.R.; Yu, J.; Shanker, K.; Deshpande, N.; Varambally, R.; Ghosh, D.; Barrette, T.; Pandey, A.; Chinnaiyan, A.M. ONCOMINE: A cancer microarray database and integrated data-mining platform. Neoplasia 2004, 6, 1–6. [Google Scholar] [CrossRef] [Green Version]
  28. Oncomine Database Home Page. Available online: http://www.oncomine.org/ (accessed on 20 April 2020).
  29. Tang, Z.; Kang, B.; Li, C.; Chen, T.; Zhang, Z. GEPIA2: An enhanced web server for large-scale expression profiling and interactive analysis. Nucleic Acids Res. 2019, 47, W556–W560. [Google Scholar] [CrossRef] [Green Version]
  30. Gene Expression Profiling Interactive Analysis Home Page. Available online: http://gepia.cancer-pku.cn/index.html/ (accessed on 21 April 2020).
  31. Pan, J.H.; Zhou, H.; Cooper, L.; Huang, J.L.; Zhu, S.B.; Zhao, X.X.; Ding, H.; Pan, Y.L.; Rong, L. LAYN Is a Prognostic Biomarker and Correlated with Immune Infiltrates in Gastric and Colon Cancers. Front. Immunol. 2019, 10, 6. [Google Scholar] [CrossRef] [Green Version]
  32. Tumor IMmune Estimation Resource Home Page. Available online: http://cistrome.org/TIMER/ (accessed on 22 April 2020).
  33. Chandrashekar, D.S.; Bashel, B.; Balasubramanya, S.A.H.; Creighton, C.J.; Ponce-Rodriguez, I.; Chakravarthi, B.; Varambally, S. UALCAN: A Portal for Facilitating Tumor Subgroup Gene Expression and Survival Analyses. Neoplasia 2017, 19, 649–658. [Google Scholar] [CrossRef]
  34. UALCAN Database Home Page. Available online: http://ualcan.path.uab.edu/index.html/ (accessed on 23 April 2020).
  35. Kaplan-Meier Survival Plotter Home Page. Available online: http://kmplot.com/analysis/ (accessed on 23 April 2020).
  36. Ranstam, J.; Cook, J.A. Kaplan-Meier curve. Br. J. Surg. 2017, 104, 442. [Google Scholar] [CrossRef] [PubMed]
  37. R2: Genomics Analysis and Visualization Platform Home Page. Available online: http://r2.amc.nl/ (accessed on 24 April 2020).
  38. Holcakova, J. Effect of DNA Methylation on the Development of Cancer. Klin. Onkol. 2018, 31, 41–45. [Google Scholar] [CrossRef] [PubMed]
  39. Yu, J.; Hua, R.; Zhang, Y.; Tao, R.; Wang, Q.; Ni, Q. DNA hypomethylation promotes invasion and metastasis of gastric cancer cells by regulating the binding of SP1 to the CDCA3 promoter. J. Cell. Biochem. 2020, 121, 142–151. [Google Scholar] [CrossRef] [PubMed]
  40. Wang, G.; Shi, B.; Fu, Y.; Zhao, S.; Qu, K.; Guo, Q.; Li, K.; She, J. Hypomethylated gene NRP1 is co-expressed with PDGFRB and associated with poor overall survival in gastric cancer patients. Biomed. Pharmacother. 2019, 111, 1334–1341. [Google Scholar] [CrossRef]
  41. Wang, M.; Zhao, J.; Zhang, L.; Wei, F.; Lian, Y.; Wu, Y.; Gong, Z.; Zhang, S.; Zhou, J.; Cao, K.; et al. Role of tumor microenvironment in tumorigenesis. J. Cancer 2017, 8, 761–773. [Google Scholar] [CrossRef]
  42. Quail, D.F.; Joyce, J.A. Microenvironmental regulation of tumor progression and metastasis. Nat. Med. 2013, 19, 1423–1437. [Google Scholar] [CrossRef]
  43. Mantovani, A.; Marchesi, F.; Malesci, A.; Laghi, L.; Allavena, P. Tumour-associated macrophages as treatment targets in oncology. Nat. Rev. Clin. Oncol. 2017, 14, 399–416. [Google Scholar] [CrossRef]
  44. Maimela, N.R.; Liu, S.; Zhang, Y. Fates of CD8+ T cells in Tumor Microenvironment. Comput. Struct. Biotechnol. J. 2019, 17, 1–13. [Google Scholar] [CrossRef]
  45. Hao, N.B.; Lu, M.H.; Fan, Y.H.; Cao, Y.L.; Zhang, Z.R.; Yang, S.M. Macrophages in tumor microenvironments and the progression of tumors. Clin. Dev. Immunol. 2012, 2012, 948098. [Google Scholar] [CrossRef] [Green Version]
  46. Brown, J.M.; Recht, L.; Strober, S. The Promise of Targeting Macrophages in Cancer Therapy. Clin. Cancer Res. 2017, 23, 3241–3250. [Google Scholar] [CrossRef] [Green Version]
  47. Wan, Y.Y. Regulatory T cells: Immune suppression and beyond. Cell. Mol. Immunol. 2010, 7, 204–210. [Google Scholar] [CrossRef] [PubMed] [Green Version]
  48. Nishikawa, H.; Sakaguchi, S. Regulatory T cells in tumor immunity. Int. J. Cancer 2010, 127, 759–767. [Google Scholar] [CrossRef] [PubMed]
  49. Medina-Echeverz, J.; Fioravanti, J.; Zabala, M.; Ardaiz, N.; Prieto, J.; Berraondo, P. Successful colon cancer eradication after chemoimmunotherapy is associated with profound phenotypic change of intratumoral myeloid cells. J. Immunol. 2011, 186, 807–815. [Google Scholar] [CrossRef] [Green Version]
  50. Pyonteck, S.M.; Akkari, L.; Schuhmacher, A.J.; Bowman, R.L.; Sevenich, L.; Quail, D.F.; Olson, O.C.; Quick, M.L.; Huse, J.T.; Teijeiro, V.; et al. CSF-1R inhibition alters macrophage polarization and blocks glioma progression. Nat. Med. 2013, 19, 1264–1272. [Google Scholar] [CrossRef] [PubMed] [Green Version]
  51. Lu, J.; Cheng, Y.; Zhang, G.; Tang, Y.; Dong, Z.; McElwee, K.J.; Li, G. Increased expression of neuropilin 1 in melanoma progression and its prognostic significance in patients with melanoma. Mol. Med. Rep. 2015, 12, 2668–2676. [Google Scholar] [CrossRef] [PubMed] [Green Version]
  52. Hong, T.M.; Chen, Y.L.; Wu, Y.Y.; Yuan, A.; Chao, Y.C.; Chung, Y.C.; Wu, M.H.; Yang, S.C.; Pan, S.H.; Shih, J.Y.; et al. Targeting neuropilin 1 as an antitumor strategy in lung cancer. Clin. Cancer Res. 2007, 13, 4759–4768. [Google Scholar] [CrossRef] [Green Version]
  53. Kamiya, T.; Kawakami, T.; Abe, Y.; Nishi, M.; Onoda, N.; Miyazaki, N.; Oida, Y.; Yamazaki, H.; Ueyama, Y.; Nakamura, M. The preserved expression of neuropilin (NRP) 1 contributes to a better prognosis in colon cancer. Oncol. Rep. 2006, 15, 369–373. [Google Scholar] [CrossRef] [Green Version]
  54. Zuo, Y.; Lv, Y.; Qian, X.; Wang, S.; Chen, Z.; Jiang, Q.; Cao, C.; Song, Y. Inhibition of HHIP Promoter Methylation Suppresses Human Gastric Cancer Cell Proliferation and Migration. Cell. Physiol. Biochem. 2018, 45, 1840–1850. [Google Scholar] [CrossRef]
  55. Chen, H.Y.; Zhu, B.H.; Zhang, C.H.; Yang, D.J.; Peng, J.J.; Chen, J.H.; Liu, F.K.; He, Y.L. High CpG island methylator phenotype is associated with lymph node metastasis and prognosis in gastric cancer. Cancer Sci. 2012, 103, 73–79. [Google Scholar] [CrossRef]
  56. Deng, Y.B.; Nagae, G.; Midorikawa, Y.; Yagi, K.; Tsutsumi, S.; Yamamoto, S.; Hasegawa, K.; Kokudo, N.; Aburatani, H.; Kaneda, A. Identification of genes preferentially methylated in hepatitis C virus-related hepatocellular carcinoma. Cancer Sci. 2010, 101, 1501–1510. [Google Scholar] [CrossRef]
  57. Vivekanandhan, S.; Mukhopadhyay, D. Genetic status of KRAS influences Transforming Growth Factor-beta (TGF-beta) signaling: An insight into Neuropilin-1 (NRP1) mediated tumorigenesis. Semin. Cancer Biol. 2019, 54, 72–79. [Google Scholar] [CrossRef] [PubMed]
  58. Mercurio, A.M. VEGF/Neuropilin Signaling in Cancer Stem Cells. Int. J. Mol. Sci. 2019, 20, 490. [Google Scholar] [CrossRef] [PubMed] [Green Version]
  59. Graziani, G.; Lacal, P.M. Neuropilin-1 as Therapeutic Target for Malignant Melanoma. Front. Oncol. 2015, 5, 125. [Google Scholar] [CrossRef] [PubMed] [Green Version]
  60. Chaudhary, B.; Khaled, Y.S.; Ammori, B.J.; Elkord, E. Neuropilin 1: Function and therapeutic potential in cancer. Cancer Immunol. Immunother. 2014, 63, 81–99. [Google Scholar] [CrossRef]
  61. Wang, X.; Hu, H.; Liu, H. RNA binding protein Lin28B confers gastric cancer cells stemness via directly binding to NRP-1. Biomed. Pharmacother. 2018, 104, 383–389. [Google Scholar] [CrossRef]
  62. Rizzolio, S.; Cagnoni, G.; Battistini, C.; Bonelli, S.; Isella, C.; Van Ginderachter, J.A.; Bernards, R.; Di Nicolantonio, F.; Giordano, S.; Tamagnone, L. Neuropilin-1 upregulation elicits adaptive resistance to oncogene-targeted therapies. J. Clin. Investig. 2018, 128, 3976–3990. [Google Scholar] [CrossRef]
  63. Peng, Y.; Liu, Y.M.; Li, L.C.; Wang, L.L.; Wu, X.L. MicroRNA-338 inhibits growth, invasion and metastasis of gastric cancer by targeting NRP1 expression. PLoS ONE 2014, 9, e94422. [Google Scholar] [CrossRef] [Green Version]
  64. Yang, W.; Lai, Z.; Li, Y.; Mu, J.; Yang, M.; Xie, J.; Xu, J. Immune signature profiling identified prognostic factors for gastric cancer. Chin. J. Cancer Res. 2019, 31, 463–470. [Google Scholar] [CrossRef]
  65. Napolitano, V.; Tamagnone, L. Neuropilins Controlling Cancer Therapy Responsiveness. Int. J. Mol. Sci. 2019, 20, 2049. [Google Scholar] [CrossRef] [Green Version]
  66. Waniczek, D.; Lorenc, Z.; Snietura, M.; Wesecki, M.; Kopec, A.; Muc-Wierzgon, M. Tumor-Associated Macrophages and Regulatory T Cells Infiltration and the Clinical Outcome in Colorectal Cancer. Arch. Immunol. Ther. Exp. 2017, 65, 445–454. [Google Scholar] [CrossRef] [Green Version]
  67. Ino, Y.; Yamazaki-Itoh, R.; Shimada, K.; Iwasaki, M.; Kosuge, T.; Kanai, Y.; Hiraoka, N. Immune cell infiltration as an indicator of the immune microenvironment of pancreatic cancer. Br. J. Cancer 2013, 108, 914–923. [Google Scholar] [CrossRef] [PubMed]
  68. Xue, Y.; Tong, L.; LiuAnwei Liu, F.; Liu, A.; Zeng, S.; Xiong, Q.; Yang, Z.; He, X.; Sun, Y.; Xu, C. Tumorinfiltrating M2 macrophages driven by specific genomic alterations are associated with prognosis in bladder cancer. Oncol. Rep. 2019, 42, 581–594. [Google Scholar] [CrossRef] [PubMed]
  69. Paluskievicz, C.M.; Cao, X.; Abdi, R.; Zheng, P.; Liu, Y.; Bromberg, J.S. T Regulatory Cells and Priming the Suppressive Tumor Microenvironment. Front. Immunol. 2019, 10, 2453. [Google Scholar] [CrossRef] [PubMed]
  70. Shitara, K.; Nishikawa, H. Regulatory T cells: A potential target in cancer immunotherapy. Ann. N. Y. Acad. Sci. 2018, 1417, 104–115. [Google Scholar] [CrossRef] [PubMed]
  71. Jackute, J.; Zemaitis, M.; Pranys, D.; Sitkauskiene, B.; Miliauskas, S.; Vaitkiene, S.; Sakalauskas, R. Distribution of M1 and M2 macrophages in tumor islets and stroma in relation to prognosis of non-small cell lung cancer. BMC Immunol. 2018, 19, 3. [Google Scholar] [CrossRef] [Green Version]
  72. Liu, C.; Chikina, M.; Deshpande, R.; Menk, A.V.; Wang, T.; Tabib, T.; Brunazzi, E.A.; Vignali, K.M.; Sun, M.; Stolz, D.B.; et al. Treg Cells Promote the SREBP1-Dependent Metabolic Fitness of Tumor-Promoting Macrophages via Repression of CD8(+) T Cell-Derived Interferon-gamma. Immunity 2019, 51, 381–397.e6. [Google Scholar] [CrossRef]
  73. Ding, J.; Guo, C.; Hu, P.; Chen, J.; Liu, Q.; Wu, X.; Cao, Y.; Wu, J. CSF1 is involved in breast cancer progression through inducing monocyte differentiation and homing. Int. J. Oncol. 2016, 49, 2064–2074. [Google Scholar] [CrossRef] [Green Version]
  74. Miyauchi, J.T.; Chen, D.; Choi, M.; Nissen, J.C.; Shroyer, K.R.; Djordevic, S.; Zachary, I.C.; Selwood, D.; Tsirka, S.E. Ablation of Neuropilin 1 from glioma-associated microglia and macrophages slows tumor progression. Oncotarget 2016, 7, 9801–9814. [Google Scholar] [CrossRef] [Green Version]
  75. Forget, M.A.; Voorhees, J.L.; Cole, S.L.; Dakhlallah, D.; Patterson, I.L.; Gross, A.C.; Moldovan, L.; Mo, X.; Evans, R.; Marsh, C.B.; et al. Macrophage colony-stimulating factor augments Tie2-expressing monocyte differentiation, angiogenic function, and recruitment in a mouse model of breast cancer. PLoS ONE 2014, 9, e98623. [Google Scholar] [CrossRef]
  76. Zhu, X.D.; Zhang, J.B.; Zhuang, P.Y.; Zhu, H.G.; Zhang, W.; Xiong, Y.Q.; Wu, W.Z.; Wang, L.; Tang, Z.Y.; Sun, H.C. High expression of macrophage colony-stimulating factor in peritumoral liver tissue is associated with poor survival after curative resection of hepatocellular carcinoma. J. Clin. Oncol. 2008, 26, 2707–2716. [Google Scholar] [CrossRef]
  77. Huang, X.; Zou, Y.; Lian, L.; Wu, X.; He, X.; He, X.; Wu, X.; Huang, Y.; Lan, P. Changes of T cells and cytokines TGF-beta1 and IL-10 in mice during liver metastasis of colon carcinoma: Implications for liver anti-tumor immunity. J. Gastrointest. Surg. 2013, 17, 1283–1291. [Google Scholar] [CrossRef] [PubMed]
  78. Collison, L.W.; Workman, C.J.; Kuo, T.T.; Boyd, K.; Wang, Y.; Vignali, K.M.; Cross, R.; Sehy, D.; Blumberg, R.S.; Vignali, D.A. The inhibitory cytokine IL-35 contributes to regulatory T-cell function. Nature 2007, 450, 566–569. [Google Scholar] [CrossRef] [PubMed]
  79. Li, X.; Mai, J.; Virtue, A.; Yin, Y.; Gong, R.; Sha, X.; Gutchigian, S.; Frisch, A.; Hodge, I.; Jiang, X.; et al. IL-35 is a novel responsive anti-inflammatory cytokine—A new system of categorizing anti-inflammatory cytokines. PLoS ONE 2012, 7, e33628. [Google Scholar] [CrossRef] [PubMed] [Green Version]
Figure 1. NPR1 expression levels in different types of cancer and their normal tissues. (a) Expression of NRP1 in different type of cancer using the Oncomine database. The graph shows the numbers of datasets with mRNA up-regulated expression (red) or down-regulated expression (blue). The threshold was designed with following parameters: p-value of 1 × 10⁻⁴ and fold change of 2. (b) The GEPIA2 database was used to determine NRP1 mRNA expression in various types of cancer. The dot plots present mRNA expression data from each cancer and normal tissues that were profiled. Red dots represent tumor tissues, green dots represent normal tissues, and black dots represent the average value of all tumor and normal tissues. The red label indicates that NRP1 is upregulated in cancer compared to normal tissue and green indicates downregulation. The black label indicates no significant difference between the tumor and normal tissue. Abbreviations of cancer types are presented in Supplementary Table S1. (c) Expression of NRP1 in various types of cancer and normal tissues is displayed using the TIMER website. Datasets of normal and cancer tissues were obtained from the TCGA database. * P < 0.05, ** P < 0.01, *** P < 0.001.
Jcm 09 01430 g001
Figure 2. Correlation between NRP1 expression and clinicopathologic parameters of patients with stomach adenocarcinoma (STAD): NRP1 mRNA expression level was expressed as box plots using the UALCAN database. Boxplots of mRNA expression of NRP1 in normal control and STAD tumors with the clinicopathologic parameters such as: (a) primary tumors, (b) individual cancer stage (how large the primary tumor is and how far the cancer has spread in the patient’s body), (c) patient race, (d) patient gender, (e) patient age, and (f) tumor grade (how abnormal the cancer cells look under microscope), were shown. P values were results of student’s t-test between normal control and each clinicopathologic parameters. * P < 0.05, ** P < 0.01, *** P < 0.001.
Jcm 09 01430 g002
Figure 3. Correlation between promoter methylation of the NRP1 and clinical parameters of patients with STAD. Promoter methylation level was expressed as box plots using the UALCAN database. Promoter methylation of NRP1 in STAD tumors (different color plot) and their normal tissues (blue plot) was shown according to the clinicopathologic parameters: (a) normal vs. primary tumor, (b) individual cancer stage, (c) patient race, (d) patient gender, (e) patient age, and (f) tumor grade. * P < 0.05, ** P < 0.01, *** P < 0.001.
Jcm 09 01430 g003
Figure 4. Correlation between NRP1 expression and patient survival in STAD and lung adenocarcinoma (LUAD). Kaplan-Meier survival curves were generated using the GEPIA2 website. Patient’s survivals were compared between two groups divided at median value of NRP1 expression as higher (red) and lower (blue) in TCGA data. (a) STAD; n = 384, (b) LUAD; n = 478. Survival curves of overall survival (OS), first progression (FS), and post progression survival (PPS) in (c) STAD and (d) LUAD using Kaplan-Meier plotter with best cut-off option [35]. The prognostic value of NRP1 using TIMER database is presented in Supplementary Figure S3.
Jcm 09 01430 g004
Figure 5. Correlations between NRP1 expression and gene markers of Treg, TAM, and M1 and M2 macrophages in STAD and LUAD. Infiltration level of NRP1 expression with various gene markers of Treg cells, TAM, M1 macrophages, and M2 macrophages was confirmed using TIMER. FOXP3, CCR8, and TGFβ1 were used as markers for Treg cells, and CCL2, CD68, and IL10 were used as markers for TAM. Moreover, NOS2, IRF5, and COX2 were used as markers for M1 macrophages, and CD163, VSIG4, and MS4A4A were used as markers for M2 macrophages. NRP1 expression was positively correlated with the expression of various gene markers for Treg cells, TAM, and M2 macrophages in STAD. However, the correlation of NRP1 expression with various gene markers in LUAD was weaker than in STAD. Correlation constants and P-values are listed in Table 1.
Jcm 09 01430 g005
Figure 6. Correlation of NRP1 expression and gene markers of cytokine (CSF1, TGFβ1, IL-10, and EBI3). Correlation of NRP1 expression with cytokine gene markers was examined using TIMER. A significant positive correlation between NRP1 expression and CSF1, TGFβ1, IL-10, and EBI3 were observed in STAD. However, correlation of NRP1 expression with cytokine gene markers in LUAD was weak compared to STAD. Correlation constants between NRP1 and gene markers of cytokine are presented in Supplementary Table S5.
Jcm 09 01430 g006
Table 1. Correlation analysis between NRP1 and gene markers of immune cells using TIMER.
DescriptionGene MarkersSTADLUAD
NonePurityNonePurity
CorPCorPCorPCorP
T cell (general)CD3D0.306***0.273***0.143*0.1010.024
CD3E0.333***0.39***0.155**0.117*
CD20.382***0.36***0.168**0.127*
Treg cellFOXP30.363***0.336***0.233***0.203***
CCR80.495***0.482***0.331***0.317***
STAT5B0.57900.574***0.364***0.358***
TGFβ (TGFB1)0.596***0.576***0.45800.444***
TAMCCL20.50100.472***0.247***0.227***
CD680.41400.384***0.256***0.247**
IL100.551***0.534***0.197***0.177*
M1 MacrophageINOS(NOS2)−0.0010.976−0.0130.8030.151**0.127*
IRF50.313***0.301***0.206***0.183***
COX2 (PTGS2)0.279***0.258***0.192***0.207**
M2 MacrophageCD1630.66200.642***0.365***0.363***
VSIG40.60700.601***0.290***0.279***
MS4A4A0.65600.644***0.309***0.303***
CD8+ T cellCD8A0.365***0.339***0.156**0.129*
CD8B0.220***0.202***0.0770.0810.0490.280
NeutrophilCD66b(CEACAM8)0.1020.0360.1150.0250.193***0.183***
CD11b (ITGAM)0.61400.598***0.367***0.357***
CCR70.42700.403***0.157**0.119*
NK cellKIR2DL10.250***0.256***0.0150.725−0.0030.939
KIR2DL30.180***0.169***0.0890.0430.0690.123
KIR2DL40.1130.020.0860.0910.0680.1220.0440.324
KIR3DL10.219***0.210***0.0210.629−0.0110.810
KIR3DL20.204***0.202***0.1220.0050.1000.026
KIR3DL3−0.0010.9910.0220.6670.0640.1450.0420.352
KIR2DS40.162***0.161*0.0930.0340.0650.151
B cellCD190.259***0.230***−0.0080.850−0.0570.203
CD79A0.263***0.219***0.0400.3690.0040.925
MonocyteCD860.575***0.563***0.340***0.332***
CD115 (CSF1R)0.66400.647***0.374***0.357***
T cell exhaustionPD1 (PDCD1)0.266***0.245***0.157**0.127*
CTLA40.289***0.265***0.186***0.152**
LAG30.249***0.218***0.0760.0860.0430.343
TIM3 (HAVCR2)0.56900.553***0.309***0.296***
STAD, Stomach Adenocarcinoma; LUAD, Lung Adenocarcinoma; Treg, regulatory T cell; TAM, tumor-associated macrophage; Th, T helper cell; Tfh, Follicular helper T cell; Cor, P value of Spearman’s correlation; None, correlation without adjustment; Purity, correlation adjusted by purity. * P < 0.01; ** P < 0.001; *** P < 0.0001.
Table 2. Correlation analysis between NRP1 expression and genes markers of Treg cells, TAM, M1 macrophages, and M2 macrophages using GEPIA 2.
Cell TypeGene MarkersSTADLUAD
TumorNormalTumorNormal
RPRPRPRP
TregFOXP30.35***−0.360.030.21***0.310.019
CCR80.5***−0.220.190.33***0.250.059
STAT5B0.62***0.87***0.37***0.84***
TGFβ (TGFB1)0.59***0.170.330.43***0.43**
TAMCCL20.48***0.410.0130.23***0.120.36
CD680.46***−0.320.0570.29***0.110.42
IL100.58***0.20.250.21***0.0240.86
M1 MacrophageINOS (NOS2)0.0170.740.280.10.19***0.62***
IRF50.59***0.67***0.29***−0.190.15
COX2 (PTGS2)0.33***0.77***0.2***0.210.11
M2 MacrophageCD1630.59***0.67***0.29***−0.190.15
VSIG40.6***0.64***0.28***−0.20.12
MS4A4A0.64***0.61***0.31***−0.220.099
** P < 0.001; *** P < 0.0001.

