1. Introduction
Pancreatic ductal adenocarcinoma (PDAC), despite its relative rarity, remains among the deadliest tumor entities in the developed world. For instance, PDAC is the 4th leading cause of cancer-related death while representing only 3% of newly diagnosed cancer cases in the United States [
1]. A large body of research into therapeutic targets, and newly introduced therapy regimens, have hitherto not been able to improve overall PDAC patient prognosis beyond a five-year survival of about 9% [
2]. Even in the setting of tumor resection and adjuvant chemotherapy [
3], patients often develop therapy-resistant tumor recurrence or metachronous metastatic disease. The key driver of such therapy escape phenomena is likely to be tumor heterogeneity, both on the genetic level, with the four driver genes kras, smad4, tp53 and p16 [
4,
5] having been shown to lead to distinct survival outcomes [
6,
7]. On the molecular/histo-morphologic level, quasi-mesenchymal and epithelial tumors demonstrate a distinct chemotherapy response [
8,
9]. Hence, despite the overall poor prognosis in PDAC, significant differences in individual patient survival are noted. Therefore, outcome prediction and patient stratification based on available parameters represent important goals in clinical patient care. The current gold standard for tumor assessment, biopsy and histopathology, entail a major risk of misclassifying tumors due to undersampling and sampling errors. Moreover, non-invasive biomarkers have yet to reach clinical maturity. Recently however, evidence has emerged that the machine learning-based analysis of pre-therapeutic imaging can provide a decision guidance based on the non-invasive derivation of quantitative, whole-tumor characteristics [
10,
11]. Image pattern analysis and machine learning approaches (often termed radiomics) have yielded encouraging results in the prediction of molecular PDAC subtypes and of patient survival from magnetic resonance or computed tomography imaging [
12,
13]. Much of recent research, driven by the increase in attention towards the field of artificial intelligence, has concentrated exclusively on proving the superiority of radiomics to human observers or other diagnostic and prognostic parameters [
14,
15,
16]. However, in a disease as complex as PDAC, the integration of clinical information, invasive biomarkers and imaging-derived data may provide a more comprehensive prognostic assessment of the tumor than any single modality [
17]. Therefore, a fair comparison elucidating the differential contribution of each parameter type and their combined value, is warranted.
In this study, we present a multimodal, data-driven workflow including clinical information, histo-morphologic/genetic parameters and computed tomography-derived imaging biomarkers for modelling overall patient survival in the post-operative setting.
2. Experimental Section
The study was designed as a retrospective cohort study. The study was approved by the institutional ethics review board (Ethics Committee of the Technical University of Munich Faculty of Medicine) (Protocol Number 180/17S; date of approval: 9 May 2017), and the requirement for individual written consent was waived. All procedures were carried out in accordance with pertinent laws and regulations, as well as the Helsinki declaration. The STrengthening the Reporting of OBservational studies in Epidemiology (STROBE) checklist [
18] and patient inclusion flowchart are included in the
supplemental material (Table S1 and Figure S1). In brief, 177 patients with a confirmed diagnosis of PDAC were considered for inclusion. Patients without baseline computed tomography (CT) imaging, incomplete imaging, insufficient image quality (due to motion artifacts or significant beam hardening from adjacent foreign matter), patients who died sooner than six weeks after surgery or those with incomplete clinical data were excluded. A total of 103 patients were analyzed. All patients underwent tumor resection. The follow-up interval began on the 10 October 2006 and ended on the 14 April 2019. Clinical data were obtained using the hospital’s information system, and survival information was obtained from the hospital’s information system and from the national cancer registry. The genetic and histopathological analyses were carried out by the Department of Pathology of the Technical University of Munich and were available prior to the study commencement. Image-derived parameters data were collected during the analysis.
The following clinical data was obtained for all patients: sex, age at diagnosis, tumor site (head, body or tail of the pancreas), type of adjuvant chemotherapy received (gemcitabine-based vs. no chemotherapy), time to progression, type of progressive disease (local recurrence, metastasis, both), first-line chemotherapy after progression (gemcitabine, FOLFIRINOX, none/best supportive care) and overall survival time including censoring.
The following histopathological data was obtained from formalin-fixed paraffin embedded tumor specimens: tumor size (pT1/2 vs. pT3/4), lymph node status (pN0 vs. pN+), grading (G1/2 vs. G3, i.e., high vs. low grade), resection status (R0 vs. R+, including positive continuous resection margins) and molecular subtypes according to Muckenhuber et al. [
19] (quasi-mesenchymal (QM) vs. non-quasi-mesenchymal (Non-QM)); and tumor morphology (conventional vs. combined) and mutational status of tp53 (wild-type vs. mutated), kras (wild-type vs. mutated), p16 (intact vs. altered) and smad4 (positive vs. loss), both as described in Schlitter et al. [
20].
CT images were exported from the hospital picture archive and processed as previously described [
13,
21] and according to current best practices. Segmentation was performed fully automatically by in-house developed software and manually corrected by an expert observer. Image-derived features were extracted using PyRadiomics version 2.2.0 [
22] with standard settings. 1409 image features were extracted. Features with a variance of less than 1e-5 were excluded, yielding 1384 radiomic features which were included in the analysis. Feature values were normalized to the (0, 1) interval. A detailed description of the radiomic extraction process can be found in the
supplement (File S1). The PyRadiomics extraction settings file (.yml) can also be found in the
supplement (File S2).
To assess the differential contribution of each parameter category, the following four parameter groups were analyzed: (1) clinical and standard histopathological data (age, sex, chemotherapy, pT, pN, G, R), (2) morpho-molecular and genetic data (tumor morphology, molecular subtype, and tp53, kras, smad4 and p16 genetics), (3) image-derived features and (4) all features combined.
Due to the very large number of features compared to the cohort size, an unsupervised machine learning-based dimensionality reduction and feature selection were performed as follows: linear principle component analysis (PCA) was employed for radiomic features with the aim of capturing 99% of the parameter variance. A univariate pre-selection was performed on all features using the log-rank-test statistic with a cut-off of p < 0.1.
The Cox Proportional Hazards model was fit to each parameter group separately at first to assess the model concordance index (CI) after asserting that the proportional hazards assumptions were met. Parameters which did not meet the proportional hazards assumptions were excluded from the final analysis of the combined features. For testing the predictive performance, a five-fold hold-out cross-validation was employed in all analyses, and the concordance indexes across the five folds were averaged. 95% confidence intervals were calculated using 100-fold bootstrap resampling. All statistical analyses were performed in Python v. 3.7.6. using the packages lifelines and scikit-learn. A two-sided significance level of p < 0.05 was chosen.
3. Results
A total of 103 patients were included in the study. Their clinical characteristics are summarized in
Table 1.
Of the 103 patients included, 51 patients experienced a progressive disease during the observation period, and of these 14 (27%) experienced local recurrence, 29 (57%) liver metastasis and 8 (16%) both. Of those patients, 22 (43%) received first-line gemcitabine, 13 (25%) received first-line FOLFIRINOX and 16 (31%) received best supportive care. The median progression-free survival was 7.3 months. The disease progression (experienced vs. did not experience) or type of treatment after progression were not significantly associated with overall survival and are thus not included in the final analysis.
The Cox proportional hazards method was used for modelling the overall survival using each of the parameter categories. The median overall survival was 16.6 months, and 19/103 patients (18.4%) were censored in the final survival analysis.
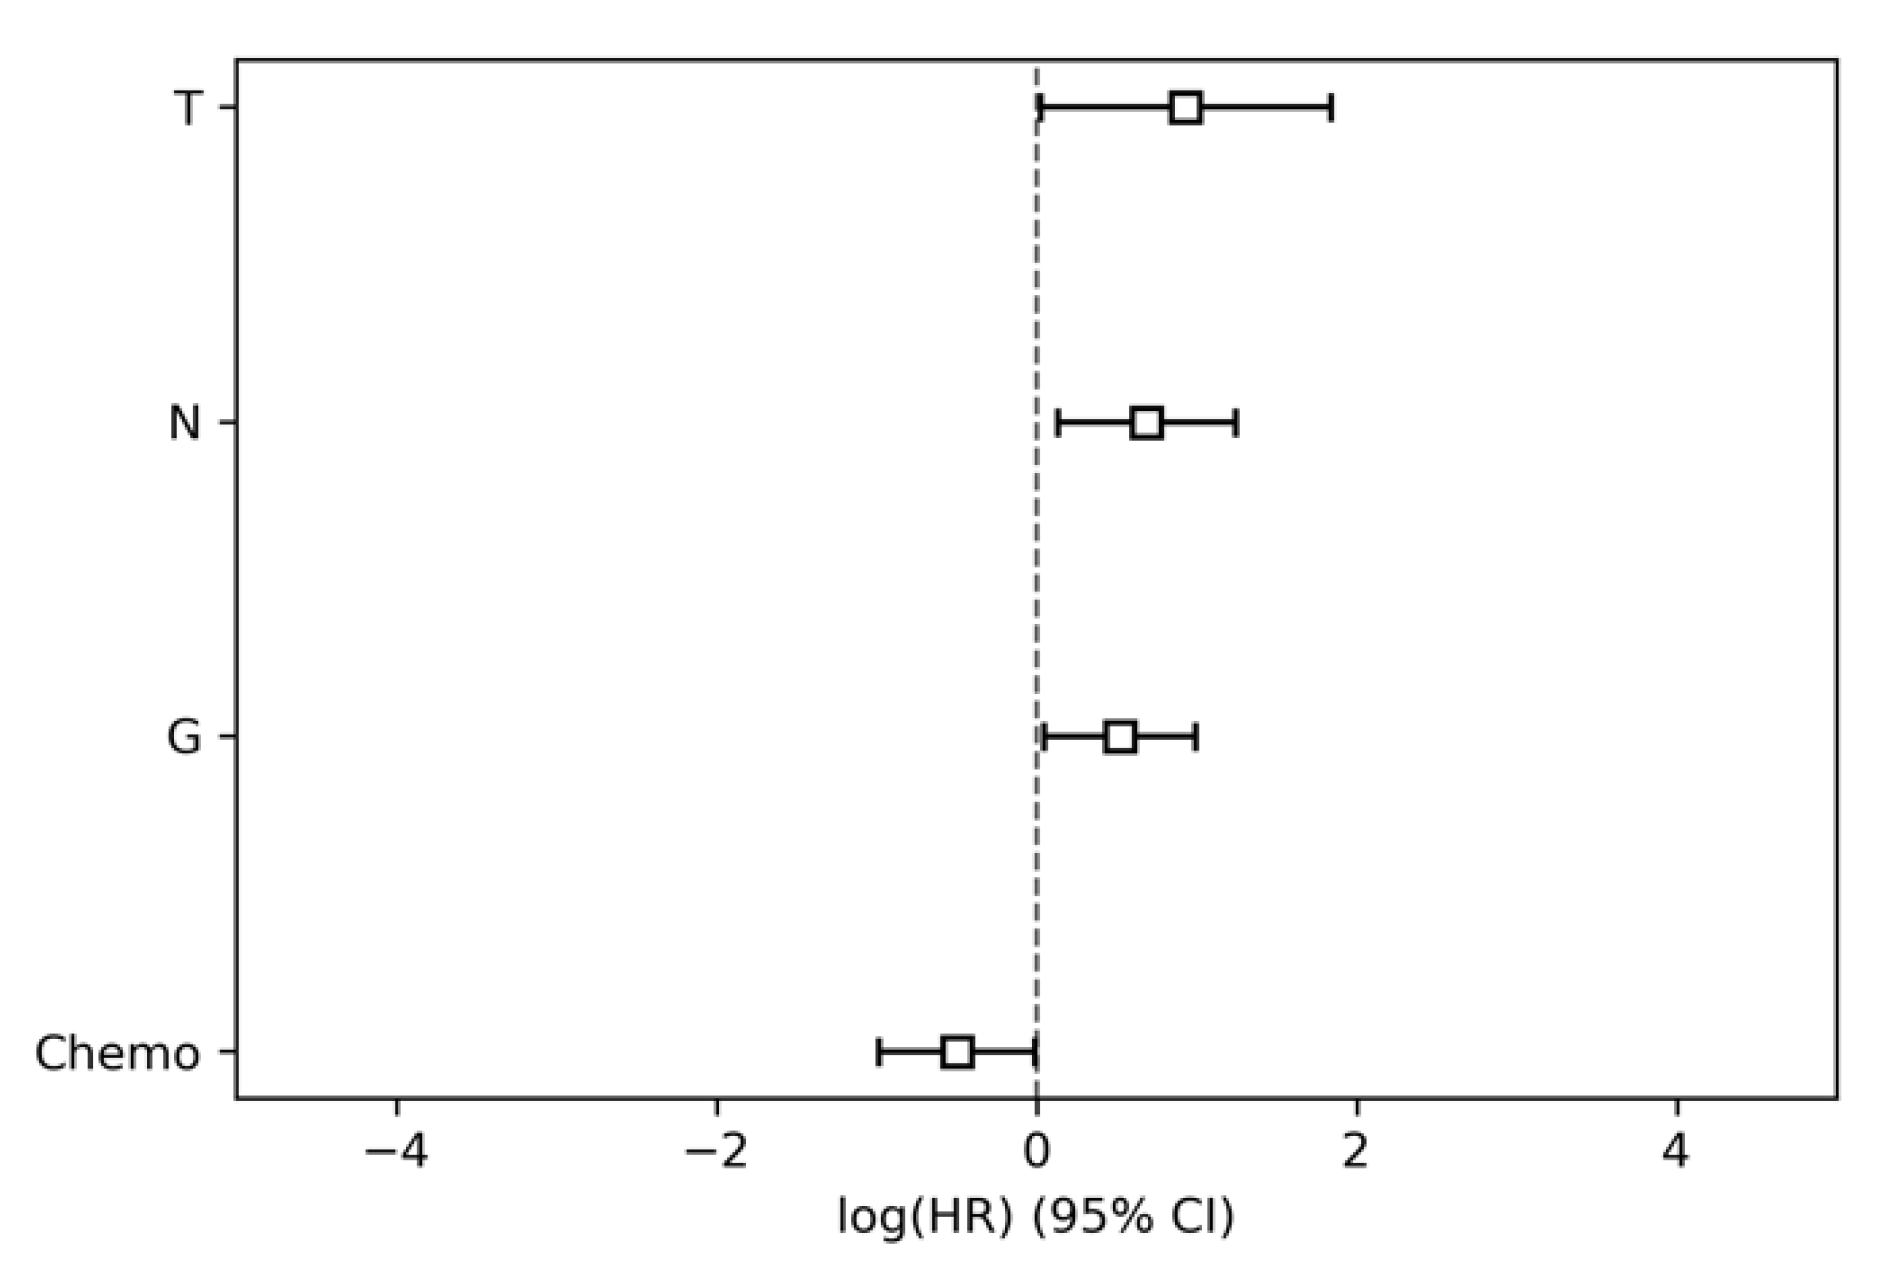
The modelling of parameter group 1, i.e., the clinical and standard histopathological data (age, sex, chemotherapy, pT, pN, G, R) achieved a CI of 0.63 (95% conf. int. 0.60–0.66). The nodal status (pN), tumor grading (G), tumor size (pT) and chemotherapy regimen were significantly associated with overall survival (
Table 2,
Figure 1).
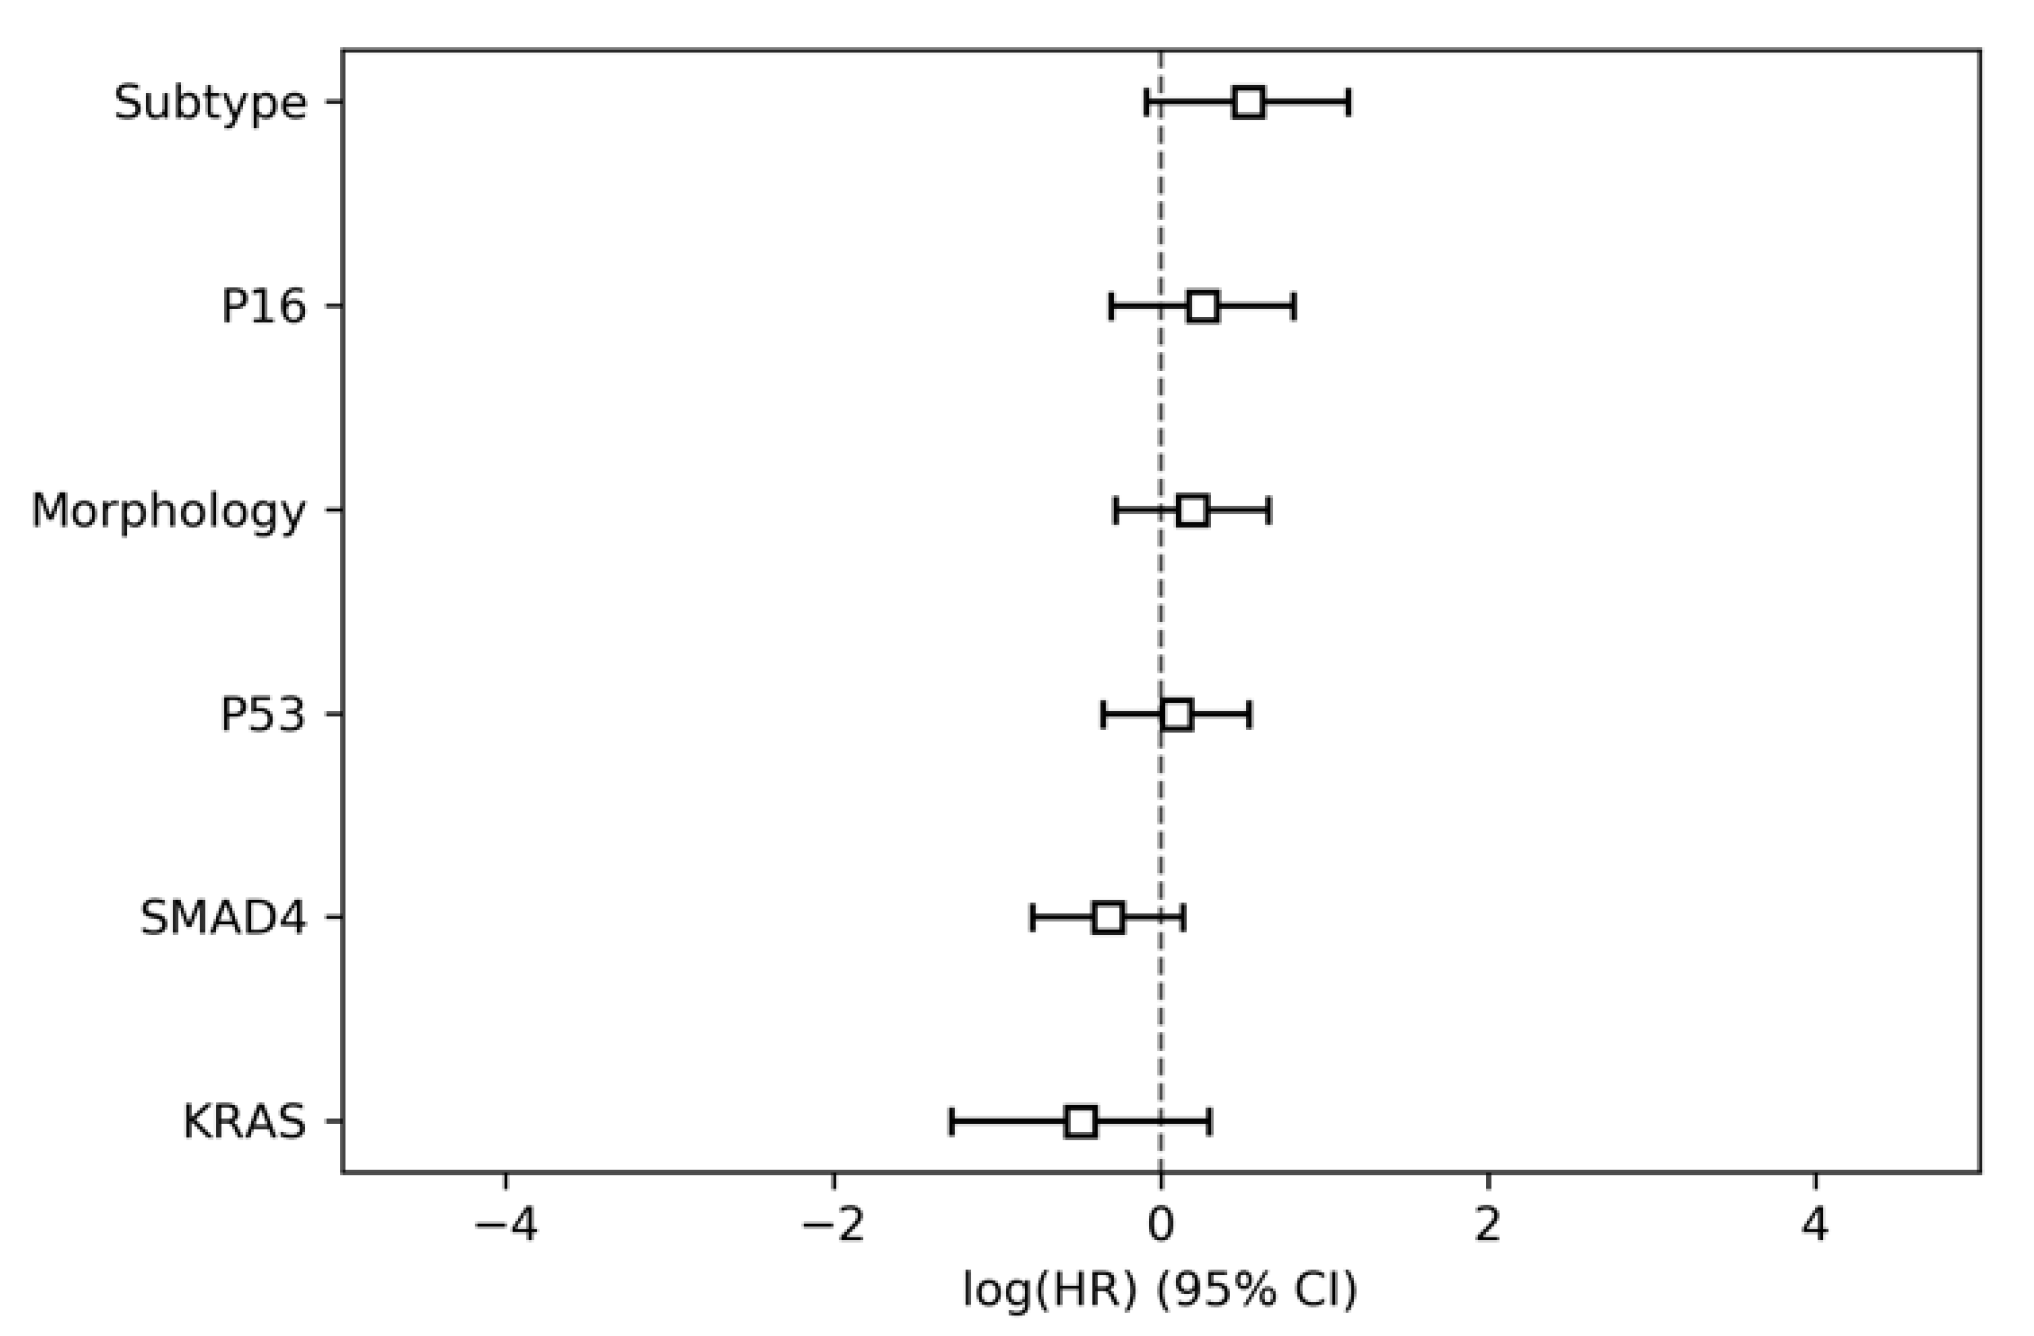
In parameter group 2, i.e., the morpho-molecular and genetic data (tumor morphology, molecular subtype, and pt53, kras, smad4 and p16 genetics), the tumor morphology did not meet the proportional hazard assumptions and was therefore excluded from the combined analysis. None of the parameters were significantly associated with overall survival (
Table 3,
Figure 2). The model resulted in a CI of 0.53 (95% conf. int. 0.47–0.59).
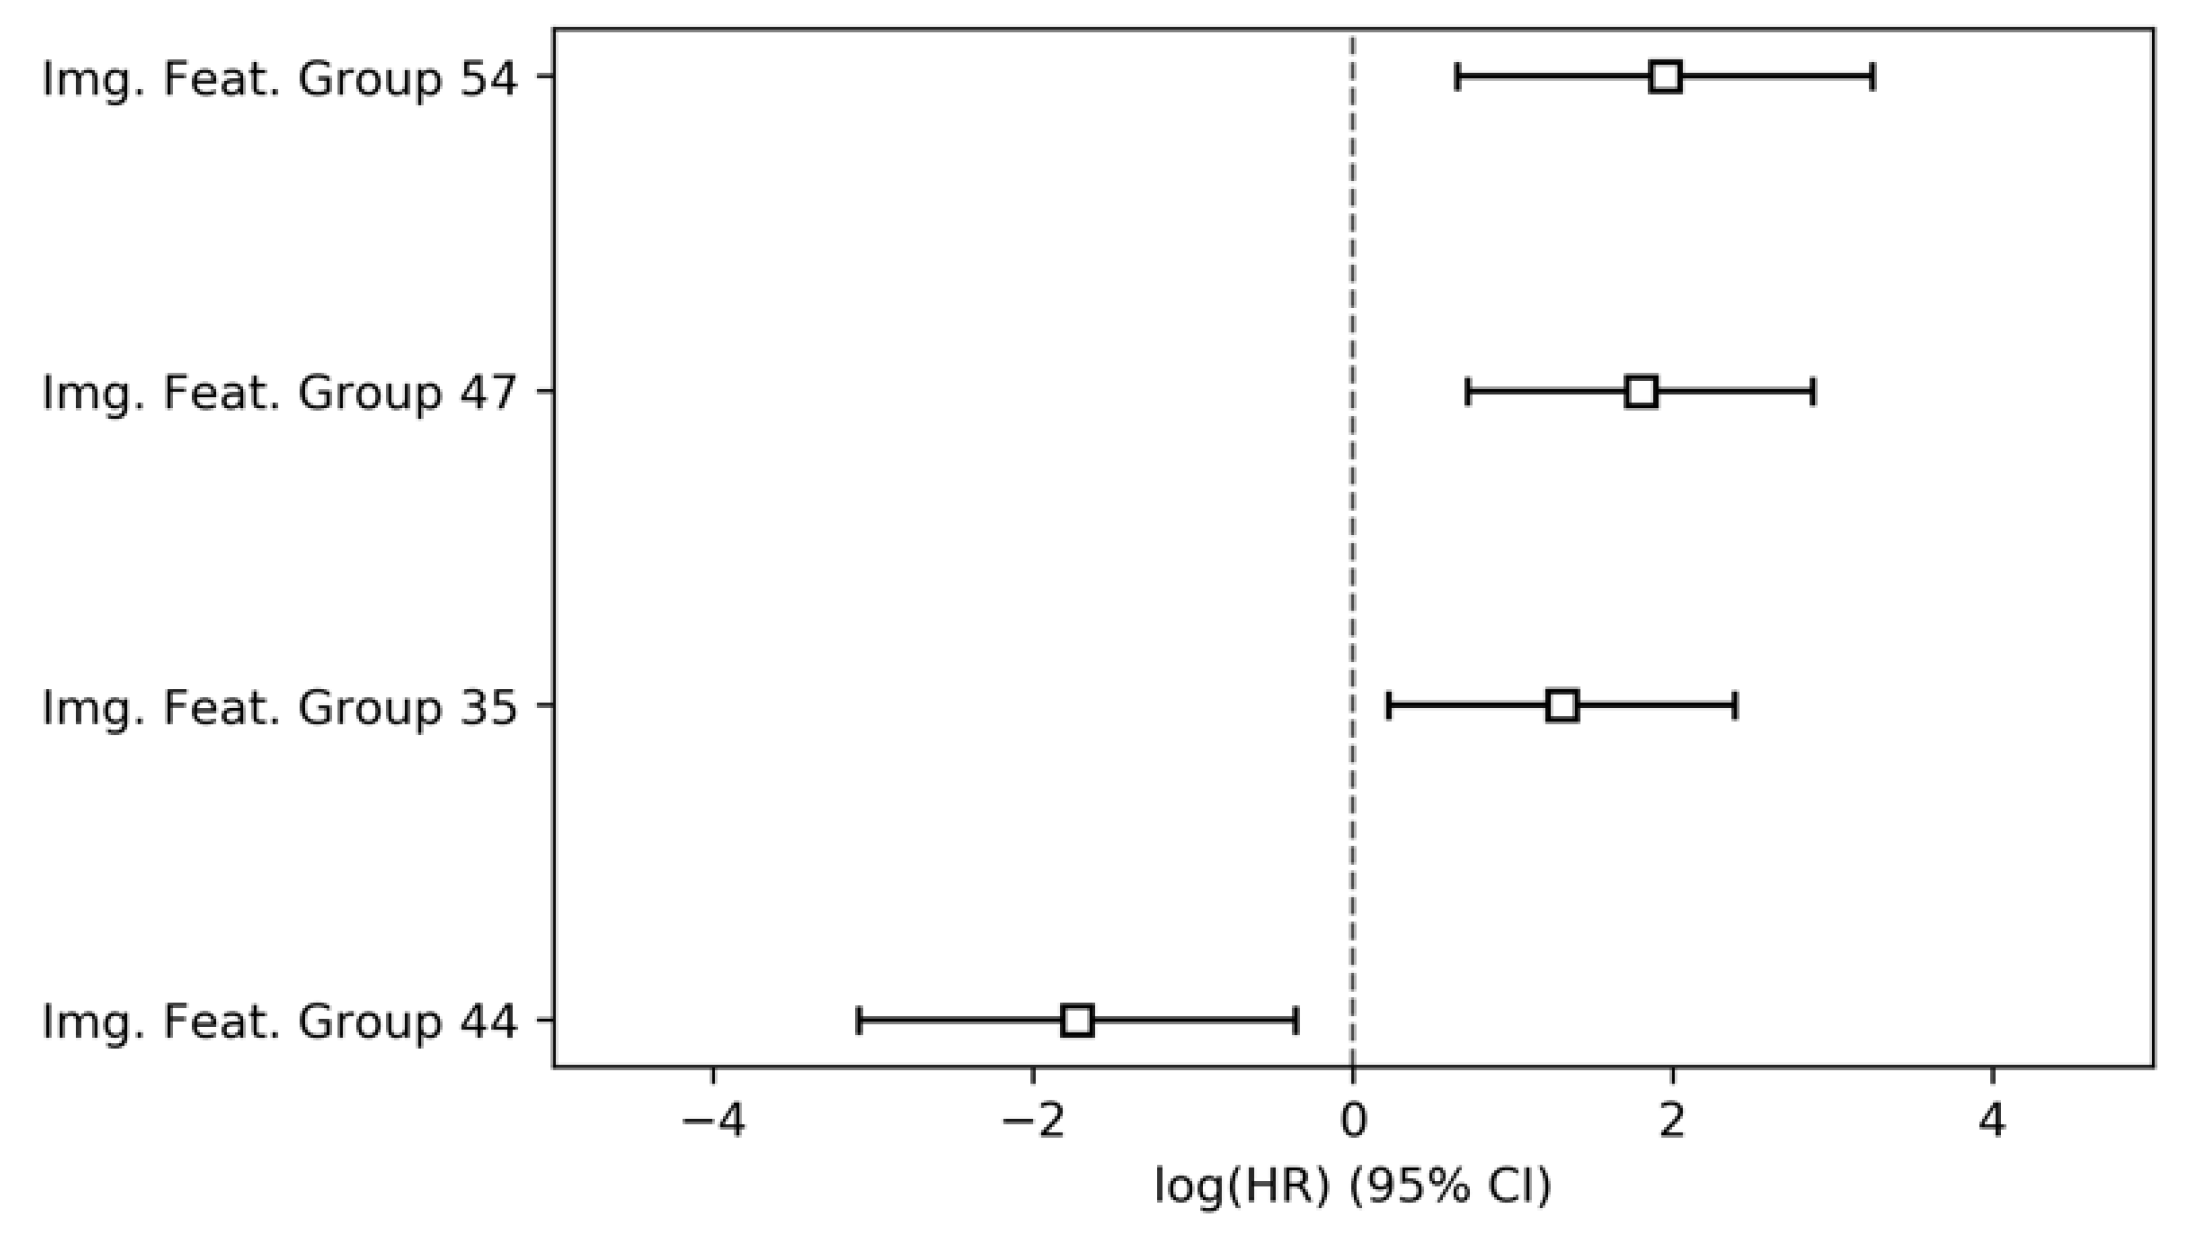
The principal component analysis of the imaging features, i.e., parameter group 3, resulted in 71 unique image-derived feature groups representing 99% of the total parameter variance. Their modelling was preceded by a univariate pre-selection, after which eight image feature groups were retained for inclusion in the multivariate model. Of these, four were significantly associated with overall survival (
Table 4,
Figure 3), three negatively and one positively. The multivariate model achieved a CI of 0.65 (95% conf. int. 0.62–0.69).
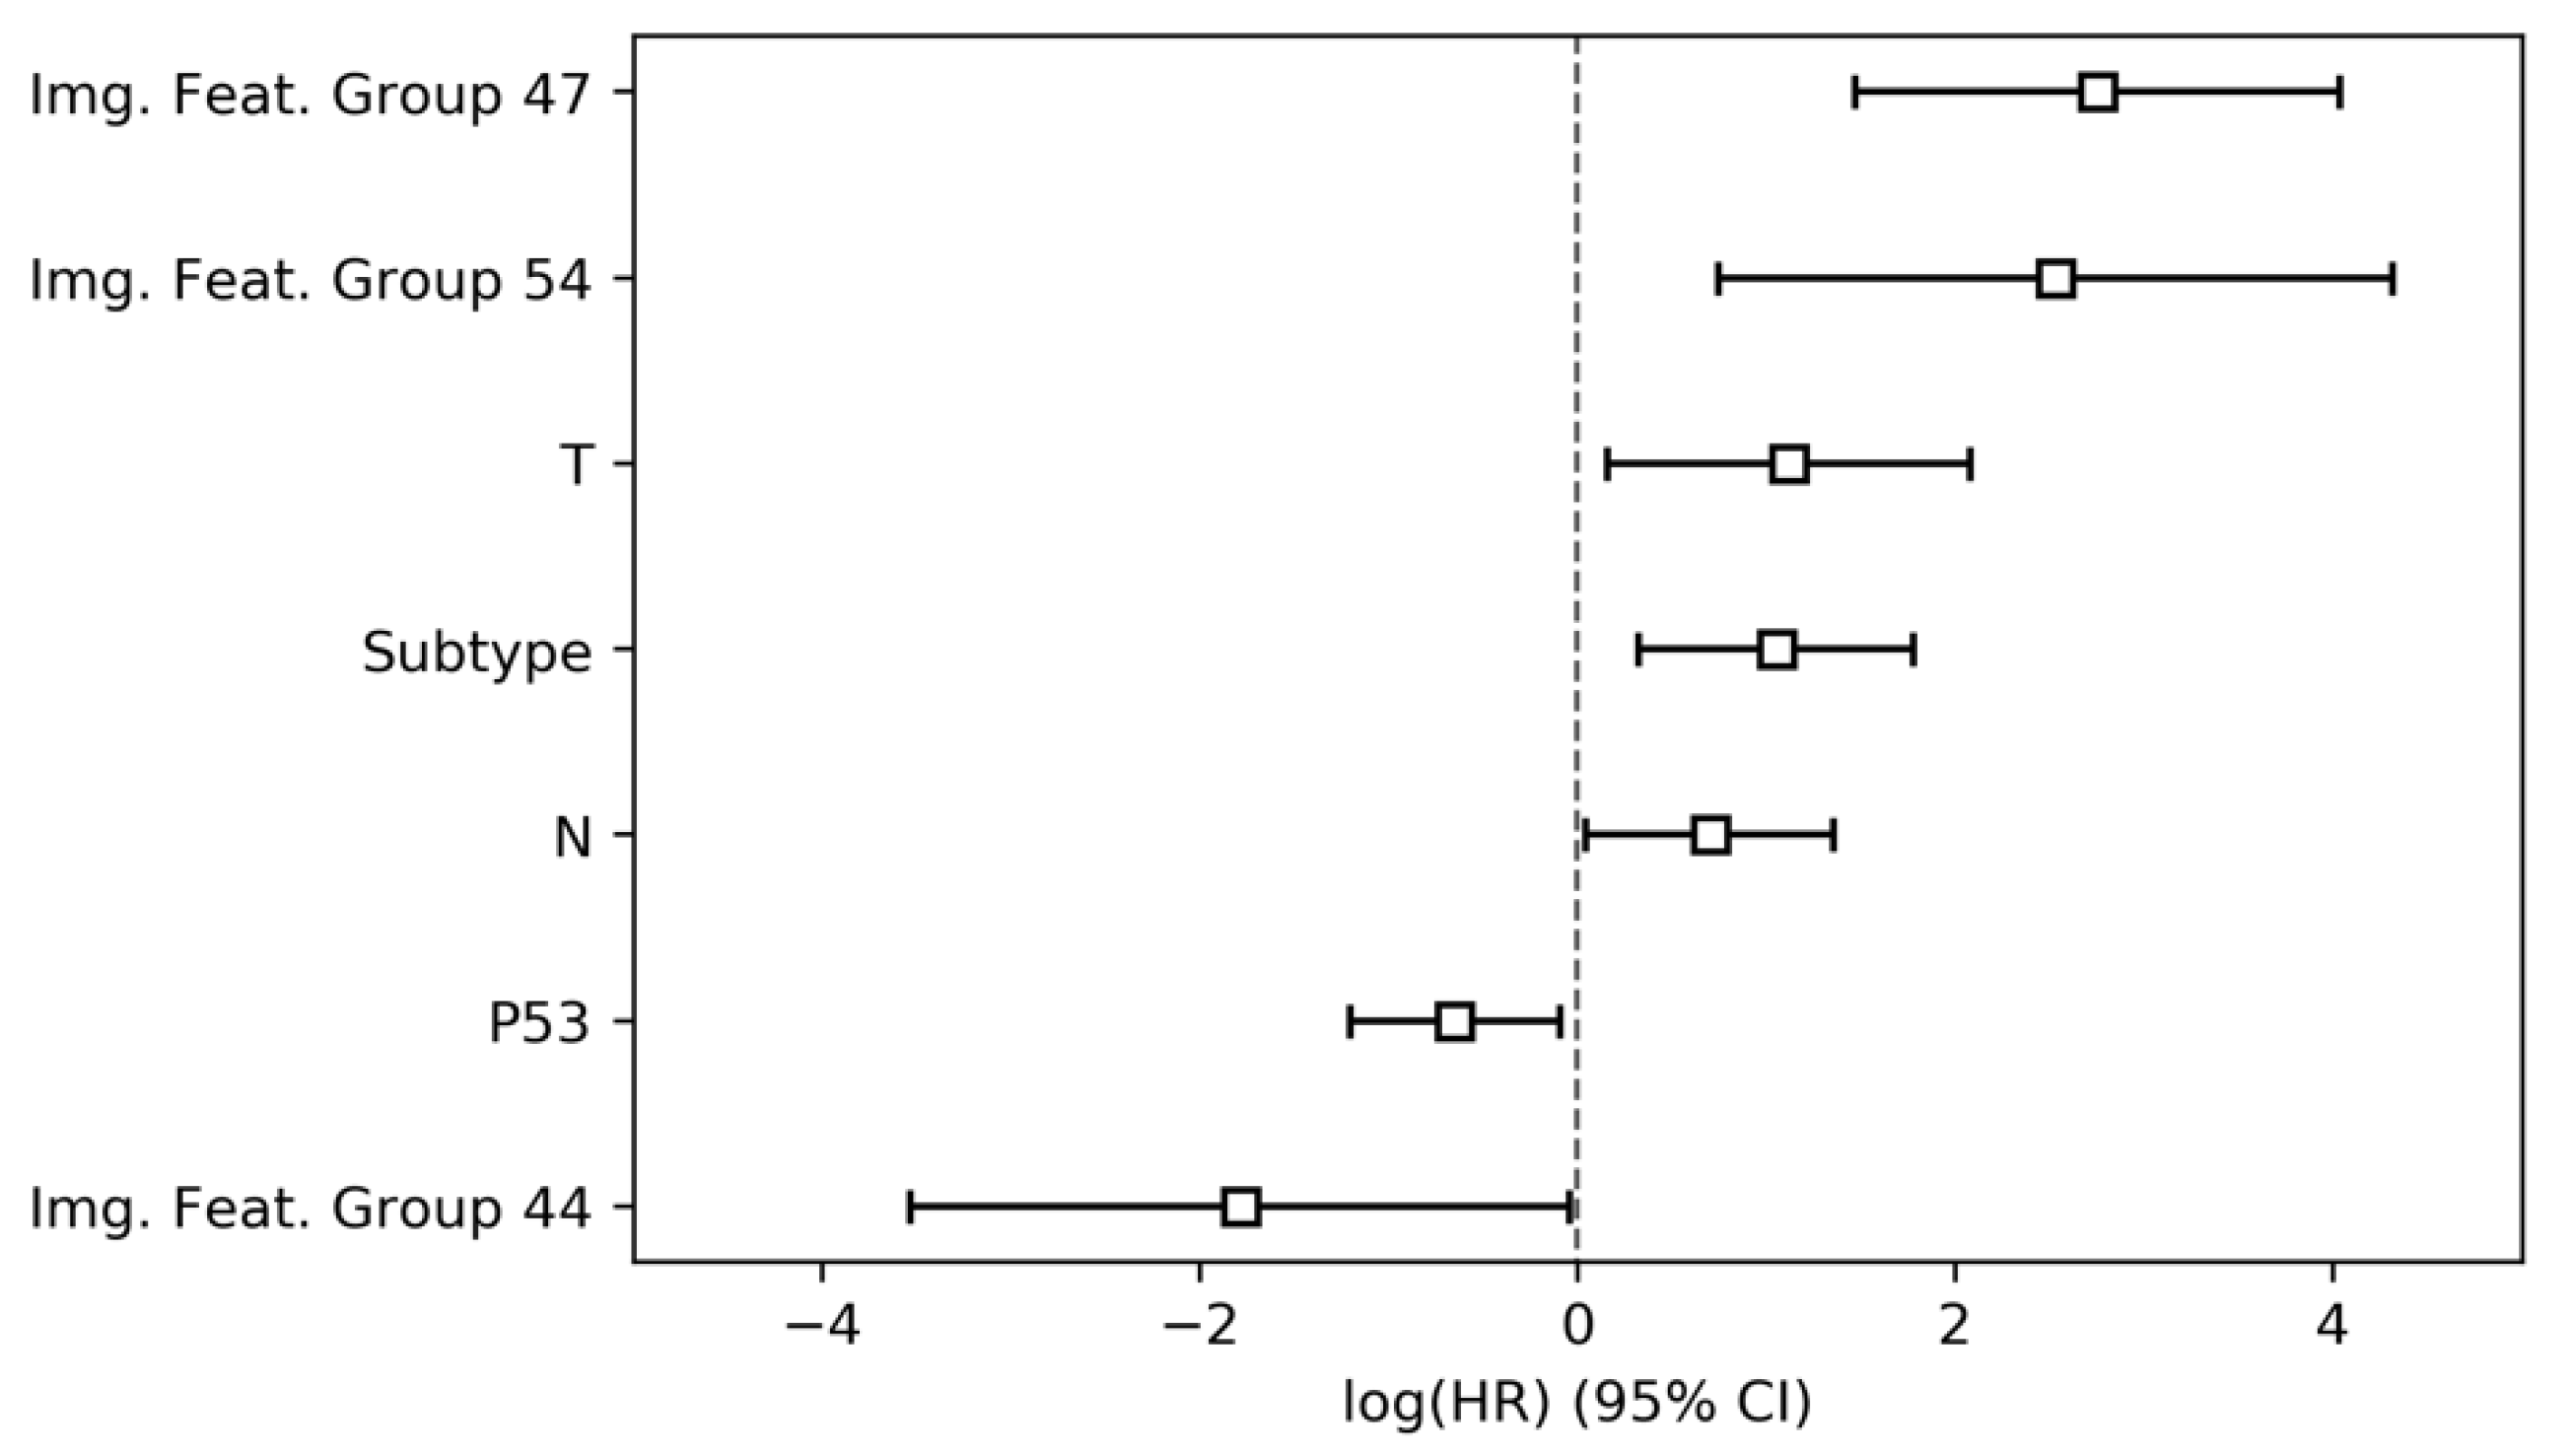
Finally, to assess the predictive performance of the combined feature set and model feature interactions, the features from parameter groups 1 through 3 which were found to obey proportional hazards assumptions were jointly included in a Cox proportional hazards model. In total, seven features, namely three image-derived parameter groups, the tumor subtype, tp53 mutation status, tumor size (pT) and nodal status (pN), were found to significantly and independently predict overall survival (
Table 5,
Figure 4). The final combined model achieved a CI of 0.65 (95% conf. int. 0.60–0.69).
4. Discussion
We here present the results of a comprehensive multiparametric analysis for the prediction of overall patient survival in a group of resected PDAC patients. Our results underscore the potential of image-derived biomarkers compared to both conventional histopathological and novel molecular, morphologic and genetic phenotyping in the context of patient risk stratification in PDAC.
In our previous work, we reported on survival prediction based on imaging biomarkers alone and developed models for the stratification of molecular phenotypes, therapy response and patient survival from computed tomography and diffusion-weighted magnetic resonance images [
12,
13,
21]. Our current work expands on these efforts by including broadly available clinical parameters and unestablished, novel biomarkers in multivariate survival models. Interestingly, both conventional clinical parameters, such as tumor stage, nodal status and adjuvant chemotherapy, and the imaging-derived biomarkers introduced in this study outperform morpho-molecular and genetic parameters alone. We believe this to be an effect of the parameter distribution in this cohort and the overall cohort size. Both previous work and our own multivariate analysis have shown genetic parameters [
20] and molecular tumor subtypes [
8,
19] to significantly predict survival. Furthermore, we believe sampling errors of the histo-morphological and genetic workup to reduce the representativeness of invasive biomarkers, and we thus highlight the necessity for a whole tumor analysis. Despite the fact that imaging-derived biomarkers do not outperform other parameters (0.63 versus 0.65 CI), they are justified due to their non-invasive nature, which applies especially to the palliative and neo-adjuvant settings.
The recent study by Zhang et al. [
17] showed a similar survival model concordance index of around 0.65 on validation data by applying convolutional neural networks (CNN) to CT imaging data. The non-inferiority of our approach compared to the more advanced CNN algorithm might be a result of the limited sample size, a common problem in current imaging studies [
23].
To our knowledge, this is the first study to systematically evaluate a broad range of currently available PDAC risk biomarkers. The sample size studied, and the absence of an external validation cohort, are a limitation of our study but also an immediate consequence of the high financial and personnel cost of the extensive morpho-molecular and genetic workup. Considering the lack of re-imbursement for the detailed tissue analyses presented, biomarkers derived from routine clinical data—including imaging—are a viable option in the setting of limited healthcare resources. Nevertheless, our results should be tested prospectively to ascertain their external validity.
5. Conclusions
In summary, this study presents a further step towards the validation of multi-parametric analyses in the context of clinical patient care. Two conclusions arise from our results: A side-by-side direct comparison of whole tumor tissue and imaging-data derived features will be required to adequately compare the true predictive performance of imaging against morpho-molecular tumor constituents. Furthermore, for multiparametric data integration—as demonstrated in our work—to reach clinical maturity, multi-centric cooperation will be required to attain sufficient sample sizes.
Supplementary Materials
The following are available online at
https://www.mdpi.com/2077-0383/9/5/1250/s1: Table S1: STROBE statement checklist; Figure S1: patient inclusion flowchart; File S1: Image-derived feature extraction details, File S2: PyRadiomics parameter file.
Author Contributions
Conceptualization, G.A.K. and R.F.B.; Data curation, G.A.K., F.J., S.Z., F.K.L., F.N.H., A.M.S., A.M. and K.S.; Formal analysis, G.A.K., F.J. and S.Z.; Funding acquisition, G.A.K., W.W. and R.F.B.; Investigation, G.A.K., F.J., S.Z. and F.K.L.; Methodology, G.A.K., F.J., F.N.H., A.M.S., A.M., K.S., R.S. (Rebekka Schirren) and R.F.B.; Project administration, F.J., R.S. (Rebekka Schirren), H.F., R.S. (Roland Schmid), W.W., M.R.M. and R.F.B.; Resources, A.M.S., A.M., K.S., H.F., R.S. (Roland Schmid), W.W., M.R.M. and R.F.B.; Software, G.A.K., F.J. and S.Z.; Supervision, G.A.K., W.W. and M.R.M.; Validation, R.F.B.; Visualization, F.J. and S.Z.; Writing—original draft, G.A.K., F.J., S.Z. and R.F.B.; Writing—review & editing, G.A.K., F.J. and R.F.B. All authors have read and agreed to the published version of the manuscript.
Funding
R.F.B. and G.A.K. received funding from the German Research Foundation (DFG), SPP 2177/1, “Radiomics”, the German Research Foundation, SFB 824, Project C6 and from the German Cancer Consortium (DKTK), Joint Funding UPGRADE programme. G.A.K. received funding from the Technical University Faculty of Medicine Clinician Scientist Programme. W.W. received funding from the German Research Foundation, SFB 824, Project Z6.
Acknowledgments
Authors wish to thank Arzu Eckert for excellent technical support.
Conflicts of Interest
The authors declare no conflict of interest. The funders had no role in the design of the study; in the collection, analyses, or interpretation of data; in the writing of the manuscript, or in the decision to publish the results.
References
- Siegel, R.L.; Miller, K.D.; Jemal, A. Cancer statistics, 2019. CA Cancer J. Clin. 2019, 69, 7–34. [Google Scholar] [CrossRef] [Green Version]
- SEER Cancer Statistics Review (CSR) 1975-2014. Available online: https://seer.cancer.gov/archive/csr/1975_2014/ (accessed on 23 April 2020).
- Conroy, T.; Hammel, P.; Hebbar, M.; Ben Abdelghani, M.; Wei, A.C.; Raoul, J.L.; Choné, L.; Francois, E.; Artru, P.; Biagi, J.J.; et al. FOLFIRINOX or gemcitabine as adjuvant therapy for pancreatic cancer. N. Engl. J. Med. 2018, 379, 2395–2406. [Google Scholar] [CrossRef]
- Biankin, A.V.; Waddell, N.; Kassahn, K.S.; Gingras, M.C.; Muthuswamy, L.B.; Johns, A.L.; Miller, D.K.; Wilson, P.J.; Patch, A.M.; Wu, J.; et al. Pancreatic cancer genomes reveal aberrations in axon guidance pathway genes. Nature 2012, 491, 399–405. [Google Scholar] [CrossRef]
- Waddell, N.; Pajic, M.; Patch, A.M.; Chang, D.K.; Kassahn, K.S.; Bailey, P.; Johns, A.L.; Miller, D.; Nones, K.; Quek, K.; et al. Whole genomes redefine the mutational landscape of pancreatic cancer. Nature 2015, 518, 495–501. [Google Scholar] [CrossRef] [Green Version]
- Yachida, S.; White, C.M.; Naito, Y.; Zhong, Y.; Brosnan, J.A.; Macgregor-Das, A.M.; Morgan, R.A.; Saunders, T.; Laheru, D.A.; Herman, J.M.; et al. Clinical significance of the genetic landscape of pancreatic cancer and implications for identification of potential long-term survivors. Clin. Cancer Res. 2012, 18, 6339–6347. [Google Scholar] [CrossRef] [Green Version]
- Tascilar, M.; Skinner, H.G.; Rosty, C.; Sohn, T.; Wilentz, R.E.; Offerhaus, G.J.A.; Adsay, V.; Abrams, R.A.; Cameron, J.L.; Kern, S.E.; et al. The SMAD4 protein and prognosis of pancreatic ductal adenocarcinoma. Clin. Cancer Res. 2001, 7, 4115–4121. [Google Scholar] [PubMed]
- Collisson, E.A.; Sadanandam, A.; Olson, P.; Gibb, W.J.; Truitt, M.; Gu, S.; Cooc, J.; Weinkle, J.; Kim, G.E.; Jakkula, L.; et al. Subtypes of pancreatic ductal adenocarcinoma and their differing responses to therapy. Nat. Med. 2011, 17, 500–503. [Google Scholar] [CrossRef] [PubMed]
- Porter, R.L.; Magnus, N.K.; Thapar, V.; Morris, R.; Szabolcs, A.; Neyaz, A.; Kulkarni, A.S.; Tai, E.; Chougule, A.; Hillis, A.; et al. Epithelial to mesenchymal plasticity and differential response to therapies in pancreatic ductal adenocarcinoma. Proc. Natl. Acad. Sci. USA 2019, 116, 26835–26845. [Google Scholar] [CrossRef] [Green Version]
- Aerts, H.J.; Velazquez, E.R.; Leijenaar, R.T.; Parmar, C.; Grossmann, P.; Carvalho, S.; Bussink, J.; Monshouwer, R.; Haibe-Kains, B.; Rietveld, D.; et al. Decoding tumour phenotype by noninvasive imaging using a quantitative radiomics approach. Nat. Commun. 2014, 5, 1–9. [Google Scholar] [CrossRef] [PubMed]
- Mei, D.; Luo, Y.; Wang, Y.; Gong, J. CT texture analysis of lung adenocarcinoma: Can Radiomic features be surrogate biomarkers for EGFR mutation statuses. Cancer Imaging 2018, 18, 1–9. [Google Scholar] [CrossRef] [Green Version]
- Kaissis, G.A.; Ziegelmayer, S.; Lohöfer, F.K.; Harder, F.N.; Jungmann, F.; Sasse, D.; Muckenhuber, A.; Yen, H.Y.; Steiger, K.; Siveke, J.; et al. Image-based molecular Phenotyping of pancreatic ductal adenocarcinoma. J. Clin. Med. 2020, 9, 724. [Google Scholar] [CrossRef] [PubMed] [Green Version]
- Kaissis, G.; Ziegelmayer, S.; Lohöfer, F.; Steiger, K.; Algül, H.; Muckenhuber, A.; Yen, H.Y.; Rummeny, E.; Friess, H.; Schmid, R.; et al. A machine learning algorithm predicts molecular subtypes in pancreatic ductal adenocarcinoma with differential response to gemcitabine-based versus FOLFIRINOX chemotherapy. PLoS ONE 2019, 14, 664540. [Google Scholar] [CrossRef] [PubMed] [Green Version]
- Esteva, A.; Kuprel, B.; Novoa, R.A.; Ko, J.; Swetter, S.M.; Blau, H.M.; Thrun, S. Dermatologist-level classification of skin cancer with deep neural networks. Nature 2017, 542, 115–118. [Google Scholar] [CrossRef] [PubMed]
- Li, H.; Zhu, Y.; Burnside, E.S.; Drukker, K.; Hoadley, K.A.; Fan, C.; Conzen, S.D.; Whitman, G.J.; Sutton, E.J.; Net, J.M.; et al. MR imaging radiomics signatures for predicting the risk of breast cancer recurrence as given by research versions of MammaPrint, oncotype DX, and PAM50 gene assays. Radiology 2016, 281, 382–391. [Google Scholar] [CrossRef] [Green Version]
- Zhu, X.; Dong, D.; Chen, Z.; Fang, M.; Zhang, L.; Song, J.; Yu, D.; Zang, Y.; Liu, Z.; Shi, J.; et al. Radiomic signature as a diagnostic factor for histologic subtype classification of non-small cell lung cancer. Eur. Radiol. 2018, 28, 2772–2778. [Google Scholar] [CrossRef]
- Zhang, Y.; Lobo-Mueller, E.M.; Karanicolas, P.; Gallinger, S.; Haider, M.A.; Khalvati, F. CNN-based survival model for pancreatic ductal adenocarcinoma in medical imaging. BMC Med. Imaging 2020, 20, 1–8. [Google Scholar] [CrossRef]
- Von Elm, E.; Altman, D.G.; Egger, M.; Pocock, S.J.; Gøtzsche, P.C.; Vandenbroucke, J.P. The strengthening the reporting of observational studies in epidemiology (strobe) statement: Guidelines for reporting observational studies. Ann. Intern. Med. 2007, 147, 573–577. [Google Scholar] [CrossRef] [Green Version]
- Muckenhuber, A.; Berger, A.K.; Schlitter, A.M.; Steiger, K.; Konukiewitz, B.; Trumpp, A.; Eils, R.; Werner, J.; Friess, H.; Esposito, I.; et al. Pancreatic ductal adenocarcinoma subtyping using the biomarkers hepatocyte nuclear factor-1A and cytokeratin-81 correlates with outcome and treatment response. Clin. Cancer Res. 2018, 24, 351–359. [Google Scholar] [CrossRef] [Green Version]
- Schlitter, A.M.; Segler, A.; Steiger, K.; Michalski, C.W.; Jäger, C.; Konukiewitz, B.; Pfarr, N.; Endris, V.; Bettstetter, M.; Kong, B.; et al. Molecular, morphological and survival analysis of 177 resected pancreatic ductal adenocarcinomas (PDACs): Identification of prognostic subtypes. Sci. Rep. 2017, 7, 1–12. [Google Scholar] [CrossRef] [Green Version]
- Kaissis, G.; Ziegelmayer, S.; Lohöfer, F.; Algül, H.; Eiber, M.; Weichert, W.; Schmid, R.; Friess, H.; Rummeny, E.; Ankerst, D.; et al. A machine learning model for the prediction of survival and tumor subtype in pancreatic ductal adenocarcinoma from preoperative diffusion-weighted imaging. Eur. Radiol. Exp. 2019, 3, 1–9. [Google Scholar] [CrossRef] [Green Version]
- Van Griethuysen, J.J.; Fedorov, A.; Parmar, C.; Hosny, A.; Aucoin, N.; Narayan, V.; Beets-Tan, R.G.; Fillion-Robin, J.C.; Pieper, S.; Aerts, H.J. Computational radiomics system to decode the radiographic phenotype. Cancer Res. 2017, 77, 104–107. [Google Scholar] [CrossRef] [PubMed] [Green Version]
- Alwosheel, A.; van Cranenburgh, S.; Chorus, C.G. Is your dataset big enough? Sample size requirements when using artificial neural networks for discrete choice analysis. J. Choice Model. 2018, 28, 167–182. [Google Scholar] [CrossRef]
© 2020 by the authors. Licensee MDPI, Basel, Switzerland. This article is an open access article distributed under the terms and conditions of the Creative Commons Attribution (CC BY) license (http://creativecommons.org/licenses/by/4.0/).

 ,
, 


