Inter- and Intrarater Agreement of Spot Sign and Noncontrast CT Markers for Early Intracerebral Hemorrhage Expansion

 , , ,
, , ,
Abstract
:1. Introduction
2. Materials and Methods
2.1. Study Population
2.2. Image Acquisitions
2.3. Image Analysis
2.4. Statistical Analysis
3. Results
4. Discussion
Author Contributions
Funding
Acknowledgments
Conflicts of Interest
References
- Sporns, P.B.; Kemmling, A.; Schwake, M.; Minnerup, J.; Nawabi, J.; Broocks, G.; Wildgruber, M.; Fiehler, J.; Heindel, W.; Hanning, U. Triage of 5 Noncontrast Computed Tomography Markers and Spot Sign for Outcome Prediction After Intracerebral Hemorrhage. Stroke 2018, 49, 2317–2322. [Google Scholar] [CrossRef] [PubMed]
- Drury, I.; Whisnant, J.P.; Garraway, W.M. Primary intracerebral hemorrhage: Impact of CT on incidence. Neurology 1984, 34, 653–657. [Google Scholar] [CrossRef] [PubMed]
- Jakubovic, R.; Aviv, R.I. Intracerebral hemorrhage: Toward physiological imaging of hemorrhage risk in acute and chronic bleeding. Front. Neurol. 2012, 3, 86. [Google Scholar] [CrossRef] [PubMed] [Green Version]
- Broderick, J.P.; Brott, T.; Duldner, J.E.; Tomsick, T.; Huster, G. Volume of intracerebral hemorrhage. A powerful and easy-to-use predictor of 30-day mortality. Stroke 1993, 24, 987–993. [Google Scholar] [CrossRef] [PubMed] [Green Version]
- Mayer, S.A.; Sacco, R.L.; Shi, T.; Mohr, J. Neurologic deterioration in noncomatose patients with supratentorial intracerebral hemorrhage. Neurology 1994, 44, 1379–1384. [Google Scholar] [CrossRef] [PubMed]
- Morotti, A.; Boulouis, G.; Dowlatshahi, D.; Li, Q.; Barras, C.D.; Delcourt, C.; Yu, Z.; Zheng, J.; Zhou, Z.; Aviv, R.I.; et al. Standards for Detecting, Interpreting, and Reporting Noncontrast Computed Tomographic Markers of Intracerebral Hemorrhage Expansion. Ann. Neurol. 2019, 86, 480–492. [Google Scholar] [CrossRef]
- Brott, T.; Broderick, J.; Kothari, R.; Barsan, W.; Tomsick, T.; Sauerbeck, L.; Spilker, J.; Duldner, J.; Khoury, J. Early Hemorrhage Growth in Patients with Intracerebral Hemorrhage. Stroke 1997, 28, 1–5. [Google Scholar] [CrossRef]
- Chen, S.; Zhao, B.; Wang, W.; Shi, L.; Reis, C.; Zhang, J. Predictors of hematoma expansion predictors after intracerebral hemorrhage. Oncotarget 2017, 8, 89348–89363. [Google Scholar] [CrossRef] [Green Version]
- Steiner, T.; Bösel, J. Options to Restrict Hematoma Expansion after Spontaneous Intracerebral Hemorrhage. Stroke 2010, 41, 402–409. [Google Scholar] [CrossRef] [Green Version]
- Steiner, T.; Salman, R.A.-S.; Beer, R.; Christensen, H.; Cordonnier, C.; Csiba, L.; Forsting, M.; Harnof, S.; Klijn, C.; Krieger, D.; et al. European Stroke Organisation (ESO) Guidelines for the Management of Spontaneous Intracerebral Hemorrhage. Int. J. Stroke 2014, 9, 840–855. [Google Scholar] [CrossRef]
- Li, Q.; Zhang, G.; Huang, Y.-J.; Dong, M.-X.; Lv, F.-J.; Wei, X.; Chen, J.-J.; Zhang, L.-J.; Qin, X.; Xie, P. Blend Sign on Computed Tomography. Stroke 2015, 46, 2119–2123. [Google Scholar] [CrossRef] [PubMed]
- Li, Q.; Zhang, G.; Xiong, X.; Wang, X.-C.; Yang, W.-S.; Li, K.-W.; Wei, X.; Xie, P. Black Hole Sign. Stroke 2016, 47, 1777–1781. [Google Scholar] [CrossRef] [PubMed] [Green Version]
- Xiong, X.; Li, Q.; Yang, W.-S.; Wei, X.; Hu, X.; Wang, X.-C.; Zhu, D.; Li, R.; Cao, D.; Xie, P. Comparison of Swirl Sign and Black Hole Sign in Predicting Early Hematoma Growth in Patients with Spontaneous Intracerebral Hemorrhage. Med. Sci. Monit. 2018, 24, 567–573. [Google Scholar] [CrossRef] [Green Version]
- Li, Q.; Liu, Q.-J.; Yang, W.-S.; Wang, X.-C.; Zhao, L.-B.; Xiong, X.; Li, R.; Cao, D.; Zhu, D.; Wei, X.; et al. Island Sign. Stroke 2017, 48, 3019–3025. [Google Scholar] [CrossRef] [PubMed]
- Morotti, A.; Dowlatshahi, D.; Boulouis, G.; Al-Ajlan, F.; Demchuk, A.M.; Aviv, R.I.; Yu, L.; Schwab, K.; Romero, J.M.; Gurol, M.E.; et al. Predicting Intracerebral Hemorrhage Expansion With Noncontrast Computed Tomography: The BAT Score. Stroke 2018, 49, 1163–1169. [Google Scholar] [CrossRef] [PubMed]
- Huynh, T.J.; Demchuk, A.M.; Dowlatshahi, D.; Gladstone, D.; Krischek, Ö.; Kiss, A.; Hill, M.D.; Molina, C.A.; Rodriguez-Luna, D.; Dzialowski, I.; et al. Spot Sign Number Is the Most Important Spot Sign Characteristic for Predicting Hematoma Expansion Using First-Pass Computed Tomography Angiography: Analysis From the PREDICT Study. Stroke 2013, 44, 972–977. [Google Scholar] [CrossRef] [Green Version]
- Brouwers, H.B.; Goldstein, J.N.; Romero, J.M.; Rosand, J. Clinical applications of the computed tomography angiography spot sign in acute intracerebral hemorrhage: A review. Stroke 2012, 43, 3427–3432. [Google Scholar] [CrossRef] [Green Version]
- Brady, A.; Laoide, R.Ó.; McCarthy, P.; McDermott, R. Discrepancy and Error in Radiology: Concepts, Causes and Consequences. Ulst. Med. J. 2012, 81, 3–9. [Google Scholar]
- Dowlatshahi, D.; Morotti, A.; Al-Ajlan, F.S.; Boulouis, G.; Warren, A.D.; Petrcich, W.; Aviv, R.I.; Demchuk, A.M.; Goldstein, J.N. Interrater and Intrarater Measurement Reliability of Noncontrast Computed Tomography Predictors of Intracerebral Hemorrhage Expansion. Stroke 2019, 50, 1260–1262. [Google Scholar] [CrossRef]
- Wada, R.; Aviv, R.; Fox, A.J.; Sahlas, D.J.; Gladstone, D.; Tomlinson, G.; Symons, S.P. CT Angiography “Spot Sign” Predicts Hematoma Expansion in Acute Intracerebral Hemorrhage. Stroke 2007, 38, 1257–1262. [Google Scholar] [CrossRef] [Green Version]
- Sporns, P.B.; Schwake, M.; Kemmling, A.; Minnerup, J.; Schwindt, W.; Niederstadt, T.; Schmidt, R.; Hanning, U. Comparison of Spot Sign, Blend Sign and Black Hole Sign for Outcome Prediction in Patients with Intracerebral Hemorrhage. J. Stroke 2017, 19, 333–339. [Google Scholar] [CrossRef] [PubMed] [Green Version]
- Boulouis, G.; Morotti, A.; Brouwers, H.B.; Charidimou, A.; Jessel, M.J.; Auriel, E.; Pontes-Neto, O.; Ayres, A.; Vashkevich, A.; Schwab, K.M.; et al. Association Between Hypodensities Detected by Computed Tomography and Hematoma Expansion in Patients With Intracerebral Hemorrhage. JAMA Neurol. 2016, 73, 961–968. [Google Scholar] [CrossRef] [PubMed]
- Du, F.-Z.; Jiang, R.; Gu, M.; He, C.; Guan, J. The Accuracy of Spot Sign in Predicting Hematoma Expansion after Intracerebral Hemorrhage: A Systematic Review and Meta-Analysis. PLoS ONE 2014, 9, e115777. [Google Scholar] [CrossRef] [PubMed]
- Sporns, P.B.; Schwake, M.; Schmidt, R.; Kemmling, A.; Minnerup, J.; Schwindt, W.; Cnyrim, C.; Zoubi, T.; Heindel, W.; Niederstadt, T.; et al. Computed Tomographic Blend Sign Is Associated With Computed Tomographic Angiography Spot Sign and Predicts Secondary Neurological Deterioration After Intracerebral Hemorrhage. Stroke 2017, 48, 131–135. [Google Scholar] [CrossRef] [PubMed]
- McHugh, M.L. Interrater reliability: The kappa statistic. Biochem. Med. 2012, 22, 276–282. [Google Scholar] [CrossRef]
- Rangaraju, S.; Haussen, D.C.; Nogueira, R.G.; Nahab, F.; Frankel, M. Comparison of 3-Month Stroke Disability and Quality of Life across Modified Rankin Scale Categories. Interv. Neurol. 2016, 6, 36–41. [Google Scholar] [CrossRef] [PubMed] [Green Version]
- Salman, R.A.-S.; Frantzias, J.; Lee, R.J.; Lyden, P.D.; Battey, T.W.K.; Ayres, A.M.; Goldstein, J.N.; Mayer, S.A.; Steiner, T.; Wang, X.; et al. Absolute risk and predictors of the growth of acute spontaneous intracerebral haemorrhage: A systematic review and meta-analysis of individual patient data. Lancet Neurol. 2018, 17, 885–894. [Google Scholar] [CrossRef] [Green Version]
- Kim, J.Y.; Bae, H.-J. Spontaneous Intracerebral Hemorrhage: Management. J. Stroke 2017, 19, 28–39. [Google Scholar] [CrossRef] [Green Version]
- Liu, J.; Xu, H.; Chen, Q.; Zhang, T.; Sheng, W.; Huang, Q.; Song, J.; Huang, D.; Lan, L.; Li, Y.; et al. Prediction of hematoma expansion in spontaneous intracerebral hemorrhage using support vector machine. EBioMedicine 2019, 43, 454–459. [Google Scholar] [CrossRef] [Green Version]


| Baseline Clinical and Imaging Characteristics | All (n= 473) |
|---|---|
| Clinical Characteristics | |
| Age at admission [years], median (IQR) | 69.25 (67.9–70.6) |
| Female, n (%) | 252 (53.3) |
| Hypertension, n (%) | 326 (69.1) |
| Diabetes mellitus, n (%) | 65 (13.8) |
| Imaging Characteristics | |
| Bleeding location, n (%) | |
| • Deep | 206 (43.6) |
| • Lobar | 210 (44.4) |
| • Brain Stem, Pons | 17 (3.6) |
| • Cerebellum | 40 (8.5) |
| Intraventricular hemorrhage, n (%) | 248 (52.5) |
| Surgery procedures | |
| Supratentorial Craniectomy, n (%) | 110 (23.3) |
| Infratentorial Craniectomy, n (%) | 5 (1.1) |
| Clinical outcome, n (%) | |
| mRS ≤ 3 | 147 (31.1) |
| mRS > 3 | 326 (68.9) |
| Imaging Signs for ICH Expansion | Presence | mRS [median] | mRS > 3 [%] |
|---|---|---|---|
| All NCCT Signs and Spot Sign on CTA | no | 3.3 | 47% |
| yes | 4.8 | 85% | |
| Black Hole Sign | no | 3.8 | 59% |
| yes | 5.4 | 95% | |
| Blend Sign | no | 4.1 | 65% |
| yes | 4.9 | 92% | |
| Hypodensities | no | 4.1 | 65% |
| yes | 4.5 | 77% | |
| Island Sign | no | 3.9 | 61% |
| yes | 5.2 | 92% | |
| Spot Sign | no | 4.1 | 65% |
| yes | 5.1 | 95% |
| Number of Imaging Signs | Number of Patients | mRS [median] | mRS > 3 [%] | Black Hole | Blend Sign | Island Sign | Hypodensities | Spot Sign |
|---|---|---|---|---|---|---|---|---|
| 0 | 185 | 3 | 45% | 0% | 0% | 0% | 0% | 0% |
| 1 | 129 | 4 | 74% | 27% | 15% | 11% | 39% | 9% |
| 2 | 92 | 5 | 89% | 51% | 20% | 63% | 51% | 15% |
| 3 | 42 | 6 | 98% | 62% | 40% | 79% | 74% | 45% |
| 4 | 15 | 5 | 87% | 67% | 87% | 73% | 100% | 73% |
| 5 | 10 | 5 | 100% | 100% | 100% | 100% | 100% | 100% |
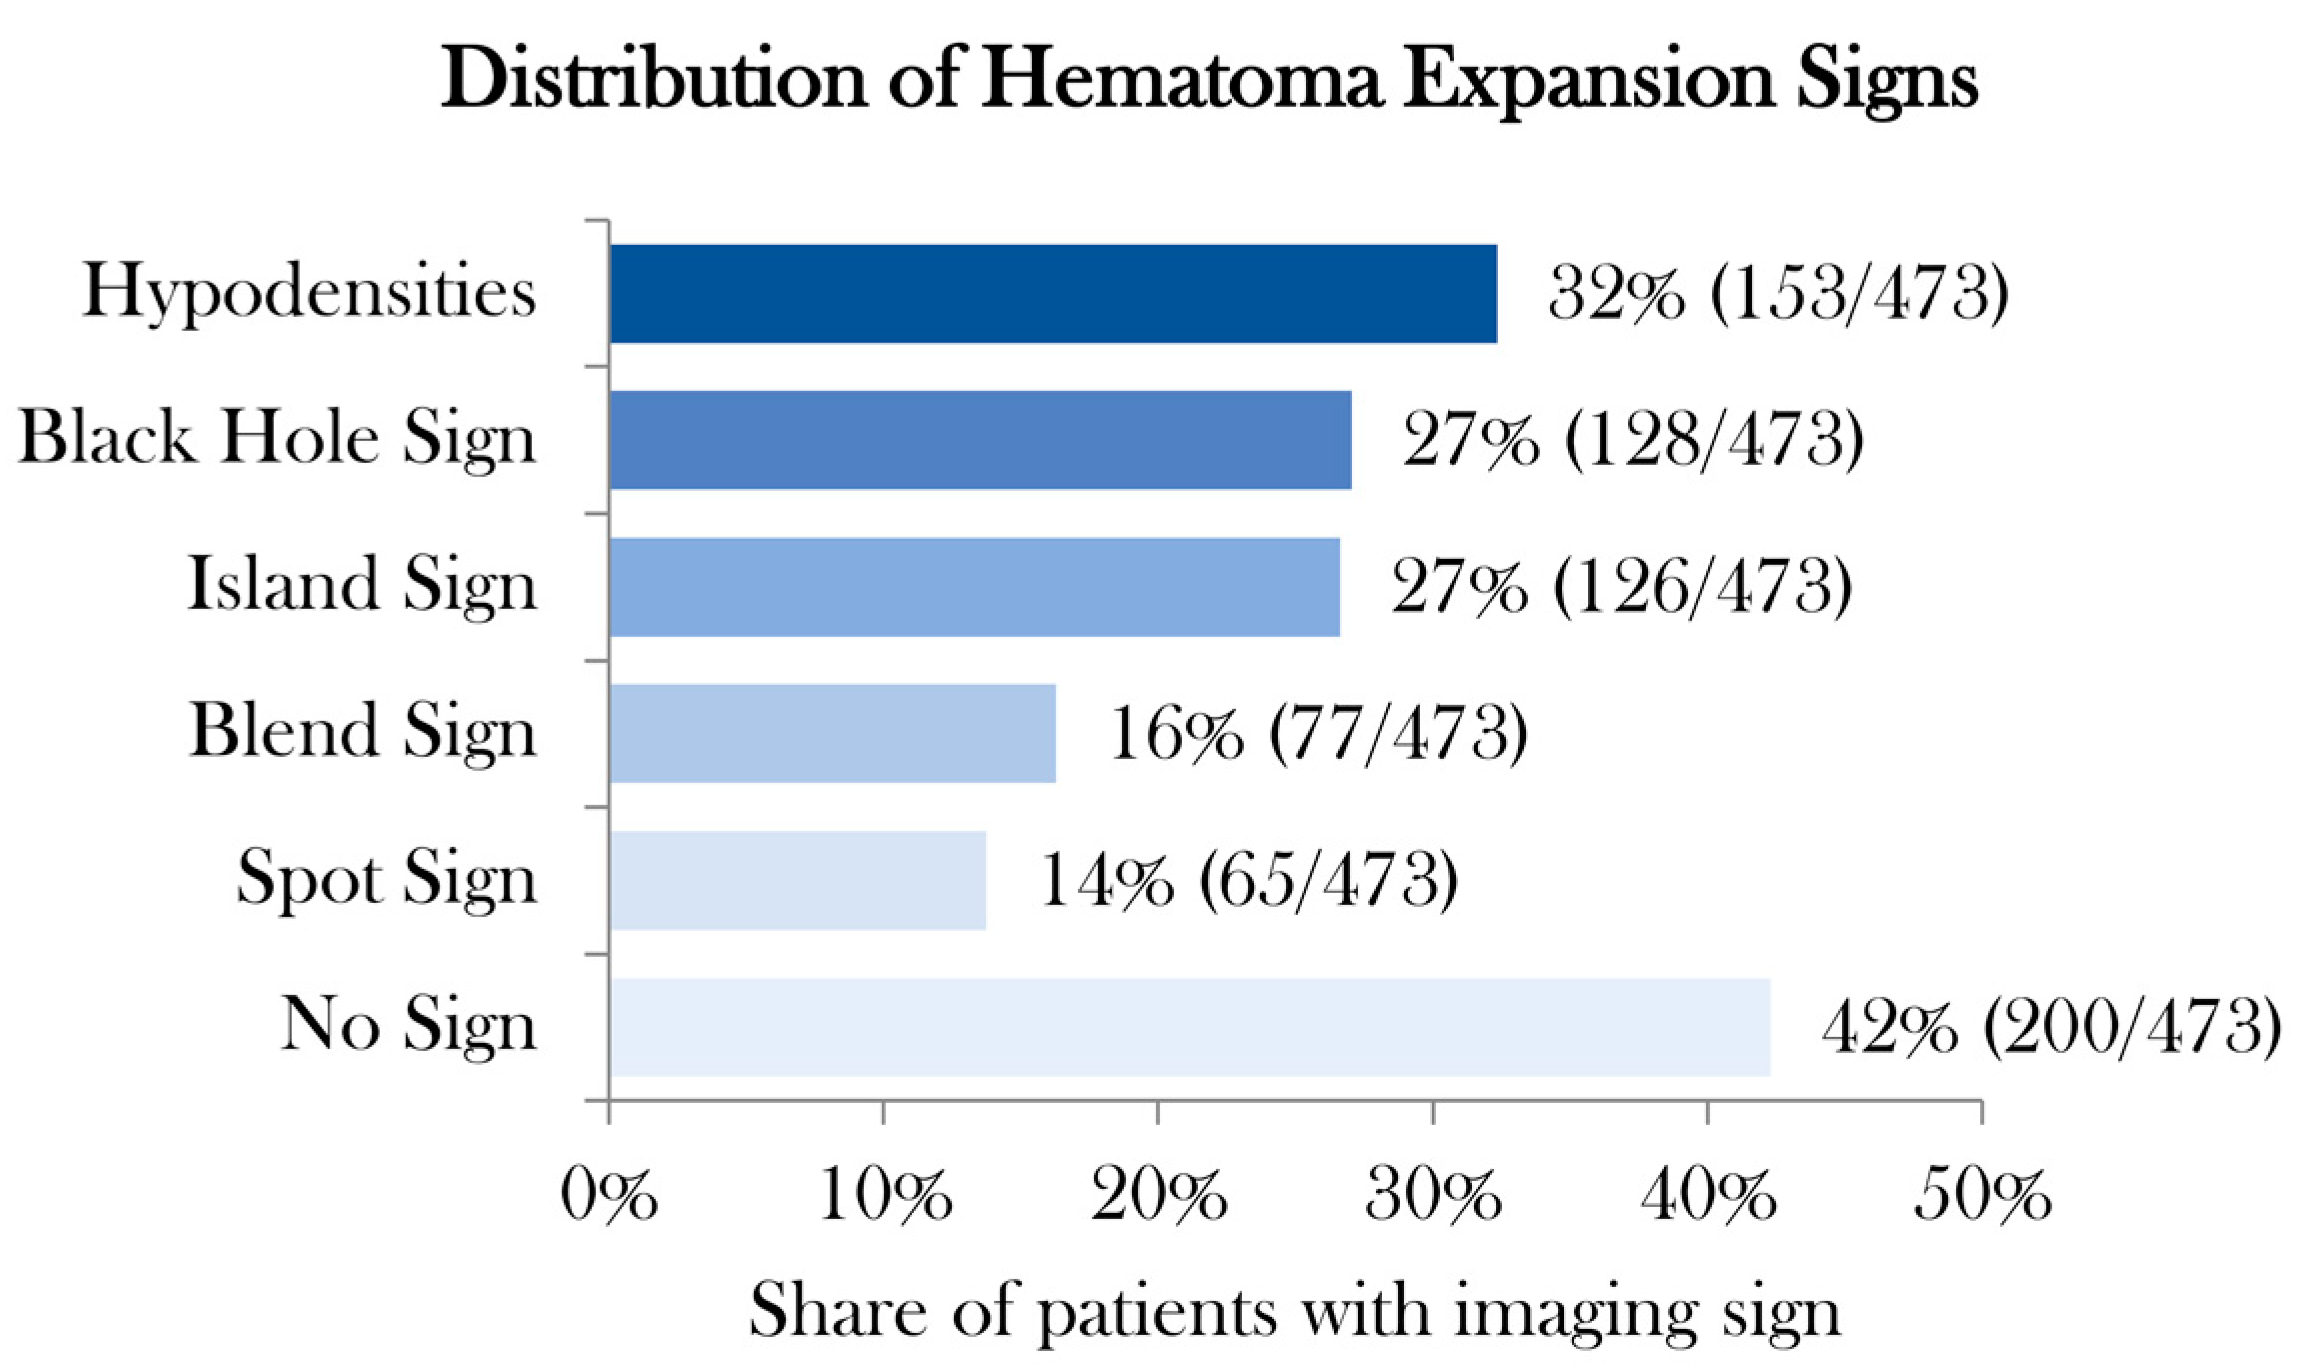
| Total | 473 | 4 | 69% | 27% | 16% | 27% | 32% | 14% |
| Rater 1 | Rater 2 | Level Agreement | Cohen’s kappa * | 95% Lower CI | 95% Upper CI | z-Statistic | p-Value |
|---|---|---|---|---|---|---|---|
| 1st Rating | |||||||
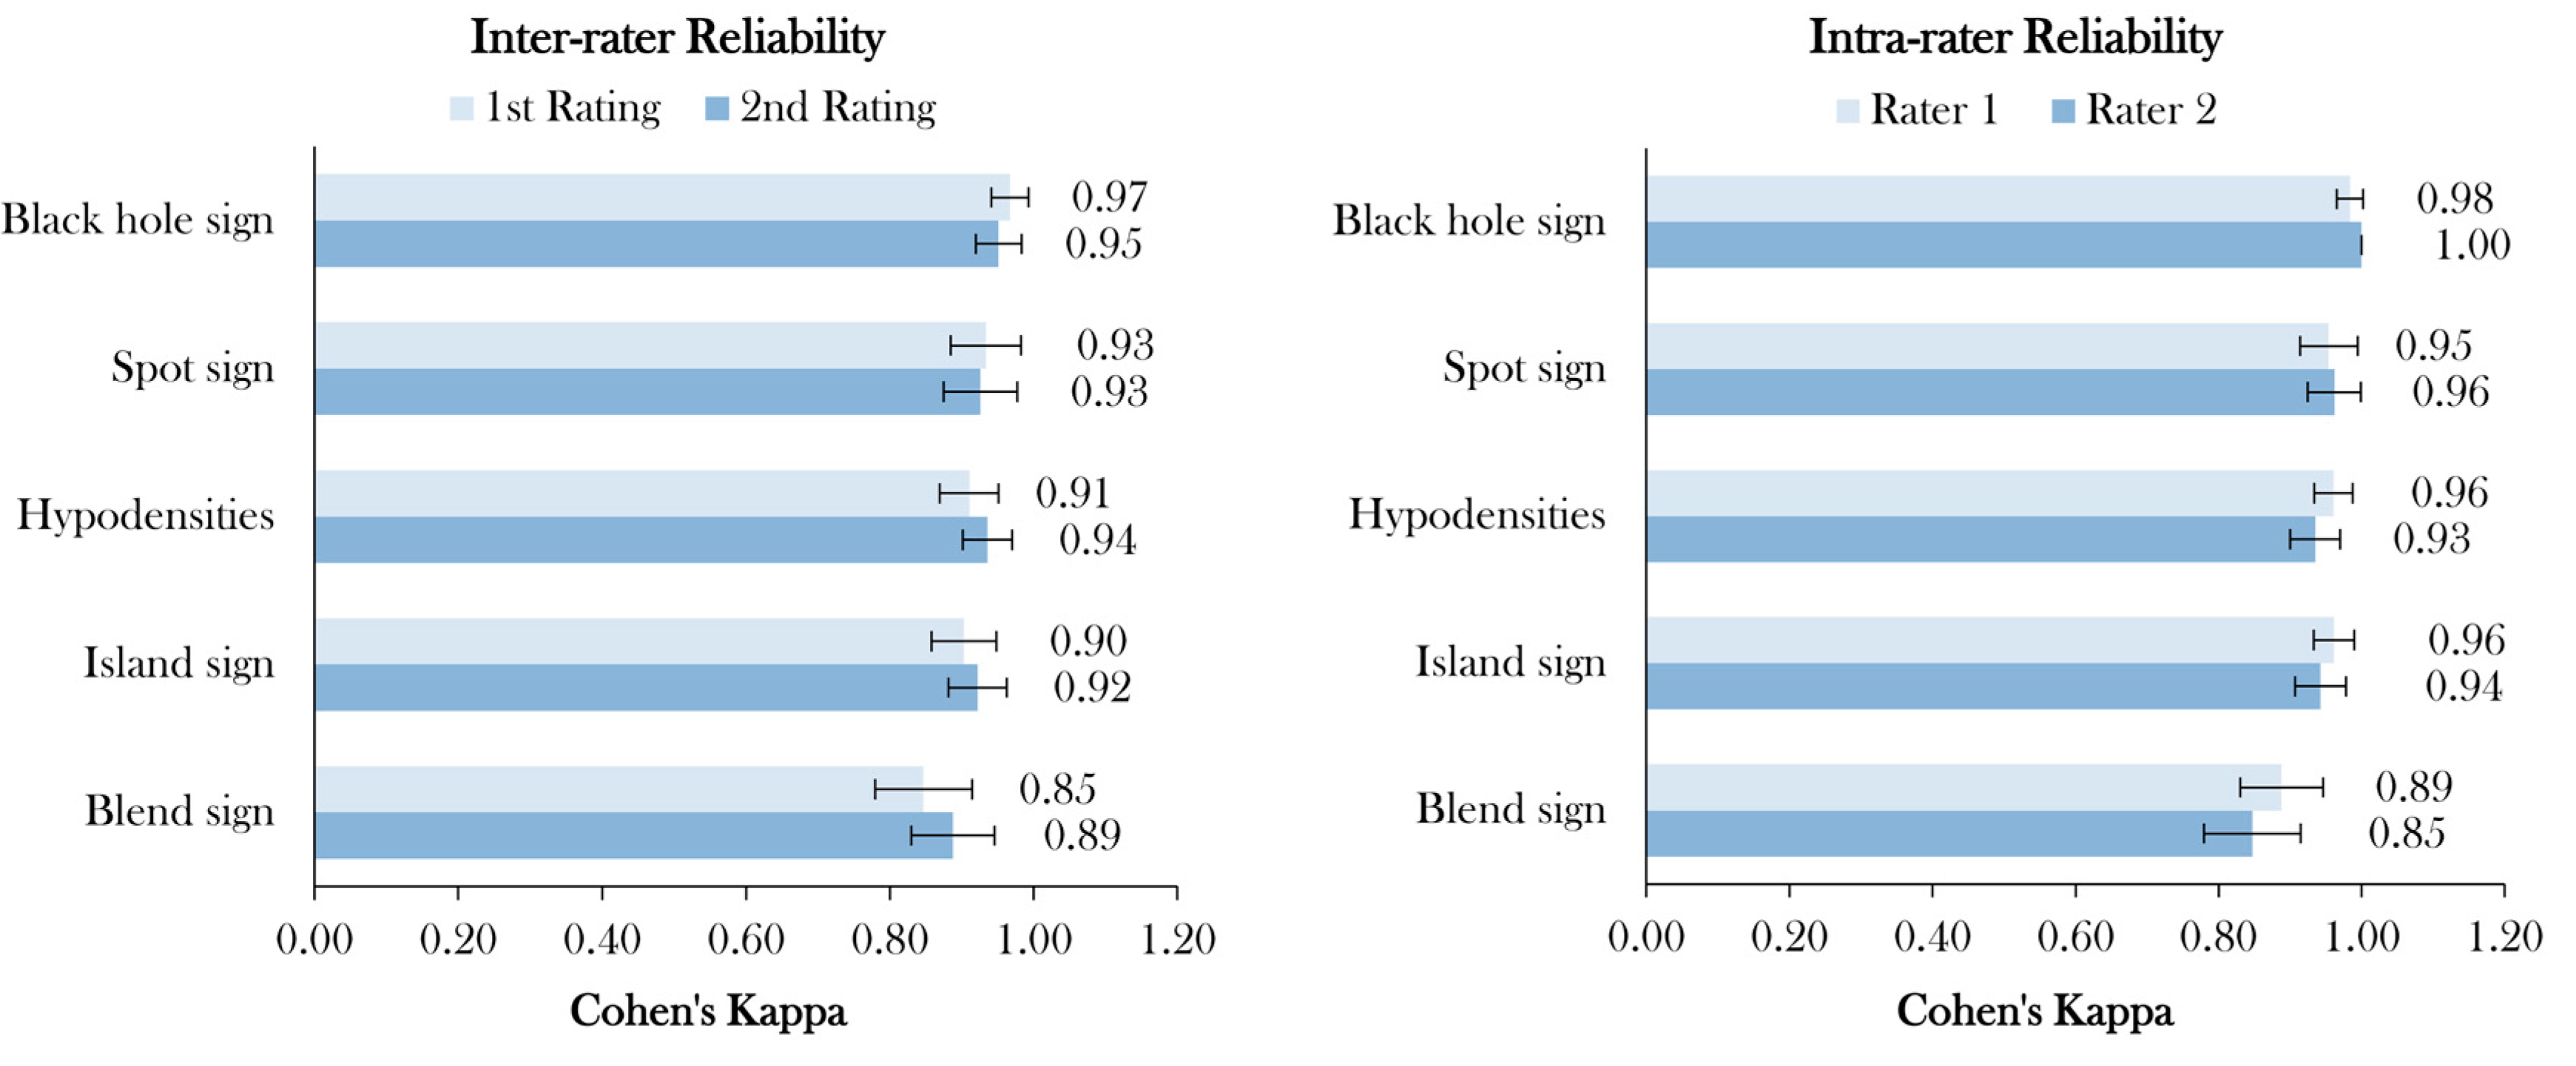
| Black Hole | Black Hole | 98.7% | 0.97 | 0.94 | 0.99 | 21.0 | <0.001 |
| Spot Sign | Spot Sign | 98.5% | 0.93 | 0.88 | 0.98 | 20.3 | <0.001 |
| Hypodensities | Hypodensities | 96.2% | 0.91 | 0.87 | 0.95 | 19.8 | <0.001 |
| Island Sign | Island Sign | 96.4% | 0.90 | 0.86 | 0.95 | 19.7 | <0.001 |
| Blend Sign | Blend Sign | 96.0% | 0.85 | 0.78 | 0.91 | 18.4 | <0.001 |
| 2nd Rating | |||||||
| Black Hole | Black Hole | 98.1% | 0.95 | 0.92 | 0.98 | 20.7 | <0.001 |
| Spot Sign | Spot Sign | 98.3% | 0.93 | 0.87 | 0.98 | 20.2 | <0.001 |
| Hypodensities | Hypodensities | 97.3% | 0.94 | 0.90 | 0.97 | 20.4 | <0.001 |
| Island Sign | Island Sign | 97.0% | 0.92 | 0.88 | 0.96 | 20.1 | <0.001 |
| Blend Sign | Blend Sign | 97.0% | 0.89 | 0.83 | 0.95 | 19.3 | <0.001 |
| 1st Rating | 2nd Rating | Level of Agreement | Cohen’s kappa * | 95% Lower CI | 95% Upper CI | z-Statistic | p-Value |
|---|---|---|---|---|---|---|---|
| Rater 1 | |||||||
| Black Hole | Black Hole | 100% | 1.00 | 1.00 | 1.00 | 21.75 | <0.001 |
| Island Sign | Island Sign | 97.9% | 0.94 | 0.91 | 0.98 | 20.50 | <0.001 |
| Hypodensities | Hypodensities | 97.3% | 0.93 | 0.90 | 0.97 | 20.34 | <0.001 |
| Spot Sign | Spot Sign | 99.2% | 0.96 | 0.92 | 1.00 | 20.92 | <0.001 |
| Blend Sign | Blend Sign | 96.0% | 0.85 | 0.78 | 0.91 | 18.44 | <0.001 |
| Rater 2 | |||||||
| Black Hole | Black Hole | 99.4% | 0.98 | 0.97 | 1.00 | 21.40 | <0.001 |
| Island Sign | Island Sign | 98.5% | 0.96 | 0.93 | 0.99 | 20.93 | <0.001 |
| Hypodensities | Hypodensities | 98.3% | 0.96 | 0.93 | 0.99 | 20.91 | <0.001 |
| Spot Sign | Spot Sign | 98.9% | 0.95 | 0.91 | 0.99 | 20.77 | <0.001 |
| Blend Sign | Blend Sign | 97.0% | 0.89 | 0.83 | 0.95 | 19.33 | <0.001 |
© 2020 by the authors. Licensee MDPI, Basel, Switzerland. This article is an open access article distributed under the terms and conditions of the Creative Commons Attribution (CC BY) license (http://creativecommons.org/licenses/by/4.0/).
Share and Cite
Nawabi, J.; Elsayed, S.; Kniep, H.; Sporns, P.; Schlunk, F.; McDonough, R.; Broocks, G.; Dührsen, L.; Schön, G.; Götz, T.; et al. Inter- and Intrarater Agreement of Spot Sign and Noncontrast CT Markers for Early Intracerebral Hemorrhage Expansion. J. Clin. Med. 2020, 9, 1020. https://doi.org/10.3390/jcm9041020
Nawabi J, Elsayed S, Kniep H, Sporns P, Schlunk F, McDonough R, Broocks G, Dührsen L, Schön G, Götz T, et al. Inter- and Intrarater Agreement of Spot Sign and Noncontrast CT Markers for Early Intracerebral Hemorrhage Expansion. Journal of Clinical Medicine. 2020; 9(4):1020. https://doi.org/10.3390/jcm9041020
Chicago/Turabian StyleNawabi, Jawed, Sarah Elsayed, Helge Kniep, Peter Sporns, Frieder Schlunk, Rosalie McDonough, Gabriel Broocks, Lasse Dührsen, Gerhard Schön, Thomalla Götz, and et al. 2020. "Inter- and Intrarater Agreement of Spot Sign and Noncontrast CT Markers for Early Intracerebral Hemorrhage Expansion" Journal of Clinical Medicine 9, no. 4: 1020. https://doi.org/10.3390/jcm9041020