New & Highlights
What is known about this topic?
Acute kidney injury (AKI) is a common complication following Transcatheter Aortic Valve Replacement (TAVR)
AKI occurs in a sizeable proportion of TAVR patients (22.1% ± 11.2 according to the VARC-2 definition) and carries poor prognosis
Intrarenal Doppler ultrasonography can assess intrarenal hemodynamic
Doppler based renal resistive index (RRI) measurements is a rapid and non-invasive method proposed for early AKI detection
What does the paper add?
24 h post-TAVR evaluation by Doppler-based resistive index is associated with AKI occurrence up to day 3
Doppler based renal resistive index is an easy, objective, reliable and low-cost tool that succeeded to identify an at-risk population for AKI and able to improve the post TAVR management
This study clarifies the characteristics of intrarenal Doppler RRI profiles and their interactions with systemic hemodynamic in TAVR patients
1. Introduction
Acute kidney injury (AKI) is a common complication following transcatheter aortic valve replacement (TAVR) and remains associated with a dismal prognosis. Based on the current Valve Academic Research Consortium (VARC)-2 definition [
1], the reported incidence of post TAVR AKI is 22.1% ± 11.2 [
2]. Depicting the scope of AKI in the field of TAVR relies on a variety of factors from impaired baseline renal function, hemodynamic instability during pacing, and use of contrast medium, to post procedural complications such as bleeding. Given that TAVR is expected to be increasingly performed, screening high-risk patients for AKI is of paramount importance since easy, accessible, and preventive measures, such as optimal periprocedural hydration and careful contrast use, are available. As AKI after TAVR is common and both transient and persistent AKI have been independently associated with higher mortality rates [
3,
4]. Thus, the prediction of AKI after TAVR and AKI prevention are key approaches in current practice.
Intrarenal Doppler ultrasonography is a well-recognized and non-invasive method aimed to better assess intrarenal hemodynamic. Renal Doppler ultrasound (RDU) can easily measure the renal resistive index (RRI), a sonographic index reflecting renal arterial blood flow profile, arterial stiffness, sensitivity to arterial resistance, and capacitance changes. Elevated RRI has been associated to adverse outcomes in hypertensive, diabetic, and elderly patients [
5,
6,
7,
8], increased mortality in chronic kidney disease [
9], post procedural AKI development [
10,
11,
12], and increased systemic arterial stiffness [
13].
To date, there are few data regarding cardio-renal hemodynamics in the field of TAVR. Therefore, the aim of this pilot study was to (i) investigate the association of Doppler based RRI with acute kidney injury after the TAVR procedure and (ii) evaluate the dynamic change of various cardio-renal hemodynamic parameters according to AKI occurrence.
2. Methods
2.1. Patients
100 patients with severe aortic stenosis (AS) and high or intermediate surgical risk according to Logistic EuroSCORE were prospectively enrolled for TAVR and concomitant RDU evaluation at our institution (Nouvel Hôpital Civil, Strasbourg University, France) from May 2018 to May 2019. The study was approved by the local bioethics committee. All participants gave their informed written consent and agreed to the anonymous processing of their data. Commercially available valves, such as the balloon expandable Edwards SAPIEN XT or S3 prosthesis (Edwards Life sciences LLC, Irvine, CA, USA) and the self-expandable CoreValve or Evolute-R (Medtronic CV, Irvine, CA, USA), were used. Anesthesiological management included a local anaesthesia plus sedation. It consisted of lidocaine injected subcutaneously at the arterial and venous access sites (maximum dose 4 mg/kg), with sedation accomplished with remifentanil infusion adjusted according to the patient’s response (target level: score 2–3 with modified Wilson sedation scale; starting dose 0.025 µg/kg/min, maximum dose 0.2 µg/kg/min).
2.2. Definition of AKI
Acute kidney injury by serum Creatinine (AKIsCr) was defined according to the VARC-2 definition (1) as an absolute increase in serum creatinine of ≥ 0.3 mg/dL (≥ 26.4 µmol/L) OR ≥ 50% increase in serum creatinine 72 h after TAVR. The AKIN Classification classified biochemical severity of AKI as follow: (i) Stage 1: Increase in serum creatinine to 150–199% (1.5–1.99× increase compared with baseline) (ii) Stage 2: Increase in serum creatinine to 200–299% (2.0–2.99× increase compared with baseline) (iii) Stage 3: Increase in serum creatinine to ≥ 300% (> 3× increase compared with baseline).
AKI as determined by Serum cystatin C was identified as AKI
sCyC and defined as an sCyC increase of greater than 15% with baseline value [
14].
We sought to evaluate the incremental value of a new definition of AKI: AKIsCr OR sCyC detected by a single marker (sCr increase ≥ 0.3 mg/dL or 50% from baseline OR sCyC increase ≥ 15% from baseline) and AKIsCr AND sCyC where AKI is detected using by both markers: sCr increase ≥ 0.3 mg/dL or 50% from baseline and sCyC increase ≥ 15% from baseline. Patients were excluded if they were receiving dialysis at baseline.
2.3. Intrarenal Hemodynamic Evaluation by Doppler Ultrasonography
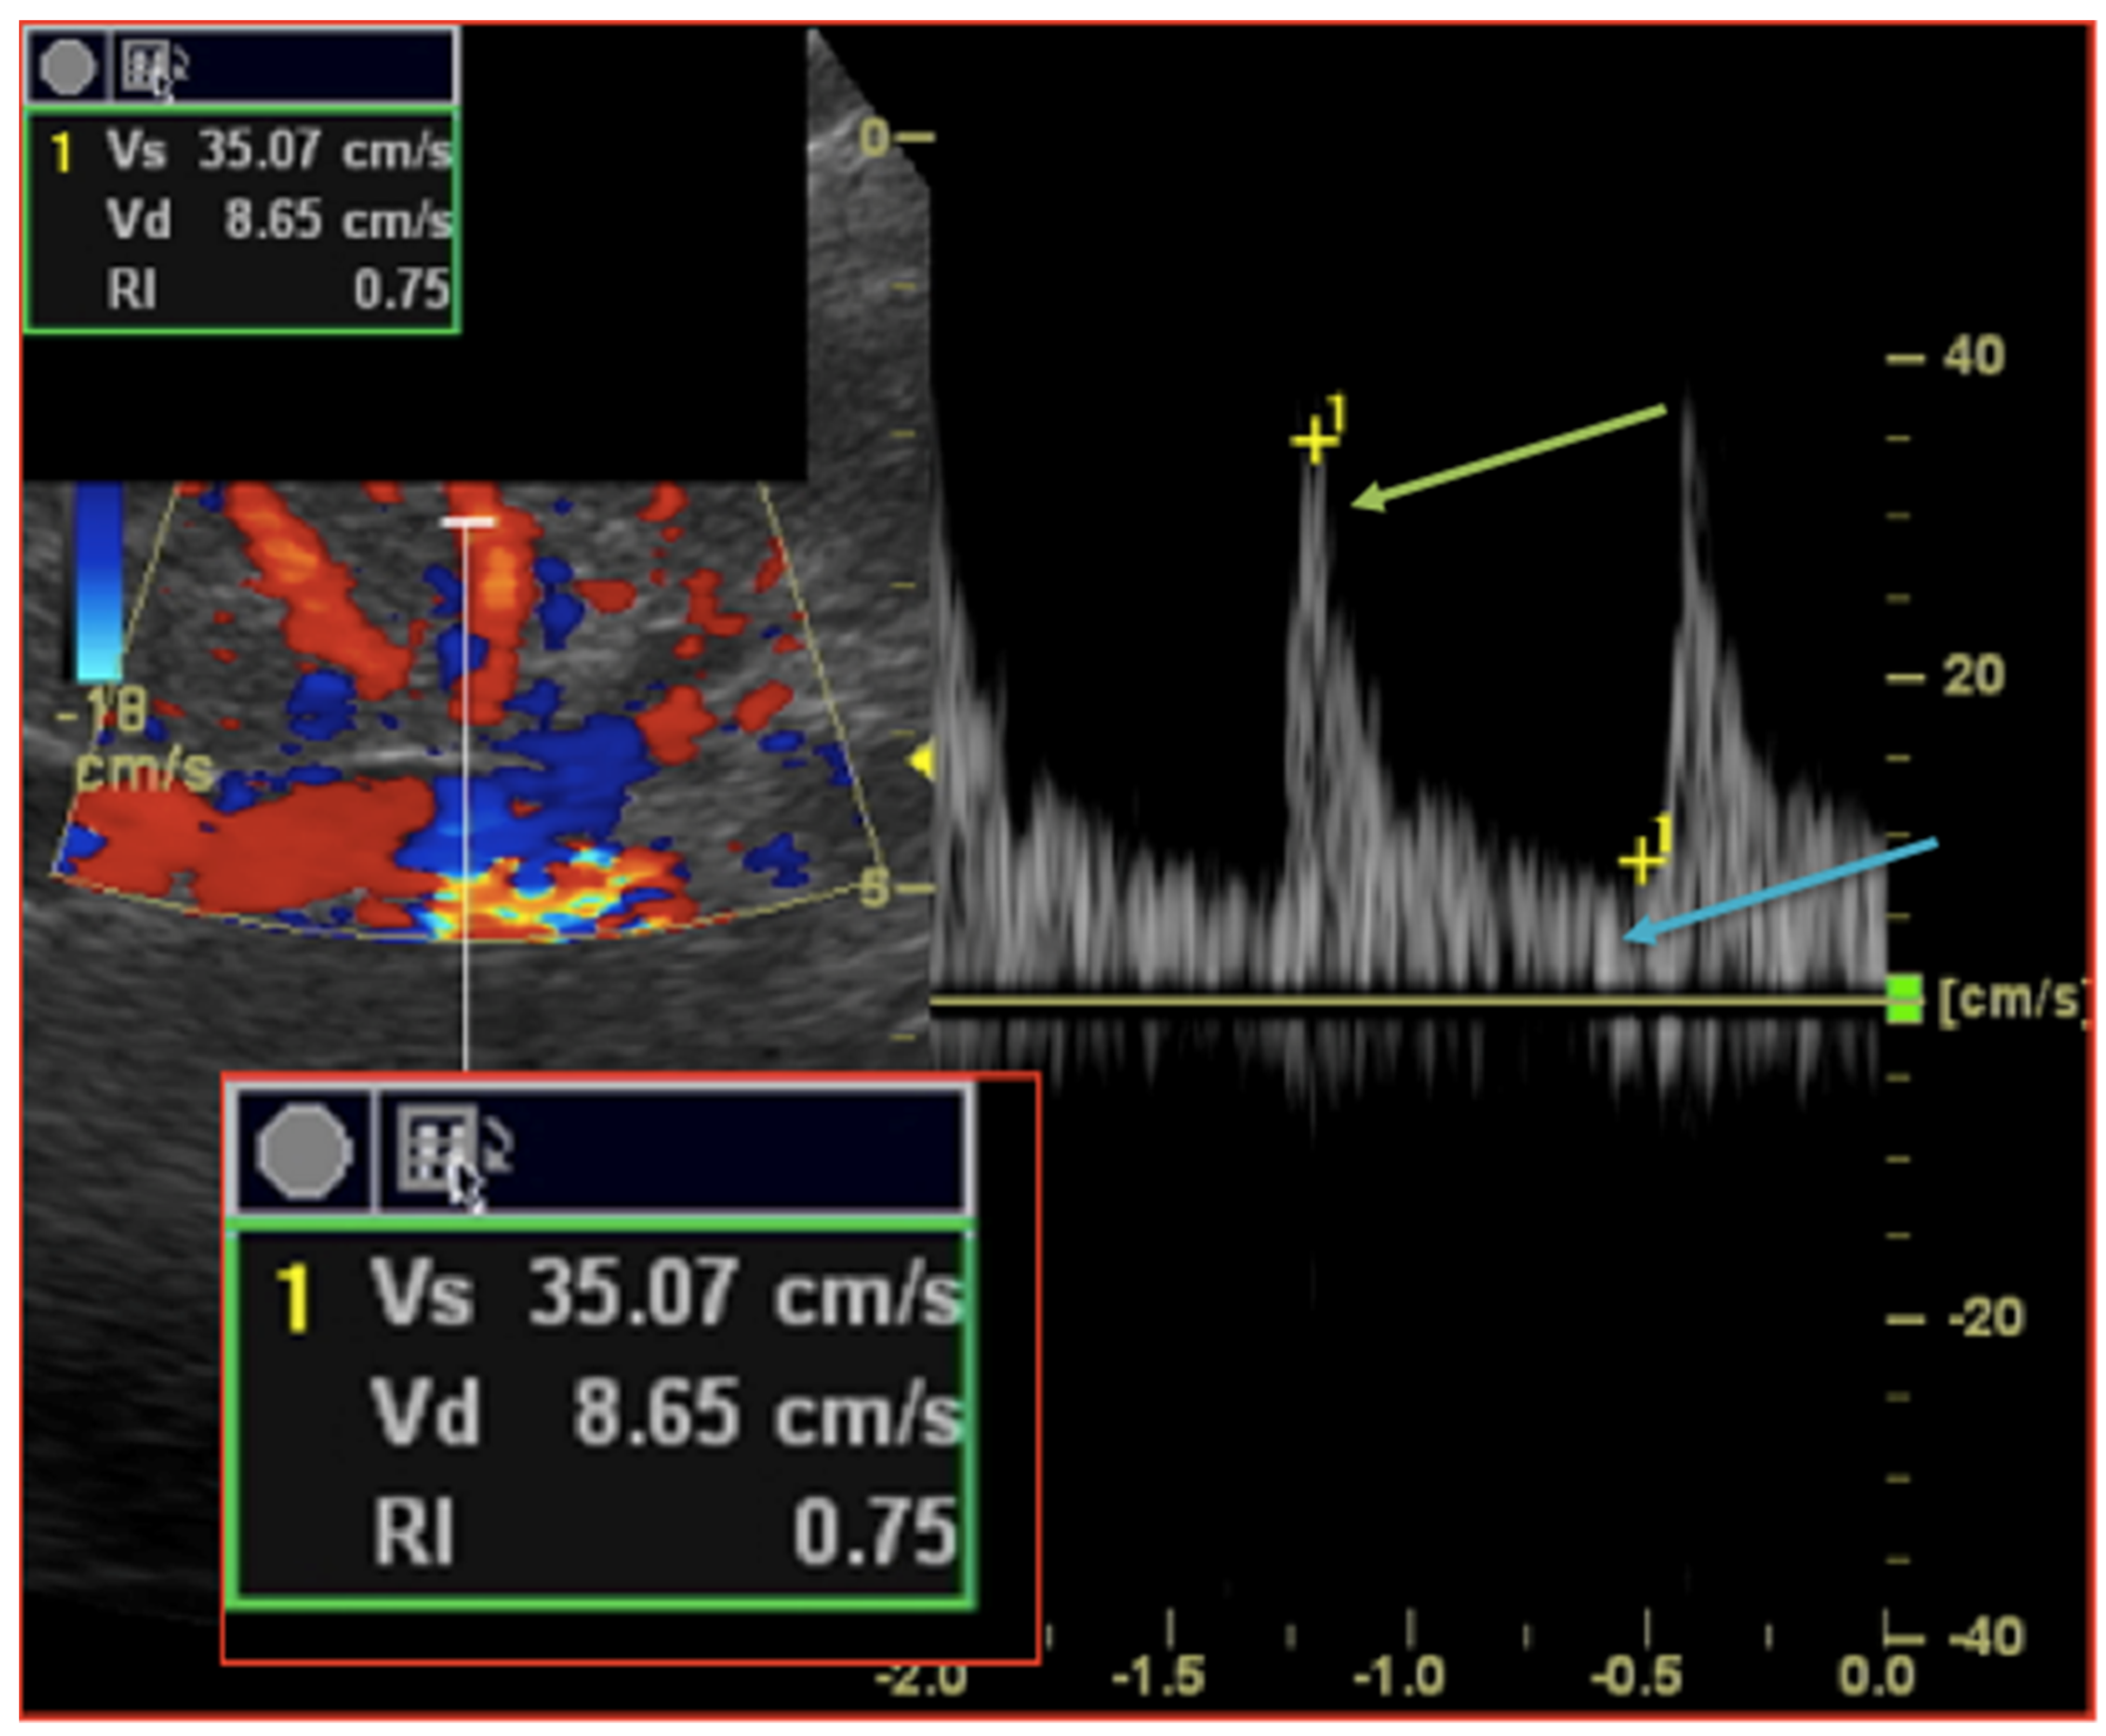
Patients with previous known renal artery disease (renal artery stenosis, occlusion or renal artery/vein thrombosis) were excluded from further analysis. RDU measurements were performed 12 h prior, 24 h and 72 h after TAVR procedures. According to previous work and validated methodology, renal resistive index (RRI) was measured with an ultrasound-Doppler pulsed-wave Doppler probe (5S ultrasound transducer, General Electric Medical Systems) on a Vivid S7 ultrasound system by two independent trained physicians. After locating the kidneys, intrarenal renal vessels were identified using color Doppler and sampling for RRI screened at the level of interlobar arteries. Measurements using pulse-wave Doppler were repeated in different parts (superior, median, and lower) of the kidney and at least three reproducible and consecutive waveforms were obtained to measure RRI parameters (
Figure 1). The RRI index was calculated according to the following formula: ((peak systolic velocity − end diastolic velocity)/peak systolic velocity). The mean value of three different measurements was recorded. The mean reference value for normal RRI in adults is 0.60 ± 0.10 and 0.70 considered as the upper limit of normal [
15,
16,
17].
2.4. Echocardiography Protocol and Hemodynamic Parameters
Concomitant echocardiography was performed after RDU measurements 12 h prior, 24 h and 72 h after TAVR procedure. The following echocardiographic and clinical variables were collected from each patient: heart rate; systolic, diastolic, and mean blood pressures; left ventricular ejection fraction (LVEF); aortic flow time-velocity integral; Aortic velocity time integral and diastolic left ventricular function parameters. Systemic and local renal hemodynamic parameters were calculated according to current definitions (
Supplementary Files) and included valvulo-arterial impedance, total arterial load, pulse pressure, systemic arterial compliance, resistive arterial load, renal arterial load, renal pulse pressure, and renal arterial compliance.
2.5. Collection of Data and Outcomes
All baseline and follow-up variables were recorded and entered into a secure, ethics-approved database. Clinical endpoint including acute kidney injury, mortality, stroke, bleeding, access-related complications and conduction disturbances were assessed according to the definitions provided by the Valve Academic Research Consortium-2 (VARC-2). All clinical events were adjudicated by an events validation committee.
The primary endpoint of the study was the AKI incidence 72 h after TAVR. The secondary endpoint was a composite endpoint defined by mortality, stroke, and hospitalization for heart failure. All patients were contacted by phone and questioned by a standardized questionnaire about their health status, symptoms, medications and the occurrence of adverse events.
2.6. Statistical analysis
Quantitative variables were described according to AKI occurrence and expressed as means ± standard deviation. Categorical variables were expressed as counts and percentages. Categorical variables were compared with chi-square tests or Fisher’s exact tests. Continuous variables were compared with the use of parametric (ANOVA) or non-parametric Mann–Whitney tests as appropriate. Normality of the distribution was tested using Kolmogorov—Smirnov Test. To determine predictors of AKI, regression analysis was performed. A p value < 0.05 was considered significant. Receiver-operating characteristic (ROC) curve analysis was performed to establish the threshold values most predictive of AKI. Calculations were performed using SPSS 17.0 for Windows (SPSS Inc., Chicago, IL, USA).
3. Results
3.1. Baseline Characteristics
Baseline, procedural, and biological characteristics are summarized in
Table 1,
Table 2 and
Table 3. Of the 100 TAVR patients recruited, AKI was documented respectively for 10%; 10%, 16%, and 4% of the global cohort according to the AKI
sCr, AKI
sCyC, AKI
sCr, OR
sCyC and AKI
sCr AND
sCyC definitions respectively (
Table 4). Regarding AKI as determined by serum creatinine (AKI
sCr), stage 1 AKI according to the AKIN system occurred in eight patients, stage 2 in two patients, and none in stage 3. No difference regarding traditional cardiovascular risk factors according to previous medical history apart from coronary artery disease could be evidenced between groups. Of note, AKI
sCyC patients showed a higher Mehran contrast-induced nephropathy risk score (
p = 0.016) while no difference regarding contrast media volume administration or length of procedure. No pre-operative complications could be evidence such as cardiac arrest, tamponade, immediate red blood cell transfusion nor vasopressor/inotropic support requirement. Likewise, no patients required dialysis therapy nor the short-term use of mechanical circulatory support devices.
3.2. Renal Resistive Index (RRI)
The whole cohort of AS patients eligible for TAVR showed higher baseline RRI values (0.76 ± 0.7) compared to normal known and accepted values. While RRI at baseline and Day 3 were similar between groups, patients with AKI
sCyC had significant higher post-procedural RRI one day (Day 1) after TAVR (
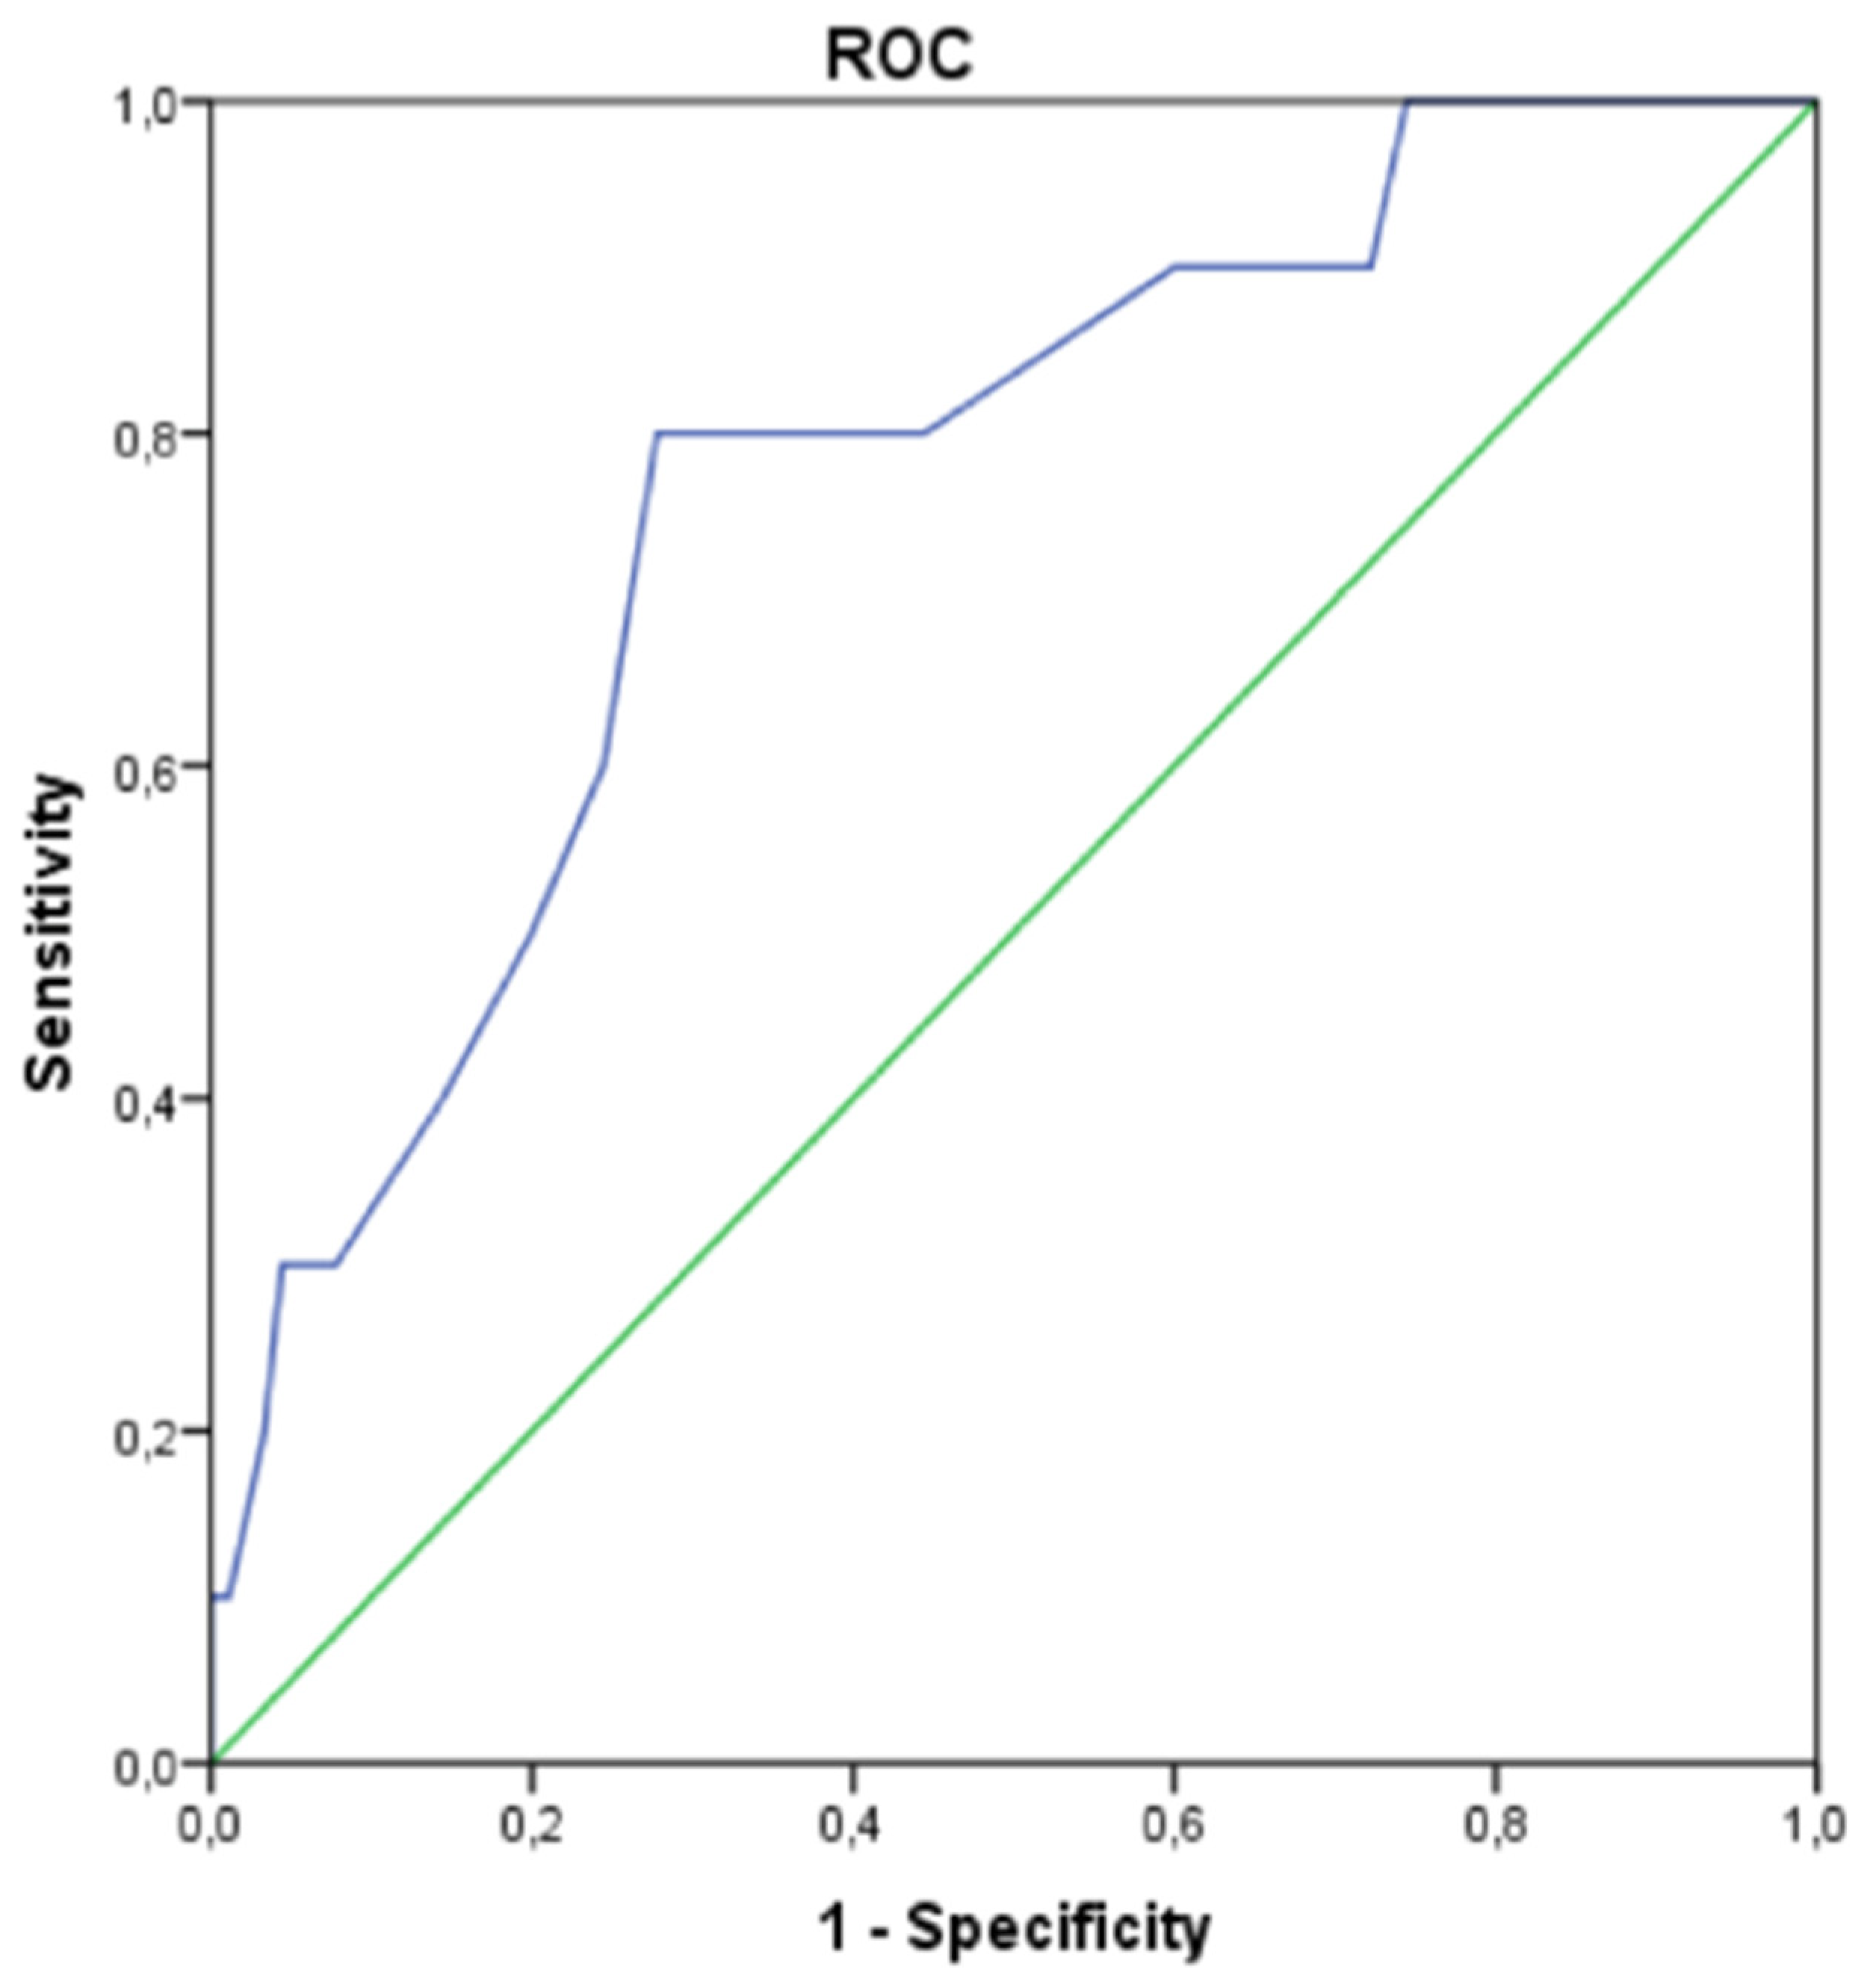
Table 5). Receiver-operating characteristic curve was applied for the identification of an optimal RRI value (
Figure 2). AUC for AKI
sCyC was 0.766 and a RRI cut-off value of ≥ 0.795 had the most optimal sensitivity/specificity (80/62%) combination. Similarly, higher post-procedural RRI one day after TAVR could be evidenced according to the AKI
sCr OR
sCyC and AKI
sCr AND
sCyC definition (
Table 6).
3.3. Hemodynamic Parameters
Likewise, AKI
sCyC patients showed transient higher valvulo-arterial impedance and total arterial load one day after TAVR (
Table 7). Conversely and interestingly, no difference regarding inotropy (cardiac performance assessed by stroke volume and cardiac index), left ventricular filling pressure (E/A, E/e′) or renal hemodynamic parameter could be established. A higher preload at baseline evidenced by higher right atrial pressure (echocardiographic assessment of estimated right atrial pressure) was associated with AKI
sCyC patients.
3.4. Predictors of AKI Following TAVR
By univariate Cox analysis, Mehran Risk Score, higher baseline right atrial pressure at baseline, > 0.8 RRI values one day after TAVR (HR 6.5 (95% CI 1.3–32.9;
p = 0.021) but not RRI at baseline were significant predictors of AKI
sCyC (
Table 8).
Importantly, no significant impact of baseline biological parameters, renal or systemic parameters could be demonstrated.
4. Discussion
AKI is a common complication in patients with TAVR and associated with adverse clinical outcomes [
2]. Although prevalence and preventive measures for AKI in TAVR have been investigated in multiple clinical trials [
18,
19], methods designed to accurately detect early AKI are still lacking. Therefore, new diagnostic tools that could predict AKI and be commonly adopted by cardiologists are desperately needed. To the best of our knowledge, this is the first study evaluating the use and role of intrarenal Doppler ultrasonography in diagnosing AKI in an unselected TAVR population.
The results of our study show that, in AS patients undergoing TAVR, AKI patients exhibited (i) higher RRI values compared to normal known and accepted values; (ii) higher transient and residual afterload assessed by valvulo-arterial impedance and total arterial load one day after TAVR and finally (iii) no difference regarding renal hemodynamic parameter.
4.1. Impact of AKI Definitions
The main purposes of this study were to assess (i) the optimal RRI cutoff point to detect AKI and (ii) test whether Serum cystatin C and combined serum cystatin C and Serum cystatin C definition for AKI diagnosis provides extra benefit. sCyC has been validated as an alternative to sCr for diagnosing AKI [
20]. Likewise, sCyC has been proposed as a more sensitive AKI marker [
21,
22,
23]. Of importance, Cystatin C is not affected by muscle mass or diet and is less strongly associated with age, sex, and race than creatinine [
24] and makes this biomarker of particular interest in AS patients and particularly among the TAVR population.
4.2. Impact of Renal Resistive Index (RRI)
The study’s findings highlight that higher immediate post-procedural RRI is strongly associated with AKI. The present observation is of clinical importance as RRI is a rapid, non-invasive and repeatable strategy that may help in assessing renal preclinical dysfunction and in evaluating subsequent risk of acute kidney injury. Additionally, as RRI can be performed in most patients by inexperienced operators following a half-day course [
25] our data clearly challenge the routine and widespread use of bedside renal Doppler ultrasonography in the post TAVR management. Though, specific technical and clinical nuances must be raised in the field of TAVR patients.
First, due to arterial stiffness, TAVR patients exhibited higher baseline RRI values (0.76 ± 0.7) compared to normal known and accepted values: 0.60 ± 0.10 in adults and 0.70 considered as the upper limit of normal [
15,
16,
17]. Indeed, RRI has been reported to increase in the healthy elderly population [
26,
27,
28,
29] and age-related changes in vascular compliance: two intrinsic features defining the TAVR population. Common RRI cut-off values are presently beyond the field of elderly AS patient’s eligible for TAVR, but RRI > 0.795 (Se 80%; 1-Sp 0.378) provided interesting diagnostic performance. The clinical significance of the extended proposed threshold and its diagnostic performance remains to be validated in adequately powered studies.
Second, RRI is the result of a complex interaction between intrarenal circulation and systemic hemodynamics. Not only is RRI a specific marker of kidney damage, but it shares strong relationships with the systemic circulation and some cardiovascular parameters such as cardiac function, aortic stiffness, vascular compliance, renal capillary wedge pressure, and clinical settings such as heart failure progression and regression [
30]. We might have just performed a futile exercise in the field of RRI and cardio-renal interactions after TAVR in resuming RRI to either renal, systemic hemodynamics, heart failure or cardiorenal syndrome relief. We sought to specifically explore the hemodynamic factors in play that should be considered to understand RRI clinical meaning and to explain how systemic and renal parameters both can affect the RRI analysis as TAVR represents a unique therapeutic modality in acute hemodynamic changes. All this without forgetting that RRI goes beyond considering only one specific feature (renal, hemodynamics, renal capillary wedge pressure etc.) of its complex and dynamic definition.
4.3. Impact of Systemic and Renal Hemodynamics Parameters
The mechanistic model of acute relief of the valvular load provided by TAVR procedures enables the measurement and investigation of rapid systemic and renal hemodynamic changes. Albeit limited to a small sample size, we provided data suggesting that higher RRI is linked to transient higher valvulo-arterial impedance (Zva) and total arterial load (TAL) one day after TAVR.
In patients with AS, high Zva and TAL are accurate markers of advanced disease and have been previously associated with adverse outcomes both in AS [
31,
32] and post TAVR patients [
33,
34]. Our report stands out as the first insight demonstrating that transient residual high post TAVR afterload impacts AKI development through higher RRI, a surrogate marker of renal arterial resistance.
We believe the results of our findings suggest that systemic arterial afterload and RRI evaluation should be incorporated to optimize patient periprocedural TAVR management. Long-term prospective studies are needed to establish the prognostic value of measuring such indices before and after valve interventions and how such indices may aid selecting the best management strategy for patients after TAVR.
Our findings reinforce the understanding of the complex nature of RRI changeability and renal function in the field of TAVR with higher RRI depending on (i) fixed systemic and renal vascular resistance despite acute relief from AS provided by TAVR; (ii) absence of compensatory mechanism maintaining or improving GFR such as relief from heart failure and inherent cardiorenal syndrome and (iii) on the other hand true renal damage induced by contrast media, hypovolemia etc.
Our experimental data suggest therefore that Doppler-based RRI could be an integrative parameter that may help in detecting early renal dysfunction, portray the post procedural systemic vascular load and become a surrogate maker of cardiorenal interaction after TAVR.
Finally, RRI at 24 h after TAVR was not influenced by preoperative renal function but hemodynamic change, and it was thus considered as a surrogated marker. These results are important to assess the mechanism of AKI after TAVR. Indeed, due to the small number of subjects included and the complex pathophysiological factors as displayed in this paper, we could not establish that RRI evaluated preoperatively could predict AKI.
4.4. Study Limitations
Several limitations should be taken into account in the interpretation of the data. First, the observational design of the study, though prospective inclusions, did not allow us to establish a cause-effect relationship between the observed associations. Additionally, the inclusion of overwhelming elderly patients with preserved LVEF and moderately altered GFR (the mean LVEF of patients in our study was > 55% and mean sCr-GRF 54.5 µmol/L) limited the generalizability of the results to other populations. Indeed, further data supporting the link between altered cardiac output, renal function, and RRI evaluation (e.g., low-flow low-gradient AS or reduced LVEF patients) may represent a population of choice to study due to prominent hemodynamic changes and cardiorenal interactions after TAVR. While AKI is widely known to be associated with red blood cell transfusions, such association was not observed given the limited size of the cohort. Second, international standardization of the Cystatin C assay is not finalized. Third intra and Inter-observer RRI variability were not analysed but assumed to be very low in the literature. Fourth, concomitant therapeutic modalities after TAVR known to affect RRI (e.g., diuretic therapy with the consequent reduction in renal venous pressure) were not recorded. Finally, we conducted a pilot study, with a consequently small sample size (100 patients) and only 10 events, making any analysis, especially a logistic regression, tentative and for the purpose of hypothesis generation. The AUC of 0.766 should be considered with caution and interpreted in the light of a low number of events.
5. Conclusions
Doppler-based renal resistive index can be helpful for the non-invasive assessment of acute kidney injury development after transcatheter aortic valve replacement.
Author Contributions
All authors contributed significantly to the submitted work as follows: M.P.: study conception and design, drafting of the manuscript, data collection and interpretation; B.M.: data collection and interpretation, drafting of the manuscript and critical revision for important intellectual content; S.B.: data interpretation and critical revision for important intellectual content; E.P.: data interpretation and critical revision for important intellectual content; K.M.: data collection and interpretation; A.C.: data collection and interpretation; J.H.: data collection and interpretation; A.T.: data collection and interpretation; H.P.-E.: data collection and interpretation; L.J.: interpretation of data and critical revision for important intellectual content; P.O.: interpretation of data and critical revision for important intellectual content; O.M.: study conception and design, data collection and interpretation, drafting of the manuscript, and critical revision for important intellectual content. All the authors take responsibility for all aspects of the reliability and freedom from bias of the data presented and their discussed interpretation. All authors have read and agreed to the published version of the manuscript.
Funding
This work was supported by GERCA (Groupe pour l’Enseignement, la Recherche cardiologique en Alsace).
Conflicts of Interest
Matsushita has received scholarship from Uehara Memorial Foundation. Other authors have reported that they have no relationship to disclose.
Abbreviations
| ACE inhibitor | Angiotensin-converting enzyme inhibitor |
| AKI | Acute Kidney injury |
| AF | atrial fibrillation |
| APT | antiplatelet therapy |
| ARBs | Angiotensin II receptor blockers |
| AS | Aortic stenosis |
| BMI | body mass index |
| EuroSCORE | logistic EuroSCORE predicted risk of mortality at 30 days |
| GRF | Glomerular Filtration Rate |
| LVEF | left ventricular ejection fraction |
| MACE | Major adverse cardiac events |
| RDU | Renal Doppler ultrasound |
| RRI | Doppler based renal resistive index |
| sCr | serum Creatinine |
| sCyC | Serum cystatin C |
| TAVR | transcatheter aortic valve replacement. |
| TTE | transthoracic echocardiography |
| VARC-2 | valve academic research consortium-2 consensus |
References
- Kappetein, A.P.; Head, S.J.; Généreux, P.; Piazza, N.; van Mieghem, N.M.; Blackstone, E.H.; Brott, T.G.; Cohen, D.J.; Cutlip, D.E.; van Es, G.A.; et al. Valve Academic Research Consortium-2 Updated standardized endpoint definitions for transcatheter aortic valve implantation: The ValveAcademic Research Consortium-2 consensus document. J. Thorac. Cardiovasc. Surg. 2013, 145, 6–23. [Google Scholar] [CrossRef] [Green Version]
- Gargiulo, G.; Sannino, A.; Capodanno, D.; Perrino, C.; Capranzano, P.; Barbani, M.; Stabile, E.; Trimarco, B.; Tamburino, C.; Esposito, G. Impact of postoperative acute kidney injury on clinical outcomes after transcatheter aortic valve implantation: A meta-analysis of 5971 patients. Catheter. Cardiovasc. Interv. 2015, 86, 518–527. [Google Scholar] [CrossRef]
- Thongprayoon, C.; Cheungpasitporn, W.; Srivali, N.; Kittanamongkolchai, W.; Greason, K.L.; Kashani, K.B. Incidence and risk factors of acute kidney injury following transcatheter aortic valve replacement. Nephrology 2016, 21, 1041–1046. [Google Scholar] [CrossRef]
- Thongprayoon, C.; Cheungpasitporn, W.; Mao, M.A.; Srivali, N.; Kittanamongkolchai, W.; Harrison, A.M.; Greason, K.L.; Kashani, K.B. Persistent acute kidney injury following transcatheter aortic valve replacement. J. Card. Surg. 2017, 32, 550–555. [Google Scholar] [CrossRef]
- Doi, Y.; Iwashima, Y.; Yoshihara, F.; Kamide, K.; Hayashi, S.; Kubota, Y.; Nakamura, S.; Horio, T.; Kawano, Y. Renal resistive index and cardiovascular and renal outcomes in essential hypertension. Hypertension 2012, 60, 770–777. [Google Scholar] [CrossRef] [Green Version]
- Tedesco, M.A.; Natale, F.; Mocerino, R.; Tassinario, G.; Calabrò, R. Renal resistive index and cardiovascular organ damage in a large population of hypertensive patients. J. Hum. Hypertens. 2007, 21, 291–296. [Google Scholar] [CrossRef] [PubMed] [Green Version]
- Pontremoli, R.; Viazzi, F.; Martinoli, C.; Ravera, M.; Nicolella, C.; Berruti, V.; Leoncini, G.; Ruello, N.; Zagami, P.; Bezante, G.P.; et al. Increased renal resistive index in patients with essential hypertension: A marker of target organ damage. Nephrol Dial. Transplant. 1999, 14, 360–365. [Google Scholar] [CrossRef] [PubMed] [Green Version]
- Pearce, J.D.; Craven, T.E.; Edwards, M.S.; Corriere, M.A.; Crutchley, T.A.; Fleming, S.H.; Hansen, K.J. Associations between renal duplex parameters and adverse cardiovascular events in the elderly: A prospective cohort study. Am. J. Kidney Dis. 2010, 55, 281–290. [Google Scholar] [CrossRef] [PubMed] [Green Version]
- Toledo, C.; Thomas, G.; Schold, J.D.; Arrigain, S.; Gornik, H.L.; Nally, J.V.; Navaneethan, S.D. Renal resistive index and mortality in chronic kidney disease. Hypertension 2015, 66, 382–388. [Google Scholar] [CrossRef] [Green Version]
- Bellos, I.; Pergialiotis, V.; Kontzoglou, K. Renal resistive index as predictor of acute kidney injury after major surgery: A systematic review and meta-analysis. J. Crit. Care 2018, 50, 36–43. [Google Scholar] [CrossRef]
- Ninet, S.; Schnell, D.; Dewitte, A.; Zeni, F.; Meziani, F.; Darmon, M. Doppler-based renal resistive index for prediction of renal dysfunction reversibility: A systematic review and meta-analysis. J. Crit. Care 2015, 30, 629–635. [Google Scholar] [CrossRef]
- Wybraniec, M.T.; Bożentowicz-Wikarek, M.; Chudek, J.; Mizia-Stec, K. Pre-procedural renal resistive index accurately predicts contrast-induced acute kidney injury in patients with preserved renal function submitted to coronary angiography. Int J. Cardiovasc. Imaging 2017, 33, 595–604. [Google Scholar] [CrossRef]
- Calabia, J.; Torguet, P.; Garcia, I.; Martin, N.; Mate, G.; Marin, A.; Molina, C.; Valles, M. The relationship between renal resistive index, arterial stiffness, and atherosclerotic burden: The link between macrocirculation and microcirculation. J. Clin. Hypertens. 2014, 16, 186–191. [Google Scholar] [CrossRef] [PubMed] [Green Version]
- Zhang, W.F.; Zhang, T.; Ding, D.; Sun, S.Q.; Wang, X.L.; Chu, S.C.; Shen, L.H.; He, B. Use of Both Serum Cystatin C and Creatinine as Diagnostic Criteria for Contrast-Induced Acute Kidney Injury and Its Clinical Implications. J. Am. Heart Assoc. 2017, 13, e004747. [Google Scholar] [CrossRef] [PubMed] [Green Version]
- Tublin, M.E.; Bude, R.O.; Platt, J.F. Review. The resistive index in renal Doppler sonography: Where do we stand? AJR Am. J. Roentgenol. 2003, 180, 885–892. [Google Scholar] [CrossRef] [PubMed]
- Keogan, M.T.; Kliewer, M.A.; Hertzberg, B.S.; DeLong, D.M.; Tupler, R.H.; Carroll, B.A. Renal resistive indexes: Variability in Doppler US measurement in a healthy population. Radiology 1996, 199, 165–169. [Google Scholar] [CrossRef]
- Granata, A.; Zanoli, L.; Clementi, S.; Fatuzzo, P.; di Nicolò, P.; Fiorini, F. BrPMCID: PMC4075561 Resistive intrarenal index: Myth or reality? J. Radiol. June 2014, 87, 20140004. [Google Scholar] [CrossRef] [Green Version]
- Barbanti, M.; Gulino, S.; Capranzano, P.; Immè, S.; Sgroi, C.; Tamburino, C.; Ohno, Y.; Attizzani, G.F.; Patanè, M.; Sicuso, R.; et al. Acute Kidney Injury With the RenalGuard System in Patients Undergoing Transcatheter Aortic Valve Replacement: The PROTECT-TAVI Trial. JACC Cardiovasc. Interv. 2015, 8, 1595–1604. [Google Scholar] [CrossRef] [Green Version]
- Putzu, A.; Boscolo Berto, M.; Belletti, A.; Pasotti, E.; Cassina, T.; Moccetti, T.; Pedrazzini, G. Prevention of Contrast-Induced Acute Kidney Injury by Furosemide With Matched Hydration in Patients Undergoing Interventional Procedures: A Systematic Review and Meta-Analysis of Randomized Trials. JACC Cardiovasc. Interv. 2017, 10, 355–363. [Google Scholar] [CrossRef]
- Zhang, Z.; Lu, B.; Sheng, X.; Jin, N. Cystatin C in prediction of acute kidney injury: A systemic review and meta-analysis. Am. J. Kidney Dis. 2011, 58, 356–365. [Google Scholar] [CrossRef]
- Newman, D.J.; Thakkar, H.; Edwards, R.G.; Wilkie, M.; White, T.; Grubb, A.O.; Price, C.P. Serum cystatin C measured by automated immunoassay: A more sensitive marker of changes in GFR than serum creatinine. Kidney Int. 1995, 47, 312–318. [Google Scholar] [CrossRef] [PubMed] [Green Version]
- Dharnidharka, V.R.; Kwon, C.; Stevens, G. Serum cystatin C is superior to serum creatinine as a marker of kidney function: A meta-analysis. Am. J. Kidney Dis. 2002, 40, 221–226. [Google Scholar] [CrossRef] [PubMed]
- Briguori, C.; Visconti, G.; Rivera, N.V.; Focaccio, A.; Golia, B.; Giannone, R.; Castaldo, D.; De Micco, F.; Ricciardelli, B.; Colombo, A. Cystatin C and contrast-induced acute kidney injury. Circulation 2010, 121, 2117–2122. [Google Scholar] [CrossRef] [PubMed]
- Levey, A.S.; Inker, L.A. Assessment of Glomerular Filtration Rate in Health and Disease: A State of the Art Review. Clin. Pharm. Ther. 2017, 102, 405–419. [Google Scholar] [CrossRef] [Green Version]
- Schnell, D.; Reynaud, M.; Venot, M.; Le Maho, A.L.; Dinic, M.; Baulieu, M.; Ducos Terreaux, J.; Zeni, F.; Azoulay, E.; Meziani, F.; et al. Resistive Index or color-Doppler semi-quantitative evaluation of renal perfusion by inexperienced physicians: Results of a pilot study. Minerva Anestesiol. 2014, 80, 1273–1281. [Google Scholar]
- Lin, Z.Y.; Wang, L.Y.; Yu, M.L.; Dai, C.Y.; Chen, S.C.; Chuang, W.L.; Hsieh, M.Y.; Tsai, J.F.; Chang, W.Y. Influence of age on intrarenal resistive index measurement in normal subjects. Abdom. Imaging 2003, 28, 230–232. [Google Scholar] [CrossRef]
- Kawai, T.; Kamide, K.; Onishi, M.; Hongyo, K.; Yamamoto-Hanasaki, H.; Oguro, R.; Maekawa, Y.; Yamamoto, K.; Takeya, Y.; Sugimoto, K.; et al. Relationship between renal hemodynamic status and aging in patients without diabetes evaluated by renal Doppler ultrasonography. Clin. Exp. Nephrol. 2012, 16, 786–791. [Google Scholar] [CrossRef]
- Ponte, B.; Pruijm, M.; Ackermann, D.; Vuistiner, P.; Eisenberger, U.; Guessous, I.; Rousson, V.; Mohaupt, M.G.; Alwan, H.; Ehret, G.; et al. Reference values and factors associated with renal resistive index in a family-based population study. Hypertension 2014, 63, 136–142. [Google Scholar] [CrossRef] [Green Version]
- Kaiser, C.; Götzberger, M.; Landauer, N.; Dieterle, C.; Heldwein, W.; Schiemann, U. Age dependency of intrarenal resistance index (RI) in healthy adults and patients with fatty liver disease. Eur. J. Med. Res. 2007, 12, 191–195. [Google Scholar]
- Di Nicolò, P.; Granata, A. Renal Resistive Index: Not only kidney. Clin. Exp. Nephrol. 2017, 21, 359–366. [Google Scholar] [CrossRef]
- Hachicha, Z.; Dumesnil, J.G.; Pibarot, P. Usefulness of the valvuloarterial impedance to predict adverse outcome in asymptomatic aortic stenosis. J. Am. Coll. Cardiol. 2009, 54, 1003–1011. [Google Scholar] [CrossRef] [Green Version]
- Lancellotti, P.; Donal, E.; Magne, J.; Moonen, M.; O’Connor, K.; Daubert, J.C.; Pierard, L.A. Risk stratification in asymptomatic moderate to severe aortic stenosis: The importance of the valvular, arterial and ventricular interplay. Heart 2010, 96, 1364–1371. [Google Scholar] [CrossRef]
- Giannini, C.; Petronio, A.S.; De Carlo, M.; Guarracino, F.; Benedetti, G.; Delle Donne, M.G.; Dini, F.L.; Marzilli, M.; Di Bello, V. The incremental value of valvuloarterial impedance in evaluating the results of transcatheter aortic valve implantation in symptomatic aortic stenosis. J. Am. Soc. Echocardiogr. 2012, 25, 444–453. [Google Scholar] [CrossRef]
- Lindman, B.R.; Otto, C.M.; Douglas, P.S.; Hahn, R.T.; Elmariah, S.; Weissman, N.J.; Stewart, W.J.; Ayele, G.M.; Zhang, F.; Zajarias, A.; et al. Blood Pressure and Arterial Load After Transcatheter Aortic Valve Replacement for Aortic Stenosis. Circ. Cardiovasc. Imaging 2017, 10, e006308. [Google Scholar] [CrossRef] [Green Version]
© 2020 by the authors. Licensee MDPI, Basel, Switzerland. This article is an open access article distributed under the terms and conditions of the Creative Commons Attribution (CC BY) license (http://creativecommons.org/licenses/by/4.0/).

 ,
, 

