Article

Development and Disease-Dependent Dynamics of Spermatogonial Subpopulations in Human Testicular Tissues

1
Center of Reproductive Medicine and Andrology, Institute of Reproductive and Regenerative Biology, Albert-Schweitzer-Campus 1, Building D11, 48149 Münster, Germany
2
Center for Reproductive Medicine, Amsterdam Research Institute Reproduction and Development, Amsterdam UMC, University of Amsterdam, Meibergdreef 9, 1105 AZ Amsterdam, The Netherlands
3
Department of Experimental Medicine, Sapienza University of Rome, 00161 Rome, Italy
4
Center of Reproductive Medicine and Andrology, Department of Clinical and Surgical Andrology, Albert-Schweitzer-Campus 1, Building D11, 48149 Münster, Germany
*
Author to whom correspondence should be addressed.
The authors consider that the first two authors should be regarded as joint first authors.
J. Clin. Med. 2020, 9(1), 224; https://doi.org/10.3390/jcm9010224
Submission received: 24 November 2019 / Revised: 3 January 2020 / Accepted: 10 January 2020 / Published: 14 January 2020
(This article belongs to the Special Issue Approach to Male Infertility and Induction of Spermatogenesis)

Abstract

:
Cancer therapy and conditioning treatments of non-malignant diseases affect spermatogonial function and may lead to male infertility. Data on the molecular properties of spermatogonia and the influence of disease and/or treatment on spermatogonial subpopulations remain limited. Here, we assessed if the density and percentage of spermatogonial subpopulation changes during development (n = 13) and due to disease and/or treatment (n = 18) in tissues stored in fertility preservation programs, using markers for spermatogonia (MAGEA4), undifferentiated spermatogonia (UTF1), proliferation (PCNA), and global DNA methylation (5mC). Throughout normal prepubertal testicular development, only the density of 5mC-positive spermatogonia significantly increased with age. In comparison, patients affected by disease and/or treatment showed a reduced density of UTF1-, PCNA- and 5mC-positive spermatogonia, whereas the percentage of spermatogonial subpopulations remained unchanged. As an exception, sickle cell disease patients treated with hydroxyurea displayed a reduction in both density and percentage of 5mC- positive spermatogonia. Our results demonstrate that, in general, a reduction in spermatogonial density does not alter the percentages of undifferentiated and proliferating spermatogonia, nor the establishment of global methylation. However, in sickle cell disease patients’, establishment of spermatogonial DNA methylation is impaired, which may be of importance for the potential use of this tissues in fertility preservation programs.

1. Introduction

Male reproductive potential depends on the presence and development of the spermatogonial cell population, which forms the basis for spermatogenesis following puberty. Impairment of spermatogonial development before or during puberty may lead to infertility in adult life. Reasons for this include pathological conditions such as cryptorchidism and genetic or endocrine disorders [1,2,3,4,5]. Apart from that, cancer therapy and conditioning treatments of non-malignant diseases such as sickle cell disease and thalassemia, are known to induce testicular damage, affect spermatogonial function and reduce or even deplete germ cells [4,5,6,7,8,9,10]. Consequently, gonadotoxic treatment may lead to temporary or permanent infertility depending on treatment dose and duration, patients’ age and underlying diagnosis [11,12,13].
Cryopreservation of testicular biopsies containing spermatogonia is the current strategy to preserve reproductive potential of prepubertal patients. Although several approaches are investigated, spermatogonia-based fertility restoration methods to derive sperm from stored testicular tissues remain experimental [14]. Descriptive and qualitative information of the heterogeneous prepubertal testicular tissues is pivotal to determine its potential use in fertility restoration strategies. While accumulating evidence on spermatogonial numbers in bio-banked tissues is reported, evaluation of molecular properties of spermatogonia remains limited [4,5,9,10,15].
From birth onwards, spermatogonia in the human testis are located at the basal membrane of seminiferous tubules [16,17,18]. During childhood testicular development, spermatogonial numbers change depending on their rate of proliferation and apoptosis [19,20,21]. Spermatogonial density tends to slightly decrease from birth to 3 years of age, followed by a gradual increase until approximately 7 years. Thereafter, spermatogonial density remains stable until the age of 11 and considerably increases at the onset of puberty [21].
Subpopulations of adult spermatogonia have been distinguished based on protein marker expression profiles [22,23] and, more recently, by single-cell RNA-sequencing approaches [24,25,26,27]. Consistently, most spermatogonia express germline-specific markers such as melanoma-associated antigen 4 (MAGEA4) [23,28,29,30]. Accumulating evidence reveals that the most primitive spermatogonial state exhibits a transcriptomic profile similar to infant spermatogonia [24,27], with an expression of stem cell-specific transcripts such as the undifferentiated embryonic cell transcription factor 1 (UTF1) and a relatively low proliferative activity [22,24,25,27,31,32]. Transition to a differentiated spermatogonial state is dominated by upregulation of proliferation associated-genes and the loss of markers characteristic of earlier spermatogonial states [24,25,26,27].
In contrast to the heterogeneous spermatogonial transcriptome signatures, stable DNA methylation profiles amongst the various adult spermatogonial subpopulations have been reported. They are suggested to allow developmental plasticity within spermatogonial subtypes [24,33] and ensure gamete integrity [34,35,36], as well as correct transmission of epigenetic information to the next generation [37,38]. The timing of establishment of global DNA methylation in spermatogonia during human testicular development is still undescribed. Employing the marmoset monkey as a non-human primate model, global methylation levels of spermatogonia were reported. Immunohistochemical analysis of 5-methylcytosine (5mC) revealed a progressive increase with development. Specifically, neonatal spermatogonia were predominantly unmethylated (27 ± 1.5% of methylated spermatogonia), then methylation of the spermatogonial population rose during prepubertal (39 ± 23%) and pubertal (83 ± 7.9%) stages until nearly all adult spermatogonia (97 ± 1.7%) were methylated [39].
In this study, we aimed to analyze spermatogonial marker expression profiles at various testicular developmental stages of patients at risk of germ cell loss. Composition of spermatogonial subpopulations was evaluated by a marker of spermatogonia (MAGEA4), undifferentiated spermatogonia (UTF1) and functional markers of proliferation (proliferating cell nuclear antigen, PCNA) and methylation (5mC). Furthermore, we evaluated the effect of underlying diseases and/or respective treatment on spermatogonial subpopulations.

2. Materials and Methods

2.1. Ethical Approval

Ethical approval was obtained from the Ethics Committee of the Medical Faculty of Münster, the State Medical Board (No. 2011-520-f-S) and the Dutch National ethical committee (CCMO) and Medical Ethic Committee (METC) (NL27690.000.09 and 2009-132, respectively) for prepubertal samples and from the Ethics Committee of the Medical Faculty of Münster, the State Medical Board (No. 2016-507-f-S) for adult controls. All patients or legal guardians gave written informed consent to the use of testicular tissue for research purposes.

2.2. Testicular Tissue Collection

2.2.1. Immature Patients

Immature testicular tissue was collected from 36 patients included in fertility preservation programs at the Centre of Reproductive Medicine and Andrology (Androprotect; Münster, Germany) and the Academic Medical Center (Amsterdam, The Netherlands). Testicular volumes were determined by palpation using a Prader orchidometer [40] and, in most cases, additionally confirmed by ultrasonography (Table 1). Surgery and testis biopsy collection were performed as previously described [5,41]. The majority of the biopsy was cryopreserved for clinical fertility preservation and the remaining part was fixed in (diluted) Bouin’s solution and further processed for histological analysis.
The patient cohort comprised patients diagnosed inter alia with cancer, non-malignant hematological disorders including sickle cell disease and thalassemia, and cryptorchidism. Due to the high variability regarding diagnoses and previous treatments, patients were further divided into two subgroups: NT group included untreated cancer patients without any preexisting (congenital) risk factors for impaired testicular function; AT group comprised patients with testicular tissue potentially affected by pathologies known to affect the testicular function (e.g., cryptorchidism), diagnosed with non-malignant (sickle cell disease, thalassemia, and immunodeficiency), malignant hematological disorders (myelodysplastic syndrome, leukemia and lymphoma), and/or patients who received gonadotoxic treatment (chemotherapy or hydroxyurea) prior to tissue retrieval.

2.2.2. Adult Controls

Adult testicular tissue was obtained from patients who underwent orchiectomy as part of prostate cancer treatment [30,42]. All adult controls (n = 7; 62–79 years) had normal spermatogenesis and exhibited a Bergmann-Kliesch score between 8 and 9, meaning that 75–94% of tubules contained elongated spermatids [43].

2.3. Histological and Immunohistochemical Evaluation of Human Testicular Tissue

Fixed testicular tissues were washed with 70% ethanol and routinely embedded in paraffin. Depending to the research institute, tissue sections of 3 or 5 µm were prepared. Immunohistochemical stainings were performed as published previously [44]. Primary antibodies used in this study included melanoma-associated antigen 4 (MAGEA4), undifferentiated embryonic cell transcription factor 1 (UTF1), proliferating cell nuclear antigen (PCNA), and 5-methylcytosine (5mC) (detailed information is given in Table S1). Respective isotype controls and omission of primary antibodies served as negative controls. Sections were incubated with biotinylated secondary antibodies for 1 h at room temperature followed by incubation with streptavidin conjugated with HRP (S5512, Sigma Aldrich, St. Louis, MO, USA) for 45 min. Immunostaining was visualized with 3,3′-diaminobenzidine and hematoxylin was used as counterstain. Stained sections were entirely scanned using a PreciPoint M8 microscope (PreciPoint, Freising, Germany) at 60× objective.

2.4. Spermatogonial Quantification

As immunohistochemically stained sections were suboptimal to discriminate gonocytes, A dark, pale and B spermatogonia, we choose to quantify all spermatogonia irrespective of the subtypes. Quantitative analysis was performed to determine the numbers of spermatogonia expressing MAGEA4, UTF1, PCNA, and 5mC. Due to the limited material, analysis per patient was restricted to one full section for each marker. Counting was performed according to a previously published protocol [5]. Briefly, all positive and negative spermatogonia within the section were counted in an investigator-blinded approach. Spermatogonia were identified based on size, shape, and basal location within the seminiferous tubules [45].
For comparable results, spermatogonial density (numbers per mm3; Nnuc,testis) were determined using a previously published equation [46].
N n u c , t e s t i s = V t e s t i s   *   V v   n u c , t e s t i s V N
In this equation, Vtestis represents the volume of the section (area in mm2 * 3 or 5, adjusted according to thickness of tissue section in µm), Vv nuc,testis the number of spermatogonia multiplied by the mean nuclear volume of spermatogonia type divided by the volume of the section, and VN the spermatogonial mean nuclear volume. All counting and measurements were performed using the ViewPoint software (Precipoint GmbH, Freising, Germany). By measurement of 20 spermatogonia, a mean nuclear diameter of 5.89 ± 0.81 µm was determined. The area of evaluated tissue sections (n = 31) ranged from 0.17 to 17.37 mm2 in NT patients, 0.46 to 11.31 mm2 in AT patients, and 7.29 to 27.80 mm2 in adult controls. Numbers of spermatogonia ranged from 44 to 4226 in NT patients, 52 to 4344 in AT patients, and from 1010 to 14,267 in adult controls (Table S2). Nuclear volumes of spermatogonia were calculated using the ball volume formula (volume = 4/3 πr3).
To circumvent extrapolation of low spermatogonial numbers to density and as spermatogonial density may vary at different positions throughout the testis, particularly in tissue samples with few spermatogonia; we only included samples in which at least 40 spermatogonia could be counted for each marker for further analyses. Additionally, a patient with germ cell neoplasia in situ (AT21) was excluded to avoid incorrect identification of MAGEA4-positive neoplastic cells as spermatogonia (Table 1 and Table S2).

2.5. Spermatogonial Labeling Index

Labeling indices for each marker and patient were determined as the ratio between the number of positively labeled spermatogonia and the total number of spermatogonia. The purpose of this index was to determine the percentage of cells that are positive for each marker irrespective of the absolute cell numbers.

2.6. Statistical Analyses

Statistical analysis was performed in R (R Core Team, version 3.5.0), using the dplyr package for data cleaning, the ggplot2 package for plot drawing and the base stats package for creation of generalized linear models. Generalized linear models were used to predict response for the different labeling indices based on the patients’ age. Wilcoxon rank-sum test was used to compare labeling indices during testicular development of the AT group as well as patients with cryptorchidism, sickle cell disease or thalassemia with the NT group. Statistical significance was set at p-value < 0.05. Adjustment for multiple comparisons was performed with Bonferroni’s Correction; significance was therefore set at p = 0.016 (0.05/3).

3. Results

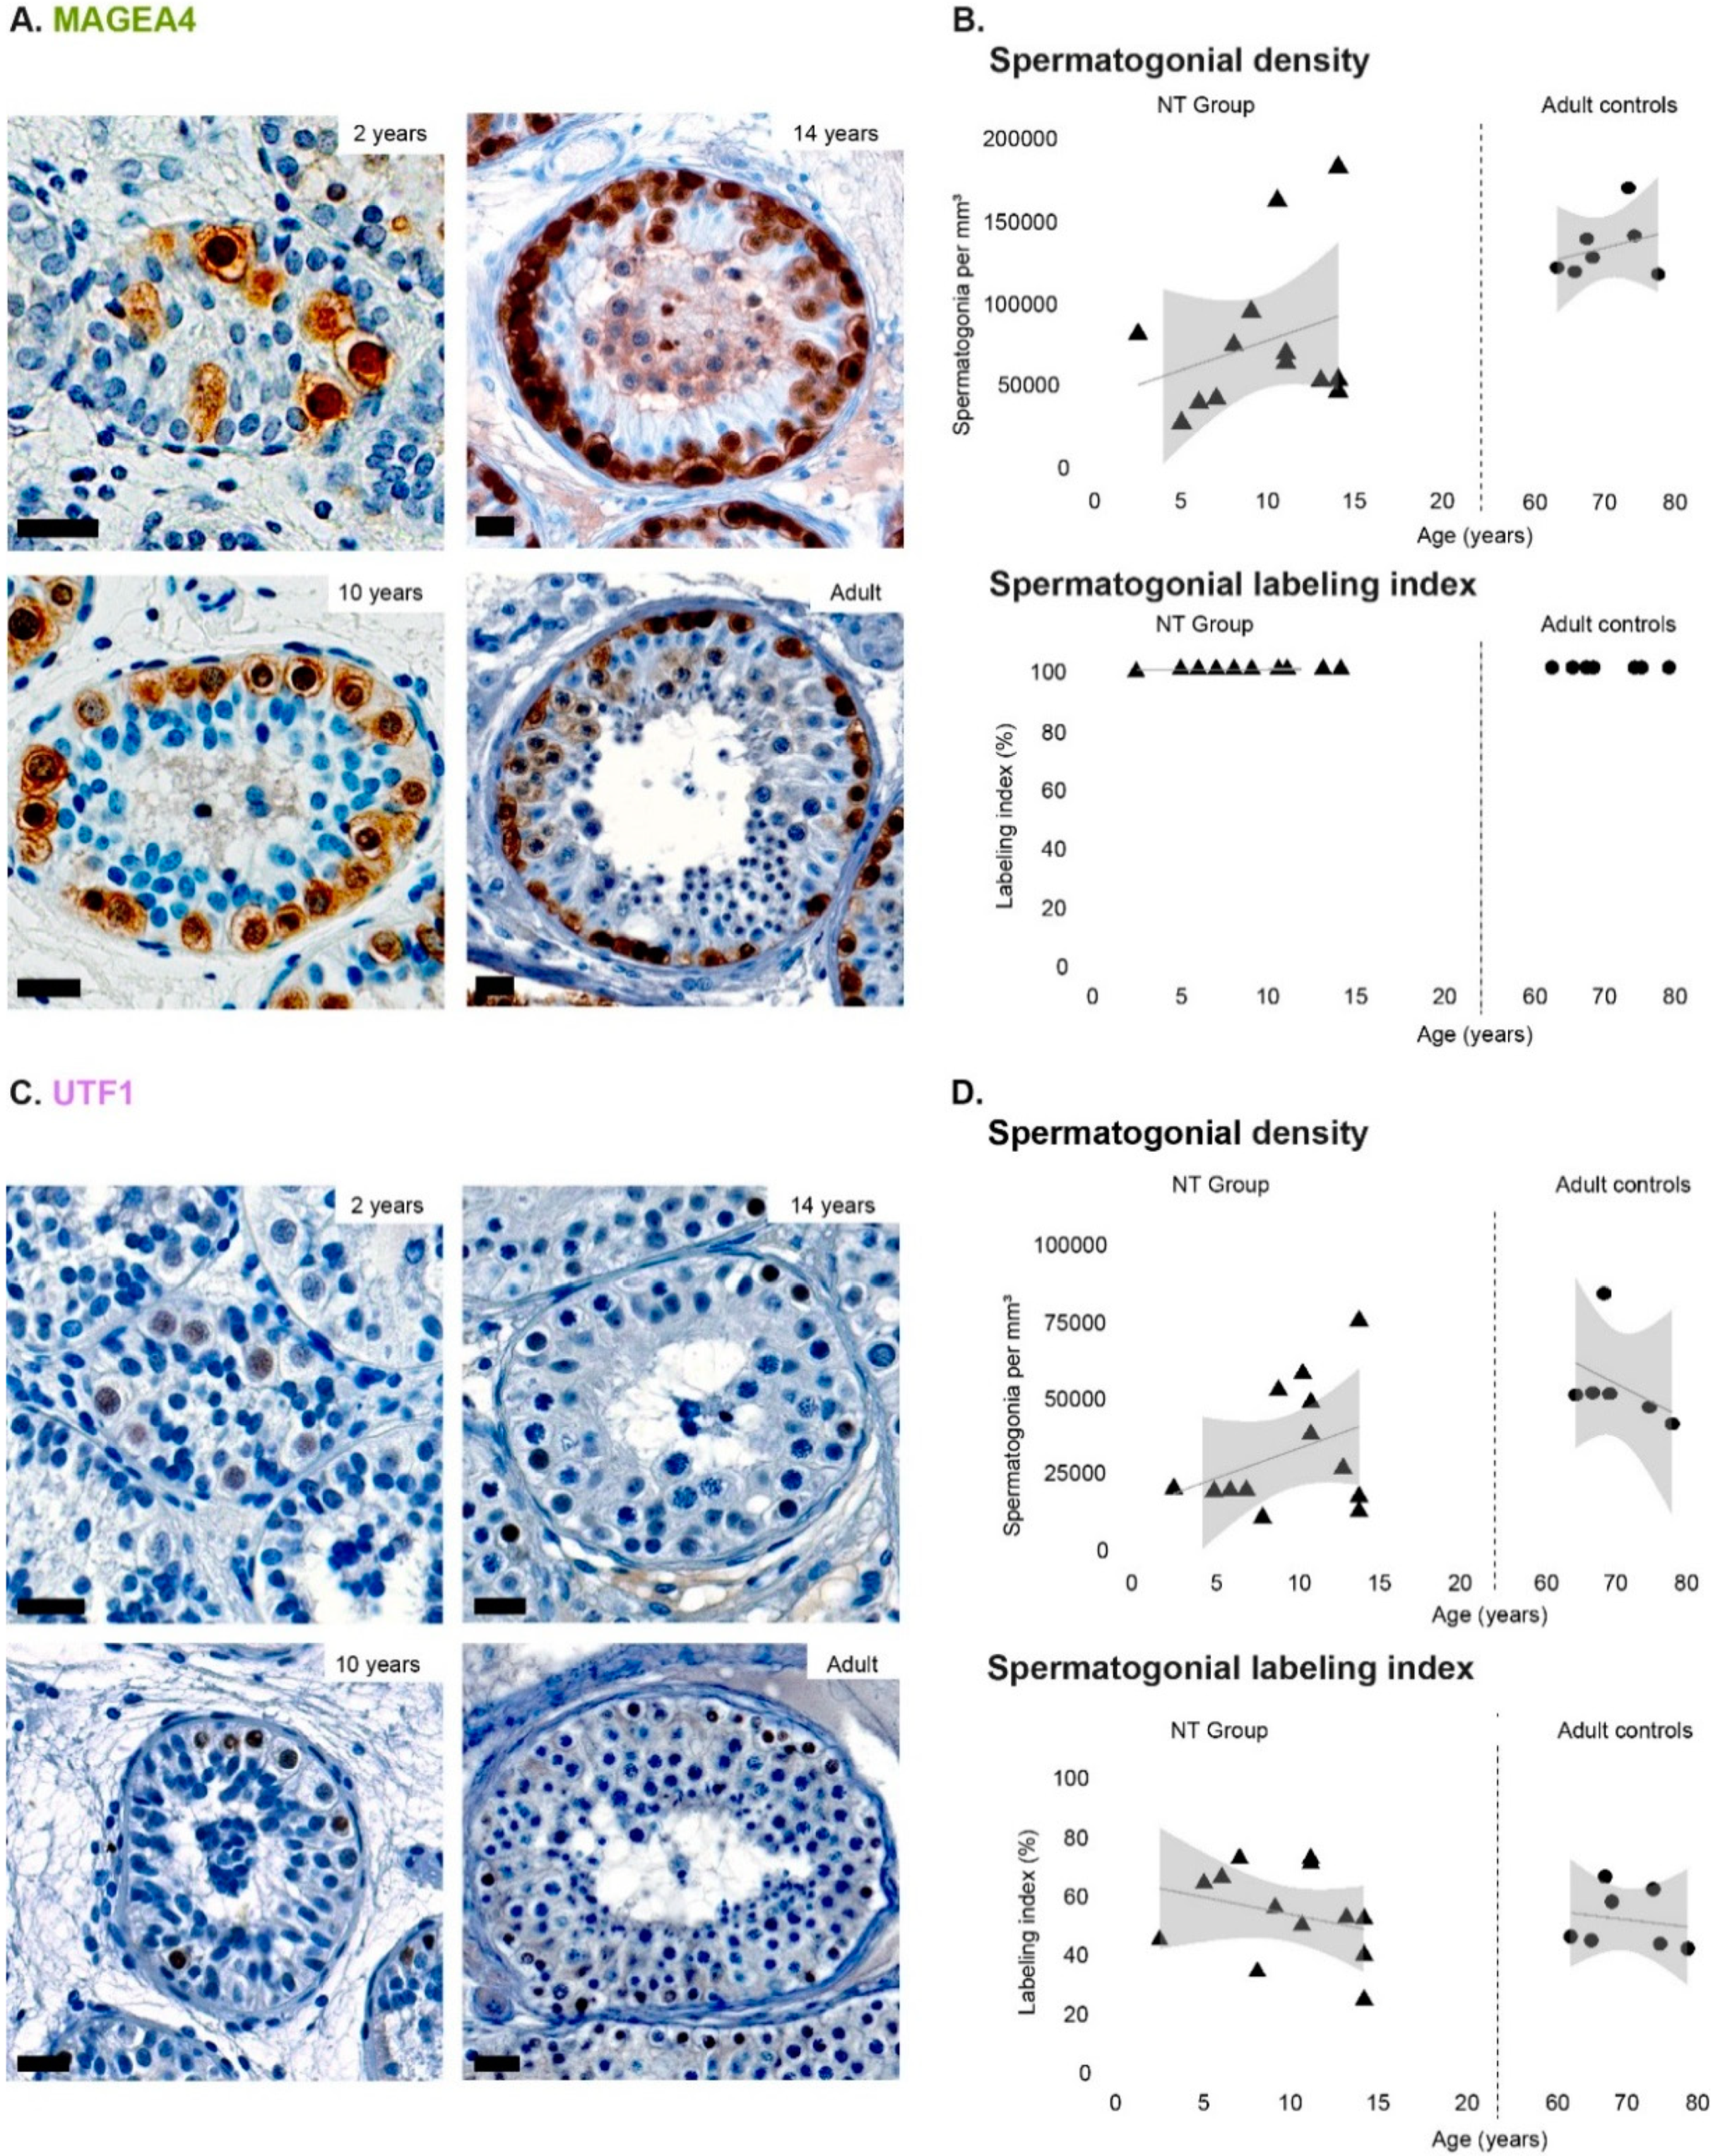
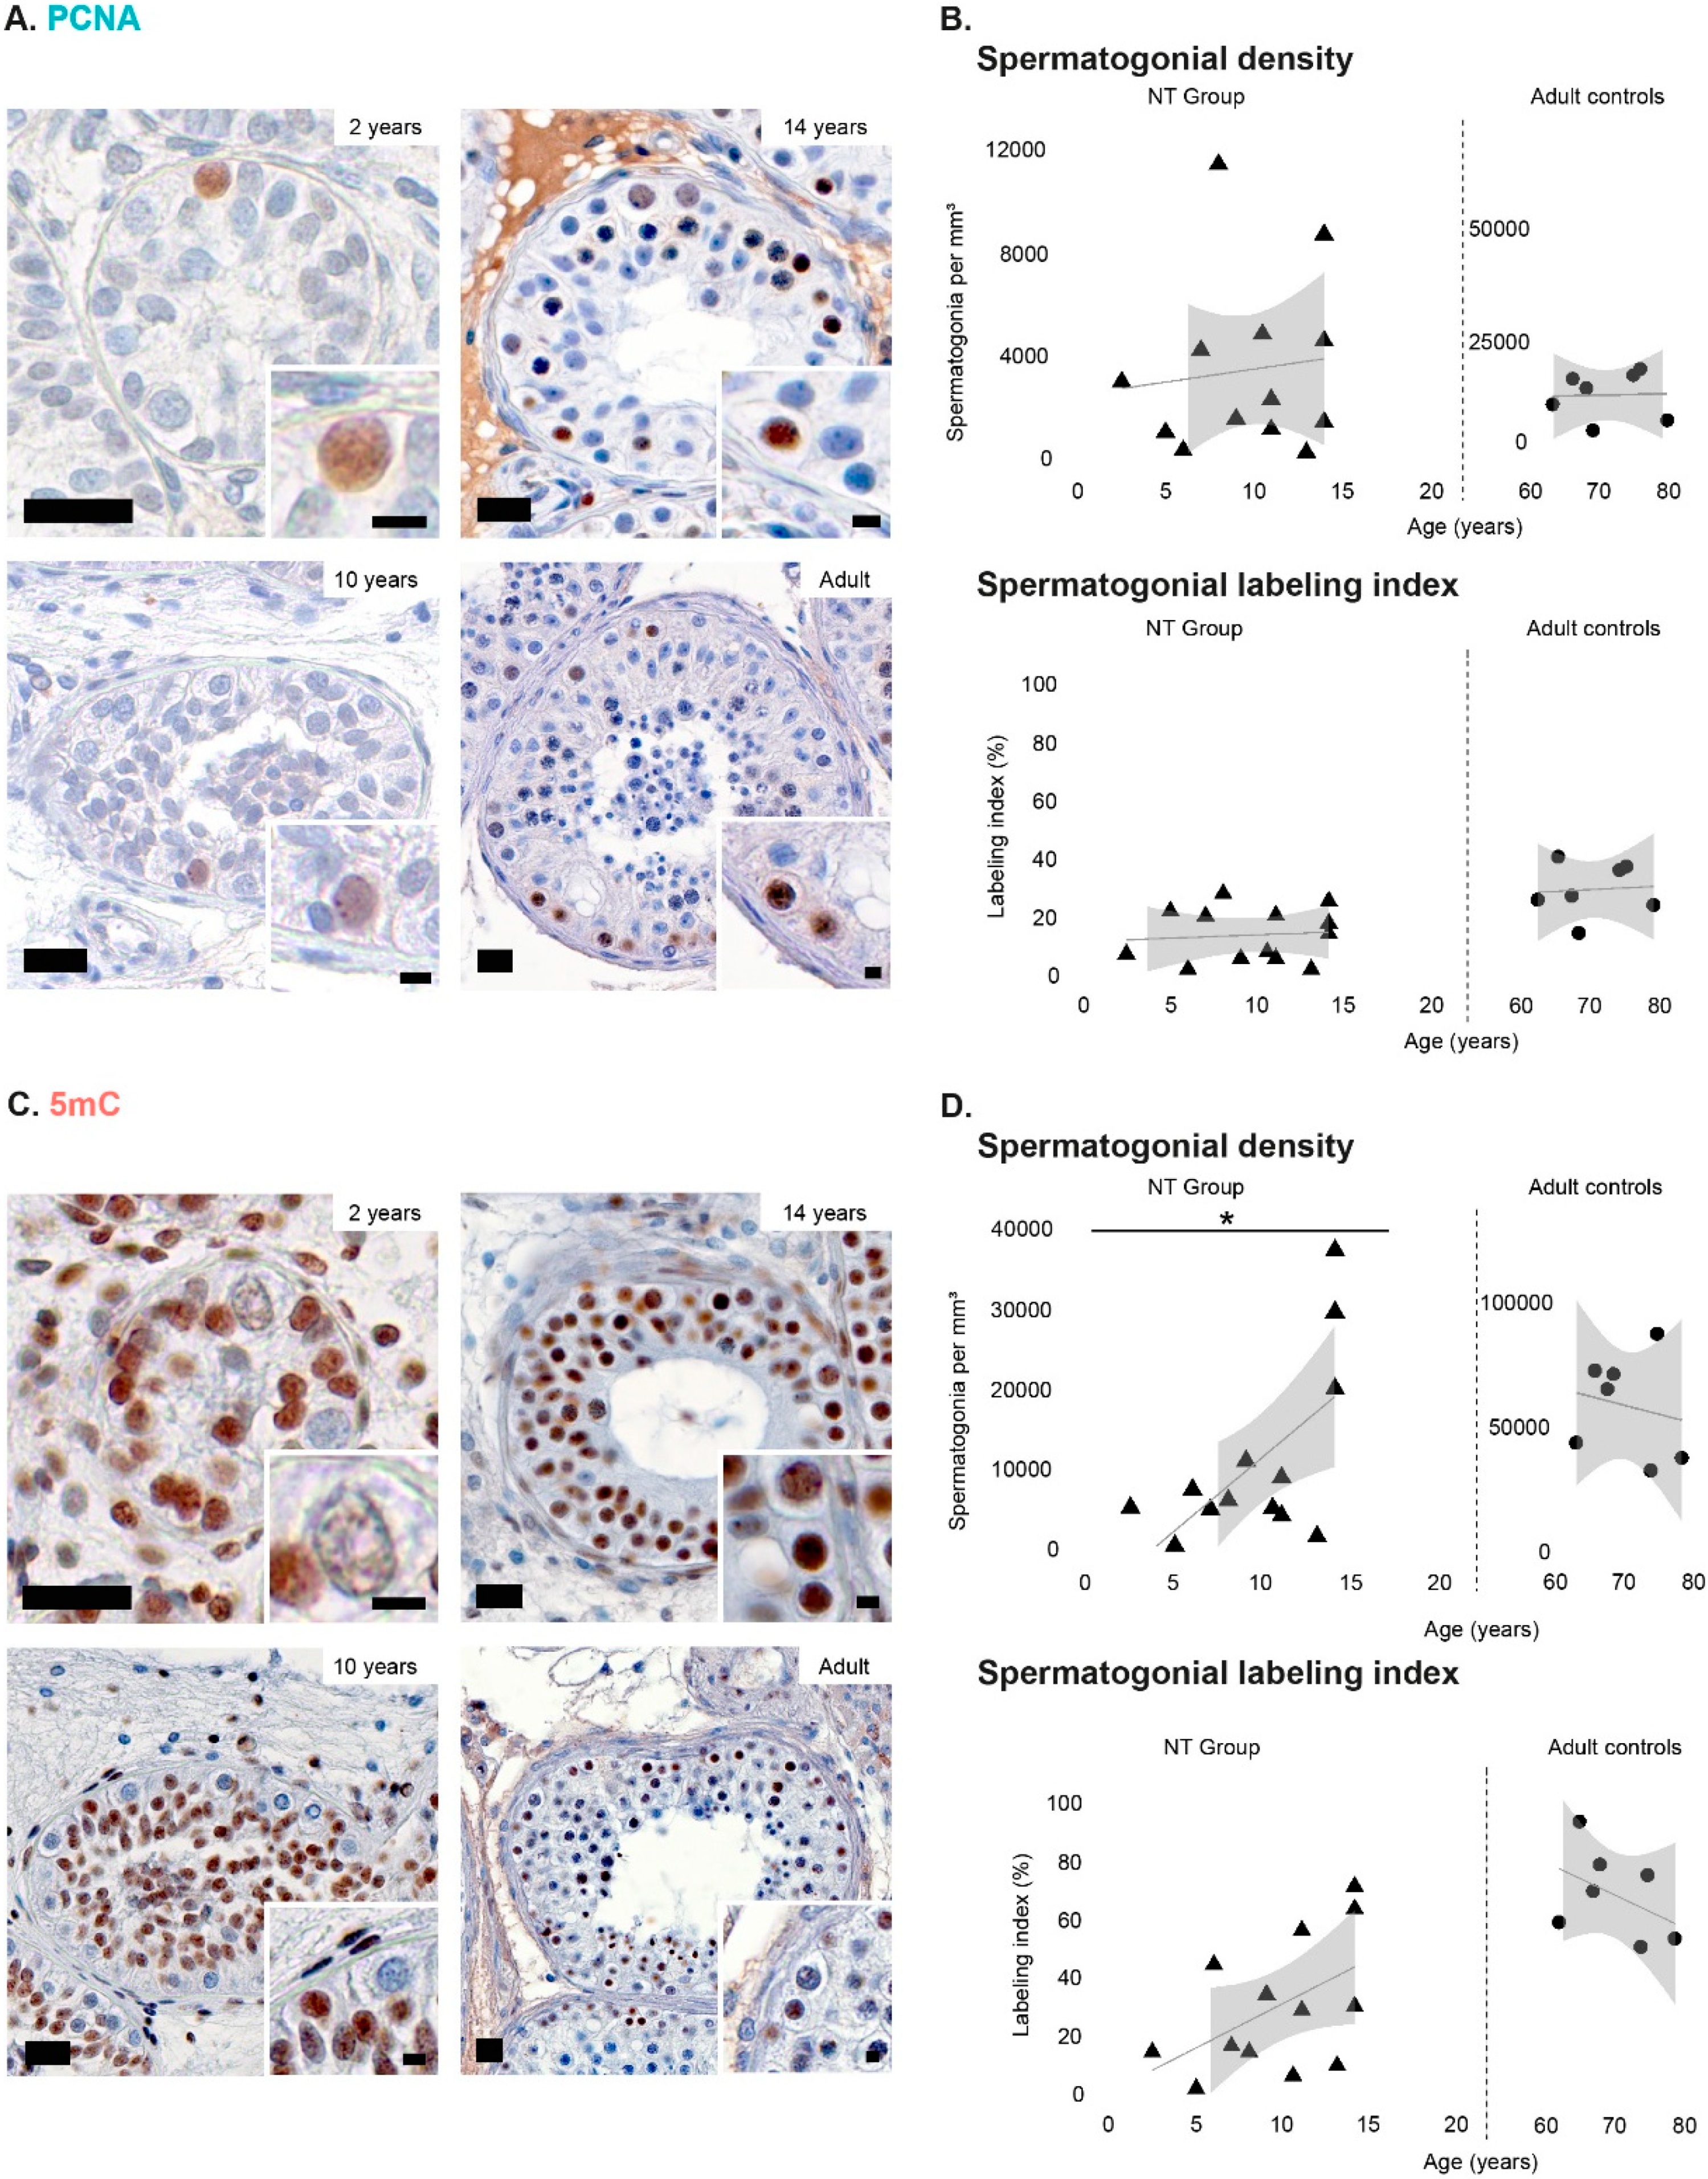
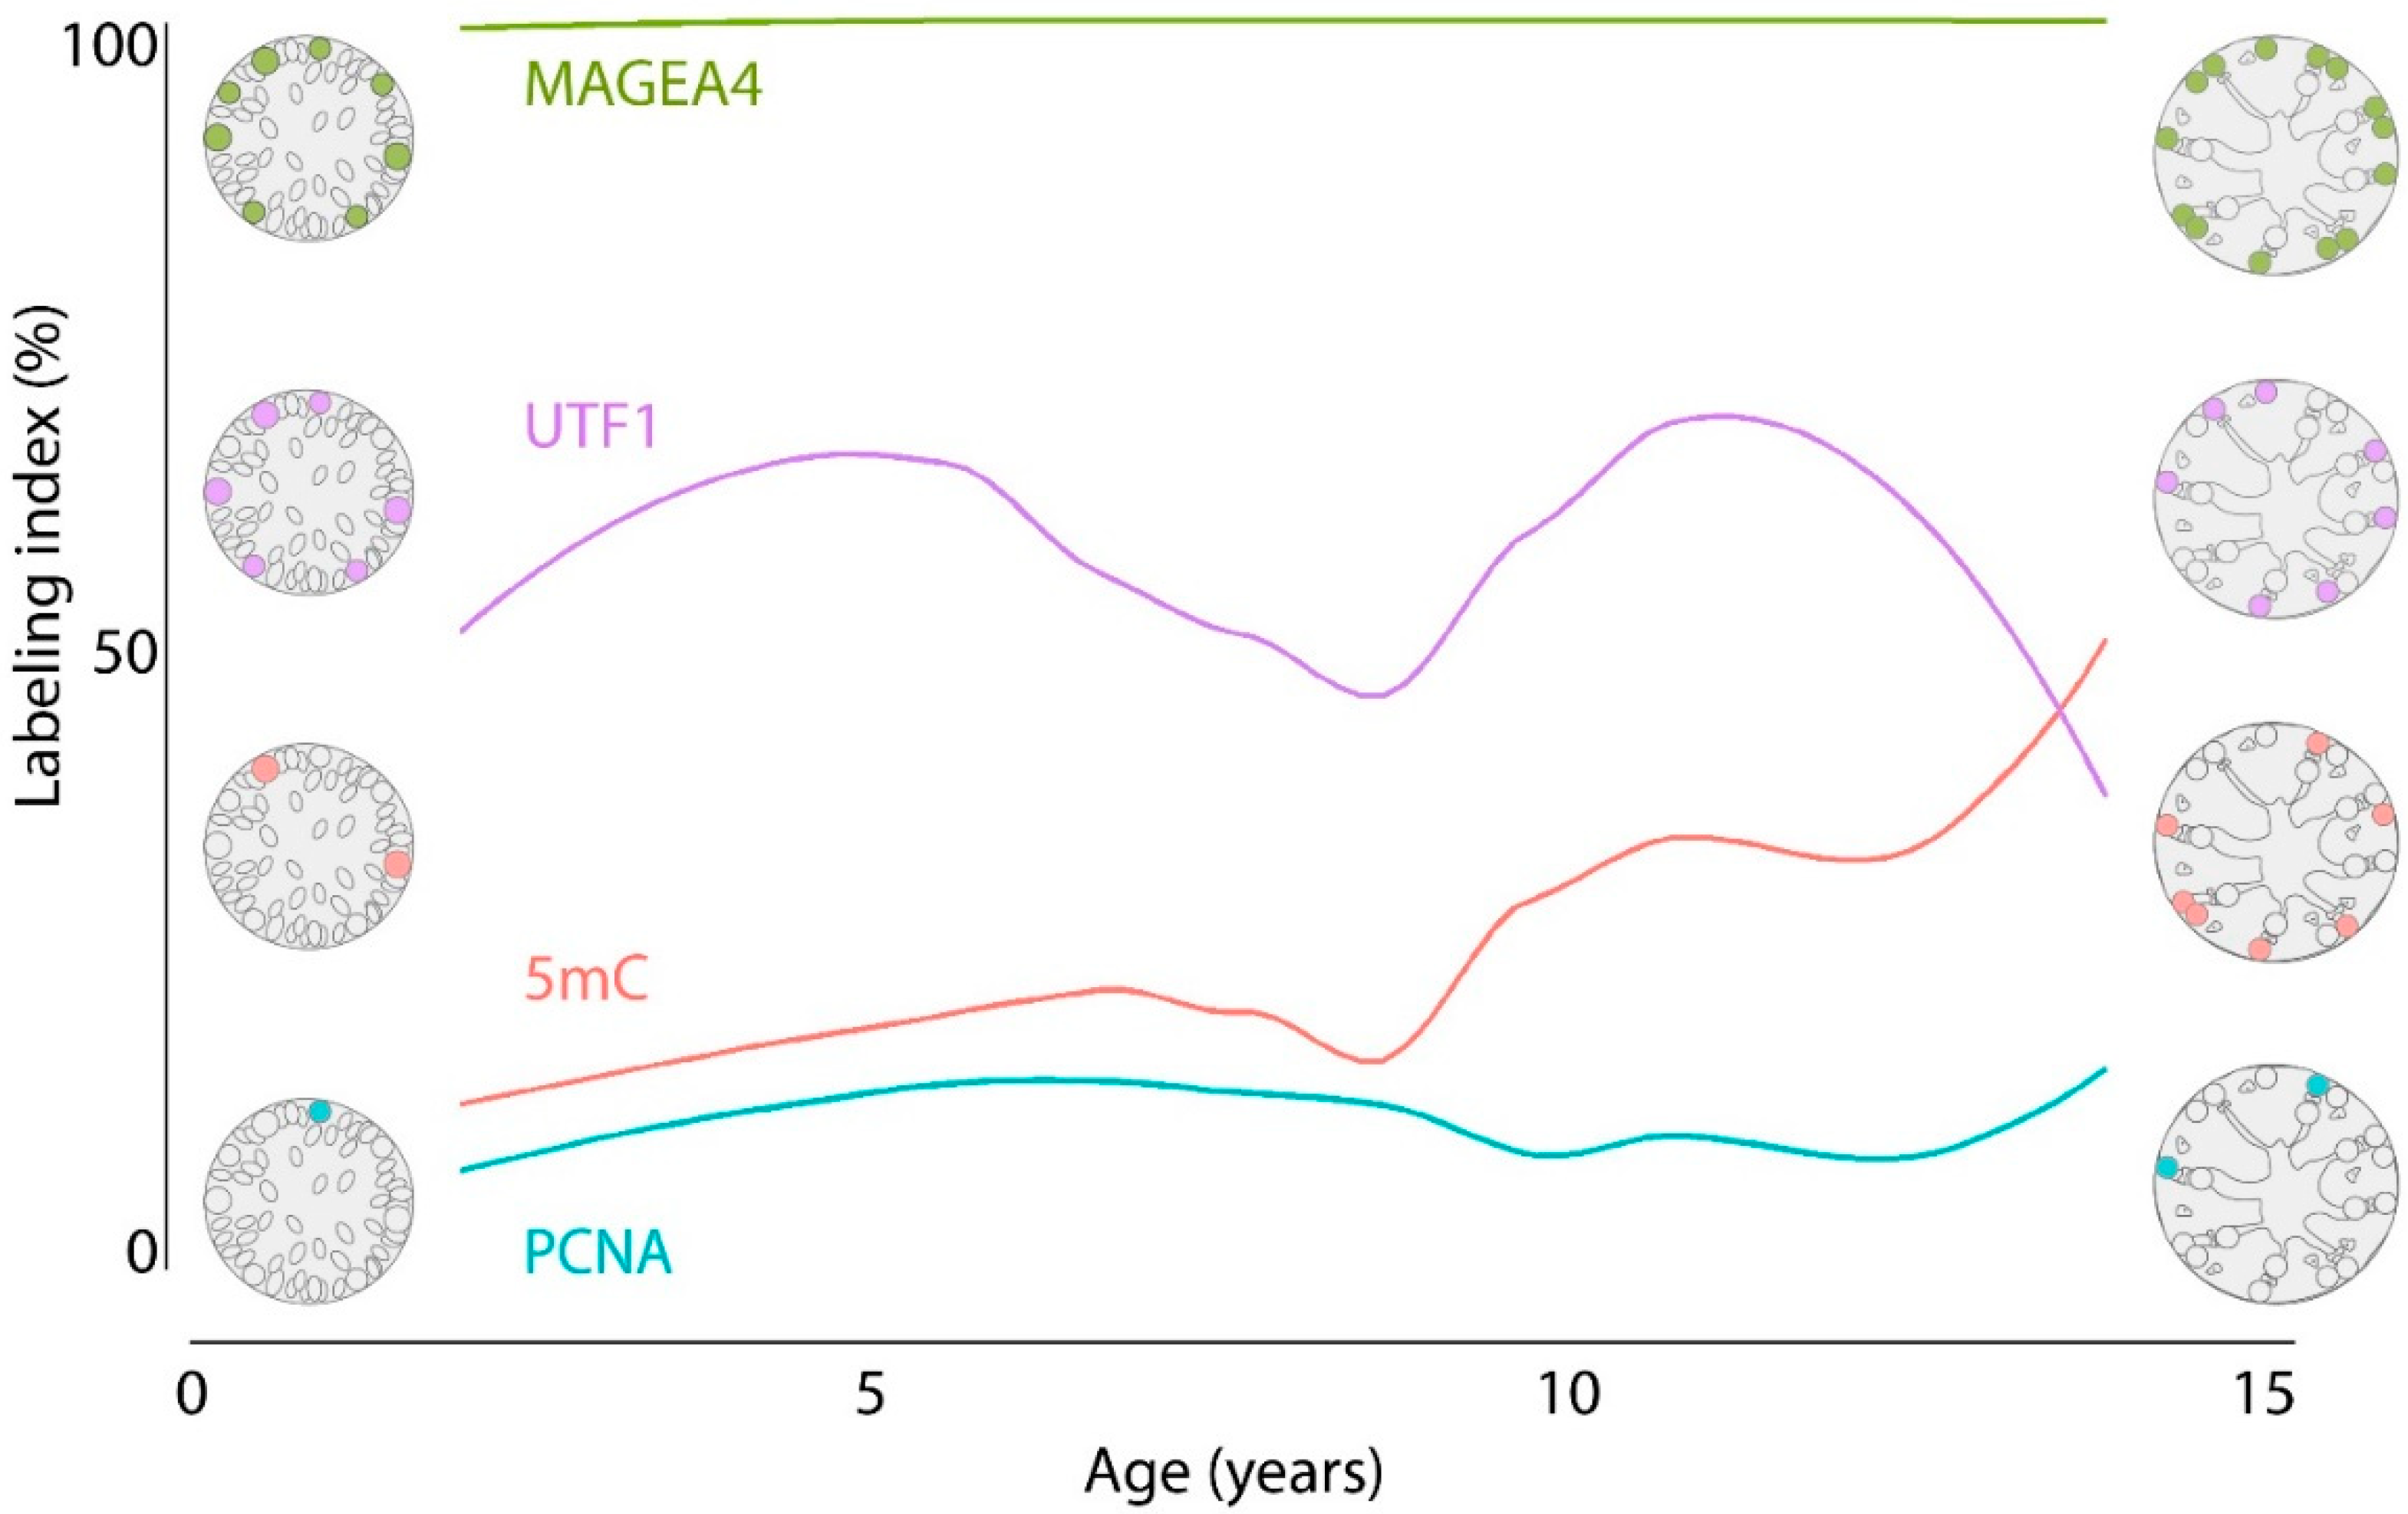
3.1. Density of Spermatogonial Subpopulations during Normal Testicular Development

Immature testicular tissue from untreated cancer patients without any evidence of compromised testicular function (NT group) was used to characterize developmental-related changes in spermatogonial marker expression profiles of MAGEA4, UTF1, PCNA, and 5mC. Quantification of spermatogonial density in testicular cross sections (Table S2) from patients included in the NT group revealed a linear tendency of increase throughout testicular development in the density of spermatogonia expressing MAGEA4 (Figure 1A,B), UTF1 (Figure 1C,D), and PCNA (Figure 2A,B), however without statistical significance. In contrast, the density of 5mC-positive spermatogonia (ranging from 214.4 to 36,966.7) significantly increased (p < 0.05) with age (Figure 2C,D). In adult control samples, the density of spermatogonia positive for each marker did not change significantly with age (Figure 1B,D and Figure 2B,D).

3.2. Spermatogonial Labeling Indices during Normal Testicular Development

To normalize for interindividual variability in spermatogonial density the percentage of marker-positive spermatogonia within the spermatogonial population (labeling index) was determined. Our results reveal that spermatogonial labeling indexes for none of the evaluated markers were significantly influenced by age, neither in the NT patient group nor in adult controls. Briefly, MAGEA4 was expressed by most spermatogonia identified during testicular maturation (NT group) and adulthood (Figure 1B). For UTF1, the spermatogonial labeling index varied between approximately 55% in young patients (less than 5 years old) to ~40–50% during pre-/puberty (5 to 15 years old) and adulthood (Figure 1D). Labeling indices for PCNA-positive spermatogonia were around 10% in young patients, reaching values between 20% and 40% in puberty and adulthood (Figure 2B). Despite a lack of statistical significance, an increasing trend in the 5mC spermatogonial labeling index was observed throughout development. Specifically, 10% of spermatogonia were 5mC-positive in young patients, 55% in post-pubertal patients, and 68% in adult controls (Figure 2D).
For each marker, a dynamic labeling index throughout normal prepubertal testicular development was established by smooth interpolation of the results (Figure 3) and further considered as the reference expression pattern.

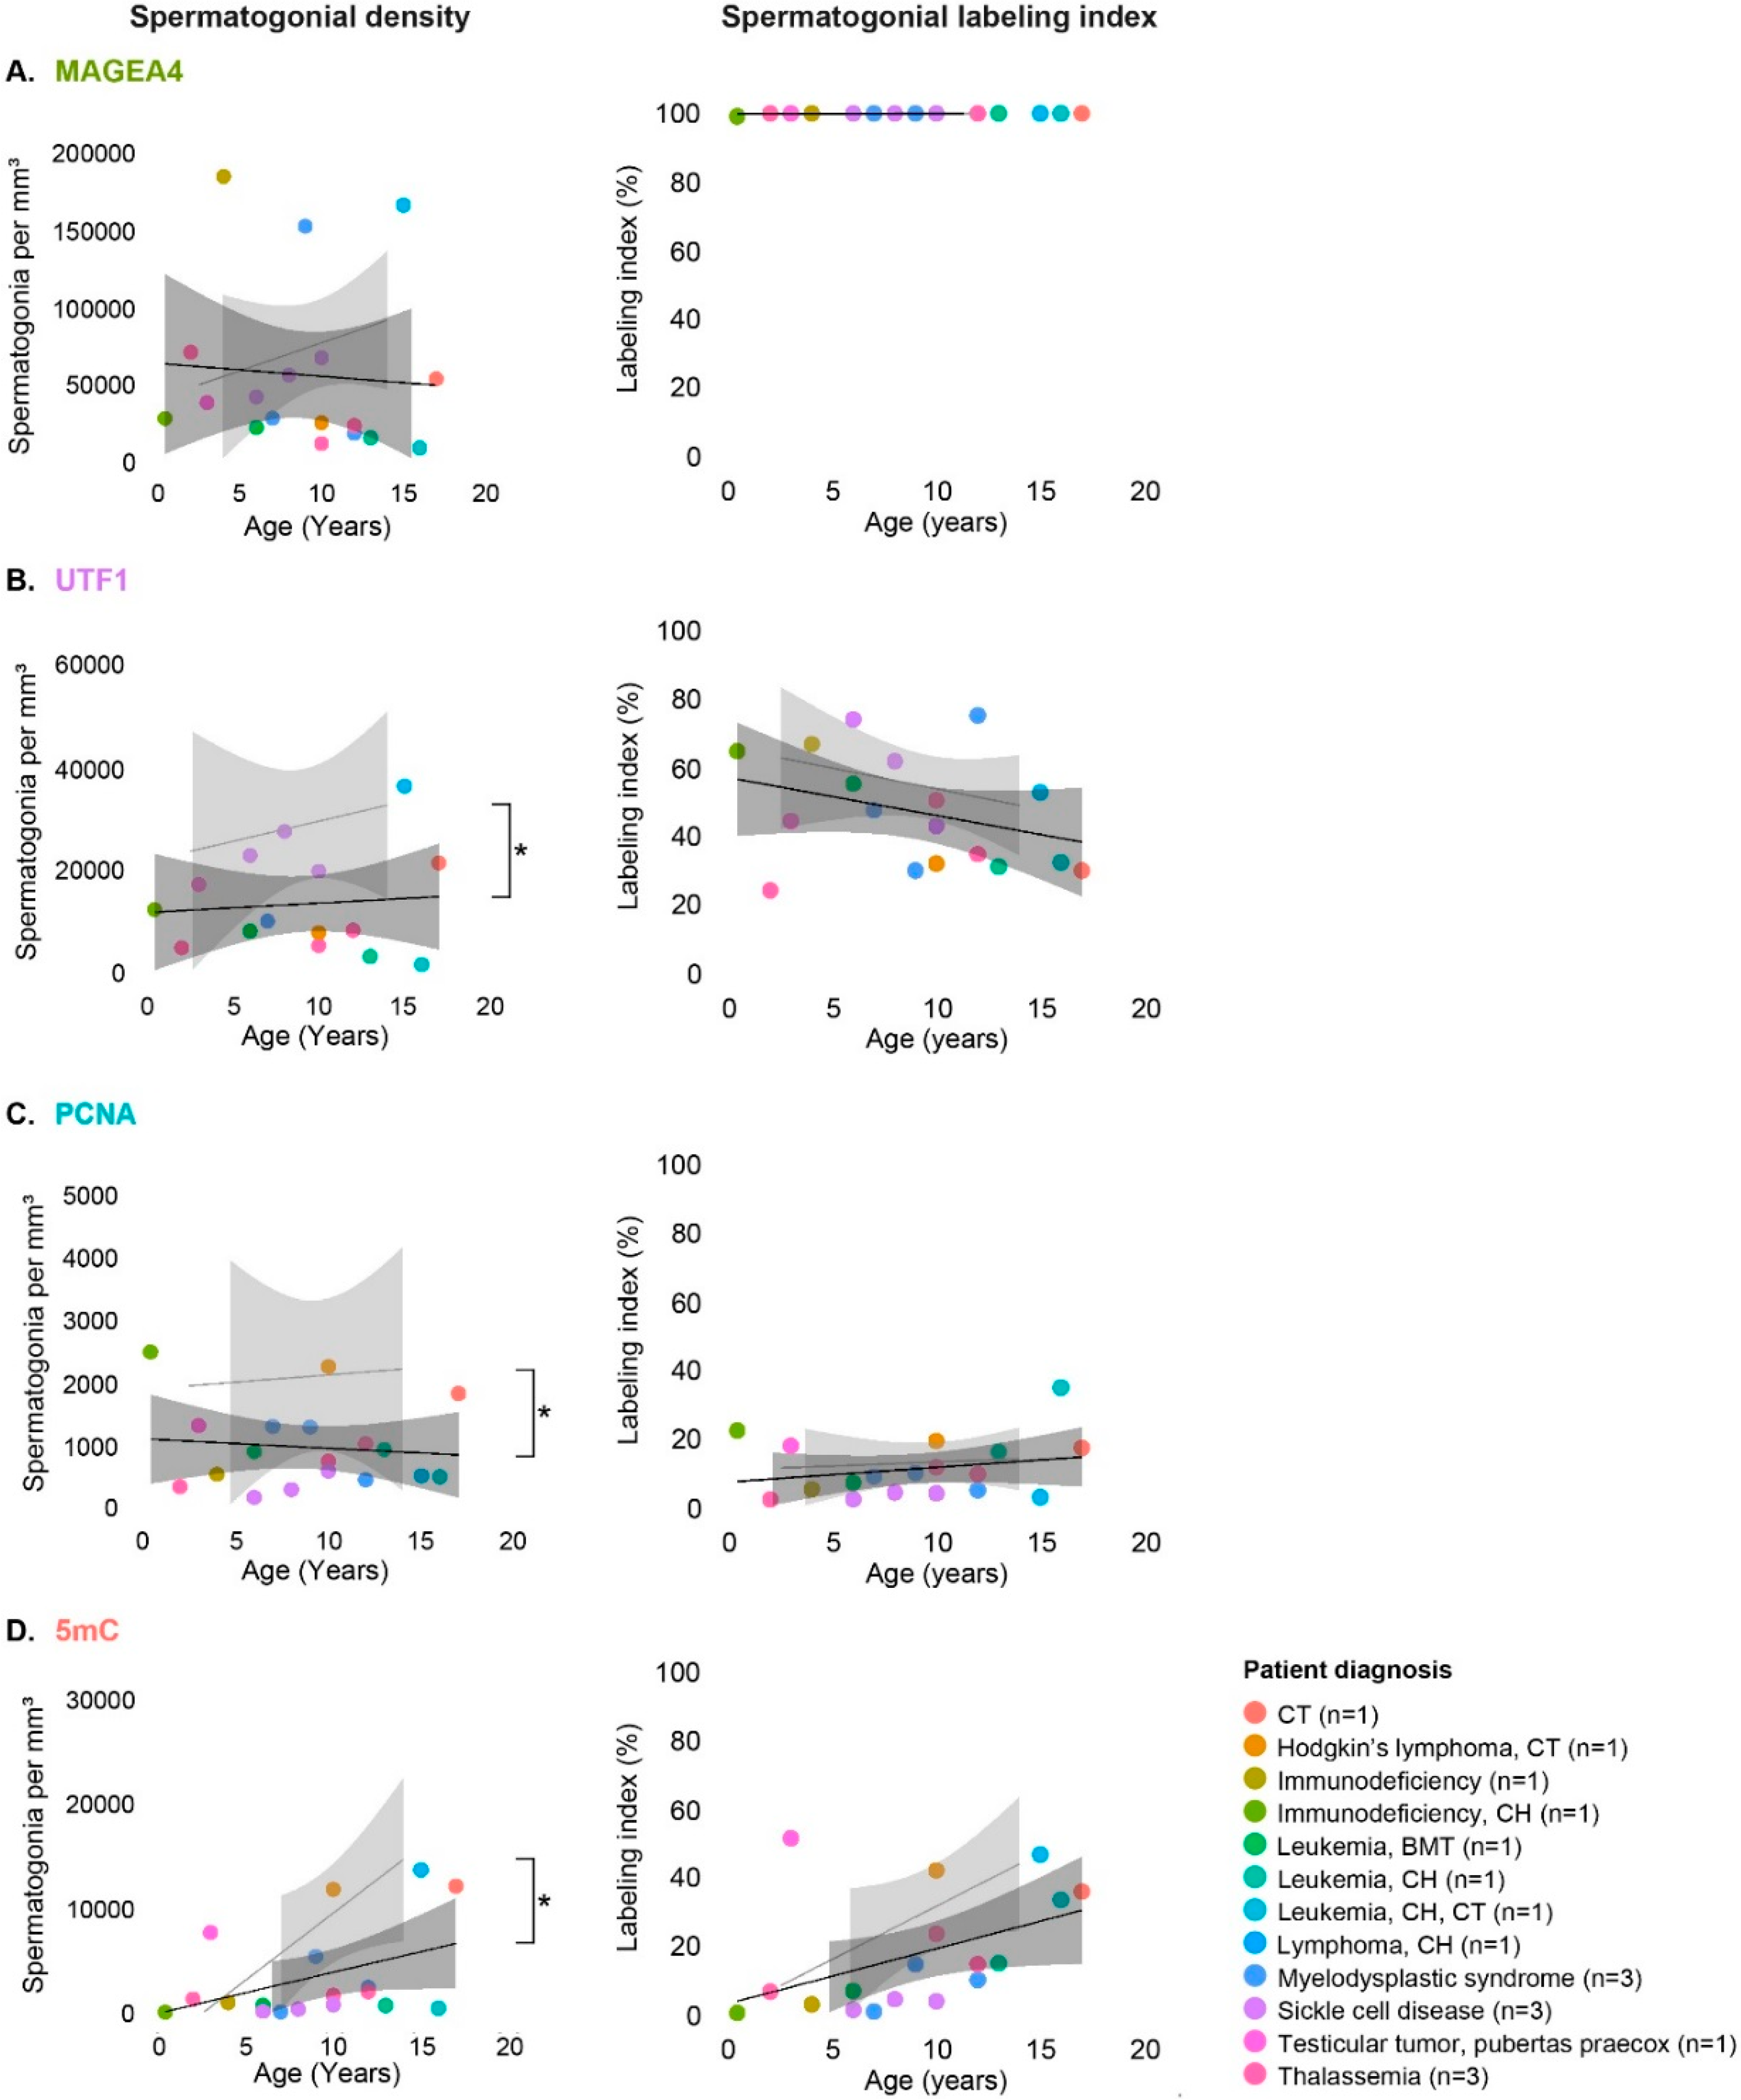
3.3. Spermatogonial Subpopulations in Testicular Tissues of Patients Affected by Disease or Treatment

The possible effect of underlying diseases and/or respective treatment on MAGEA4, UTF1, PCNA, and 5mC expression profiles in spermatogonia was evaluated by comparison of the AT group with the reference pattern established for normal testicular development (NT group).
Compared to the NT group, the density of MAGEA4-positive spermatogonia in tissues from the AT group (Table S2) was reduced with pubertal age, although without significance (Figure 4A). In contrast to this, the density of UTF1- (Figure 4B), PCNA- (Figure 4C), and 5mC-positive (Figure 4D) spermatogonia (Table S2) were significantly lower (p < 0.05) throughout age, compared to the reference values (NT group). Particularly the density of 5mC-positive spermatogonia appeared to be identical in younger patients but became significantly reduced with age.
Labeling indices were determined to unravel whether the reduction in the density of spermatogonia expressing MAGEA4, UTF1, PCNA, and 5mC was accompanied by altered ratios of these spermatogonial subpopulations. We found that the percentage of MAGEA4, UTF1, PCNA, and 5mC-positive spermatogonia in the AT patient group was not statistically different from the NT group (Figure 4).

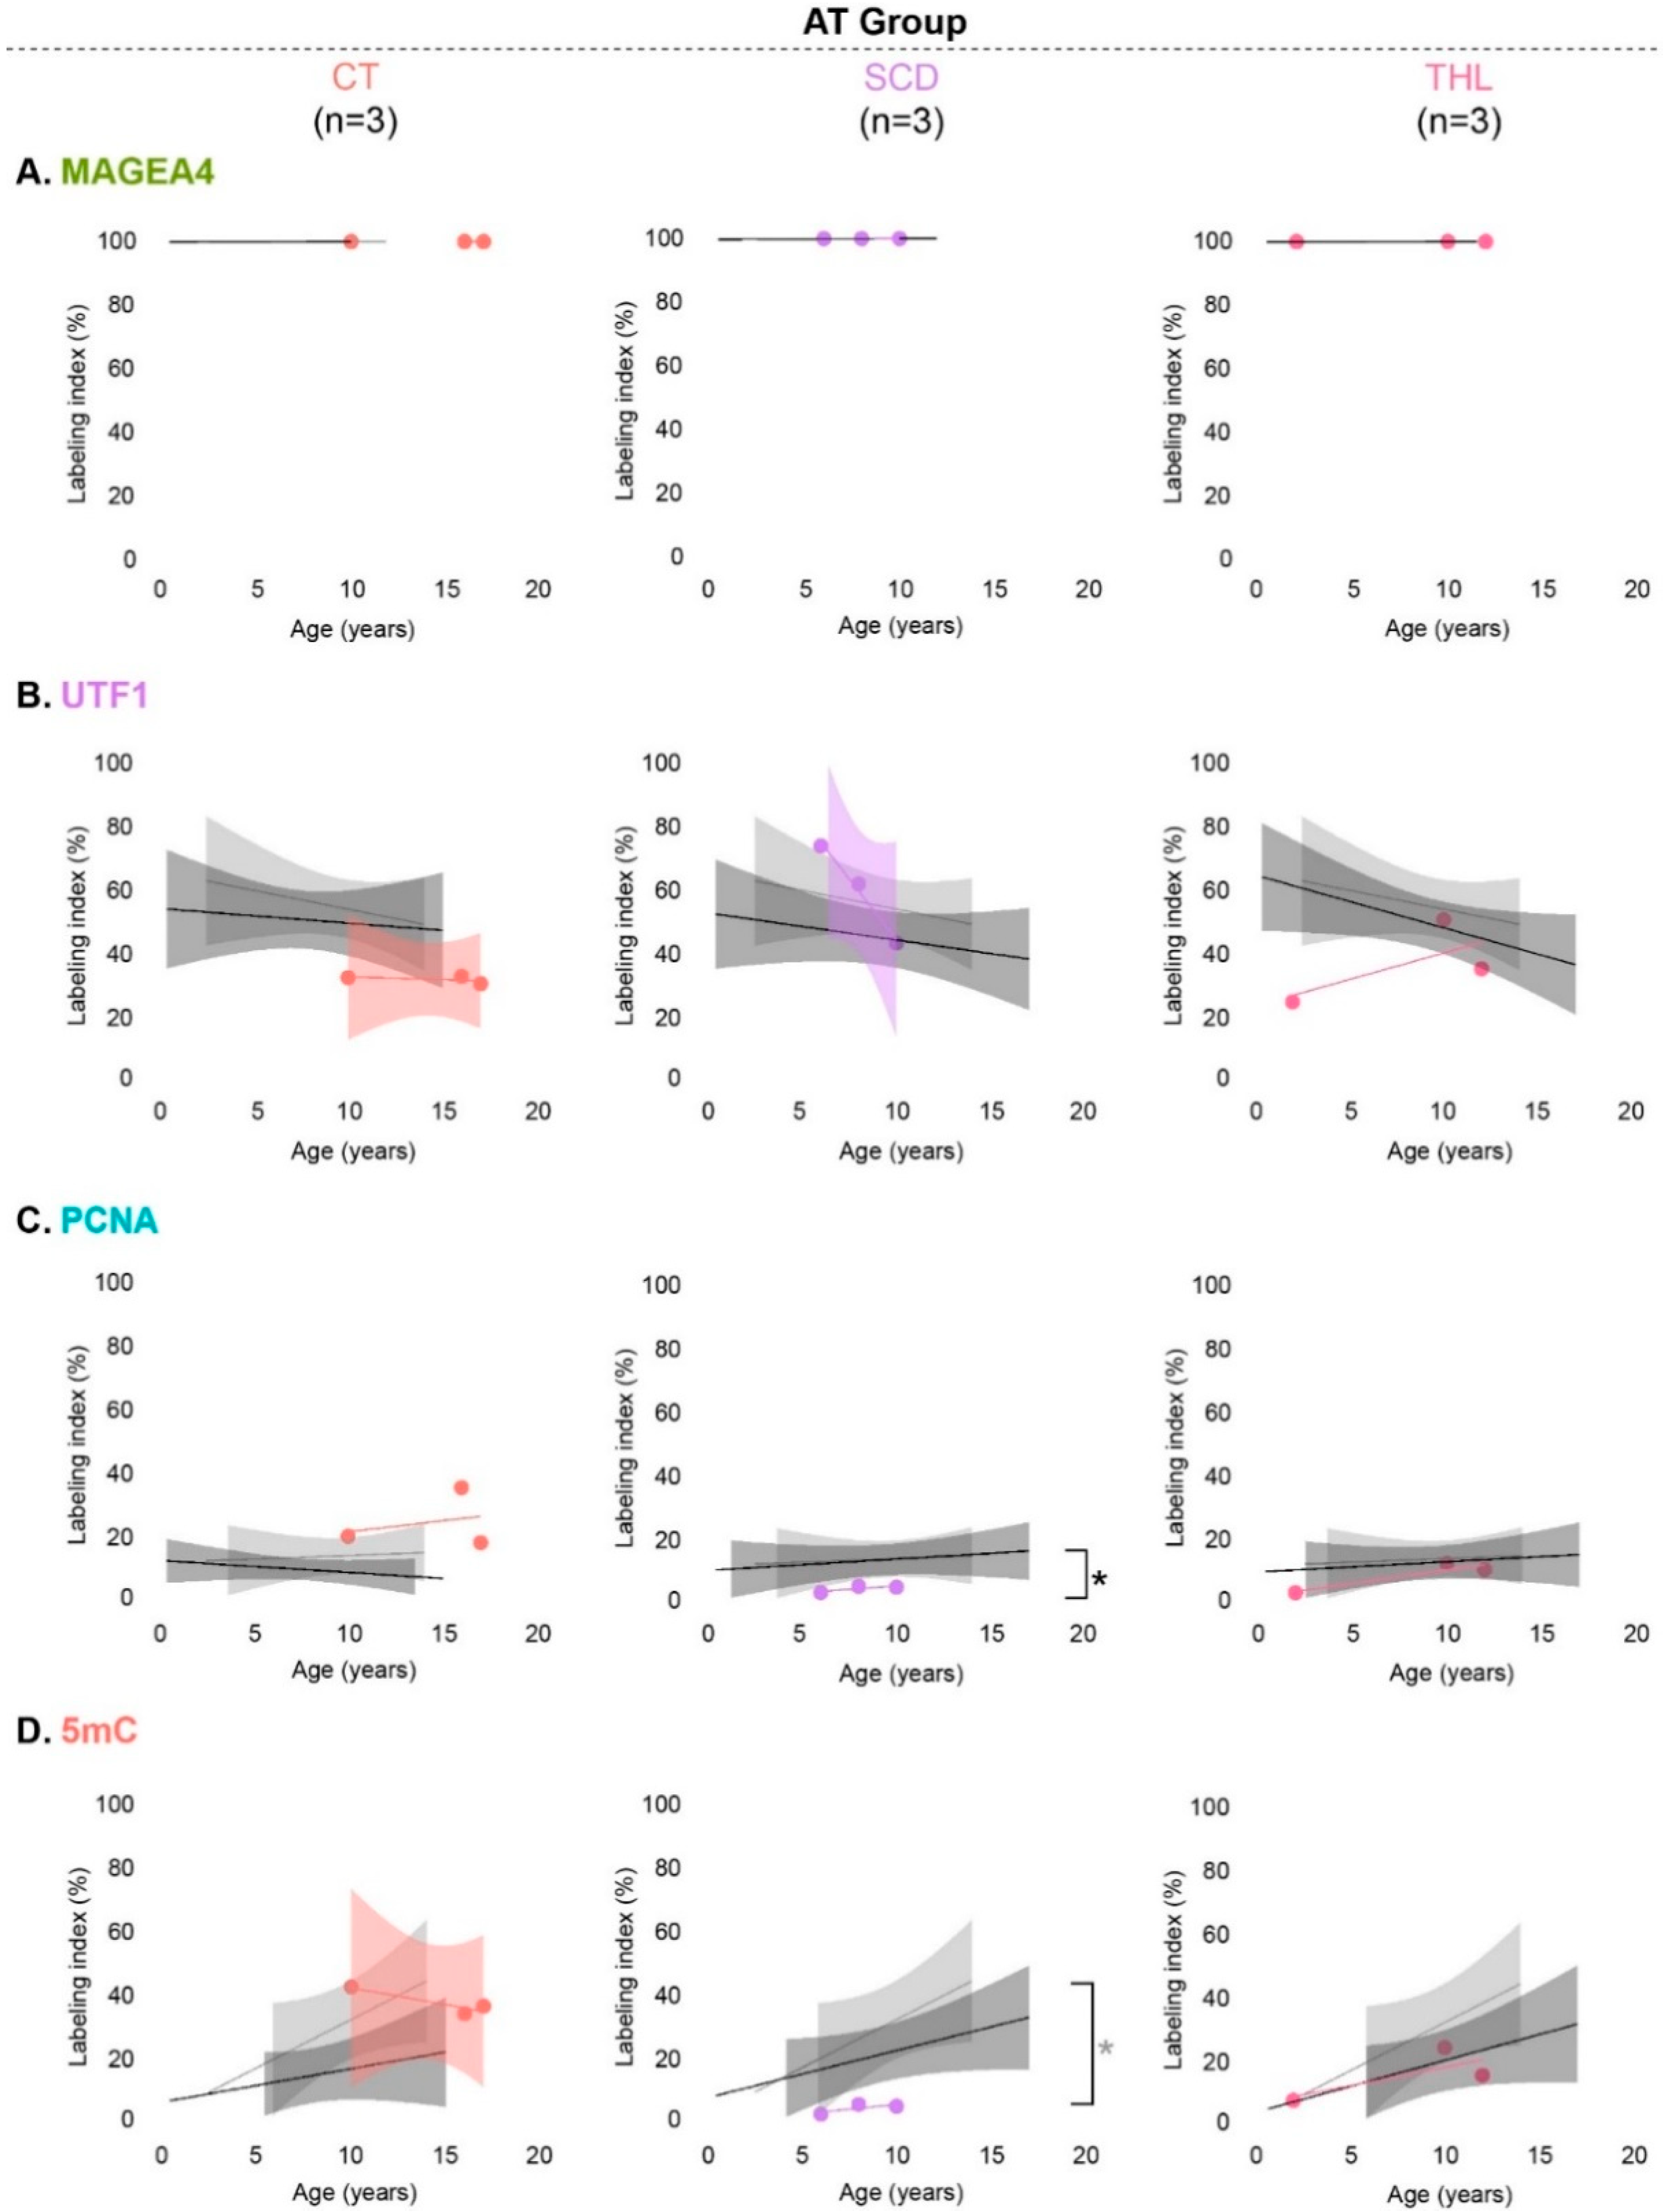
3.4. Spermatogonial Marker Expression in Patients with Cryptorchidism, Sickle Cell Disease and Thalassemia

As the AT group comprised patients with diverse diagnoses, we have further analyzed the most prominent pathologies including cryptorchidism (CT, n = 3), sickle cell disease (SCD, n = 3), and thalassemia (THL, n = 3) (Table 1). In cryptorchid patients, the densities of spermatogonia expressing each of the evaluated markers were comparable to the reference values of the NT group. In contrast, although the density of MAGEA4-positive spermatogonia in SCD patients’ was comparable to the NT group, significantly decreased density of 5mC-positive spermatogonia (p < 0.016) was found. In patients diagnosed with THL, the density of UTF1-positive spermatogonia was significantly lower, compared to the NT group (Figure S1).
Also in these subgroups of patients, labeling indices were determined to assess a potential percentage change in marker-positive spermatogonial subpopulations. Changes were observed only in the SCD patient group. More specifically, these patients had a significantly lower percentage of PCNA-positive spermatogonia compared with remaining samples within the AT group (n = 15, p < 0.016). Moreover, the SCD patients showed a significantly lower percentage of 5mC-positive spermatogonia (Figure 5D) compared to the reference values (NT group; p < 0.016).

4. Discussion

In this study, we determined the expression dynamics of spermatogonial subpopulations in the developing human prepubertal testes. By comparison, we have demonstrated that patients who, at the time of fertility preservation, are at risk for germ cell loss due to underlying diseases known to affect testicular function and/or already received potentially gonadotoxic treatment have reduced spermatogonial density while the ratios of spermatogonial subpopulations remain stable.
Due to limited access to healthy pre/pubertal testicular tissue, in our study, the spermatogonial expression patterns during testicular development were established for untreated cancer patients without any preexisting (congenital) risk factors for impaired testicular function. Reassuringly, Stukenborg et al. and Valli-Pulaski et al. recently reported that spermatogonial numbers per tubular cross section of untreated cancer patients were within the confidence interval of spermatogonial reference values previously established in healthy boys [10,15,21].
The numbers of total [21] and undifferentiated (UTF1-positive) [15] spermatogonial populations, as well as proliferative activity [20] are known to vary within age groups. In our patient cohort, the density of MAGEA4-, UTF1- and PCNA-positive spermatogonia showed a trend to increase with age, however without significance. This might be due to the fact that density of marker-expressing spermatogonia was evaluated throughout development as a continuum, to do justice to the interindividual heterogeneity during this period. In contrast, we demonstrate for the first time in human testicular tissues that the density of methylated spermatogonia (5mC-positive) significantly increased with age. The establishment of global DNA methylation in spermatogonia before initiation of spermatogenesis is essential for spermatogonial identity, differentiation potential, and correct transmission of epigenetic information to the next generation [24,34,38]. The importance of correct levels of DNA methylation for germ cell function is demonstrated by data showing the association of infertility with aberrant methylation levels in sperm [47]. Thus, defining the timing of establishment of DNA methylation throughout testicular development is crucial to investigate factors that can lead to disturbances of this process, as disease or exposure to treatments. While the majority of studies in the mouse model have shown perinatal acquisition of germ cells’ DNA methylation [48,49], in non-human primates (marmoset) establishment of methylation was suggested to be a gradual process occurring during postnatal development and completed in adulthood [39]. In agreement with the primate data, our results show that in human, testicular tissue establishment of global DNA methylation of spermatogonia occurs progressively during postnatal and pubertal development. Once established, methylation patterns of spermatogonia are maintained in subsequent differentiation stages [36,50] and are unaltered in adult patients with spermatogenic defects [34].
Accounting for interindividual variability of spermatogonial numbers, analysis of spermatogonial labeling indices were determined revealing that the percentage of MAGEA4-positive spermatogonia remained constant, whereas the percentages of undifferentiated (UTF1-positive), proliferative (PCNA-positive), and methylated (5mC-positive) spermatogonial subpopulations were dynamic during testicular development. The expression of MAGEA4 by most spermatogonia confirmed the diagnostic value of this marker for the detection of spermatogonia in prepubertal testicular tissues. The decreased trend of the spermatogonial labeling index for the undifferentiated subpopulation (UTF1-positive) together with an upward trend of proliferative spermatogonia (PCNA-positive) during testicular development are consistent with the dynamic changes of the seminiferous epithelium at the onset of puberty [23,24]. In our study, UTF1 and PCNA spermatogonial labeling indices of post-pubertal patients reached values identical to those previously described for the adult testis, where UTF1 and proliferating spermatogonia (KI67-positive), respectively, represented 43 ± 3% and 5 ± 2% of the total spermatogonia population [23]. Additionally, the PCNA spermatogonial labeling index we found during adulthood (70 ± 6.1 years) was comparable to the recently reported index for aged man (70.9 ± 6.2 years), which was around 35.4% of A-spermatogonia. Note that the five adult testicular tissues included in this study may not be representative for adult samples in general due to the limited number of samples and the advanced age of the men. This assumption is corroborated by the recent report that increased levels of spermatogonial proliferation throughout adult age can be observed, which might be a compensatory mechanism to maintain spermatogenesis [30].
Besides providing new insights to the current knowledge of spermatogonial subpopulation dynamics during human testicular development, our established reference expression patterns allowed the evaluation of the effect of treatment and/or diseases on spermatogonial composition. The patients included in the AT group showed a reduced density of UTF1-, PCNA-, and 5mC-positive spermatogonia. The constant density of MAGEA4-positive spermatogonia, but reduced densities of UTF1- and PCNA-positive spermatogonia throughout prepubertal age suggest that undifferentiated and proliferative spermatogonia are vulnerable to gonadotoxic treatment and/or diseases. Previous reports also showed no alterations in MAGEA4 spermatogonial density in prepubertal patients who received chemotherapy [4,5]. Further studies demonstrated that spermatogonial numbers do not differ between untreated cancer patients and patients receiving non-alkylating agents as treatment regime. In contrast, a significant spermatogonial depletion was observed in boys receiving alkylating therapies [9,10]. Recently, Valli-Pulaski et al. showed in a cohort of 137 patients no impact of previous exposure to either alkylating or non-alkylating chemotherapy on the number of UTF1-positive spermatogonia compared with patients prior to treatment [15]. This contradicting outcome may be due to the different approaches for spermatogonial quantification between studies. Although Valli-Pulaski et al. determined spermatogonial numbers per testicular tubular cross section, we quantified spermatogonia density within the total tissue section. We consider it highly likely that the spermatogonial density will be an essential factor for the outcome of experimental approaches aiming for fertility restoration [5]. This assumption is based on data reporting low efficiencies of spermatid production using in vitro spermatogenesis or recolonization of the testes following germ cell transplantation. Importantly, these data were derived employing intact testicular tissues from model organisms as starting material [51,52,53,54,55,56,57]. It is therefore likely that the chances for the successful use of immature human testicular tissues for future fertility restoration approaches will depend on the number and quality of spermatogonia present in the starting material.
To date, evaluation of spermatogonial methylation patterns in patients at risk of germ cell loss has never been considered. Our results show that disease and/or treatment (AT group) can impact establishment of spermatogonial methylation which might reflect delayed development and have consequences for initiation, completion, and maintenance of spermatogenesis.
It is well recognized that cryptorchidism is associated with a reduction of germ cell numbers, possibly depending on the age at orchidopexy [58,59,60,61]. Surprisingly, spermatogonial densities of cryptorchidic patients included in our cohort were comparable to the established reference values (NT group) for all evaluated markers. This data should however be interpreted with caution considering the low number of patients with cryptorchidism that were included in our study. Moreover, an approach providing higher resolution of morphological details, such as electron microscopy, may be required to gain insight into the potential changes of spermatogonial subtypes Adark, Apale, and B [62,63].
Testes of prepubertal boys treated with hydroxyurea for sickle cell disease were described to be depleted of spermatogonia [10,15]. Although spermatogonia expressing MAGEA4 were observed in treated sickle cell disease patients within our cohort with a density comparable to the NT reference group, a reduction of the 5mC spermatogonial subpopulation suggests a possible developmental arrest. Although this was corroborated by an increase of the undifferentiated UTF1-positive spermatogonia, this was not statistically significant, possibly due to the low number of patients. Although follow-up studies need to be performed, the altered spermatogonial methylation might be a possible reason for the previously reported spermatogonial depletion after hydroxyurea treatment since correct establishment of methylation is necessary for spermatogonial integrity and differentiation. Interestingly, in previous studies hydroxyurea treatment was also correlated with hypomethylation (specifically of the γ-globin gene promoter), albeit without statistical significance [64].

5. Conclusions

Our study provides crucial information on spermatogonial subpopulations of prepubertal boys included in fertility preservation programs. Despite the reduction of the spermatogonial density in the AT group compared to normal testicular development, the spermatogonial composition (labeling indices) remained unchanged. This result is of importance since the presence of unaltered spermatogonial subpopulations is crucial for fertility preservation and restoration. Interestingly, significantly lower density and percentage of 5mC-positive spermatogonia in patients with sickle cell disease indicate an arrested germ cell development. As this is a growing patient group in fertility preservation programs, this finding necessitates further analysis in follow-up studies to clarify the potential use of these cryopreserved tissue samples.

Supplementary Materials

The following are available online at https://www.mdpi.com/2077-0383/9/1/224/s1, Figure S1: Spermatogonial marker-specific density in patients with potentially affected testicular tissue (AT group) particularly due to cryptorchidism (CT), sickle cell disease (SCD), and thalassemia (THL) in comparison with established reference values (NT group) and patients within the AT group without the respective pathology. Table S1: Primary antibodies and immunohistochemistry protocol specifications. Table S2: Total number of evaluated cells and density of spermatogonia (Spg) evaluated for each patient (NT and AT groups) and adult controls (Ctrl).

Author Contributions

Conceptualization, N.N., J.W., S.K., A.M.M.v.P., and S.S.; methodology, J.M.D.P. and L.H.; formal analysis, J.M.D.P., L.H., and A.S.; writing—original draft preparation, J.M.D.P., L.H., and N.N. All authors have read and agreed to the published version of the manuscript.

Funding

This study was funded by the “Ministerium für Innovation, Wissenschaft und Forschung des Landes Nordrhein-Westfalen” (PtJ-Az.: z1403ts006) and the German research foundation (Clinical Research Unit CRU326 to N.N. and S.S.). This work was also supported by EU-FP7-PEOPLE-2013-ITN 603568: ‘Growsperm’ with a PhD fellowship for J.P.

Acknowledgments

For preparations and cryopreservation of prepubertal boys’ tissue, we thank Daniela Hanke, Jolanta Körber, Raphaele Kürten, Andreas Meißner, and Annemieke de Melker. We thank Jutta Salzig for technical support.

Conflicts of Interest

The authors declare no conflicts of interest.

References

  1. Wikstrom, A.M.; Raivo, T.; Hadziselimovic, F.; Wikstrom, S.; Tuuri, T.; Dunkel, L. Klinefelter syndrome in adolescence: Onset of puberty is associated with accelerated germ cell depletion. J. Clin. Endocrinol. Metab. 2004, 89, 2263–2270. [Google Scholar] [CrossRef] [PubMed]
  2. Aksglaede, L.; Wikström, A.M.; Rajpert-De Meyts, E.; Dunkel, L.; Skakkebaek, N.E.; Juul, A. Natural history of seminiferous tubule degeneration in Klinefelter syndrome. Hum. Reprod. Update 2006, 12, 39–48. [Google Scholar] [CrossRef] [PubMed]
  3. Stukenborg, J.B.; Kjartansdóttir, K.R.; Reda, A.; Colon, E.; Albersmeier, J.P.; Söder, O. Male germ cell development in humans. Horm. Res. Paediatr. 2014, 81, 2–12. [Google Scholar] [CrossRef] [PubMed]
  4. Van Saen, D.; Pino Sánchez, J.; Ferster, A.; Van Der Werff Ten Bosch, J.; Tournaye, H.; Goossens, E. Is the protein expression window during testicular development affected in patients at risk for stem cell loss? Hum. Reprod. 2015, 30, 2859–2870. [Google Scholar] [CrossRef] [PubMed] [Green Version]
  5. Heckmann, L.; Langenstroth-Röwer, D.; Pock, T.; Wistuba, J.; Stukenborg, J.B.; Zitzmann, M.; Kliesch, S.; Schlatt, S.; Neuhaus, N. A diagnostic germ cell score for immature testicular tissue at risk of germ cell loss. Hum. Reprod. 2018, 33, 636–645. [Google Scholar] [CrossRef] [PubMed] [Green Version]
  6. Crofton, P.M.; Thomson, A.B.; Evans, A.E.; Groome, N.P.; Bath, L.E.; Kelnar, C.J.; Wallace, W.H. Is inhibin B a potential marker of gonadotoxicity in prepubertal children treated for cancer? Clin. Endocrinol. 2003, 58, 296–301. [Google Scholar] [CrossRef]
  7. Wigny, K.M.; Van Dorp, W.; Van Der Kooi, A.L.; De Rijke, Y.B.; De Vries, A.C.; Smit, M.; Pluijm, S.M.; Van Den Akker, E.L.; Pieters, R.; Laven, J.S.; et al. Gonadal function in boys with newly diagnosed cancer before the start of treatment. Hum. Reprod. 2016, 31, 2613–2618. [Google Scholar] [CrossRef]
  8. Maymon, B.B.S.; Yogev, L.; Marks, A.; Hauser, R.; Botchan, A.; Yavetz, H. Sertoli cell inactivation by cytotoxic damage to the human testis after cancer chemotherapy. Fertil. Steril. 2014, 81, 1391–1394. [Google Scholar] [CrossRef]
  9. Poganitsch-Korhonen, M.; Masliukaite, I.; Nurmio, M.; Lähteenmäki, P.; Van Wely, M.; Van Pelt, A.M.M.; Jahnukainen, K.; Stukenborg, J.B. Decreased spermatogonial quantity in prepubertal boys with leukaemia treated with alkylating agents. Leukemia 2017, 31, 1460–1463. [Google Scholar] [CrossRef]
  10. Stukenborg, J.B.; Alves-Lopes, J.P.; Kurek, M.; Albalushi, H.; Reda, A.; Keros, V.; Töhönen, V.; Bjarnason, R.; Romerius, P.; Sundin, M.; et al. Spermatogonial quantity in human prepubertal testicular tissue collected for fertility preservation prior to potentially sterilizing therapy. Hum. Reprod. 2018, 33, 1677–1683. [Google Scholar] [CrossRef]
  11. Jahnukainen, K.; Ehmcke, J.; Hou, M.; Schlatt, S. Testicular function and fertility preservation in male cancer patients. Best Pract. Res. Clin. Endocrinol. Metab. 2011, 25, 287–302. [Google Scholar] [CrossRef] [PubMed]
  12. Jahnukainen, K.; Mitchell, R.T.; Stukenborg, J.B. Testicular function and fertility preservation after treatment for haematological cancer. Curr. Opin. Endocrinol. Diabetes Obes. 2015, 22, 217–223. [Google Scholar] [CrossRef] [PubMed]
  13. Green, D.M.; Nolan, V.G.; Goodman, P.J.; Whitton, J.A.; Srivastava, D.; Leisenring, W.M.; Neglia, J.P.; Sklar, C.A.; Kaste, S.C.; Hudson, M.M.; et al. The cyclophosphamide equivalent dose as an approach for quantifying alkylating agent exposure: A report from the Childhood Cancer Survivor Study. Pediatr. Blood Cancer 2014, 61, 53–67. [Google Scholar] [CrossRef] [Green Version]
  14. Picton, H.M.; Wyns, C.; Anderson, R.A.; Goossens, E.; Jahnukainen, K.; Kliesch, S.; Mitchell, R.T.; Pennings, G.; Rives, N.; Tournaye, H.; et al. A European perspective on testicular tissue cryopreservation for fertility preservation in prepubertal and adolescent boys. Hum. Reprod. 2015, 30, 2463–2475. [Google Scholar] [CrossRef] [PubMed]
  15. Valli-Pulaski, H.; Peters, K.A.; Gassei, K.; Steimer, S.R.; Sukhwani, M.; Hermann, B.P.; Dwomor, L.; David, S.; Fayomi, A.P.; Munyoki, S.K.; et al. Testicular tissue cryopreservation: 8 years of experience from a coordinated network of academic centers. Hum. Reprod. 2019, 34, 966–977. [Google Scholar] [CrossRef]
  16. Gaskell, T.L.; Esnal, A.; Robinson, L.L.; Anderson, R.A.; Saunders, P.T. Immunohistochemical profiling of germ cells within the human fetal testis: Identification of three subpopulations. Biol. Reprod. 2004, 71, 2012–2021. [Google Scholar] [CrossRef] [PubMed]
  17. Honecker, F.; Stoop, H.; De Krijger, R.R.; Chris Lau, Y.F.; Bokemeyer, C.; Looijenga, L.H. Pathobiological implications of the expression of markers of testicular carcinoma in situ by fetal germ cells. J. Pathol. 2004, 203, 849–857. [Google Scholar] [CrossRef]
  18. Mitchell, R.T.; Cowan, G.; Morris, K.D.; Anderson, R.A.; Fraser, H.M.; Mckenzie, K.J.; Wallace, W.H.; Kelnar, C.J.; Saunders, P.T.; Sharpe, R.M. Germ cell differentiation in the marmoset (Callithrix jacchus) during fetal and neonatal life closely parallels that in the human. Hum. Reprod. 2008, 23, 2755–2765. [Google Scholar] [CrossRef] [Green Version]
  19. Steger, K.; Aleithe, I.; Behre, H.; Bergmann, M. The proliferation of spermatogonia in normal and pathological human seminiferous epithelium: An immunohistochemical study using monoclonal antibodies against Ki-67 protein and proliferating cell nuclear antigen. Mol. Hum. Reprod. 1998, 4, 227–233. [Google Scholar] [CrossRef] [Green Version]
  20. Berensztein, E.B.; Sciara, M.I.; Rivarola, M.A.; Belgorosky, A. Apoptosis and proliferation of human testicular somatic and germ cells during prepuberty: High rate of testicular growth in newborns mediated by decreased apoptosis. J. Clin. Endocrinol. Metab. 2002, 87, 5113–5118. [Google Scholar] [CrossRef] [Green Version]
  21. Masliukaite, I.; Hagen, J.M.; Jahnukainen, K.; Stukenborg, J.B.; Repping, S.; Van Der Veen, F.; Van Wely, M.; Van Pelt, A.M. Establishing reference values for age-related spermatogonial quantity in prepubertal human testes: A systematic review and meta-analysis. Fertil. Steril. 2016, 106, 1652–1657. [Google Scholar] [CrossRef] [PubMed] [Green Version]
  22. Von Kopylow, K.; Staege, H.; Spiess, A.N.; Schulze, W.; Will, H.; Primig, M.; Kirchhoff, C. Differential marker protein expression specifies rarefaction zone-containing human Adark spermatogonia. Reproduction 2012, 143, 45–57. [Google Scholar] [CrossRef] [PubMed] [Green Version]
  23. Di Persio, S.; Saracino, R.; Fera, S.; Muciaccia, B.; Esposito, V.; Boitani, C.; Berloco, B.P.; Nudo, F.; Spadetta, G.; Stefanini, M.; et al. Spermatogonial kinetics in humans. Development 2017, 144, 3430–3439. [Google Scholar] [CrossRef] [PubMed] [Green Version]
  24. Guo, J.; Grow, E.J.; Mlcochova, H.; Maher, G.J.; Lindskog, C.; Nie, X.; Guo, Y.; Takei, Y.; Yun, J.; Cai, L.; et al. The adult human testis; transcriptional cell atlas. Cell Res. 2018, 28, 1141–1157. [Google Scholar] [CrossRef]
  25. Hermann, B.P.; Cheng, K.; Singh, A.; Roa-De La Cruz, L.; Mutoji, K.N.; Chen, I.C.; Gildersleeve, H.; Lehle, J.D.; Mayo, M.; Westernströer, B.; et al. The mammalian spermatogenesis single-cell transcriptome, from spermatogonial stem cells to spermatids. Cell Rep. 2018, 25, 1650–1667. [Google Scholar] [CrossRef] [Green Version]
  26. Wang, M.; Liu, X.; Chang, G.; Chen, Y.; An, G.; Yan, L.; Gao, S.; Xu, Y.; Cui, Y.; Dong, J.; et al. Single-cell RNA sequencing analysis reveals sequential cell fate transition during human spermatogenesis. Cell Stem Cell 2018, 23, 599–614. [Google Scholar] [CrossRef] [Green Version]
  27. Sohni, A.; Tan, K.; Song, H.W.; Burow, D.; De Rooij, D.G.; Laurent, L.; Hsieh, T.C.; Rabah, R.; Hammoud, S.S.; Vicini, E.; et al. The neonatal and adult human testis defined at the single-cell level. Cell Rep. 2019, 26, 1501–1517. [Google Scholar] [CrossRef] [Green Version]
  28. Takahashi, K.; Shichijo, S.; Noguchi, M.; Hirohata, M.; Itoh, K. Identification of MAGE-1 and MAGE-4 proteins in spermatogonia and primary spermatocytes of testis. Cancer Res. 1995, 55, 3478–3482. [Google Scholar]
  29. Aubry, F.; Satie, A.P.; Rioux-Leclercq, N.; Rajpert-De Meyts, E.; Spagnoli, G.C.; Chomez, P.; De Backer, O.; Jégou, B.; Samson, M. MAGE-A4, a germ cell specific marker, is expressed differentially in testicular tumors. Cancer 2001, 92, 2778–2785. [Google Scholar] [CrossRef]
  30. Pohl, E.; Höffken, V.; Schlatt, S.; Kliesch, S.; Gromoll, J.; Wistuba, J. Ageing in men with normal spermatogenesis alters spermatogonial dynamics and nuclearmorphology in Sertoli cells. Andrology 2019, in press. [Google Scholar] [CrossRef]
  31. Kristensen, D.M.; Nielsen, J.E.; Skakkebaek, N.E.; Graem, N.; Jacobsen, G.K.; Rajpert-De Meyts, E.; Leffers, H. Presumed pluripotency markers UTF-1 and REX-1 are expressed in human adult testes and germ cell neoplasms. Hum. Reprod. 2008, 23, 775–782. [Google Scholar] [CrossRef] [PubMed] [Green Version]
  32. Von Kopylow, K.; Kirchhoff, C.; Jezek, D.; Schulze, W.; Feig, C.; Primig, M.; Steinkraus, V.; Spiess, A.N. Screening for biomarkers of spermatogonia within the human testis: A whole genome approach. Hum. Reprod. 2010, 25, 1104–1112. [Google Scholar] [CrossRef] [PubMed] [Green Version]
  33. Guo, J.; Grow, E.J.; Yi, C.; Mlcochova, H.; Maher, G.J.; Lindskog, C.; Murphy, P.J.; Wike, C.L.; Carrell, D.T.; Goriely, A.; et al. Chromatin and single-cell RNA-seq profiling reveal dynamic signaling and metabolic transitions during human spermatogonial stem cell development. Cell Stem Cell 2017, 21, 533–546. [Google Scholar] [CrossRef] [PubMed] [Green Version]
  34. Adiga, S.K.; Ehmcke, J.; Schlatt, S.; Kliesch, S.; Westernströer, B.; Luetjens, C.M.; Wistuba, J.; Gromoll, J. Reduced expression of DNMT3B in the germ cells of patients with bilateral spermatogenic arrest does not lead to changes in the global methylation status. Mol. Hum. Reprod. 2011, 17, 545–549. [Google Scholar] [CrossRef] [PubMed] [Green Version]
  35. Nettersheim, D.; Heukamp, L.C.; Fronhoffs, F.; Grewe, M.J.; Haas, N.; Waha, A.; Honecker, F.; Waha, A.; Kristiansen, G.; Schorle, H. Analysis of TET expression/activity and 5mC oxidation during normal and malignant germ cell development. PLoS ONE 2013, 8, e82881. [Google Scholar] [CrossRef] [PubMed]
  36. Fend-Guella, D.L.; Von Kopylow, K.; Spiess, A.N.; Schulze, W.; Salzbrunn, A.; Diederich, S.; El Hajj, N.; Haaf, T.; Zechner, U.; Linke, M. The DNA methylation profile of human spermatogonia at single-cell-and single-allele-resolution refutes its role in spermatogonial stem cell function and germ cell differentiation. Mol. Hum. Reprod. 2019, 25, 283–294. [Google Scholar] [CrossRef]
  37. Kaneda, M.; Okano, M.; Hata, K.; Sado, T.; Tsujimoto, N.; Li, E.; Sasaki, H. Essential role for de novo DNA methyltransferase Dnmt3a in paternal and maternal imprinting. Nature 2004, 429, 900–903. [Google Scholar] [CrossRef]
  38. Urdinguio, R.G.; Bayón, G.F.; Dmitrijeva, M.; Toraño, E.G.; Bravo, C.; Fraga, M.F.; Bassas, L.; Larriba, S.; Fernández, A.F. Aberrant DNA methylation patterns of spermatozoa in men with unexplained infertility. Hum. Reprod. 2015, 30, 1014–1028. [Google Scholar] [CrossRef] [Green Version]
  39. Langenstroth-Röwer, D.; Gromoll, J.; Wistuba, J.; Tröndle, I.; Laurentino, S.; Schlatt, S.; Neuhaus, N. De novo methylation in male germ cells of the common marmoset monkey occurs during postnatal development and is maintained in vitro. Epigenetics 2017, 12, 527–539. [Google Scholar] [CrossRef]
  40. Behre, H.M.; Nashan, D.; Nieschlag, E. Objective measurement of testicular volume by ultrasonography: Evaluation of the technique and comparison with orchidometer estimates. Int. J. Androl. 1989, 12, 395–403. [Google Scholar] [CrossRef]
  41. Uijldert, M.; Meißner, A.; De Melker, A.A.; Van Pelt, A.M.M.; Van De Wetering, M.D.; Van Rijn, R.R.; Van Wely, M.; Van Der Veen, F.; Repping, S. Development of the testis in pre-pubertal boys with cancer after biopsy for fertility preservation. Hum. Reprod. 2017, 32, 2366–2372. [Google Scholar] [CrossRef] [PubMed]
  42. Pohl, E.; Gromoll, J.; Kliesch, S.; Wistuba, J. An alternative interpretation of cellular ‘selfish spermatogonial selection’-clusters in the human testis indicates the need for 3-D-analyses. Andrology 2016, 4, 213–217. [Google Scholar] [CrossRef] [PubMed] [Green Version]
  43. Bergmann, M.; Kliesch, S. Testicular biopsy and histology. In Andrology Male Reproductive Health and Dysfunction; Nieschlag, E., Behre, H.M., Nieschlag, S., Eds.; Springer: Berlin/Heidelberg, Germany, 2010; pp. 155–167. [Google Scholar]
  44. Albert, S.; Wistuba, J.; Eildermann, K.; Ehmcke, J.; Schlatt, S.; Gromoll, J.; Kossack, N. Comparative marker analysis after isolation and culture of testicular cells from the immature marmoset. Cells Tissues Organs 2012, 196, 543–554. [Google Scholar] [CrossRef] [PubMed]
  45. Paniagua, R.; Nistal, M. Morphological and histometric study of human spermatogonia from birth to the onset of puberty. J. Anat. 1984, 139, 535–552. [Google Scholar]
  46. Gundersen, H.J.G.; Jensen, E.B. Stereological estimation of the volume weighted mean volume of arbitrary particles observed on random sections. J. Microsc. 1985, 138, 127–142. [Google Scholar] [CrossRef]
  47. Laurentino, S.; Borgmann, J.; Gromoll, J. On the origin of sperm epigenetic heterogeneity. Reproduction 2016, 151, R71–R78. [Google Scholar] [CrossRef] [Green Version]
  48. Kafri, T.; Ariel, M.; Brandeis, M.; Shemer, R.; Urven, L.; McCarrey, J.; Cedar, H.; Razin, A. Developmental pattern of gene-specific DNA methylation in the mouse embryo and germ line. Genes Dev. 1992, 6, 705–714. [Google Scholar] [CrossRef] [Green Version]
  49. Kubo, N.; Toh, H.; Shirane, K.; Shirakawa, T.; Kobayashi, H.; Sato, T.; Sone, H.; Sato, Y.; Tomizawa, S.; Tsurusaki, Y.; et al. DNA methylation and gene expression dynamics during spermatogonial stem cell differentiation in the early postnatal mouse testis. BMC Genom. 2015, 16, 624. [Google Scholar] [CrossRef] [Green Version]
  50. Marques, C.J.; Joao Pinho, M.; Carvalho, F.; Bieche, I.; Barros, A.; Sousa, M. DNA methylation imprinting marks and DNA methyltransferase expression in human spermatogenic cell stages. Epigenetics 2011, 6, 1354–1361. [Google Scholar] [CrossRef] [Green Version]
  51. Nagano, M.C. Homing efficiency and proliferation kinetics of male germ line stem cells following transplantation in mice. Biol. Reprod. 2003, 69, 701–707. [Google Scholar] [CrossRef]
  52. Hermann, B.P.; Sukhwani, M.; Winkler, F.; Pascarella, J.N.; Peters, K.A.; Sheng, Y.; Valli, H.; Rodriguez, M.; Ezzelarab, M.; Daego, G.; et al. Spermatogonial stem cell transplantation into rhesus testes regenerates spermatogenesis producing functional sperm. Cell Stem Cell 2012, 11, 715–726. [Google Scholar] [CrossRef] [PubMed] [Green Version]
  53. Reda, A.; Hou, M.; Winton, T.R.; Chapin, R.E.; Söder, O.; Stukenborg, J.B. In vitro differentiation of rat spermatogonia into round spermatids in tissue culture. Mol. Hum. Reprod. 2016, 22, 601–612. [Google Scholar] [CrossRef] [PubMed] [Green Version]
  54. Dumont, L.; Arkoun, B.; Jumeau, F.; Milazzo, J.P.; Bironneau, A.; Liot, D.; Wils, J.; Rondanino, C.; Rives, N. Assessment of the optimal vitrification protocol for pre-pubertal mice testes leading to successful in vitro production of flagellated spermatozoa. Andrology 2015, 3, 611–625. [Google Scholar] [CrossRef] [PubMed] [Green Version]
  55. De Michele, F.; Poels, J.; Vermeulen, M.; Ambroise, J.; Gruson, D.; Guiot, Y.; Wyns, C. Haploid germ cells generated in organotypic culture of testicular tissue from prepubertal boys. Front. Physiol. 2018, 9, 1413. [Google Scholar] [CrossRef]
  56. Jahnukainen, K.; Ehmcke, J.; Schlatt, S. Testicular xenografts: A novel approach to study cytotoxic damage in juvenile primate testis. Cancer Res. 2006, 66, 3813–3818. [Google Scholar] [CrossRef] [Green Version]
  57. Jahnukainen, K.; Ehmcke, J.; Nurmio, M.; Schlatt, S. Autologous ectopic grafting of cryopreserved testicular tissue preserves the fertility of prepubescent monkeys that receive sterilizing cytotoxic therapy. Cancer Res. 2012, 72, 5174–5178. [Google Scholar] [CrossRef] [Green Version]
  58. Cortes, D.; Thorup, J.M.; Beck, B.L. Quantitative histology of germ cells in the undescended testes of human fetuses, neonates and infants. J. Urol. 1995, 154, 1188–1192. [Google Scholar] [CrossRef]
  59. Nistal, M.; Riestra, M.L.; Paniagua, R. Correlation between testicular biopsies (prepubertal and postpubertal) and spermiogram in cryptorchid men. Hum. Pathol. 2000, 31, 1022–1030. [Google Scholar] [CrossRef]
  60. Li, R.; Thorup, J.; Sun, C.; Cortes, D.; Southwell, B.; Hutson, J. Immunofluorescent analysis of testicular biopsies with germ cell and Sertoli cell markers shows significant MVH negative germ cell depletion with older age at orchiopexy. J. Urol. 2014, 191, 458–464. [Google Scholar] [CrossRef]
  61. Hadziselimovic, F.; Herzog, B. The importance of both an early orchidopexy and germ cell maturation for fertility. Lancet 2001, 358, 1156–1157. [Google Scholar] [CrossRef]
  62. Seguchi, H.; Hadziselimović, F. Ultramicroscopic studies on the seminiferous tubule in children from birth to puberty. I. Spermatogonia development. Verh. Anat. Ges. 1974, 68, 133–148. [Google Scholar]
  63. Hadziselimovic, F.; Hocht, B.; Herzog, B.; Buser, M.W. Infertility in cryptorchidism is linked to the stage of germ cell development at orchidopexy. Horm. Res. 2007, 68, 46–52. [Google Scholar] [CrossRef]
  64. Walker, A.L.; Steward, S.; Howard, T.A.; Mortier, N.; Smeltzer, M.; Wang, Y.; Ware, R.E. Epigenetic and molecular profiles of erythroid cells after hydroxyurea treatment in sickle cell anemia. Blood 2011, 118, 5664–5670. [Google Scholar] [CrossRef] [Green Version]
Figure 1. Spermatogonial expression of MAGEA4 and UTF1 throughout age. (A) Immunohistochemical identification of MAGEA4-positive (brown) spermatogonia at several testicular developmental stages. Scale bar: 20 µm. (B) Density and labeling index (%) of MAGEA4-positive spermatogonia during normal development (NT group) and adulthood. (C) Immunohistochemical identification of UTF1-positive (brown) spermatogonia at several testicular developmental stages. Scale bar: 20 µm. (D) Density and labeling index (%) of UTF1-positive spermatogonia during normal development (NT group) and adulthood. Individual values, trend line, and 95% confidence interval are represented. Generalized linear models were used to predict the response of labeling index based on the patients’ age.
Jcm 09 00224 g001
Figure 2. Spermatogonial expression of PCNA and 5mC throughout age. (A) Immunohistochemical identification of PCNA-positive (brown) spermatogonia at several testicular developmental stages. Scale bar: 20 µm. (B) Density and labeling index (%) of PCNA-positive spermatogonia during normal development (NT group) and adulthood. (C) Immunohistochemical identification of 5mC-positive (brown) spermatogonia at several testicular developmental stages. Scale bar: 20 µm. (D) Density and labeling index (%) of 5mC-positive spermatogonia during normal development (NT group) and adulthood. Individual values, trend line, and 95% confidence interval are represented. Generalized linear models were used to predict the response of labeling index based on the patients’ age. Statistically significant difference is represented as * p < 0.05.
Jcm 09 00224 g002
Figure 3. Schematic representation of the dynamic spermatogonial labeling index (%) in testicular tubular cross-sections during normal testicular development. Expression patterns of MAGEA4 (green), UTF1 (purple), 5mC (pink), and PCNA (blue) are the result of smooth interpolation of the data.
Jcm 09 00224 g003
Figure 4. Spermatogonial density and labeling indices (%) of patients with potentially affected tissue by disease and/or treatment (AT group) compared with established values during normal testicular development (NT group). (A) MAGEA4, (B) UTF1, (C) PCNA, and (D) 5mC labeling index. Results for each AT patient are represented with individual dots colored according to diagnosis. Previously established reference values throughout age (NT group) are represented as light-gray area (95% confidence interval). Wilcoxon rank-sum test was used to compare labeling indices of the AT group with the reference during testicular development. Statistically significant difference is represented as * p < 0.05. Abbreviations: CT—cryptorchid testes; CH—chemotherapy; BMT—bone marrow transplantation.
Jcm 09 00224 g004
Figure 5. Spermatogonial labeling indices (%) of patients with potentially affected tissues (AT group) particularly due to cryptorchidism (CT), sickle cell disease (SCD), and thalassemia (THL) in comparison with established reference values (NT group) and patients within the AT group without the respective pathology. (A) MAGEA4, (B) UTF1, (C) PCNA, and (D) 5mC labeling index. Previously established values throughout development (95% confidence interval) are represented as light-gray area for the NT group and as dark-gray area for patients within the AT group without the respective pathology. Wilcoxon rank-sum test was used to compare labeling indices between groups. Statistically significant differences (* p < 0.016) resulting from comparisons with the NT group are represented in light-gray and with patients within the AT group without the respective pathology in black.
Jcm 09 00224 g005
Table 1. Baseline characteristics of the patient cohort. According to diagnosis, treatment received and occurrence of any testicular pathology, patients were divided into two groups: NT: untreated cancer patients without any preexisting (congenital) risk factors for impaired testicular function; AT: patients with potentially affected tissues by disease or treatment. The average age of the patients in NT and AT group is not significantly different (9.1 and 9.5 years, respectively).
GroupPatient NumberAge (Years)Testis Volume (mL)Diagnosis (Treatment before Testis Biopsy)
NTNT12.51.5Ependymoma
NT2 *30.33Acute myeloid leukemia
NT351Hodgkin’s lymphoma
NT461Hodgkin’s lymphoma
NT570.83Rhabdomyosarcoma
NT680.40Ewing sarcoma
NT791.30Intracranial germ cell tumor
NT810.51.80Rhabdomyosarcoma
NT9111Hodgkin’s lymphoma
NT10112Osteosarcoma
NT11131Hodgkin’s lymphoma
NT12148 #Sarcoma
NT131419Lymphoma
NT14149Non-Hodgkin’s lymphoma
ATAT15 months-Immunodeficiency (chemotherapy)
AT220.3Thalassemia
AT338Testicular tumor, pubertas praecox
AT440.4Immunodeficiency
AT56-Leukemia (allogeneic bone marrow transplantation)
AT661Sickle cell disease (hydroxyurea)
AT771Myelodysplastic syndrome
AT8 *71Sickle cell disease, cryptorchid testes
AT980.3Sickle cell disease (hydroxyurea)
AT1091Myelodysplastic syndrome
AT11101Thalassemia major
AT12101Hodgkin’s lymphoma, cryptorchid testes
AT13102Sickle cell disease (hydroxyurea)
AT14121.4Myelodysplastic syndrome
AT15 *12-Cryptorchid testes, hypogonadism
AT16121Thalassemia major
AT17138Leukemia (chemotherapy)
AT18 *146Cryptorchid testes
AT19156Lymphoma (chemotherapy)
AT20165Leukemia, cryptorchid testes (chemotherapies)
AT21 *163Testicular tumor, cryptorchid testes
AT22173Cryptorchid testes
* Patients with low spermatogonial counts and a patient with germ cell neoplasia in situ (AT21) were excluded from further analysis. Testicular volumes were determined by palpation using a Prader orchidometer and additionally confirmed by ultrasonography. # Indicates one patient for whom testicular volume was only determined by Prader orchidometer.

