Article

Maternal High Fat Diet and in-Utero Metformin Exposure Significantly Impact upon the Fetal Renal Proteome of Male Mice

Department of Pediatrics and Adolescent Medicine, University of Cologne, Medical Faculty and University Hospital Cologne, 50937 Cologne, Germany
*
Author to whom correspondence should be addressed.
J. Clin. Med. 2019, 8(5), 663; https://doi.org/10.3390/jcm8050663
Submission received: 15 March 2019 / Revised: 30 April 2019 / Accepted: 8 May 2019 / Published: 11 May 2019

Abstract

:
There is accumulating evidence for fetal programming of later kidney disease by maternal obesity or associated conditions. We performed a hypothesis-generating study to identify potentially underlying mechanisms. Female mice were randomly split in two groups and fed either a standard diet (SD) or high fat diet (HFD) from weaning until mating and during pregnancy. Half of the dams from both groups were treated with metformin ((M), 380 mg/kg), resulting in four experimental groups (SD, SD-M, HFD, HFD-M). Caesarean section was performed on gestational day 18.5. Fetal kidney tissue was isolated from cryo-slices using laser microdissection methods and a proteomic screen was performed. For single proteins, a fold change ≥1.5 and q-value <0.05 were considered to be statistically significant. Interestingly, HFD versus SD had a larger effect on the proteome of fetal kidneys (56 proteins affected; interaction clusters shown for proteins concerning transcription/translation, mitochondrial processes, eicosanoid metabolism, H2S-synthesis and membrane remodeling) than metformin exposure in either SD (29 proteins affected; clusters shown for proteins involved in transcription/translation) or HFD (6 proteins affected; no cluster). By further analysis, ATP6V1G1, THY1, PRKCA and NDUFB3 were identified as the most promising candidates potentially mediating reprogramming effects of metformin in a maternal high fat diet.

1. Introduction

Pregnancy disorders not only threaten the well-being of mother and child but also impair the normal development of the fetus. Fetal kidney development significantly depends upon sufficient supply of macro- and micronutrients and can be adversely affected by maternal malnutrition, placental dysfunction, gestational diabetes, prematurity and intrauterine stress [1]. Amongst these risk factors, maternal obesity is probably the most prevalent condition worldwide. Epidemiologic studies from the USA, England and Australia reported that about 20–30 percent of pregnant women were overweight and up to 20 percent were obese [2,3,4]. These women are at higher risk to develop gestational diabetes, arterial hypertension and preeclampsia [5,6]. Consequently, a significant proportion of the present pediatric population may have experienced adverse renal programming, leading to arterial hypertension and chronic renal disease during later life [1,7].
Metformin has increasingly been used to treat gestational diabetes during recent years [8,9] and no major sequelae for the unborn child have been reported [10,11,12]. However, metformin is known to pass the placenta [13,14]. Data on long-term outcomes of children exposed to metformin regarding fetal programming events in utero are scarce. First studies in children born to mothers treated with metformin due to gestational diabetes mellitus hint at an accelerated growth in early childhood compared to children whose mothers were treated with insulin. These data support the hypothesis that in utero exposure to metformin might have programming effects. Psychosocial development was not different between the two groups [15]. Similarly, blood pressure levels at two years of age were comparable between children born to diabetic mothers treated with metformin and diabetic mothers treated with insulin [16]. Long-term renal outcomes in these children haves not been studied so far.
Since prevention of chronic kidney disease remains a major public health challenge [17] and renal programming contributes considerably to susceptibility towards chronic renal disease [1], further understanding of the exact mechanisms leading to renal programming in maternal obesity is highly warranted.
In our laboratory, a high fat diet before and during pregnancy is an established model to study maternal obesity in mice [18,19,20,21]. In this study, the experimental set-up was designed to analyze both the effect of maternal high fat diet and the effect of metformin exposure with or without the background of maternal high fat diet on the renal proteome of fetal male mice, and to use these data to generate new hypotheses about which proteins may be involved in fetal kidney programming under a high fat diet and metformin exposure.

2. Materials and Methods

2.1. Animal Model

All procedures were conducted in accordance with the German regulations and legal requirements. The experimental protocol was approved by the appropriate Institutional and Governmental Review Boards.
Mice (C57BL/6N; Janvier Labs, Le Genest-Saint-Isle, France) were bred locally at a designated animal unit of the University Hospital of Cologne (Cologne, Germany). All animals were housed in individually ventilated cages (IVCs Blue Line, Tecniplast, Buguggiate, Italy) providing a temperature of 22 °C ± 2 °C; constant relative humidity of 50–60% and were kept under a 12-hour light, 12-hour dark cycle. After weaning, female mice were fed ad libitum either a standard diet (SD; R/M-H ssniff®, Soest, Germany) containing 9% fat of metabolizable energy or a high fat diet (HFD; C1057 mod, Altromin, Lage, Germany) containing 60% fat of metabolizable energy (for details please see [21]). At 12–16 weeks of age, SD and HFD females were mated overnight and the next day randomized to either receive metformin via drinking water (380 mg/kg body weight/day) throughout pregnancy (groups SD-M, HFD-M) or no treatment (groups SD, HFD). The type of diet was not changed during pregnancy. The day after mating was considered as gestational day (GD) 0.5. Shortly before term, on GD 18.5, dams were anesthetized with buprenorphine (0.1 mg/kg body weight; s.c. injection) and underwent a cesarean section. After delivery, fetuses were weighed and sacrificed by decapitation. Half of the fetuses were then placed into Tissue-Tek® O.C.T.™ Compound (Sakura, Alphen aan den Rijn, Netherlands) and cryoconserved at −80 °C. Residual fetuses were either used for single organ harvesting or were fixated in formalin for further immunohistochemical analyses. In this study, only litters with at least 5 viable pups were included in the analyses. All body weight values in the text are mean ± SD.

2.2. Sex-PCR

After dissection and weighing, a tail cut was performed in order to determine the sex of every fetus. DNA was extracted by lysing the tissue in lysis buffer (100 mM Tris, 5 mM EDTA, 200 mM NaCl, 0.2% SDS, pH 8.0) supplemented with 3–5 units Proteinase K (Thermo Scientific, Waltham, MA, USA) over night at 55 °C. The next day, DNA was precipitated with isopropanol, spun down and the DNA-pellet was washed with 70% ethanol. DNA was dissolved in water and used as the template in a PCR reaction. Briefly, 1 µL DNA was mixed with 9 µL PCR-mix (1× GoTaq Flexi buffer (Promega, Madison, USA), 3 mM MgCl2, 0.2 mM dNTPs, 0.4 µM of each primer, 0.5 units GoTaq (Promega, Madison, USA) and fragments of the X (104 bp) and Y-chromosome (344 bp) were amplified (95 °C for 3 min, 35 cycles of: 95 °C for 30 seconds, 58 °C for 1 min, 72 °C for 1 min, following a final elongation step of 72 °C for 10 min). The following primer pairs were used: Y-chromosome: Y-for 5′-CTGGAGCTCTACAGTGATGA-3′, Y-rev 5′-CAGTTACCAATCAACACATCA-3′, X-chromosome: X-for 5′-AACATCCTGAACACCTTGCC-3′, X-rev 5′-TAGCTTGTGGCTCTCCAGGT-3.

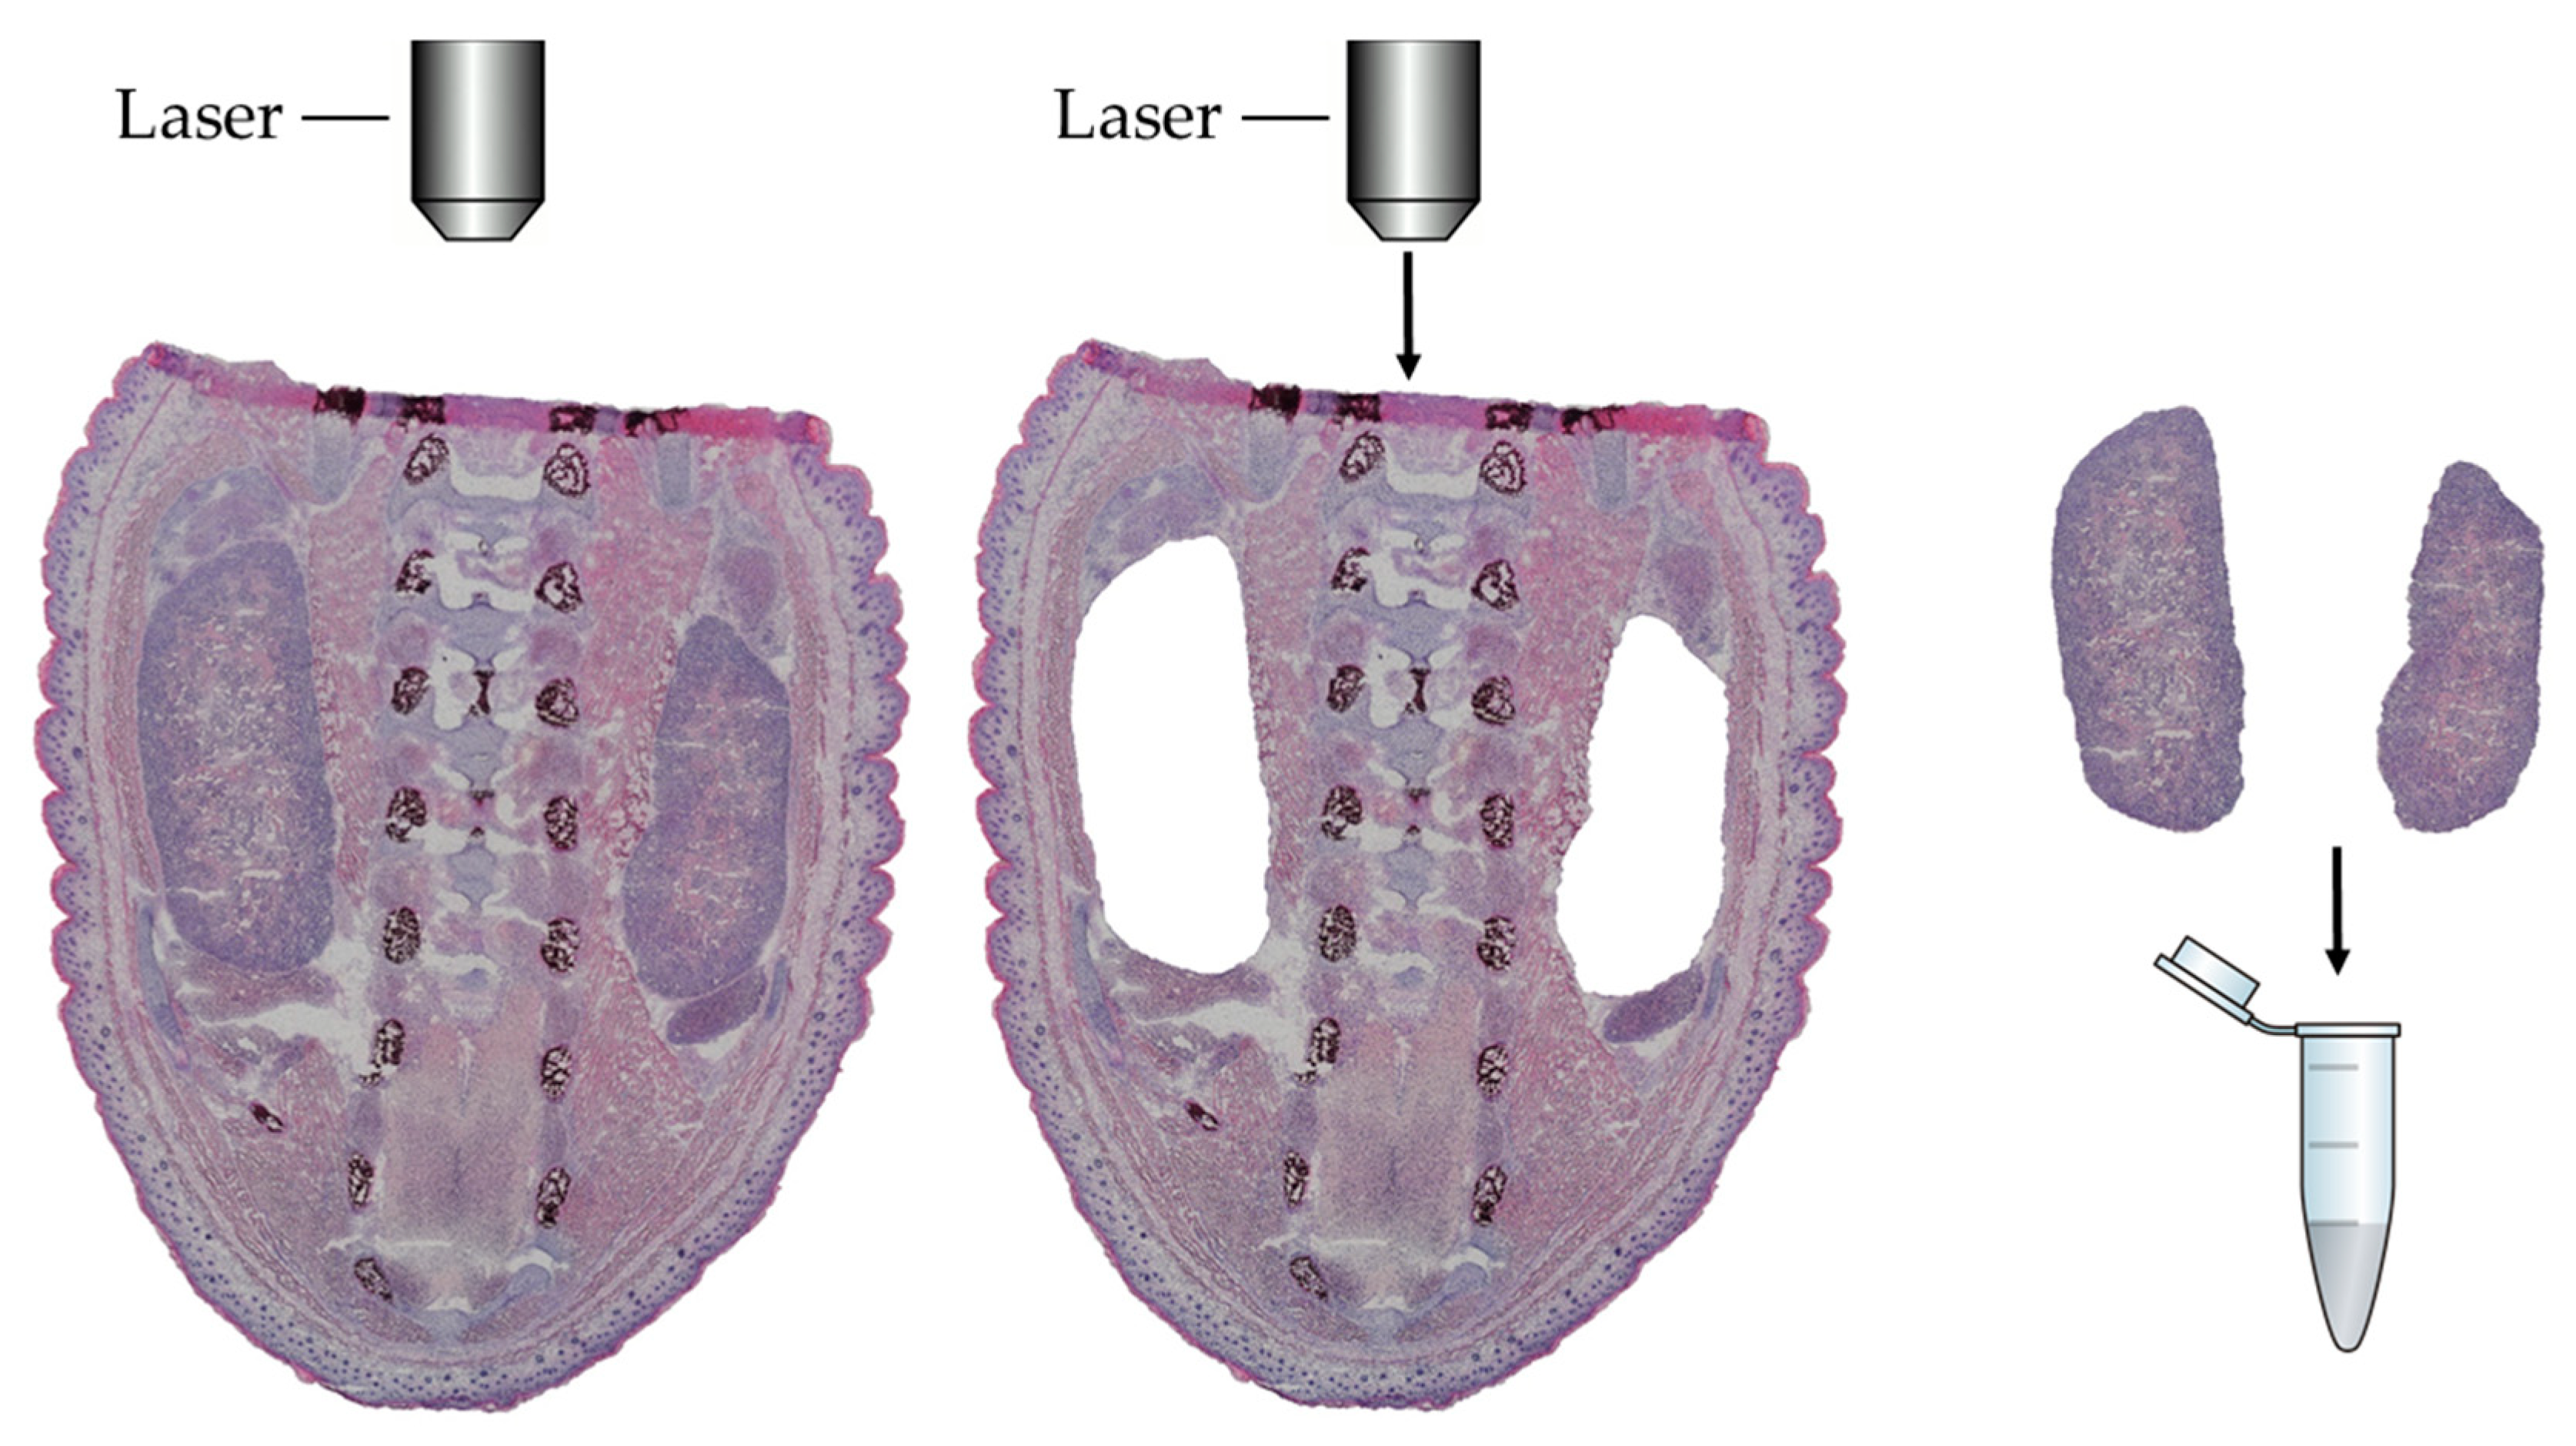
2.3. LCM Procedure and Protein Extraction

For this study, only male embryos were used (n = 5 embryos in groups SD-M, HFD and HFD-M, n = 3 embryos in group SD). Embryos were sectioned on a Cryostat (Leica CM3050 S; Leica, Wetzlar, Germany) at −21 °C to 16 µm thick sections. Consecutive sections were collected onto PEN-Membrane Slides (Leica No. 11600288; Leica, Wetzlar, Germany) and placed on dry ice for transfer. A standard hematoxylin and eosin staining was applied to discriminate between organs and to localize both kidneys. Briefly, sections were fixed in 4 °C 70% ethanol combined with a cOmplete® protease inhibitor cocktail (Roche, Basel, Switzerland) for 1 min, rinsed in double-distilled water (ddH2O), stained in Mayer’s hematoxylin for 1 min., dipped in eosin, rinsed in 70% ethanol, and left to dry at room temperature for at least 1 hour before laser capture microdissection was performed.
A slide with air-dried sections was inserted in the slide holder of the LCM microscope (LMD7000, Leica Microsystems; Leica, Wetzlar, Germany; power 16, aperture 20, velocity 7), and a 200 µL PCR-tube was placed in such a way underneath the sections that dissected pieces fell directly into the tube cap. Approximately 12 mm2 of kidney were collected per embryo (Figure 1). Consecutively, the tubes were removed from the holder, and the contents were carefully centrifuged to the bottom of the tube before 50 µL of 10% SDS in PBS buffer was added. Tubes were stored at −20 °C for one night before the protein was extracted.
Proteins were extracted and processed using an approach for LCM samples containing minimal amounts of protein in the (sub-) microgram range). For this purpose, samples were heated to 95 °C for 10 min followed by chromatin degradation using a Bioruptor for 10 min, cycle 30/30 seconds. Subsequently, DTT was added to a final concentration of 5 mM, vortexed, and incubated for 30 min at 55 °C. Next, CAA was added to a final concentration of 40 mM, vortexed, and incubated in the dark for 30 min at room temperature. Proteins were digested with trypsin, and peptides were purified and stored at −20 °C prior LC-MS analysis.

2.4. Mass Spectrometry [as Performed by the Proteomics Facility of the Cluster of Excellence—Cellular Stress Responses in Aging-Associated Diseases (CECAD) Cologne]

A Q Exactive Plus Orbitrap (Thermo Scientific, Waltham, MA, USA) mass spectrometer coupled to an EASY nLC 1000 (Thermo Scientific, Waltham, MA, USA) was used to analyze all samples. Loading of peptides was done with solvent A (0.1% formic acid in water) onto an analytical column (50 cm—75 µm I.D., filled with 2.7 µm Poroshell EC120 C18, Agilent, Santa Clara, CA, USA) packed in-house. Chromatographical separation of peptides was performed at a constant flow rate of 250 nL/min using the following gradient: 3–5% solvent B (0.1% formic acid in 80% acetonitrile) within 1.0 min, 5–30% solvent B within 119.0 min, 30–50% solvent B within 19.0 min, 50–95% solvent B within 1.0 min, followed by washing and column equilibration. The data-dependent acquisition mode was used on the mass spectrometer. The MS1 survey scan was acquired from 300–1750 m/z at a resolution of 70,000. Isolation of the top 10 most abundant peptides was performed within a 2.1 Th window and peptides were subjected to HCD fragmentation at a normalized collision energy of 27%. A maximum injection time of 60 milliseconds was applied, as the AGC target was set to 5e5 charges. Product ions were detected at a resolution of 17,500 in the Orbitrap. Dynamic exclusion of precursors was set for 25.0 seconds.

2.5. Proteomics Data Analysis (as Performed by the Proteomics Facility of the CECAD Cologne)

Proteomics data analysis was performed using free academic software Maxquant (https://maxquant.org/maxquant/, version 1.5.3.8) with default parameters to process all mass spectrometric raw data. In short, MS2 spectra were searched against the Uniprot MOUSE.fasta database, with a list of common contaminants included. False discovery rates (FDR) on protein and peptide spectrum matches (PSM) level were estimated by the target-decoy approach to 1% (Protein FDR) and 1% (PSM FDR), respectively. The minimal peptide length was set to 7 amino acids and carbamidomethylation at cysteine residues was considered as a fixed modification. Oxidation (M) and Acetyl (Protein N-term) were included as variable modifications. The match-between runs option was enabled. Label-free quantification (LFQ) was enabled using default settings.
A principal component analysis (PCA) was performed to analyze clustering of individual samples within the respective experimental groups and to identify outliers. In all experimental groups, n = 3 animals per group could be clustered by PCA analysis (Figure 2). These samples were used for further analysis.
Further analysis was carried out using free software Perseus (https://maxquant.org/perseus, version 1.5.5.3). Briefly, LFQ values were log2 transformed, and proteins flagged as “potential contaminants”, “reverse” and “only identified by site” were removed from the data set. Three group comparisons of interest were defined as follows: (1) HFD vs. SD, (2) SD-M vs. SD, (3) HFD-M vs. HFD. For each protein a two-sample t-test was used to determine statistically significant changes (p < 0.05). To reduce the number of false positive findings amongst the list of proteins due to the large number of single t-tests, p-values were corrected for multiple testing by using the Benjamini–Hochberg correction. The resulting q-values were used for identification of significantly altered proteins (q < 0.05).

2.6. Further Data Processing

Subsequently, we used String database analysis (www.string-db.com, version 11.0) to identify molecular interactions (based on evidence from experiments or curated databases) and functional enrichments concerning biological processes or Uniprot Keywords (false discovery rate FDR <0.01) of all significantly (q < 0.05) and relevantly (fold change, fc ≥ 1.5) altered proteins. For the identification of altered and overlapping proteins between single groups or group comparisons, an overlap analysis (Venn diagram) of all significantly (q < 0.05) and relevantly (fc ≥ 1.5) altered proteins of the comparisons HFD vs. SD, SD-M vs. SD and HFD-M vs. HFD was generated (Figure 3a) using open access software FunRich (http://funrich.org, version 3.1.3). Additionally, a second overlap analysis was performed of the same comparisons using a q-value of <0.1 and an fc ≥ 1.5 in order not to miss considerable effects by the strict q-value cut-off of <0.05, especially focusing on metformin effects (Figure 3b).

3. Results

3.1. Animal Phenotype

At the time of mating, female lean mice fed a standard diet (SD) displayed a body weight (21.9 ± 1.1 g) significantly lower compared to the body weight of obese (HFD) dams (25.3 ± 1.9 g) (p-value < 0.001; Mann Whitney test). As known from earlier studies, HFD mice fasting blood glucose levels are elevated and glucose tolerance is disturbed compared to SD mice [19]. So far, the metformin treated dams (SD-M and HFD-M groups) still need to be characterized in regard to glucose metabolism, and experiments are on the way. The fetal phenotype of SD and HFD mice has been described earlier, showing lower body weight of fetuses from dams fed HFD compared to dams fed SD at gestational day (GD) 15.5, followed by an intrauterine catch-up growth within the next 3 days resulting in similar body weight of fetuses from both experimental groups at GD 18.5 [21]. As expected, in this study also fetuses at GD 18.5 displayed body weights not significantly different when comparing SD (1.10 ± 0.12 g) and HFD (1.08 ± 0.16 g) mice. Treatment with metformin during pregnancy did not significantly change fetal body weight at GD 18.5, either in SD (SD-M: 1.17 ± 0.19 g) or in HFD (HFD-M: 1.15 ± 0.14 g) fetuses. Moreover, the resorption rate (equivalent to miscarriage in humans) and litter size did not differ due to HFD feeding or metformin treatment.

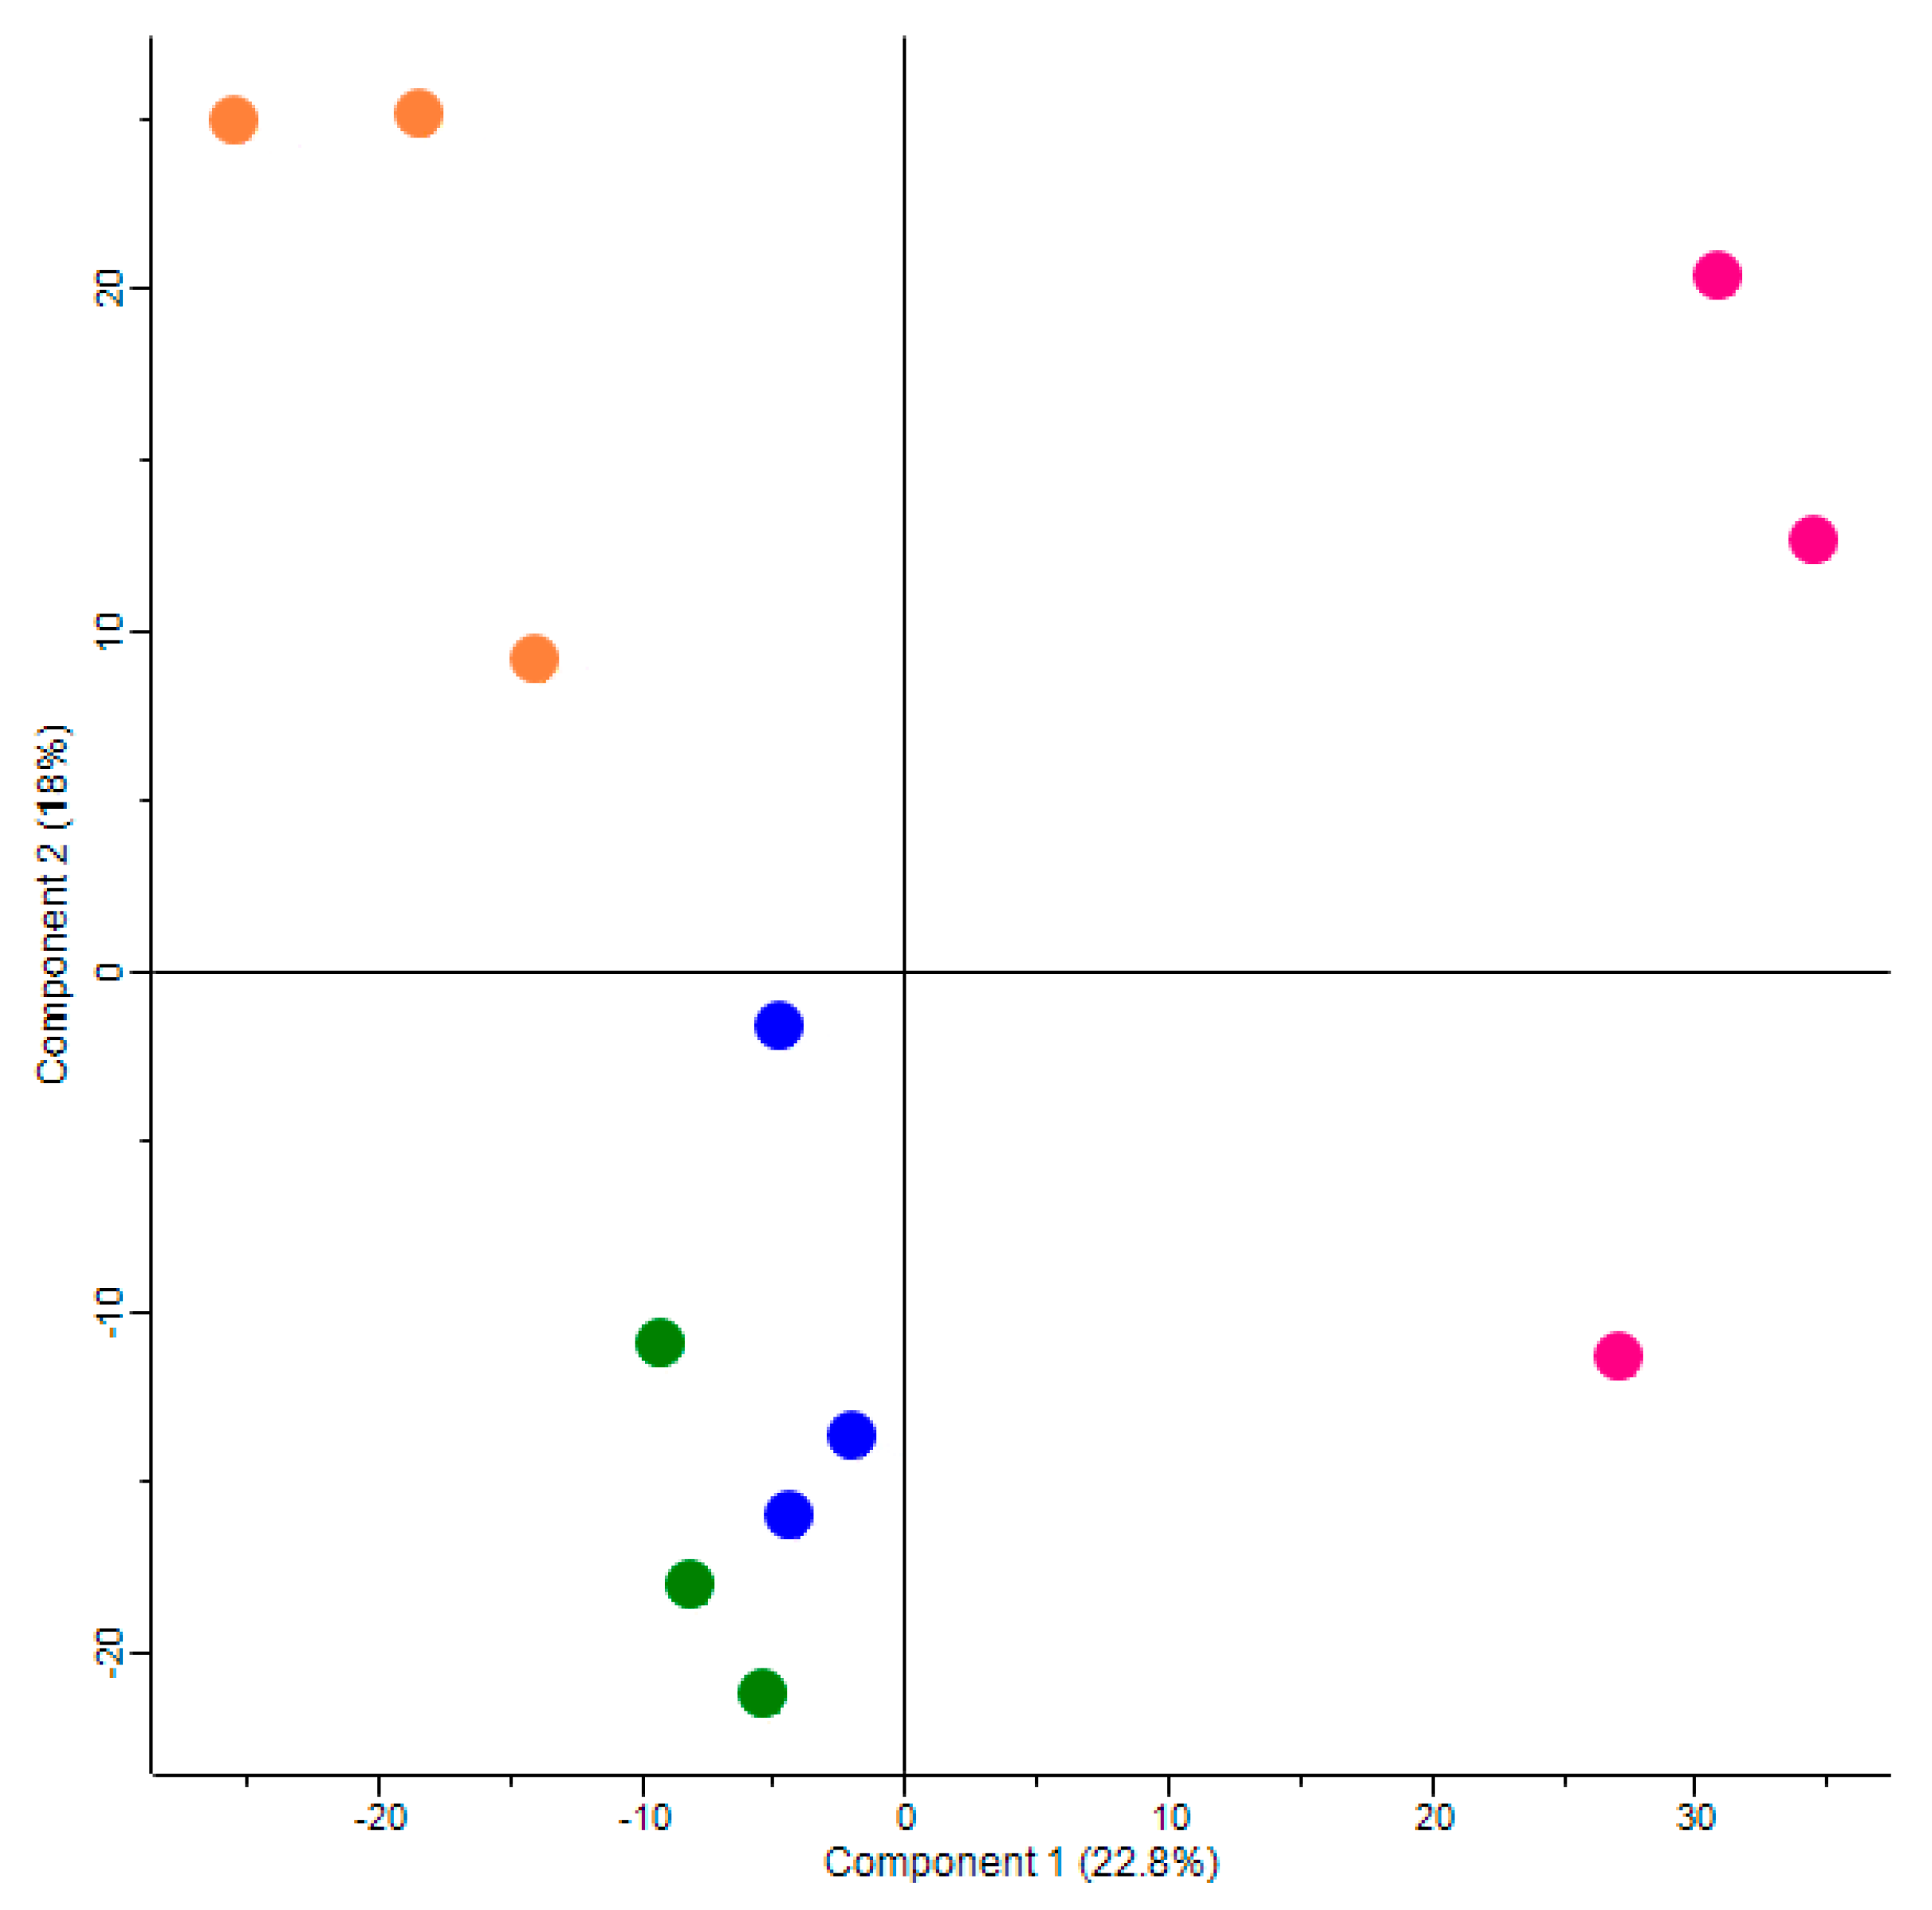
3.2. Principal Component Analysis Iindicates a Strong and Differential Effect of Maternal High Fat Diet and Metformin Treatment on Global Protein Expression in Fetal Kidneys

Principal component analysis (Figure 2) indicated that the global protein expression patterns both in fetuses of dams fed a high fat diet without metformin (HFD group) and in fetuses of dams fed a standard diet without metformin (SD group), clearly differed compared to each other and compared to both the groups fed additional metformin throughout pregnancy. Interestingly, there was a common cluster of fetuses of dams fed a high fat diet with metformin (group HFD-M) and fetuses of dams fed a standard diet with metformin (group SD-M), suggesting a major effect of metformin exposure on global protein expression regardless of diet before and during pregnancy.

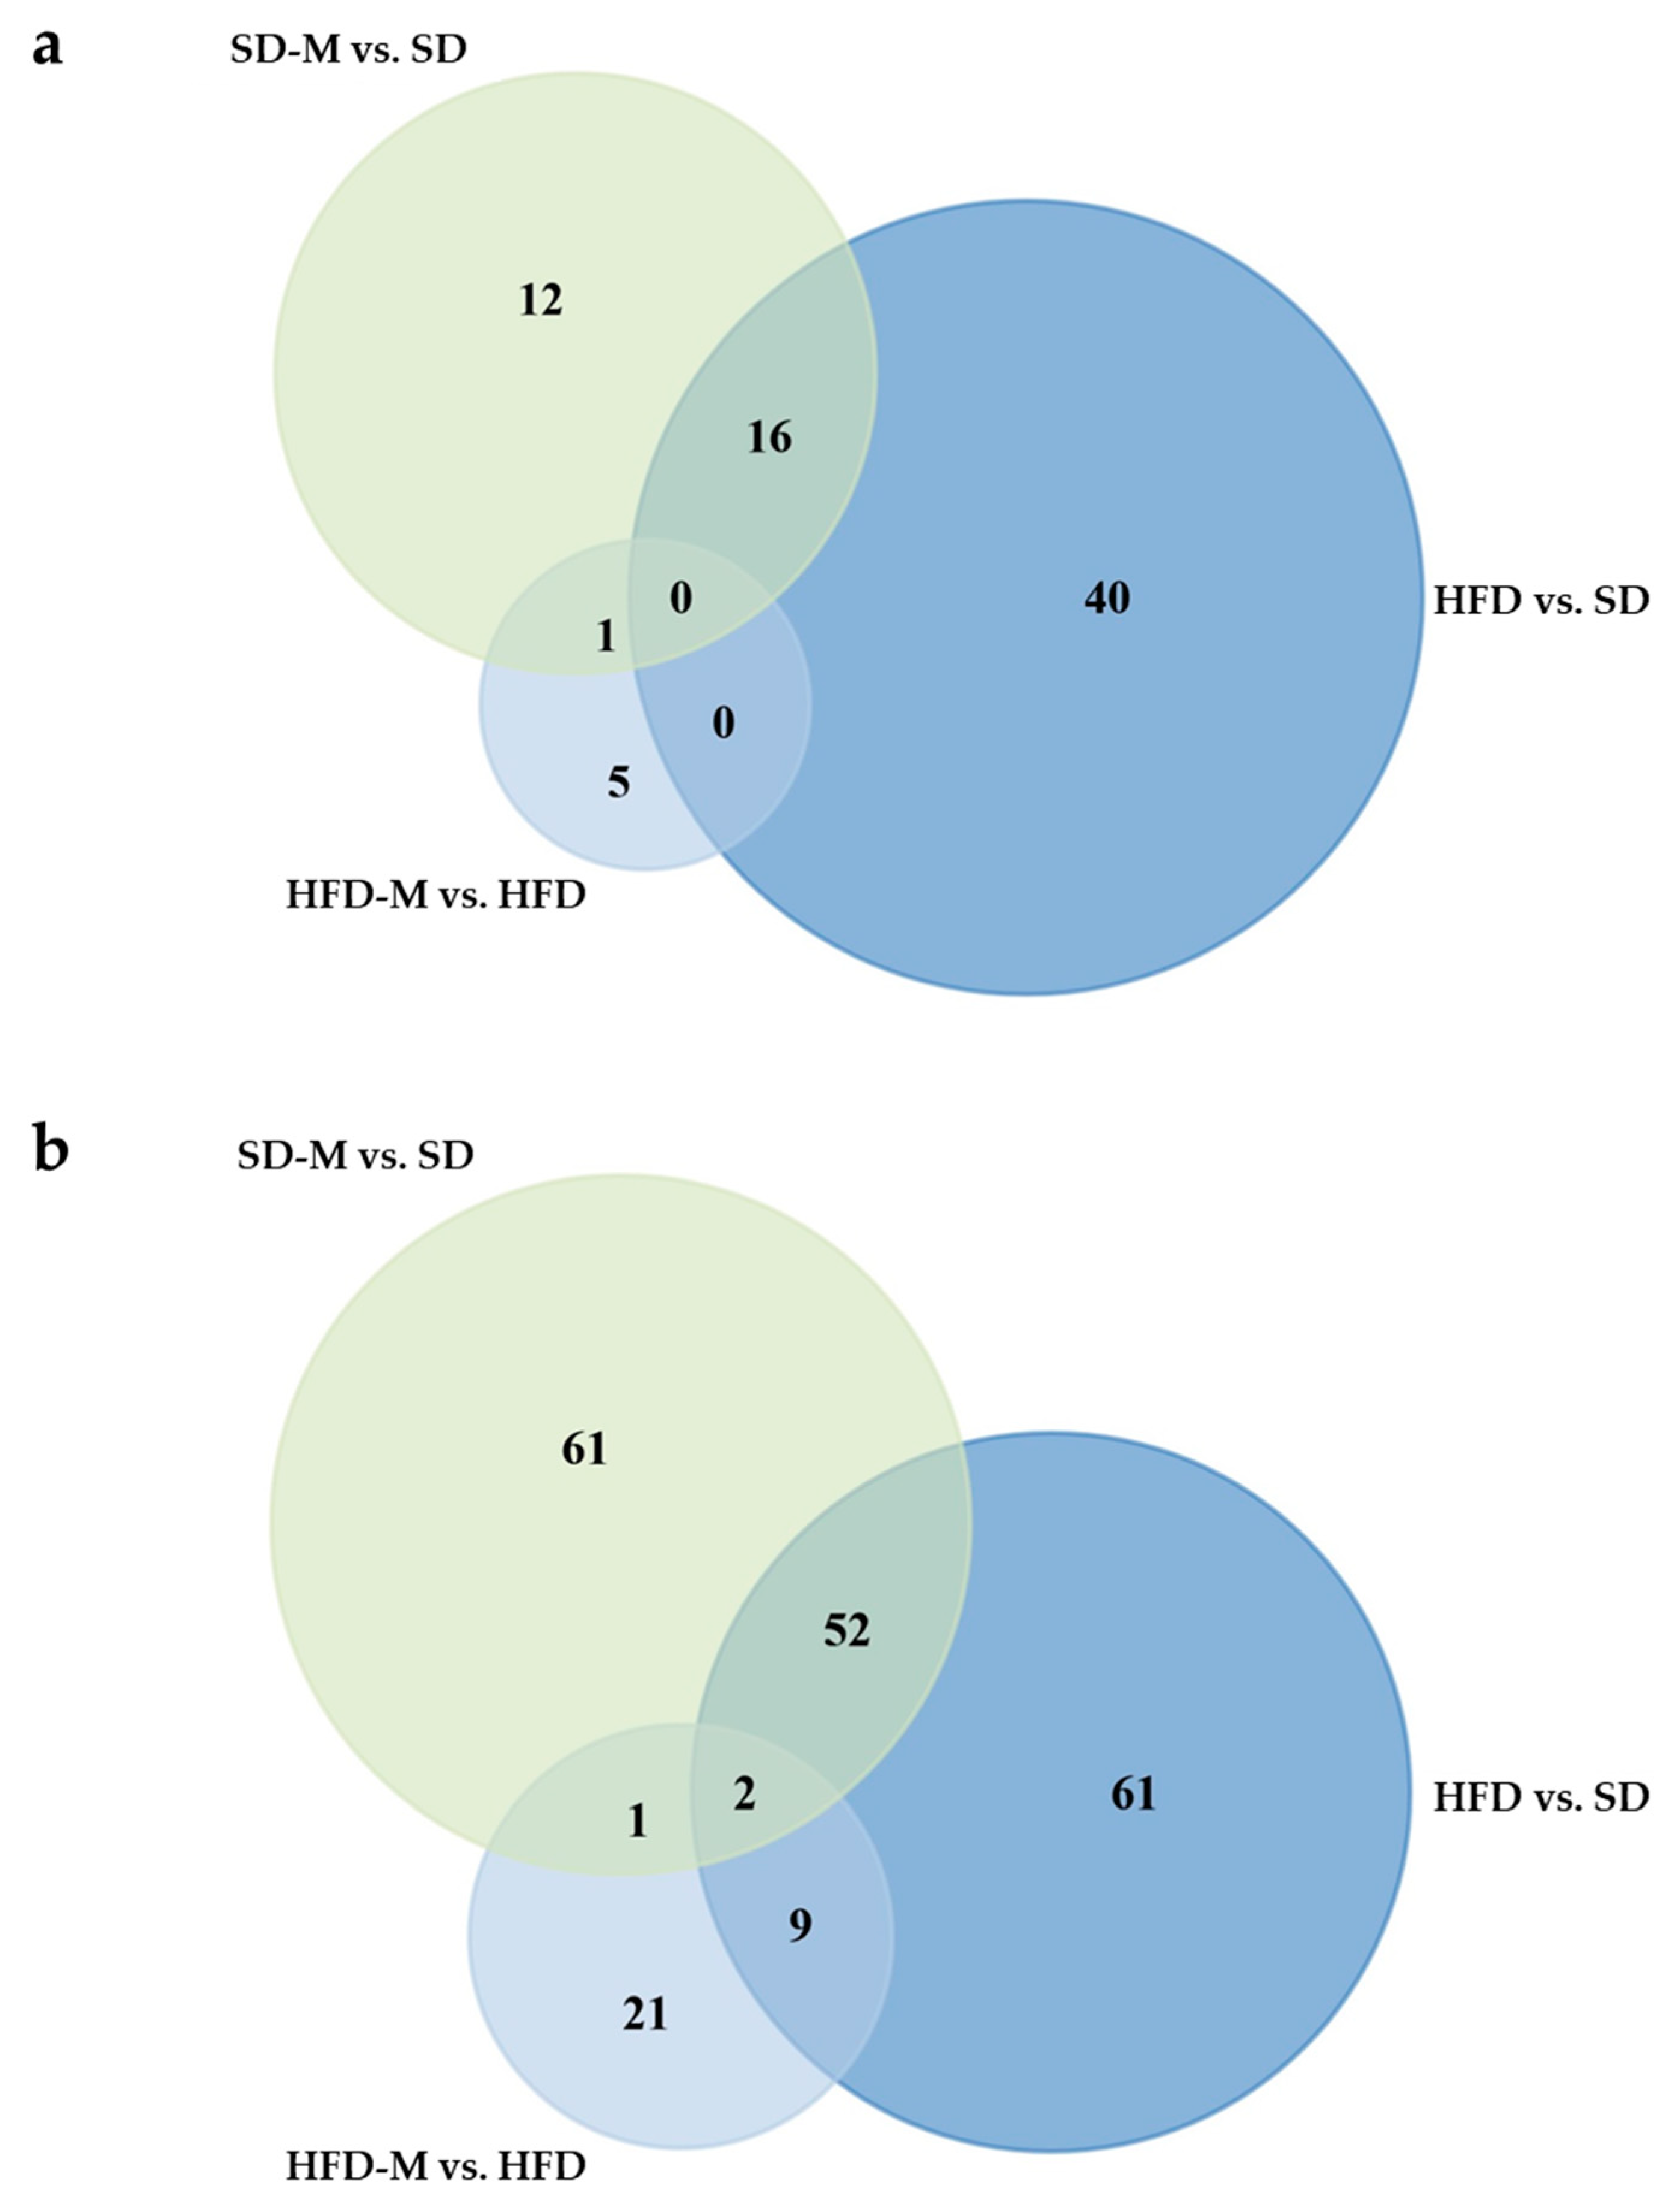
3.3. Overlap Analyses Identify 16 Proteins Which Were Similarly Altered by High Fat Diet and Metformin During Standard Diet, and 11 Proteins Which Were Dysregulated by High Fat diet and Counter-Regulated by Metformin

Fifty-six proteins were significantly (q-value < 0.05) and relevantly (fold change ≥1.5-fold) altered in fetuses by a high fat diet (Table 1; comparison of HFD group to SD group), 29 proteins by metformin in fetuses fed a standard diet (Table 2; comparison of SD-M group to SD group), and 6 proteins by metformin in fetuses fed a high fat diet (Table 3; comparison of HFD-M group to HFD group). Interestingly, the first overlap analysis identified 16 proteins which were similarly altered by HFD and by metformin during SD (Figure 3a shows Venn diagram, Table S1 shows overlapping proteins). String analysis even identified an interaction of three of the overlapping proteins (Figure S1).
However, we did not identify many similar effects of metformin on specific single proteins in fetuses of HFD dams and fetuses of SD dams in the first overlap analysis. There was only one overlap (i.e., increased MRPS35) between the comparisons HFD-M vs. HFD and SD-M vs. SD (Figure 3a). Even when including all proteins with a q-value <0.1 and an fc ≥1.5-fold into the additional second overlap analysis, so as not to miss considerable effects due to the strict q-value cut off of <0.05, the number of overlaps increased by only two proteins (Figure 3b), which also were considerably altered by high fat diet (comparison HFD vs. SD). The two additional proteins were protein kinase C alpha (PRKCA) and ubiquitin-conjugating enzyme E2 E3 (UBE2D3).
Next, surprisingly none of the 56 proteins significantly and relevantly altered by HFD was among the six proteins significantly altered by metformin under HFD (Figure 3a), suggesting an absence of compensation for high fat diet-induced alterations by metformin in fetal kidneys. However, looking further at the second overlap analysis of all proteins with a q-value <0.1 and an fc ≥1.5 (Figure 3b), we identified 11 proteins that showed considerable alterations induced both by HFD (comparison HFD vs. SD) and by metformin in HFD fetuses (comparison HFD-M vs. HFD). Remarkably, all these 11 proteins were counter-regulated by metformin, among them the interesting proteins ATP6V1G1, THY1, PRKCA and NDUFB3 (Table S2).

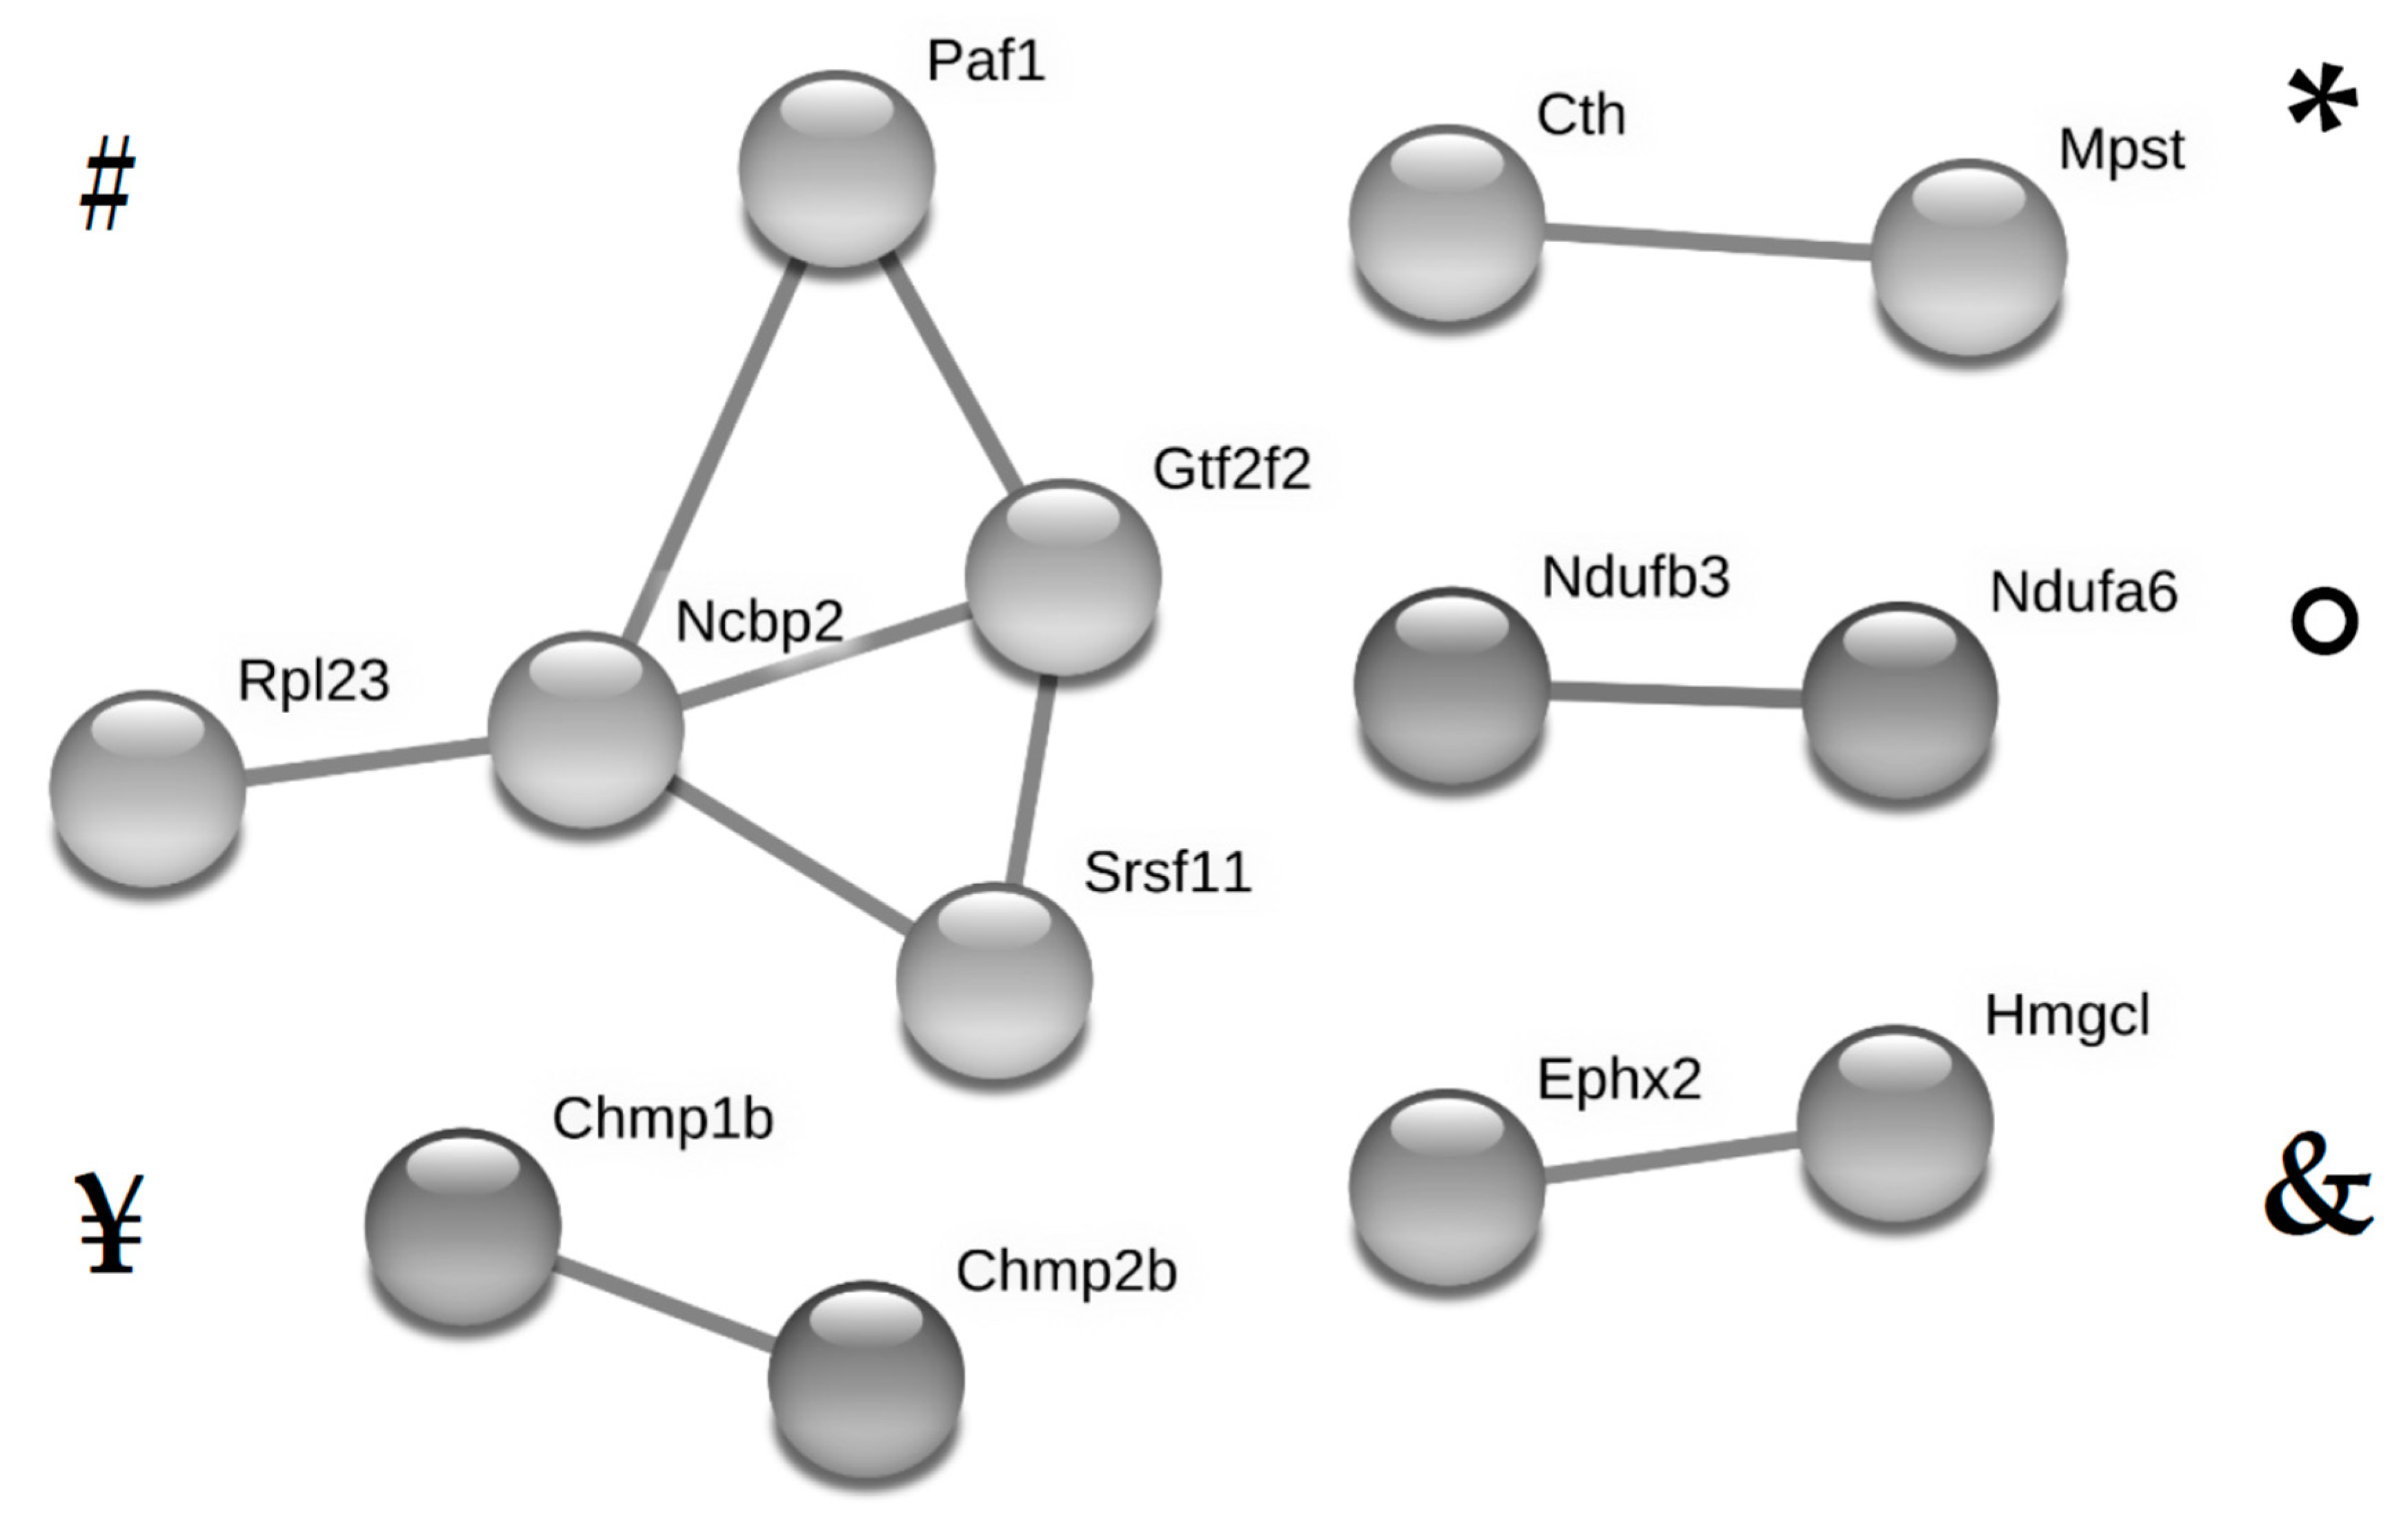
3.4. High Fat Diet During Mouse Pregnancy Significantly Affects the Levels of 56 Proteins in the Fetal Kidney at Term

To identify significant (q < 0.05) and relevant (fc ≥ 1.5-fold) alterations of single protein levels in fetal kidneys by the high fat diet, protein concentrations during the high fat diet without metformin (HFD group) were compared to concentrations during the standard diet without metformin (SD group). The levels of 56 proteins were significantly altered (Table 1). Forty-seven out of these proteins showed 3/3 valid values in the HFD group and 0/3 valid values in the SD group, and one protein showed 2/3 valid values in the HFD group and 0/3 valid values in the SD group. Therefore, forty-eight proteins were found to be increased in the HFD group compared to the SD group. One protein showed 3/3 valid values in both groups, and seven proteins showed 0/3 valid values in the HFD group and 3/3 valid values in the SD group. All these eight proteins were found to be significantly decreased in the HFD group.
String analysis identified five clusters of potentially interacting proteins (Figure 4). The most prominent cluster of interacting proteins included proteins involved in processes of transcription/translation (RPL23, NCBP2, SRSF11, GTF2F2 and PAF1). Further predicted interactions were related to eicosanoid metabolism (EPHX2 and HMGCL), hydrogen sulfide H(2)S- synthesis (MPST and CTH), the respiratory chain of the mitochondrial membrane (NDUFB3, NDUFA6) and membrane remodeling (CHMP1B and CHMP2B). Uniprot Keywords identified were “acetylation” (24 proteins), “phosphoprotein” (35 proteins) and “mitochondrion” (12 proteins). The only biological process identified was “regulation of primary metabolic process” (29 proteins).
Literature research was performed for all proteins differentially affected by maternal high fat diet. Interestingly, known physiological relevance with regard to kidney disease was found primarily in proteins with high fold changes (SFN, AHSG, AMBP, ATP6V1G1, AQP1, THY1, LGALS9, SRI, DAPK1).

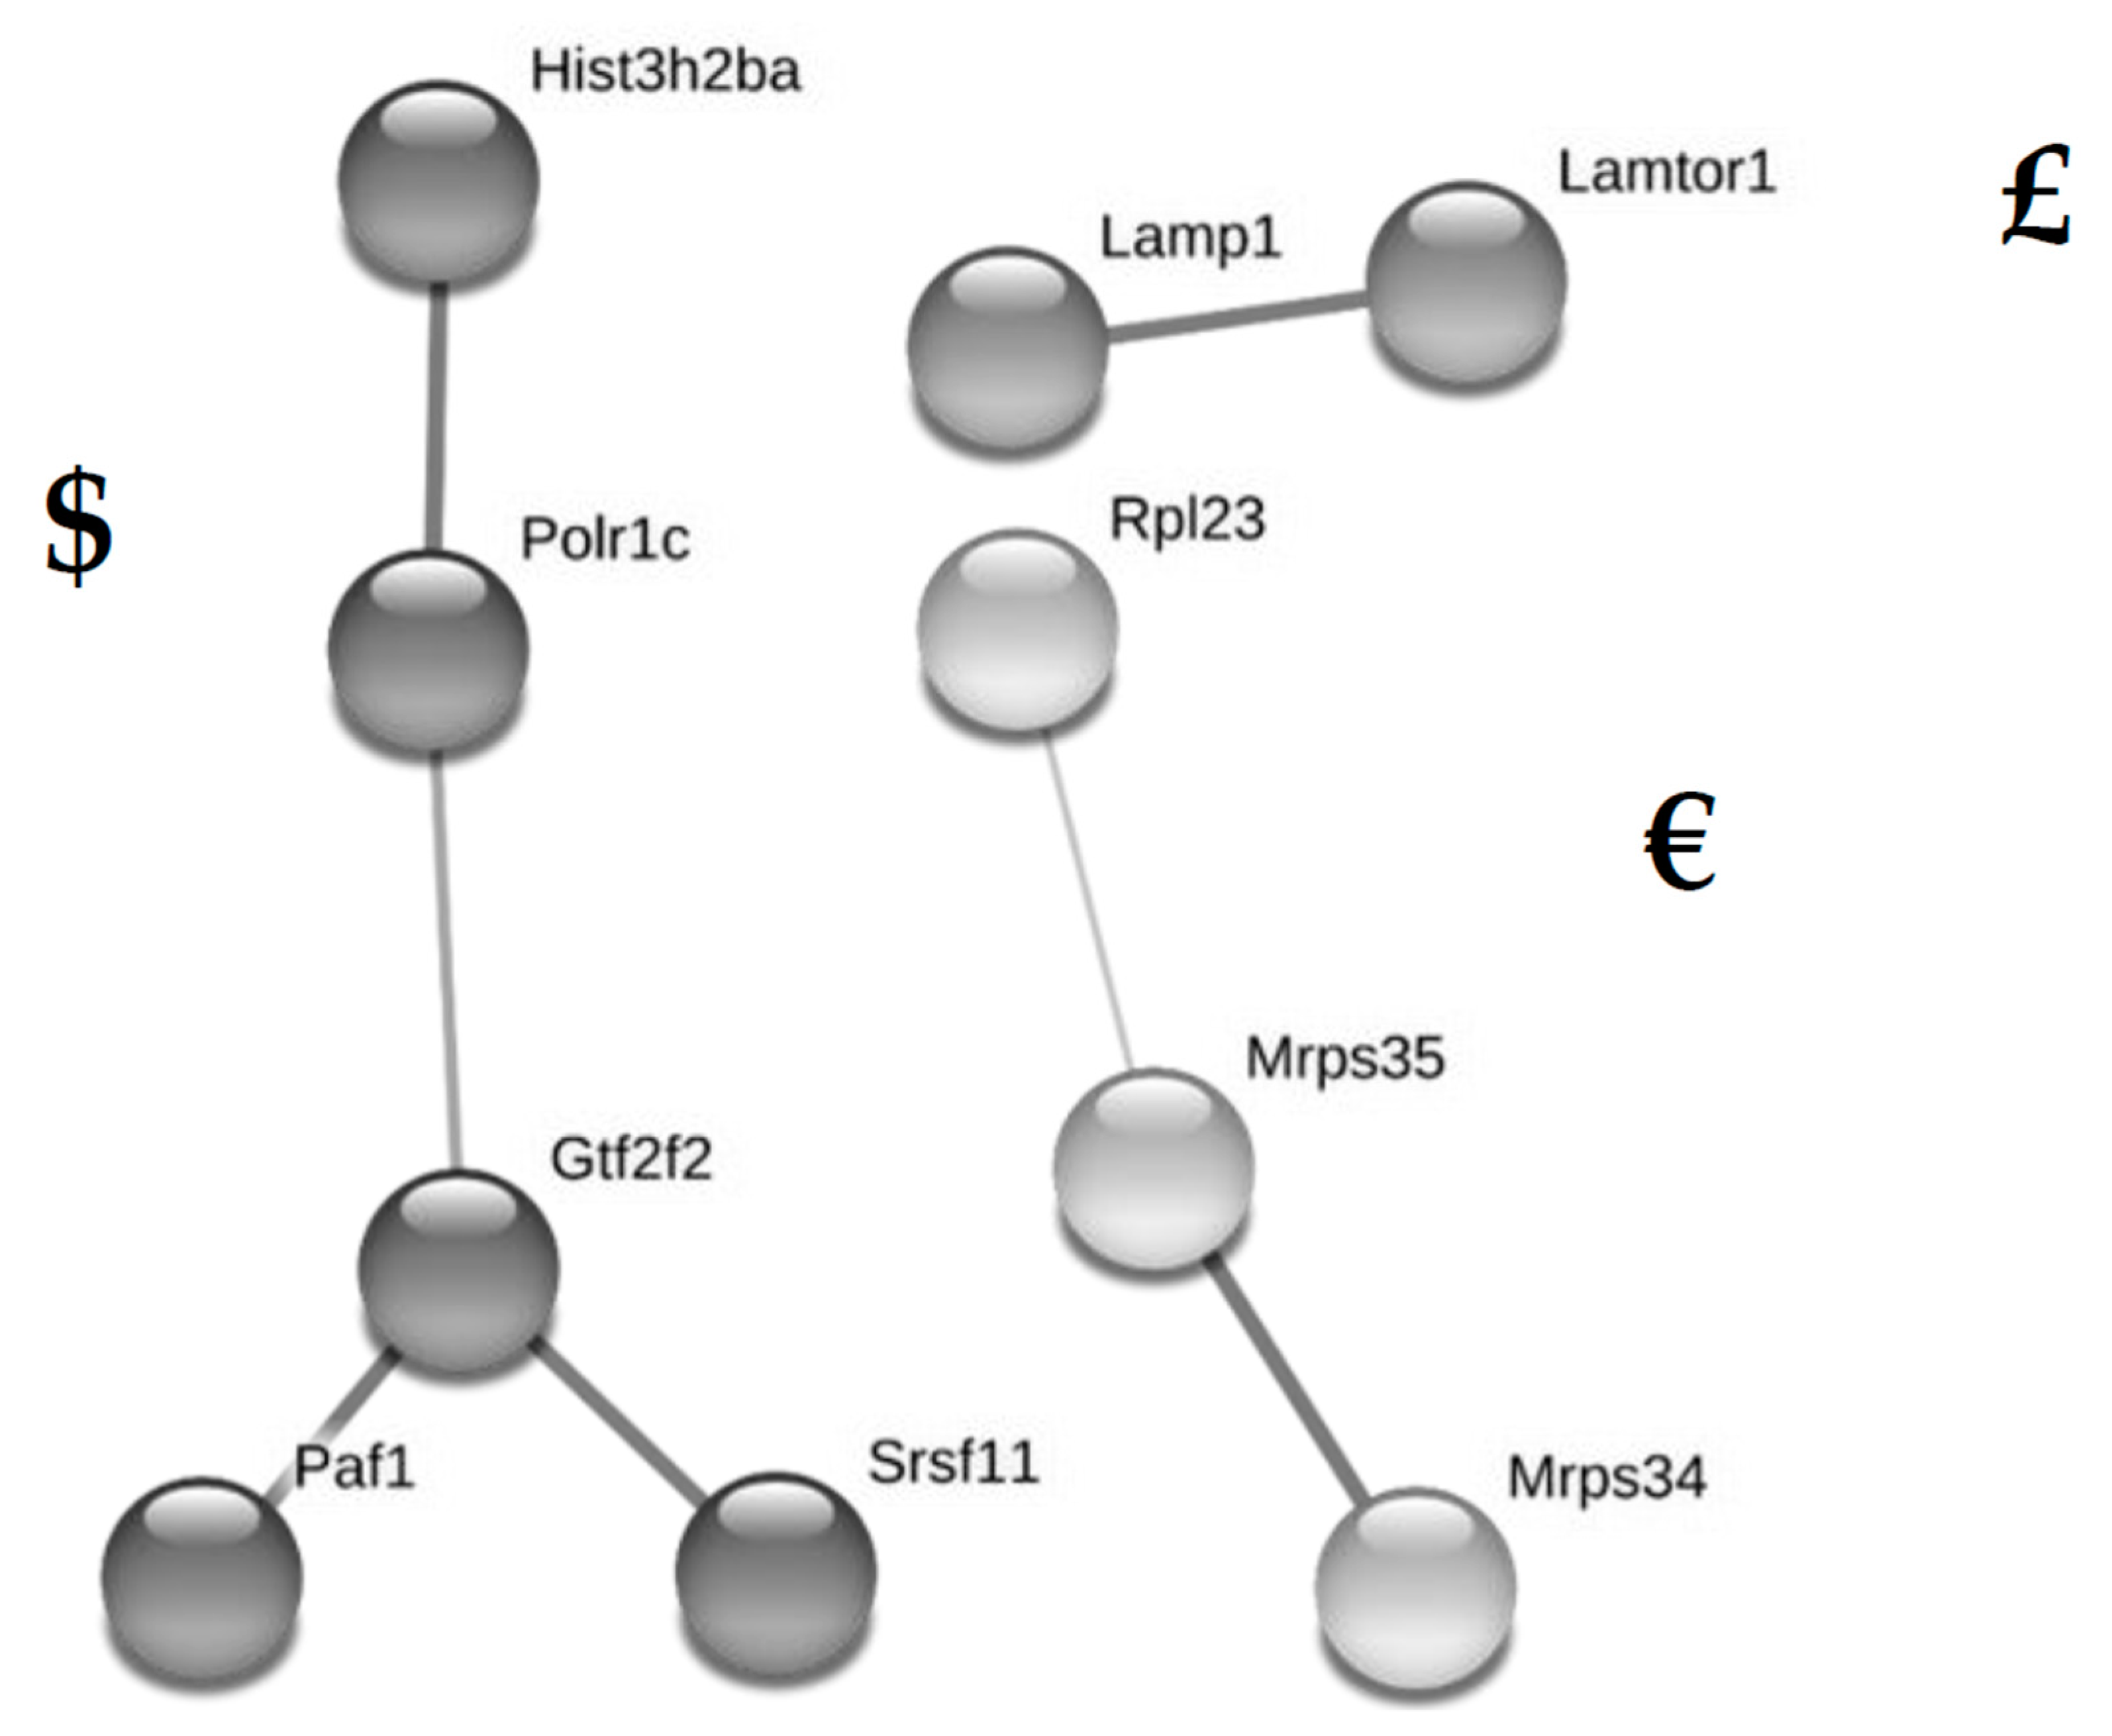
3.5. Metformin-Treatment in Healthy Pregnant Mice Significantly Alters the Levels of 29 Proteins in Fetal Kidneys at Term

To identify significant (q < 0.05) and relevant (fc ≥1.5-fold) alterations of single protein levels in fetal kidneys by metformin exposure in utero, protein levels during metformin treatment in standard diet animals (SD-M group) were compared to levels from untreated animals with a standard diet (SD group). The levels of 29 proteins were significantly altered (Table 2).
Twenty-seven of these proteins showed 3/3 valid values in the SD-M group and 0/3 valid values in the SD group and were thus found to be increased by metformin exposure in the standard diet. Two proteins were decreased by metformin exposure in the standard diet (0/3 valid values in the SD-M group and 3/3 valid values in the SD group).
String analysis identified three clusters of potentially interacting proteins (Figure 5). The biggest cluster consisted of proteins related to transcription (HIST3H2BA, POLR1C, PAF1, SRSF11, GTF2F2); the second cluster of proteins was related to translation (RPL23, MRPS35, MRPS34); and the third interaction was shown for LAMP1 and LAMTOR1. Functional enrichment analysis of biological processes and Uniprot keywords yielded no results.
Literature research indicated physiological relevance with regard to kidney disease for two proteins (AMBP, DAPK1).

3.6. Metformin-Treatment in Obese Dams (Group HFD-M) Significantly Alters the Levels of Only Six Proteins in Fetal Kidneys Compared to Group HFD (High Fat Diet Without Metformin)

To identify significant (q < 0.05) and relevant (fc ≥1.5-fold) alterations of single protein levels in fetal kidneys by metformin treatment in obese dams, protein levels during metformin treatment in high fat diet animals (HFD-M group) were compared to levels from untreated animals with high fat diet (HFD group). The levels of only six proteins were significantly altered by this treatment (Table 3).
Looking at up- and downregulation, three proteins were increased by metformin treatment (3/3 valid values in the HFD-M group and 0/3 valid values in the HFD group) and three proteins were decreased by metformin treatment in obese dams.
Due to the low number of altered proteins, String analysis could not identify a cluster of potentially interacting molecules. Similarly, functional enrichment analysis of biological processes and Uniprot keywords yielded no results.
Physiological relevance with regard to kidney disease as indicated by literature research was found for two proteins (PYCR1, FXYD2).

4. Discussion

Our study was designed to generate hypotheses on how maternal obesity and maternal metformin exposure might contribute to fetal programming of kidney disease. For this purpose, we studied the renal proteome of fetal mice close to term from four different experimental groups (standard diet +/− metformin treatment, high fat diet +/− metformin treatment). Interestingly, maternal high fat diet versus maternal standard diet had a larger effect on the proteome of fetal kidneys as estimated by the number of significantly and relevantly altered proteins (56 proteins affected) than metformin exposure in either standard diet mice (29 proteins affected) or high fat diet mice (6 proteins affected). Principal component analysis indicated a significant independent effect both of high fat diet and of metformin, the latter partially overcoming the diet effects and leading to similar global protein expression clusters, regardless of diet, before and during pregnancy. Both a high fat diet and metformin treatment in standard diet animals predominantly induced an increase rather than a decrease of affected proteins, but metformin during a high fat diet induced considerable counter-regulation of proteins dysregulated by a high fat diet.
String analysis of proteins significantly altered by the maternal high fat diet identified the upregulation of several proteins potentially interacting in the process of transcription and translation (RPL23, NCBP2, SRS11, GTF2F2 and PAF1). This could be in line with the observation that most differentially affected proteins are increased by HFD rather than decreased. In addition, upregulation of proteins (CHMP1B and CHMP2B) involved in endosomal sorting required for transport complex III (ESCRT-III) might indicate increased membrane remodeling processes in HFD offspring [22]. The downregulation of NDUFB3 and NDUFA6 potentially interacting in the respiratory chain of the mitochondrial membrane, as well as altered levels of 11 other proteins categorized as “mitochondrial” by Uniprot Keyword Analysis, hints at a potential role of the mitochondria in the effect of HFD on renal programming. This is not surprising since mitochondrial damage significantly contributes to glomerulopathy and proximal tubular injury in high fat diet-induced kidney damage in adult mice [23]. However, our study shows for the first time that this process might start as early as in utero.
In addition, String analysis could identify further interesting proteins which might contribute to fetal programming of kidney disease by maternal high fat diet. Thus, the upregulation of HMGCL and EPHX2 might lead to significant dysbalances of the eicosanoid metabolism. Cytochrome P450 eicosanoids like 20-hydroxyeicosatetraenoic acid (20-HETE) and epoxyeicosatrienoic acids are involved in the regulation of vascular tone, natriuresis and renal cyst formation [24]. Experimental inhibition of soluble epoxide hydrolase had blood pressure lowering effects in renovascular hypertension [25] and a gain-of-function EPHX2 polymorphism was shown to be associated with an increased incidence of acute kidney injury following cardiac surgery [26]. Mice deficient in soluble epoxide hydrolase were protected against streptozotocin-induced diabetic nephropathy [27]. Upregulation of two proteins related to hydrogen sulfide (H2S) synthesis might hint at a role of H2S in renal programming. In contrast to other gasotransmitters like nitric oxide (NO) and carbon monoxide (CO), the roles of H2S in kidney physiology are less well studied [28]. However, there is evidence that H2S has vasodilating [29] and anti-atherogenic properties [30].
Literature research (performed for all proteins significantly affected) further identified candidate proteins of special interest in the context of renal programming by HFD. Thus, 14-3-3 protein sigma (104.8-fold increase in HFD) is increased in many different kinds of renal pathology [31]. In addition, there is evidence that 14-3-3 protein sigma is involved in the activation of Akt/mTOR signaling by different stimuli [32,33]. Upregulation of alpha-2-HS-glycoprotein (35.4-fold), also known as fetuin-A, might especially be interesting in the context of vascular calcification, bone metabolism regulation and insulin resistance [34]. Protein AMBP (upregulation 32.1-fold) is expressed mainly in renal tubular cells and considered to be involved in the prevention of calcium oxalate crystal formation [35]. Upregulation of the catalytic subunit G1 of the V-type proton ATPase (ATP6V1G1; upregulated 14.3-fold) which is one of the enzymes that can cause distal renal acidosis [36], might alter renal concentration capacities or acid-base regulation by the kidney [37]. Aquaporin-1 upregulation (10.1-fold in our study) was lately shown to be protective against cyst development in models of autosomal dominant polycystic kidney disease [38]. On the other hand, upregulation of endothelial aquaporin-1 might be involved in the predisposition towards atherosclerosis via subendothelial intima compression [39]. For THY1 membrane glycoprotein (10-fold upregulated in our study), it was shown that overexpression decreases the activity of PPARγ and blocks adipocyte formation and it could therefore become a therapeutic target in obesity [40]. Galectin (upregulated 9.2-fold) was shown to be protective against Th1 and Th17 cell-mediated immune responses via enhanced Th2 immunity in the kidney [41]. In patients with diabetes type 2 and chronic kidney disease galectin is elevated [42]. Interestingly, galectin was able to suppress glomerular hypertrophy in db/db diabetic mice via cell-cycle regulatory mechanisms [43]. For protein kinase C alpha (PRKCA; -3.0-fold downregulated in our study), it was shown that downregulation may be protective in adult kidney disease [44,45], but disturbs nephron formation during kidney development in utero [46]. Finally, downregulation of DAPK1 (-48.6-fold) which is involved in pathways triggering apoptosis and autophagy might be protective against tubular injury from renal ischemia-reperfusion insults [47].
Comparable to the effect of high fat diet, metformin exposure in maternal standard diet induced the upregulation of proteins involved in transcription and translation. In maternal high fat diet, metformin exposure affected two proteins which are of putative interest in the context of kidney pathophysiology. Downregulation of PYCR1 (10.1-fold downregulated) might have anti-proliferative effects [48]. Downregulation of FXYD2 (-19.9 downregulated) might increase the activity of Na,K-ATPase, NCC and NKCC2 apical sodium transporters [49] which could in turn lead to sodium retention. However, FXYD2-knockout-mice were resistant to sodium retention and protected from salt-induced hypertension [50]. In humans, FXYD2 mutations can cause hypomagnesiaemia [51,52].
Surprisingly, in the first overlap analyses using a strict q-value cut off of <0.05, we did not identify any protein which was significantly altered by both the maternal high fat diet (HFD) compared to standard diet (SD) and, in the opposite direction, by metformin treatment in HFD animals. However, when looking at tendencies (q-value <0.1 instead of 0.05) still representing considerable alterations, we indeed found 11 proteins meeting the criteria of our second overlap analysis. Interestingly, all of them were regulated by HFD compared to SD in one direction and counter-regulated by metformin treatment in HFD animals compared to untreated HFD animals. Based on known physiological relevance in kidney pathophysiology as discussed above, ATP6V1G1, THY1, PRKCA and NDUFB3 represent the most promising candidates which might mediate “re-programming” effects of metformin therapy in maternal high fat diet.
The absence of overlapping specific protein alterations by metformin in the high fat diet and standard diet groups despite similar global protein expression clusters in the principal component analysis may be surprising at first sight. However, the proteomes of fetal kidneys under the high fat diet compared to the standard diet clearly differ, so different regulatory events are needed to overcome the diet effects.
Despite the clear design of the animal experiments and the interesting data, our study has a couple of limitations. First of all, our analysis did not consider the phosphorylation status of phospho-proteins. In addition, this study was designed as a hypothesis-generating study and did not include further analyses like western blots, histology or functional tests to confirm our results. Thus, the physiological relevance of our data remains to be elucidated by further studies.
In conclusion, our analyses provide evidence that both a maternal high fat diet and in-utero metformin exposure significantly impact upon the renal proteome of fetal male mice. With the help of String analysis and literature research we could identify interesting candidate proteins which might be involved in fetal programming of kidney disease. Beyond basic research, our results suggest that structured follow-up care with respect to early kidney disease should be discussed for all children born to obese mothers or mothers treated with metformin, e.g., renal ultrasound at birth and regular blood pressure measurements.

Supplementary Materials

The following are available online at https://www.mdpi.com/2077-0383/8/5/663/s1: Figure S1: Overlap cluster of three proteins significantly and relevantly (q < 0.05, fc ≥ 1.5) altered in fetal kidneys both by high fat diet (HFD compared to SD group) and by metformin during standard diet (SD-M compared to SD group) as identified by String analysis is shown. Srsf11, 60S ribosomal protein L23; Gtf2f2, Cingulin; Paf1, Integral membrane protein 2B, Table S1: Overlaps of proteins significantly and relevantly (q < 0.05, fc ≥ 1.5) altered in fetal kidneys both by high fat diet (HFD compared to SD group) and by metformin during standard diet (SD-M compared to SD group) are shown, Table S2: Overlaps of proteins considerably and relevantly altered (q < 0.1, fc ≥ 1.5) in fetal kidneys both by high fat diet (HFD compared to SD group) and by metformin during high fat diet (HFD-M compared to HFD group) are shown.

Author Contributions

Conceptualization, E.N., E.-M.T., G.F., J.V., E.H.-R., J.D., K.-D.N. and S.A.; Methodology, E.N., E.-M.T., G.F., J.V., C.Y., T.K., M.H., M.W., E.H.-R., K.-D.N. and S.A.; Validation, E.N., E.-M.T., G.F., J.V., T.K., L.T.W., J.D., K.-D.N. and S.A.; Data analysis, E.N., E.-M.T., G.F., J.V., T.K., K.-D.N. and S.A.; Investigation, E.N., E.-M.T., G.F., J.V., C.Y., T.K., M.H., M.W., K.-D.N. and S.A.; Writing—original draft preparation, E.N., G.F., J.V., T.K., K.-D.N. and S.A.; Writing—review and editing, E.N., E.-M.T., G.F., J.V., T.K., L.T.W., J.D., K.-D.N. and S.A.; Visualization, E.N., G.F., K.-D.N. and S.A.; Funding acquisition, S.A.

Funding

This research was funded by Marga and Walter-Boll Stiftung grant number 210-01.2-17 and the Deutsche Forschungsgemeinschaft (DFG) grant number AP 229/2-1 to SA.

Acknowledgments

We thank the CECAD Proteomics Facility (and staff members) for performing the Mass Spectometry and Proteomics data analysis.

Conflicts of Interest

The authors declare no conflict of interest.

References

  1. Nüsken, E.; Dötsch, J.; Weber, L.T.; Nüsken, K.D. Developmental Programming of Renal Function and Re-Programming Approaches. Front. Pediat. 2018, 6, 36. [Google Scholar] [CrossRef] [PubMed]
  2. Kanagalingam, M.G.; Forouhi, N.G.; Greer, I.A.; Sattar, N. Changes in booking body mass index over a decade: retrospective analysis from a Glasgow Maternity Hospital. BJOG 2005, 112, 1431–1433. [Google Scholar] [CrossRef] [PubMed] [Green Version]
  3. Callaway, L.K.; Prins, J.B.; Chang, A.M.; McIntyre, H.D. The prevalence and impact of overweight and obesity in an Australian obstetric population. Med. J. Aus. 2006, 184, 56–59. [Google Scholar]
  4. Lisonkova, S.; Muraca, G.M.; Potts, J.; Liauw, J.; Chan, W.S.; Skoll, A.; Lim, K.I. Association Between Prepregnancy Body Mass Index and Severe Maternal Morbidity. JAMA 2017, 318, 1777–1786. [Google Scholar] [CrossRef]
  5. Kim, S.S.; Zhu, Y.; Grantz, K.L.; Hinkle, S.N.; Chen, Z.; Wallace, M.E.; Smarr, M.M.; Epps, N.M.; Mendola, P. Obstetric and Neonatal Risks Among Obese Women Without Chronic Disease. Obstet. Gynecol. 2016, 128, 104–112. [Google Scholar] [CrossRef] [Green Version]
  6. Ovesen, P.; Rasmussen, S.; Kesmodel, U. Effect of prepregnancy maternal overweight and obesity on pregnancy outcome. Obstet. Gynecol. 2011, 118, 305–312. [Google Scholar] [CrossRef]
  7. Zandi-Nejad, K.; Luyckx, V.A.; Brenner, B.M. Adult hypertension and kidney disease: The role of fetal programming. Hypertension 2006, 47, 502–508. [Google Scholar] [CrossRef]
  8. Charlton, R.A.; Klungsoyr, K.; Neville, A.J.; Jordan, S.; Pierini, A.; de Jong-van den Berg, L.T.; Bos, H.J.; Puccini, A.; Engeland, A.; Gini, R.; et al. Prescribing of Antidiabetic Medicines before, during and after Pregnancy: A Study in Seven European Regions. PLoS ONE 2016, 11, e0155737. [Google Scholar] [CrossRef] [Green Version]
  9. Gray, S.G.; McGuire, T.M.; Cohen, N.; Little, P.J. The emerging role of metformin in gestational diabetes mellitus. Diabetes Obes. Metab. 2017, 19, 765–772. [Google Scholar] [CrossRef]
  10. Balani, J.; Hyer, S.; Johnson, A.; Shehata, H. Pregnancy outcomes after metformin treatment for gestational diabetes: a case-control study. Obstet. Med. 2012, 5, 78–82. [Google Scholar] [CrossRef] [Green Version]
  11. Chiswick, C.; Reynolds, R.M.; Denison, F.; Drake, A.J.; Forbes, S.; Newby, D.E.; Walker, B.R.; Quenby, S.; Wray, S.; Weeks, A.; et al. Effect of metformin on maternal and fetal outcomes in obese pregnant women (EMPOWaR): a randomised, double-blind, placebo-controlled trial. Lancet Diabetes Endocrinol. 2015, 3, 778–786. [Google Scholar] [CrossRef] [Green Version]
  12. Bolton, S.; Cleary, B.; Walsh, J.; Dempsey, E.; Turner, M.J. Continuation of metformin in the first trimester of women with polycystic ovarian syndrome is not associated with increased perinatal morbidity. Eur. J. Pediatr. 2009, 168, 203–206. [Google Scholar] [CrossRef] [PubMed]
  13. Charles, B.; Norris, R.; Xiao, X.; Hague, W. Population pharmacokinetics of metformin in late pregnancy. Ther. Drug Monit. 2006, 28, 67–72. [Google Scholar] [CrossRef]
  14. Vanky, E.; Zahlsen, K.; Spigset, O.; Carlsen, S.M. Placental passage of metformin in women with polycystic ovary syndrome. Fertil Steril. 2005, 83, 1575–1578. [Google Scholar] [CrossRef]
  15. Ijas, H.; Vaarasmaki, M.; Saarela, T.; Keravuo, R.; Raudaskoski, T. A follow-up of a randomised study of metformin and insulin in gestational diabetes mellitus: growth and development of the children at the age of 18 months. BJOG 2015, 122, 994–1000. [Google Scholar] [CrossRef]
  16. Battin, M.R.; Obolonkin, V.; Rush, E.; Hague, W.; Coat, S.; Rowan, J. Blood pressure measurement at two years in offspring of women randomized to a trial of metformin for GDM: follow up data from the MiG trial. BMC Pediatr. 2015, 15, 54. [Google Scholar] [CrossRef] [PubMed]
  17. Eckardt, K.U.; Coresh, J.; Devuyst, O.; Johnson, R.J.; Kottgen, A.; Levey, A.S.; Levin, A. Evolving importance of kidney disease: from subspecialty to global health burden. Lancet 2013, 382, 158–169. [Google Scholar] [CrossRef] [Green Version]
  18. Kasper, P.; Vohlen, C.; Dinger, K.; Mohr, J.; Hucklenbruch-Rother, E.; Janoschek, R.; Koth, J.; Matthes, J.; Appel, S.; Dötsch, J.; et al. Renal Metabolic Programming Is Linked to the Dynamic Regulation of a Leptin-Klf15 Axis and Akt/AMPKalpha Signaling in Male Offspring of Obese Dams. Endocrinology 2017, 158, 3399–3415. [Google Scholar] [CrossRef] [PubMed]
  19. Janoschek, R.; Bae-Gartz, I.; Vohlen, C.; Alcazar, M.A.; Dinger, K.; Appel, S.; Dötsch, J.; Hucklenbruch-Rother, E. Dietary intervention in obese dams protects male offspring from WAT induction of TRPV4, adiposity, and hyperinsulinemia. Obesity 2016, 24, 1266–1273. [Google Scholar] [CrossRef]
  20. Appel, S.; Schulze-Edinghausen, M.; Kretschmer, T.; Storck, S.; Janoschek, R.; Bae-Gartz, I.; Handwerk, M.; Wohlfarth, M.; Nüsken, K.D.; Hucklenbruch-Rother, E.; et al. Maternal obesity attenuates predelivery inflammatory reaction in C57BL/6N mice. J. Reprod. Immunol. 2017, 122, 10–13. [Google Scholar] [CrossRef]
  21. Appel, S.; Grothe, J.; Storck, S.; Janoschek, R.; Bae-Gartz, I.; Wohlfarth, M.; Handwerk, M.; Hucklenbruch-Rother, E.; Gellhaus, A.; Dötsch, J. A Potential Role for GSK3beta in Glucose-Driven Intrauterine Catch-Up Growth in Maternal Obesity. Endocrinology 2019, 160, 377–386. [Google Scholar] [CrossRef]
  22. Hurley, J.H.; Hanson, P.I. Membrane budding and scission by the ESCRT machinery: it’s all in the neck. Nat. Rev. Mol. Cell Biol. 2010, 11, 556–566. [Google Scholar] [CrossRef]
  23. Szeto, H.H.; Liu, S.; Soong, Y.; Alam, N.; Prusky, G.T.; Seshan, S.V. Protection of mitochondria prevents high-fat diet-induced glomerulopathy and proximal tubular injury. Kidney Int. 2016, 90, 997–1011. [Google Scholar] [CrossRef]
  24. Fan, F.; Roman, R.J. Effect of Cytochrome P450 Metabolites of Arachidonic Acid in Nephrology. J. Am. Soc. Nephrol. 2017, 28, 2845–2855. [Google Scholar] [CrossRef] [PubMed]
  25. Kopkan, L.; Huskova, Z.; Sporkova, A.; Varcabova, S.; Honetschlagerova, Z.; Hwang, S.H.; Tsai, H.J.; Hammock, B.D.; Imig, J.D.; Kramer, H.J.; et al. Soluble epoxide hydrolase inhibition exhibits antihypertensive actions independently of nitric oxide in mice with renovascular hypertension. Kidney Blood Press. Res. 2012, 35, 595–607. [Google Scholar] [CrossRef] [PubMed] [Green Version]
  26. Shuey, M.M.; Billings, F.T.t.; Wei, S.; Milne, G.L.; Nian, H.; Yu, C.; Brown, N.J. Association of gain-of-function EPHX2 polymorphism Lys55Arg with acute kidney injury following cardiac surgery. PLoS ONE 2017, 12, e0175292. [Google Scholar] [CrossRef]
  27. Chen, G.; Xu, R.; Wang, Y.; Wang, P.; Zhao, G.; Xu, X.; Gruzdev, A.; Zeldin, D.C.; Wang, D.W. Genetic disruption of soluble epoxide hydrolase is protective against streptozotocin-induced diabetic nephropathy. Am. J. Physiol. Endocrinol. Metab. 2012, 303, E563–E575. [Google Scholar] [CrossRef] [Green Version]
  28. Kasinath, B.S.; Feliers, D.; Lee, H.J. Hydrogen sulfide as a regulatory factor in kidney health and disease. Biochem. Pharmacol. 2018, 149, 29–41. [Google Scholar] [CrossRef] [PubMed]
  29. Yang, G.; Wu, L.; Jiang, B.; Yang, W.; Qi, J.; Cao, K.; Meng, Q.; Mustafa, A.K.; Mu, W.; Zhang, S.; et al. H2S as a physiologic vasorelaxant: hypertension in mice with deletion of cystathionine gamma-lyase. Science 2008, 322, 587–590. [Google Scholar] [CrossRef] [PubMed]
  30. Mani, S.; Li, H.; Untereiner, A.; Wu, L.; Yang, G.; Austin, R.C.; Dickhout, J.G.; Lhotak, S.; Meng, Q.H.; Wang, R. Decreased endogenous production of hydrogen sulfide accelerates atherosclerosis. Circulation 2013, 127, 2523–2534. [Google Scholar] [CrossRef]
  31. Rizou, M.; Frangou, E.A.; Marineli, F.; Prakoura, N.; Zoidakis, J.; Gakiopoulou, H.; Liapis, G.; Kavvadas, P.; Chatziantoniou, C.; Makridakis, M.; et al. The family of 14-3-3 proteins and specifically 14-3-3sigma are up-regulated during the development of renal pathologies. J. Cell. Mol. Med. 2018, 22, 4139–4149. [Google Scholar] [CrossRef]
  32. Evren, S.; Dermen, A.; Lockwood, G.; Fleshner, N.; Sweet, J. mTOR-RAPTOR and 14-3-3sigma immunohistochemical expression in high grade prostatic intraepithelial neoplasia and prostatic adenocarcinomas: a tissue microarray study. J. Clin. Pathol. 2011, 64, 683–688. [Google Scholar] [CrossRef]
  33. Kim, S.; Wong, P.; Coulombe, P.A. A keratin cytoskeletal protein regulates protein synthesis and epithelial cell growth. Nature 2006, 441, 362–365. [Google Scholar] [CrossRef] [PubMed]
  34. Mori, K.; Emoto, M.; Inaba, M. Fetuin-A: a multifunctional protein. Recent Pat. Endocr. Metab. Immune Drug Discov. 2011, 5, 124–146. [Google Scholar] [CrossRef] [PubMed]
  35. Grewal, J.S.; Tsai, J.Y.; Khan, S.R. Oxalate-inducible AMBP gene and its regulatory mechanism in renal tubular epithelial cells. Biochem. J. 2005, 387, 609–616. [Google Scholar] [CrossRef] [Green Version]
  36. Alper, S.L. Familial renal tubular acidosis. J. Nephrol. 2010, 23 (Suppl. 16), S57–S76. [Google Scholar] [PubMed]
  37. Trepiccione, F.; Gerber, S.D.; Grahammer, F.; Lopez-Cayuqueo, K.I.; Baudrie, V.; Paunescu, T.G.; Capen, D.E.; Picard, N.; Alexander, R.T.; Huber, T.B.; et al. Renal Atp6ap2/(Pro)renin Receptor Is Required for Normal Vacuolar H+-ATPase Function but Not for the Renin-Angiotensin System. J. Am. Soc. Nephrol. 2016, 27, 3320–3330. [Google Scholar] [CrossRef] [PubMed]
  38. Wang, W.; Li, F.; Sun, Y.; Lei, L.; Zhou, H.; Lei, T.; Xia, Y.; Verkman, A.S.; Yang, B. Aquaporin-1 retards renal cyst development in polycystic kidney disease by inhibition of Wnt signaling. FASEB J. 2015, 29, 1551–1563. [Google Scholar] [CrossRef] [Green Version]
  39. Toussaint, J.; Raval, C.B.; Nguyen, T.; Fadaifard, H.; Joshi, S.; Wolberg, G.; Quarfordt, S.; Jan, K.M.; Rumschitzki, D.S. Chronic hypertension increases aortic endothelial hydraulic conductivity by upregulating endothelial aquaporin-1 expression. Am. J. Physiol. Heart Circ. Physiol. 2017, 313, H1063–H1073. [Google Scholar] [CrossRef]
  40. Woeller, C.F.; O’Loughlin, C.W.; Pollock, S.J.; Thatcher, T.H.; Feldon, S.E.; Phipps, R.P. Thy1 (CD90) controls adipogenesis by regulating activity of the Src family kinase, Fyn. FASEB J. 2015, 29, 920–931. [Google Scholar] [CrossRef]
  41. Zhang, Q.; Luan, H.; Wang, L.; He, F.; Zhou, H.; Xu, X.; Li, X.; Xu, Q.; Niki, T.; Hirashima, M.; et al. Galectin-9 ameliorates anti-GBM glomerulonephritis by inhibiting Th1 and Th17 immune responses in mice. Am. J. Physiol. Renal Physiol. 2014, 306, F822–F832. [Google Scholar] [CrossRef] [PubMed] [Green Version]
  42. Kurose, Y.; Wada, J.; Kanzaki, M.; Teshigawara, S.; Nakatsuka, A.; Murakami, K.; Inoue, K.; Terami, T.; Katayama, A.; Watanabe, M.; et al. Serum galectin-9 levels are elevated in the patients with type 2 diabetes and chronic kidney disease. BMC Nephrol. 2013, 14, 23. [Google Scholar] [CrossRef] [PubMed]
  43. Baba, M.; Wada, J.; Eguchi, J.; Hashimoto, I.; Okada, T.; Yasuhara, A.; Shikata, K.; Kanwar, Y.S.; Makino, H. Galectin-9 inhibits glomerular hypertrophy in db/db diabetic mice via cell-cycle-dependent mechanisms. J. Am. Soc. Nephrol. 2005, 16, 3222–3234. [Google Scholar] [CrossRef] [PubMed]
  44. Kvirkvelia, N.; McMenamin, M.; Warren, M.; Jadeja, R.N.; Kodeboyina, S.K.; Sharma, A.; Zhi, W.; O’Connor, P.M.; Raju, R.; Lucas, R.; et al. Kidney-targeted inhibition of protein kinase C-alpha ameliorates nephrotoxic nephritis with restoration of mitochondrial dysfunction. Kidney Int. 2018, 94, 280–291. [Google Scholar] [CrossRef]
  45. Koya, D. Dual protein kinase C alpha and beta inhibitors and diabetic kidney disease: a revisited therapeutic target for future clinical trials. J. Diabetes Investig. 2014, 5, 147–148. [Google Scholar] [CrossRef]
  46. Serlachius, E.; Svennilson, J.; Schalling, M.; Aperia, A. Protein kinase C in the developing kidney: isoform expression and effects of ceramide and PKC inhibitors. Kidney Int. 1997, 52, 901–910. [Google Scholar] [CrossRef] [PubMed]
  47. Kishino, M.; Yukawa, K.; Hoshino, K.; Kimura, A.; Shirasawa, N.; Otani, H.; Tanaka, T.; Owada-Makabe, K.; Tsubota, Y.; Maeda, M.; et al. Deletion of the kinase domain in death-associated protein kinase attenuates tubular cell apoptosis in renal ischemia-reperfusion injury. J. Am. Soc. Nephrol. 2004, 15, 1826–1834. [Google Scholar] [CrossRef] [PubMed]
  48. Loayza-Puch, F.; Rooijers, K.; Buil, L.C.; Zijlstra, J.; Oude Vrielink, J.F.; Lopes, R.; Ugalde, A.P.; van Breugel, P.; Hofland, I.; Wesseling, J.; et al. Tumour-specific proline vulnerability uncovered by differential ribosome codon reading. Nature 2016, 530, 490–494. [Google Scholar] [CrossRef] [PubMed]
  49. Arystarkhova, E.; Ralph, D.L.; Liu, Y.B.; Bouley, R.; McDonough, A.A.; Sweadner, K.J. Paradoxical activation of the sodium chloride cotransporter (NCC) without hypertension in kidney deficient in a regulatory subunit of Na,K-ATPase, FXYD2. Physiol. Rep. 2014, 2. [Google Scholar] [CrossRef]
  50. Arystarkhova, E. Beneficial Renal and Pancreatic Phenotypes in a Mouse Deficient in FXYD2 Regulatory Subunit of Na,K-ATPase. Front. Physiol. 2016, 7, 88. [Google Scholar] [CrossRef]
  51. de Baaij, J.H.; Dorresteijn, E.M.; Hennekam, E.A.; Kamsteeg, E.J.; Meijer, R.; Dahan, K.; Muller, M.; van den Dorpel, M.A.; Bindels, R.J.; Hoenderop, J.G.; et al. Recurrent FXYD2 p.Gly41Arg mutation in patients with isolated dominant hypomagnesaemia. Nephrol. Dial. Transplant. 2015, 30, 952–957. [Google Scholar] [CrossRef] [PubMed] [Green Version]
  52. Cairo, E.R.; Swarts, H.G.; Wilmer, M.J.; Willems, P.H.; Levtchenko, E.N.; De Pont, J.J.; Koenderink, J.B. FXYD2 and Na,K-ATPase expression in isolated human proximal tubular cells: disturbed upregulation on renal hypomagnesemia? J. Membr. Biol. 2009, 231, 117–124. [Google Scholar] [CrossRef] [PubMed]
Figure 1. Representative example of laser dissection is shown.
Jcm 08 00663 g001
Figure 2. Principal component analysis. Orange dots, HFD group; pink dots, SD group; blue dots, HFD-M group; green dots, SD-M group.
Jcm 08 00663 g002
Figure 3. (a) Venn diagram to visualize number of overlaps of significantly (q < 0.05) and relevantly (fold change ≥1.5) altered proteins of the comparisons SD-M vs. SD (i.e., number of renal proteins altered by metformin in fetuses of dams fed a standard diet), HFD vs. SD (i.e., number of renal proteins altered by high fat diet) and HFD-M vs. HFD (i.e., number of renal proteins altered by metformin in fetuses of dams fed a high fat diet); (b) Venn diagram to visualize number of overlaps of considerably (q < 0.1) and relevantly (fold change ≥1.5) altered proteins of the same comparisons.
Jcm 08 00663 g003
Figure 4. Clusters of potentially interacting, significantly (q < 0.05) and relevantly (fold change ≥1.5) altered proteins in fetal kidneys of dams fed a high fat diet without metformin (HFD group) compared to the group fed a standard diet without metformin (SD group) as identified by String analysis are shown. Symbols #, ¥, *, ◦, & were assigned to the clusters and correspond to the symbols in Table 1.
Jcm 08 00663 g004
Figure 5. Clusters of potentially interacting, significantly (q < 0.05) and relevantly (fold change ≥1.5) altered proteins in fetal kidneys of dams fed the standard diet with metformin (SD-M group) compared to the group fed the standard diet without metformin (SD group) as identified by String analysis are shown. Symbols $, £, € were assigned to the clusters and correspond to the symbols in Table 2.
Jcm 08 00663 g005
Table 1. Differentially expressed proteins (fc ≥ 1.5, q < 0.05) in kidneys of fetuses from dams fed a high fat diet without metformin (HFD group) compared to SD group fed a standard diet without metformin are shown.
Protein IDProtein Nameq-valueFold ChangeValid ValuesGene NameClusterFunctional
Enrichments
SDHFD
O7045614-3-3 protein sigma<0.05104.803Sfn
P6283060S ribosomal protein L23<0.00165.003Rpl23#
P43274Histone H1.4<0.0549.703Hist1h1e
P29699Alpha-2-HS-glycoprotein<0.0535.403Ahsg
Q07456Protein AMBP<0.0532.103Ambp
E9Q8N1Titin<0.0522.803Ttn
O55125Protein NipSnap homolog 1<0.0516.503Nipsnap1
Q9CR51V-type proton ATPase subunit G 1<0.0514.303Atp6v1g1
Q9D2U9Histone H2B type 3-A<0.00112.003Hist3h2ba
Q02013Aquaporin-1<0.0510.103Aqp1
A0A1L1SUX8Thy-1 membrane glycoprotein<0.0510.003Thy1
B1AQR8Galectin<0.059.203Lgals9
Q9EP89Serine beta-lactamase-like protein LACTB, mitochondrial<0.059.103Lactb
P61028Ras-related protein Rab-8B<0.059.003Rab8b
Q8BJ64Choline dehydrogenase, mitochondrial<0.058.403Chdh
Q6P069Sorcin<0.058.003Sri
Q9D706RNA polymerase II-associated protein 3<0.057.203Rpap3
Q3UFY77-methylguanosine phosphate-specific 5-nucleotidase<0.056.803Nt5c3b
P34914Bifunctional epoxide hydrolase 2<0.056.203Ephx2&
Q3UW66Sulfurtransferase<0.056.103Mpst*
Q3ULB1Testin<0.056.003Tes
Q8BJF9Charged multivesicular body protein 2b<0.055.803Chmp2b¥
J3QJX3Protein sel-1 homolog 1<0.055.603Sel1l
Q3TE40Replication protein A 32 kDa subunit<0.0015.403Rpa2
Q8K2T8RNA polymerase II-associated factor 1 homolog<0.055.003Paf1#
D3Z3D2Nuclear cap-binding protein subunit 2<0.054.903Ncbp2#
Q99LU0Charged multivesicular body protein 1b-1<0.054.603Chmp1b1¥
Q9CZR8Elongation factor Ts, mitochondrial<0.054.603Tsfm
Q8R409Protein HEXIM1<0.054.403Hexim1
Q8BGY7Protein FAM210A<0.054.303Fam210a
O88665Bromodomain-containing protein 7<0.0014.303Brd7
Q3UIX4N/A<0.054.103Srsf11#
E9QMC1Cingulin<0.054.003Cgn
A0A0R4J1N9Transcription factor A, mitochondrial<0.054.003Tfam
Q9JIK928S ribosomal protein S34, mitochondrial<0.053.903Mrps34
A0A1L1SSA8Transmembrane protein 205<0.053.903Tmem205
Q99LS3Phosphoserine phosphatase<0.013.903Psph
Q8BHS6Armadillo repeat-containing X-linked protein 3<0.053.803Armcx3
Q8R0A0General transcription factor IIF subunit 2<0.053.603Gtf2f2#
O89051Integral membrane protein 2B<0.053.403Itm2b
Q8VCN5Cystathionine gamma-lyase<0.053.303Cth*
O35682Myeloid-associated differentiation marker<0.053.303Myadm
Q3UI43BRISC and BRCA1-A complex member 1<0.053.203Babam1
P38060Hydroxymethylglutaryl-CoA lyase, mitochondrial<0.0013.102Hmgcl&
O55106Striatin<0.053.003Strn
A0A140LIQ1Transforming acidic coiled-coil-containing protein 2<0.052.903Tacc2
Q3UE37Ubiquitin-conjugating enzyme E2 Z<0.052.403Ube2z
Q9WVL0Maleylacetoacetate isomerase<0.051.803Gstz1
Q9ESU7Amino acid transporter<0.05−1.533Slc1a5
E9PZY8Protein virilizer homolog<0.05−2.130Virma
Q4VA93Protein kinase C<0.05−3.030Prkca
Q9CQZ6NADH dehydrogenase [ubiquinone] 1 beta subcomplex subunit 3<0.001−9.630Ndufb3°
Q9CQZ5NADH dehydrogenase [ubiquinone] 1 alpha subcomplex subunit 6<0.05−10.530Ndufa6°
D3YZN4Paraplegin<0.001−12.330Spg7
E9QAE4Histone-lysine N-methyltransferase<0.05−17.830Nsd1
Q80YE7Death-associated protein kinase 1<0.001−48.630Dapk1
SD, standard diet without metformin; HFD, high fat diet without metformin; fold change: positive values indicate upregulation in HFD compared to SD, negative values indicate downregulation; N/A, not available. Color codes indicate functional enrichments (FDR < 0.01) identified by STRING (red marks, Phosphoprotein, orange marks, Regulation of primary metabolic process, blue marks, Acetylation, yellow marks, Mitochondrion). Symbols (#, ¥, *, ◦, &) indicate affiliation with different clusters identified by STRING analysis (see Figure 4).
Table 2. Differentially expressed proteins (fc ≥ 1.5, q < 0.05) in kidneys of fetuses from dams fed a standard diet with metformin (SD-M group) compared to SD group fed a standard diet without metformin are shown.
Protein IDProtein Nameq-valueFold ChangeValid ValuesGene NameCluster
SDSD-M
P6283060S ribosomal protein L23<0.05106.803Rpl23
Q07456Protein AMBP<0.0531.403Ambp
O55125Protein NipSnap homolog 1<0.00116.603Nipsnap1
P11438Lysosome-associated membrane glycoprotein 1<0.0515.503Lamp1£
Q9D2U9Histone H2B type 3-A<0.0513.603Hist3h2ba$
G3UXX5DNA-directed RNA polymerases I and III subunit RPAC1<0.0511.303Polr1c$
Q9EP89Serine beta-lactamase-like protein LACTB, mitochondrial<0.059.003Lactb
Q9D706RNA polymerase II-associated protein 3<0.058.203Rpap3
Q8K2T8RNA polymerase II-associated factor 1 homolog<0.057.903Paf1$
Q3ULB1Testin<0.056.103Tes
O88665Bromodomain-containing protein 7<0.055.303Brd7
Q9JIK928S ribosomal protein S34, mitochondrial<0.055.103Mrps34
P11157Ribonucleoside-diphosphate reductase subunit M2<0.055.003Rrm2
Q3UIX4Serine/arginine-rich-splicing factor 11<0.055.003Srsf11$
A0A0R4J0L628S ribosomal protein S35, mitochondrial<0.055.003Mrps35
Q9DBX2Phosducin-like protein<0.014.803Pdcl
H7BX44Non-specific serine/threonine protein kinase<0.054.703Cdc42bpa
Q8R0A0General transcription factor IIF subunit 2<0.054.203Gtf2f2$
F8WIK0Anamorsin<0.054.203Ciapin1
E9QMC1Cingulin<0.053.703Cgn
O55106Striatin<0.013.503Strn
O89051Integral membrane protein 2B<0.0013.403Itm2b
Q8N7N5DDB1- and CUL4-associated factor 8<0.052.803Dcaf8
Q3UH93Plexin-D1<0.052.703Plxnd1
A0A0R4J0G4Ran-binding protein 10<0.052.603Ranbp10
P52483Ubiquitin-conjugating enzyme E2 E3<0.052.303Ube2e3
G3UZ63Kelch domain-containing protein 4<0.052.303Klhdc4
A0A0A6YX02Ragulator complex protein LAMTOR1<0.05−10.330Lamtor1£
Q80YE7Death-associated protein kinase 1<0.05−48.730Dapk1
SD, standard diet without metformin; SD-M, standard diet with metformin; fold change: positive values indicate upregulation in SD-M compared to SD, negative values indicate downregulation; Symbols ($, £, €) indicate affiliation with different clusters identified by STRING analysis (see Figure 5).
Table 3. Differentially expressed proteins (fc ≥1.5, q < 0.05) in kidneys of fetuses from dams fed a high fat diet with metformin (HFD-M group) compared to HFD group fed a high fat diet without metformin are shown.
Protein IDProtein Nameq-valueFold ChangeValid ValuesGene Name
HFDHFD-M
A0A0R4J0L628S ribosomal protein S35, mitochondrial<0.058.603Mrps35
Q8K2C9Very-long-chain (3R)-3-hydroxyacyl-CoA dehydratase 3<0.057.403Hacd3
E9Q784Zinc finger CCCH domain-containing protein 13<0.0015.703Zc3h13
Q9Z1J3Cysteine desulfurase, mitochondrial<0.05−3.030Nfs1
Q922W5Pyrroline-5-carboxylate reductase 1, mitochondrial<0.05−10.130Pycr1
Q04646Sodium/potassium-transporting ATPase subunit gamma<0.05−19.930Fxyd2
HFD, high fat diet without metformin; HFD-M, high fat diet with metformin; fold change: positive values indicate upregulation in HFD-M compared to HFD, negative values indicate downregulation.

