Thrombin Preconditioning of Extracellular Vesicles Derived from Mesenchymal Stem Cells Accelerates Cutaneous Wound Healing by Boosting Their Biogenesis and Enriching Cargo Content

 and
and 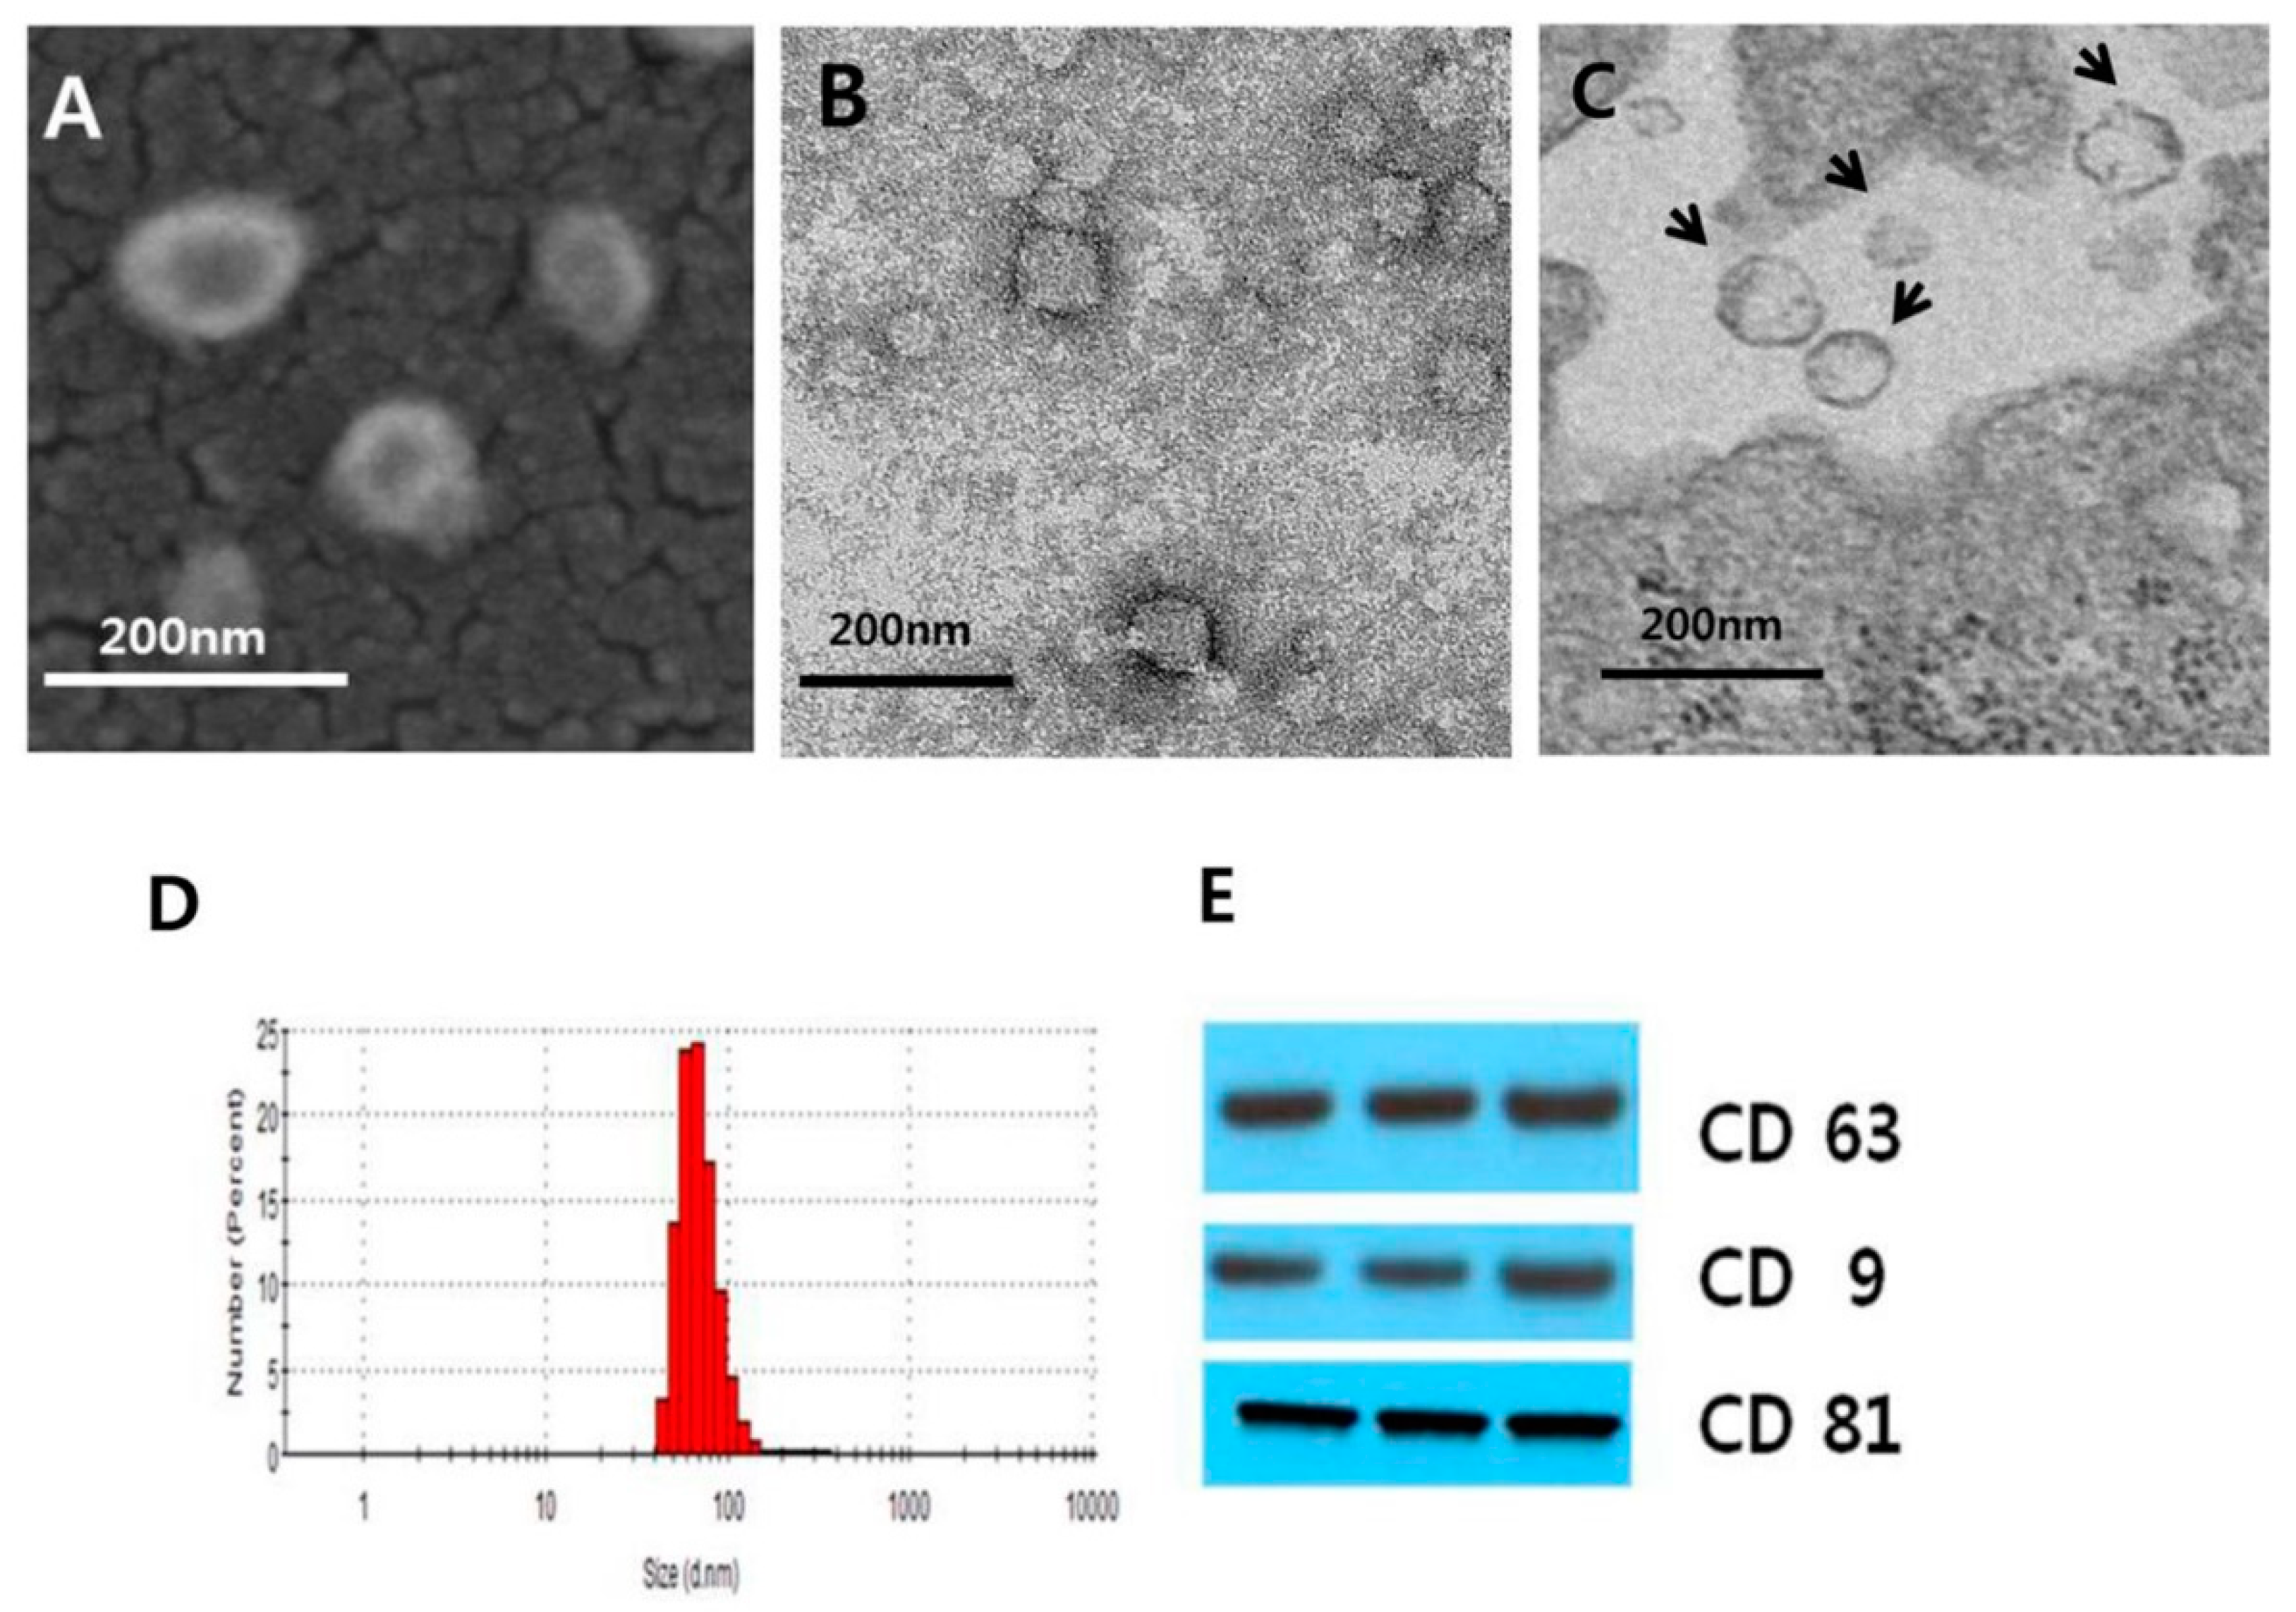
Abstract
:1. Introduction
2. Experimental Section
2.1. Mesenchymal Stem Cells
2.2. Preconditioning of MSCs
2.3. Isolation of EVs
2.4. Quantification of EV Production
2.5. Early Endosome Labeling
2.6. Angiogenesis Antibody Array Assay
2.7. Bioplex Assay
2.8. Bovine Thrombin Residual Measurements
2.9. Western Blot Analysis
2.10. In Vitro Matrigel Tube Formation Assay
2.11. In Vitro Proliferation and Viability Assays
2.12. In Vitro Scratch-Wound-Closure Assays
2.13. Animal Model
2.14. Transmission Electron Microscopy (TEM)
2.15. Scanning electron microscopy (SEM)
2.16. Statistical Analyses
3. Results
3.1. Isolation and Characterization of MSC-Derived EVs
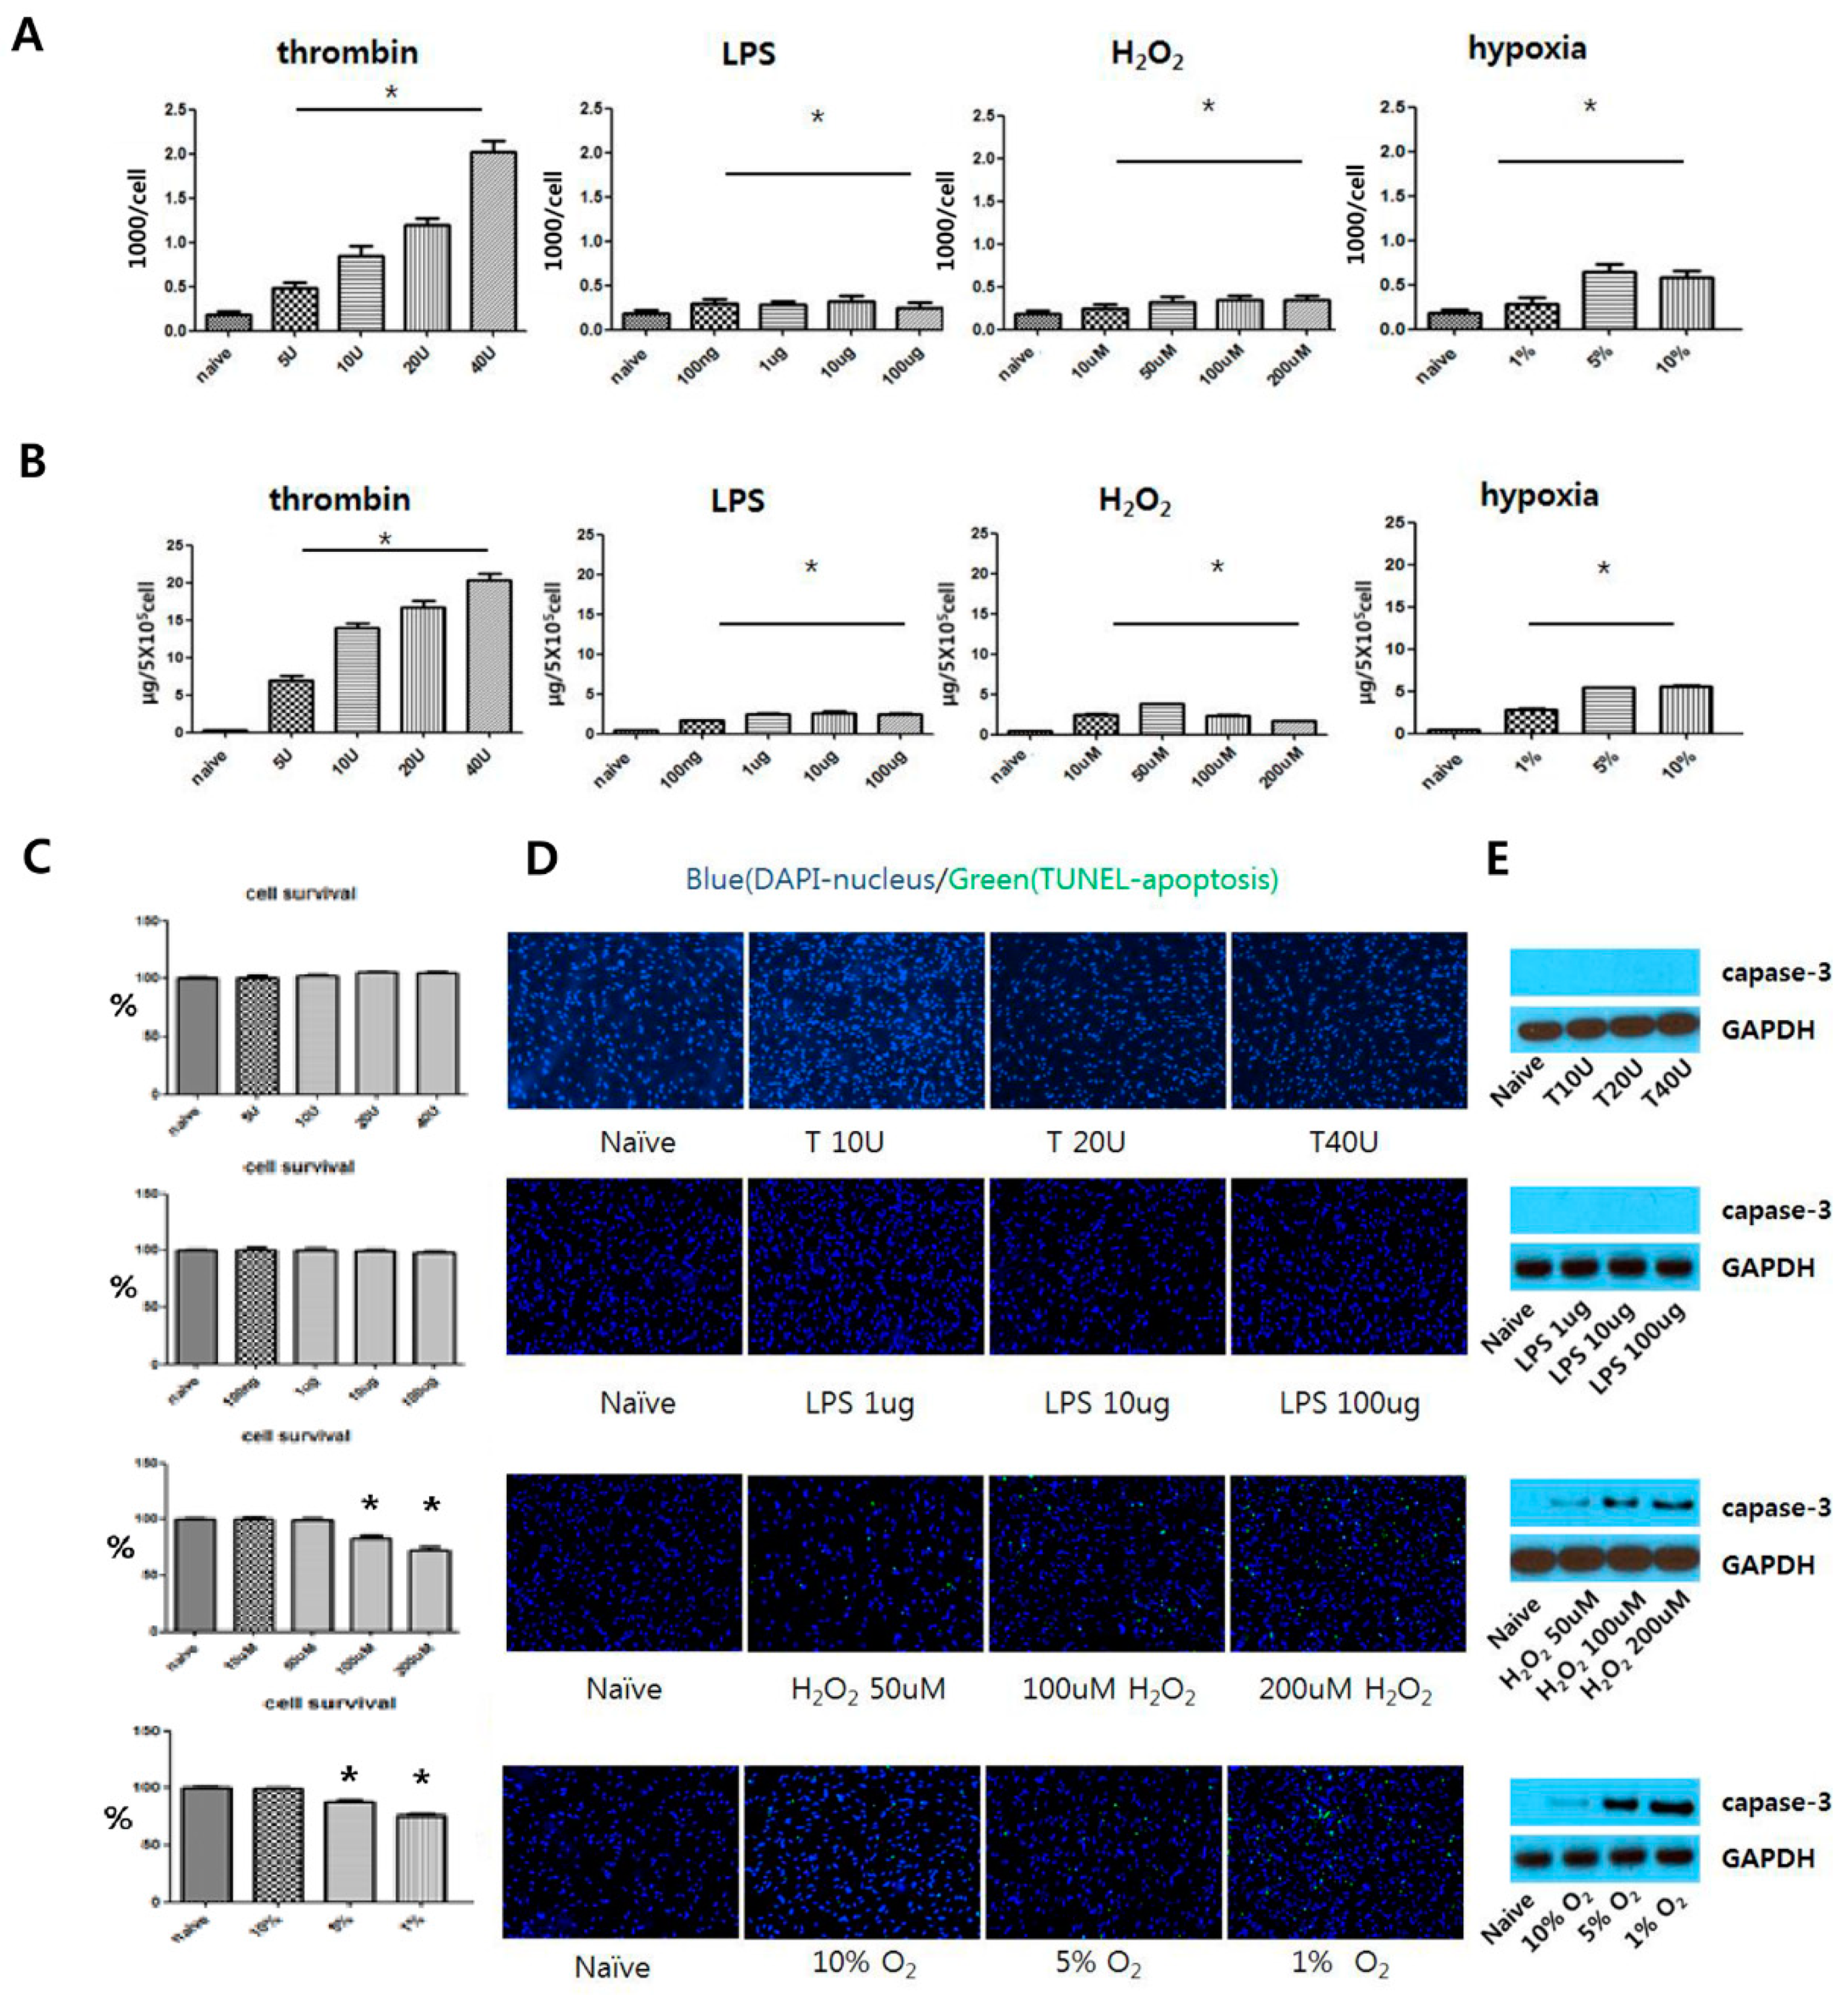
3.2. Determining Optimal Preconditioning Regimen for Optimal EV production
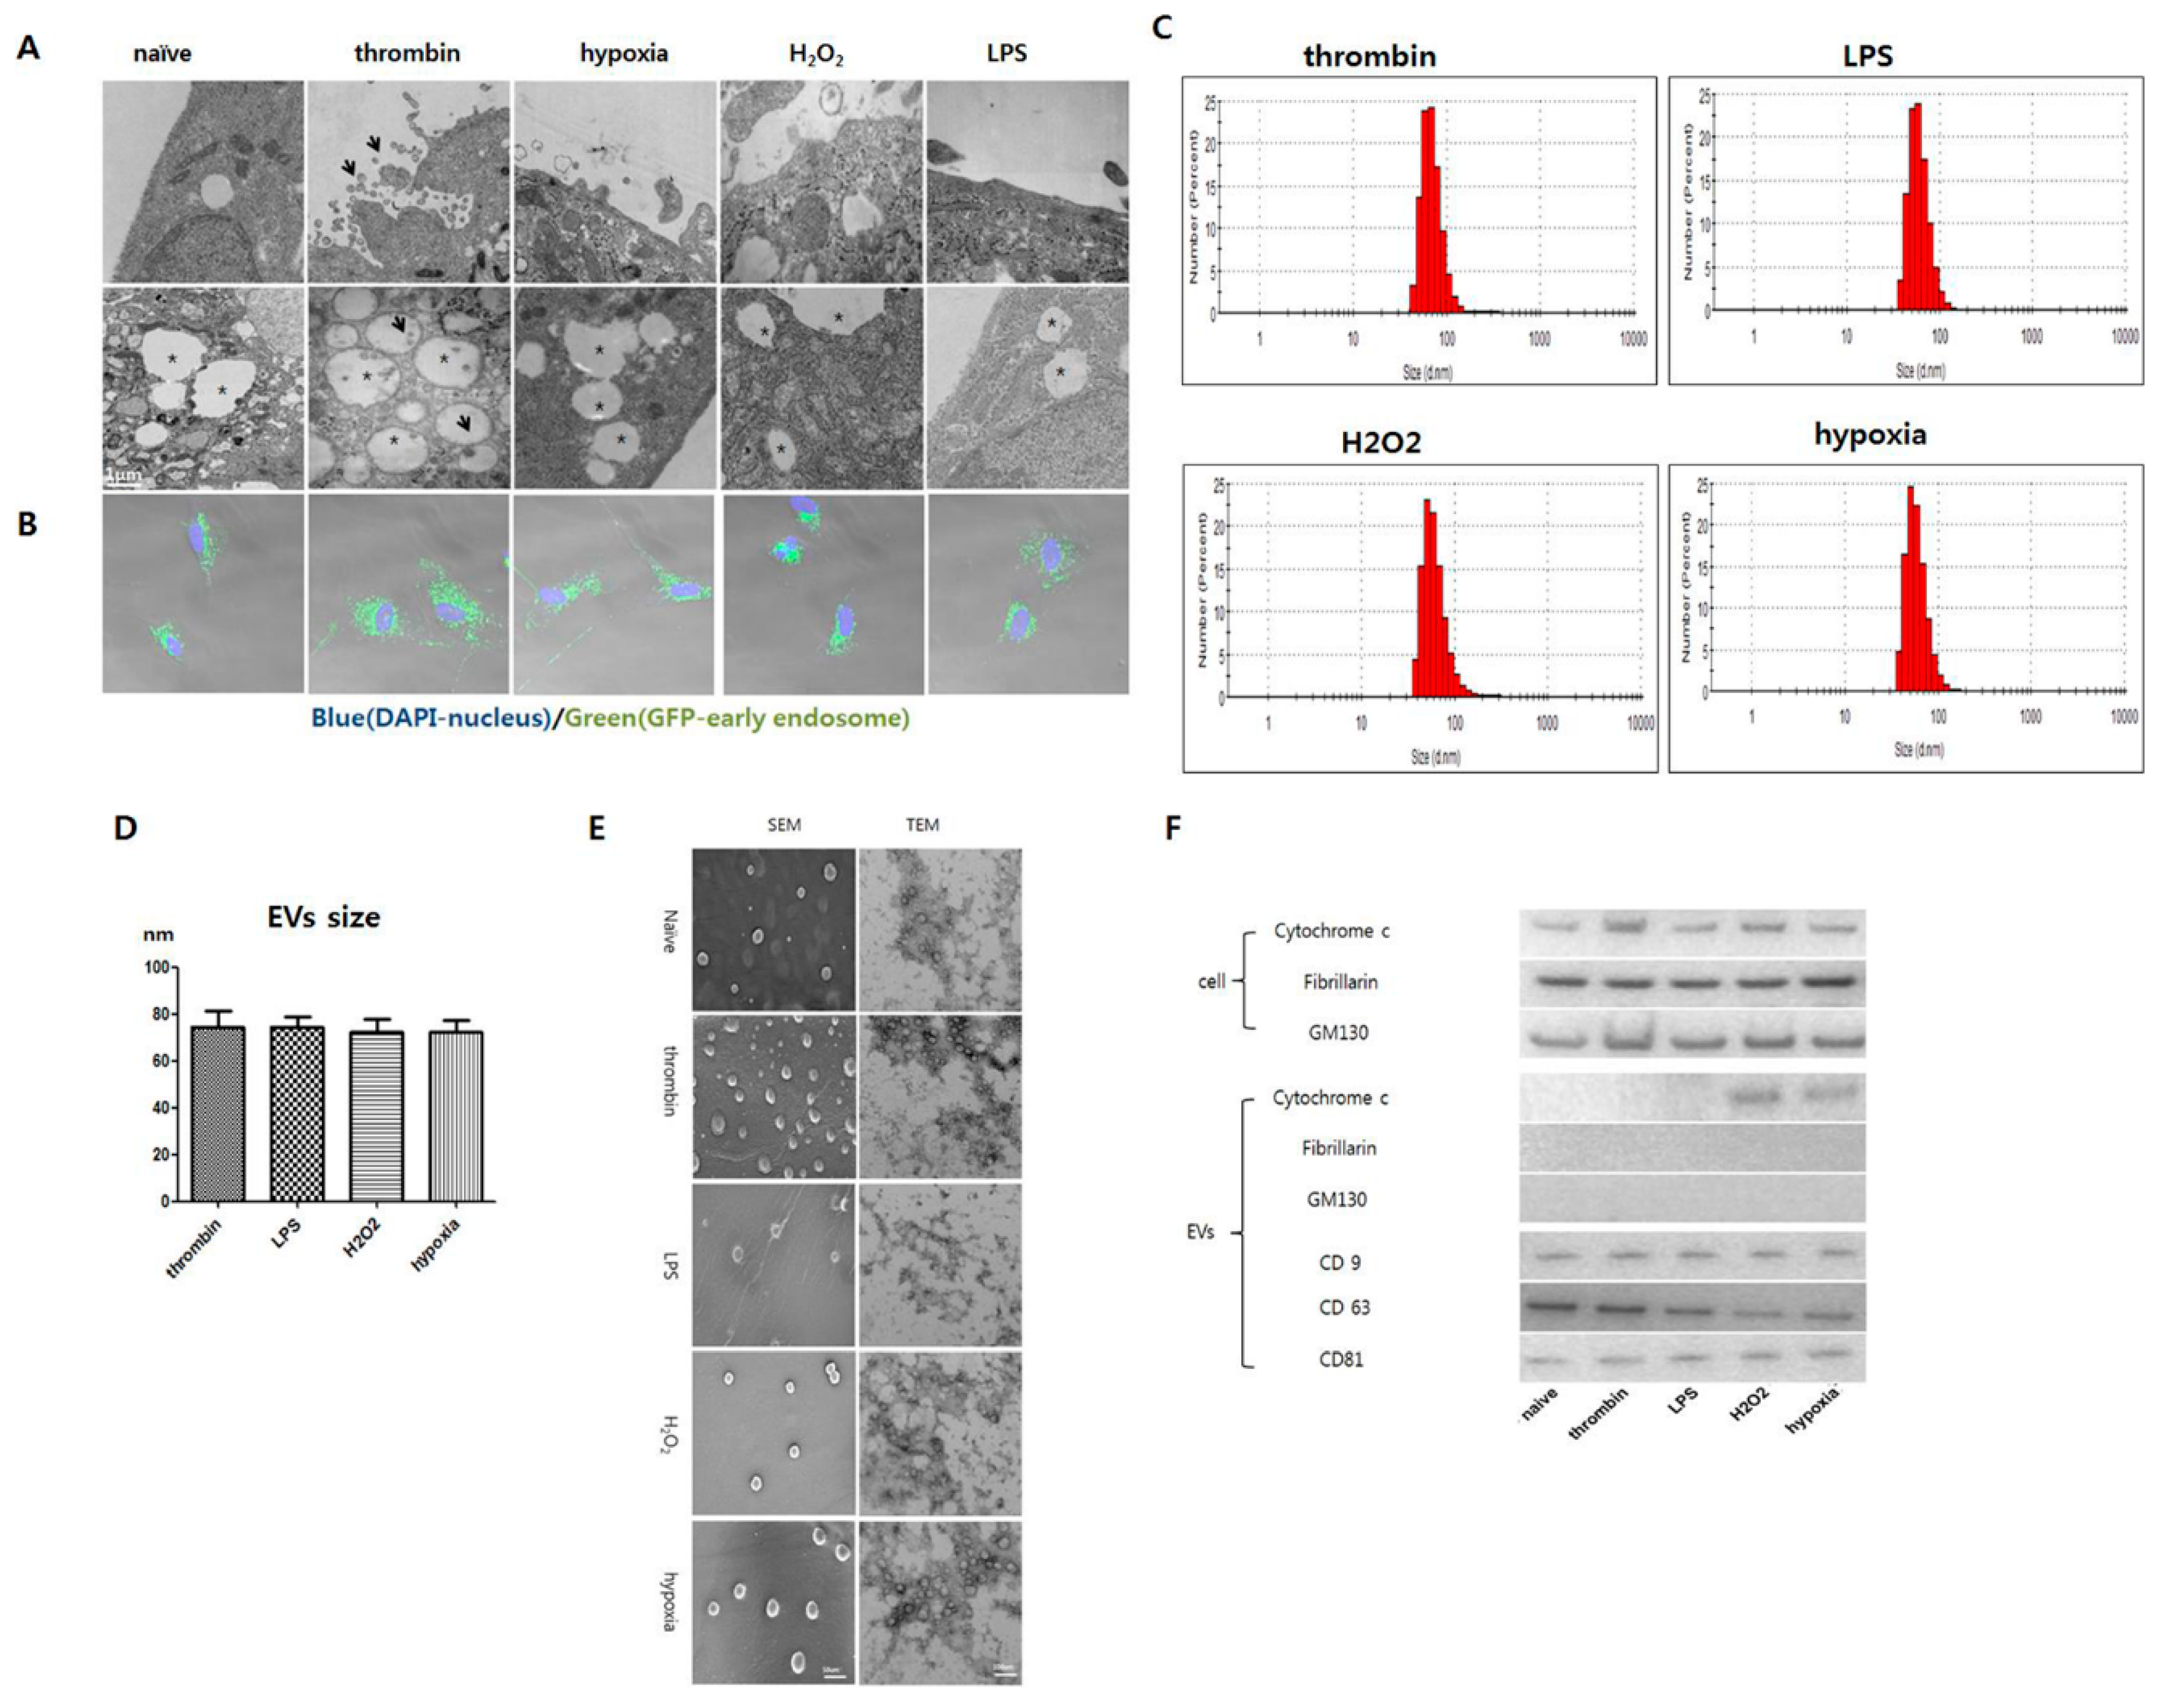
3.3. Effects of Preconditioning on EV Production and Characteristics
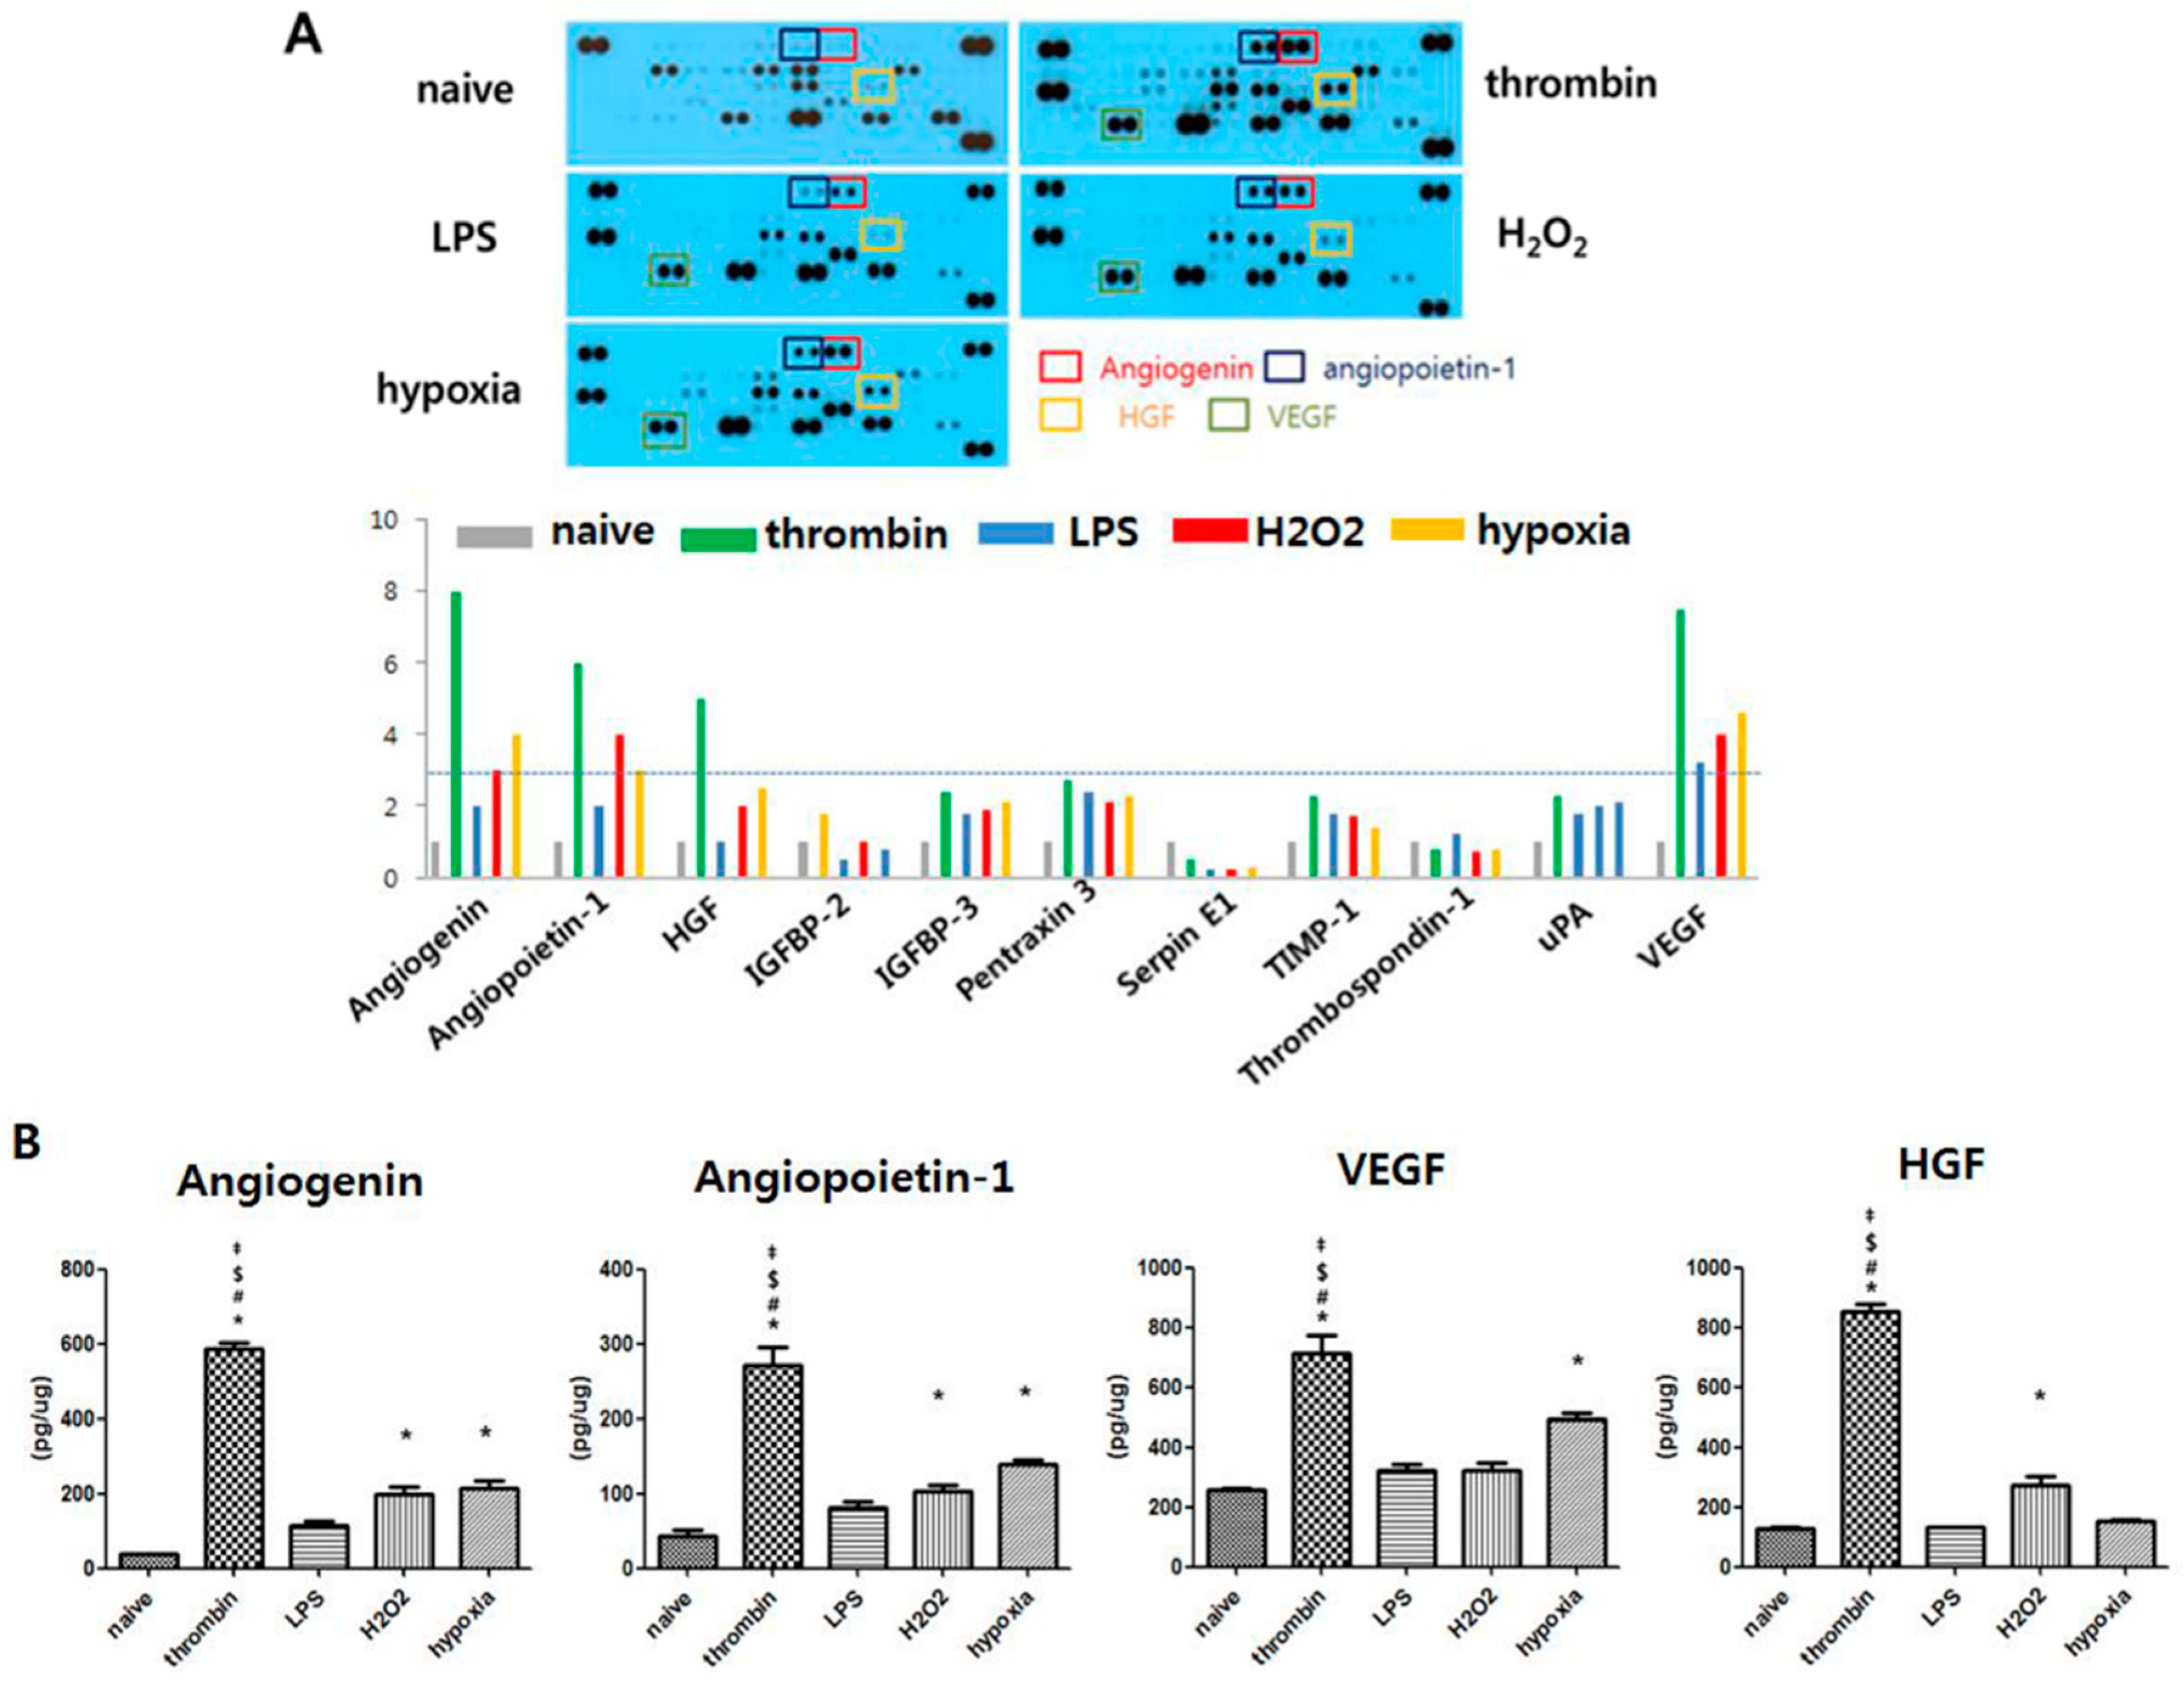
3.4. Effects of Preconditioning on Protein Cargo in Shedding EVs
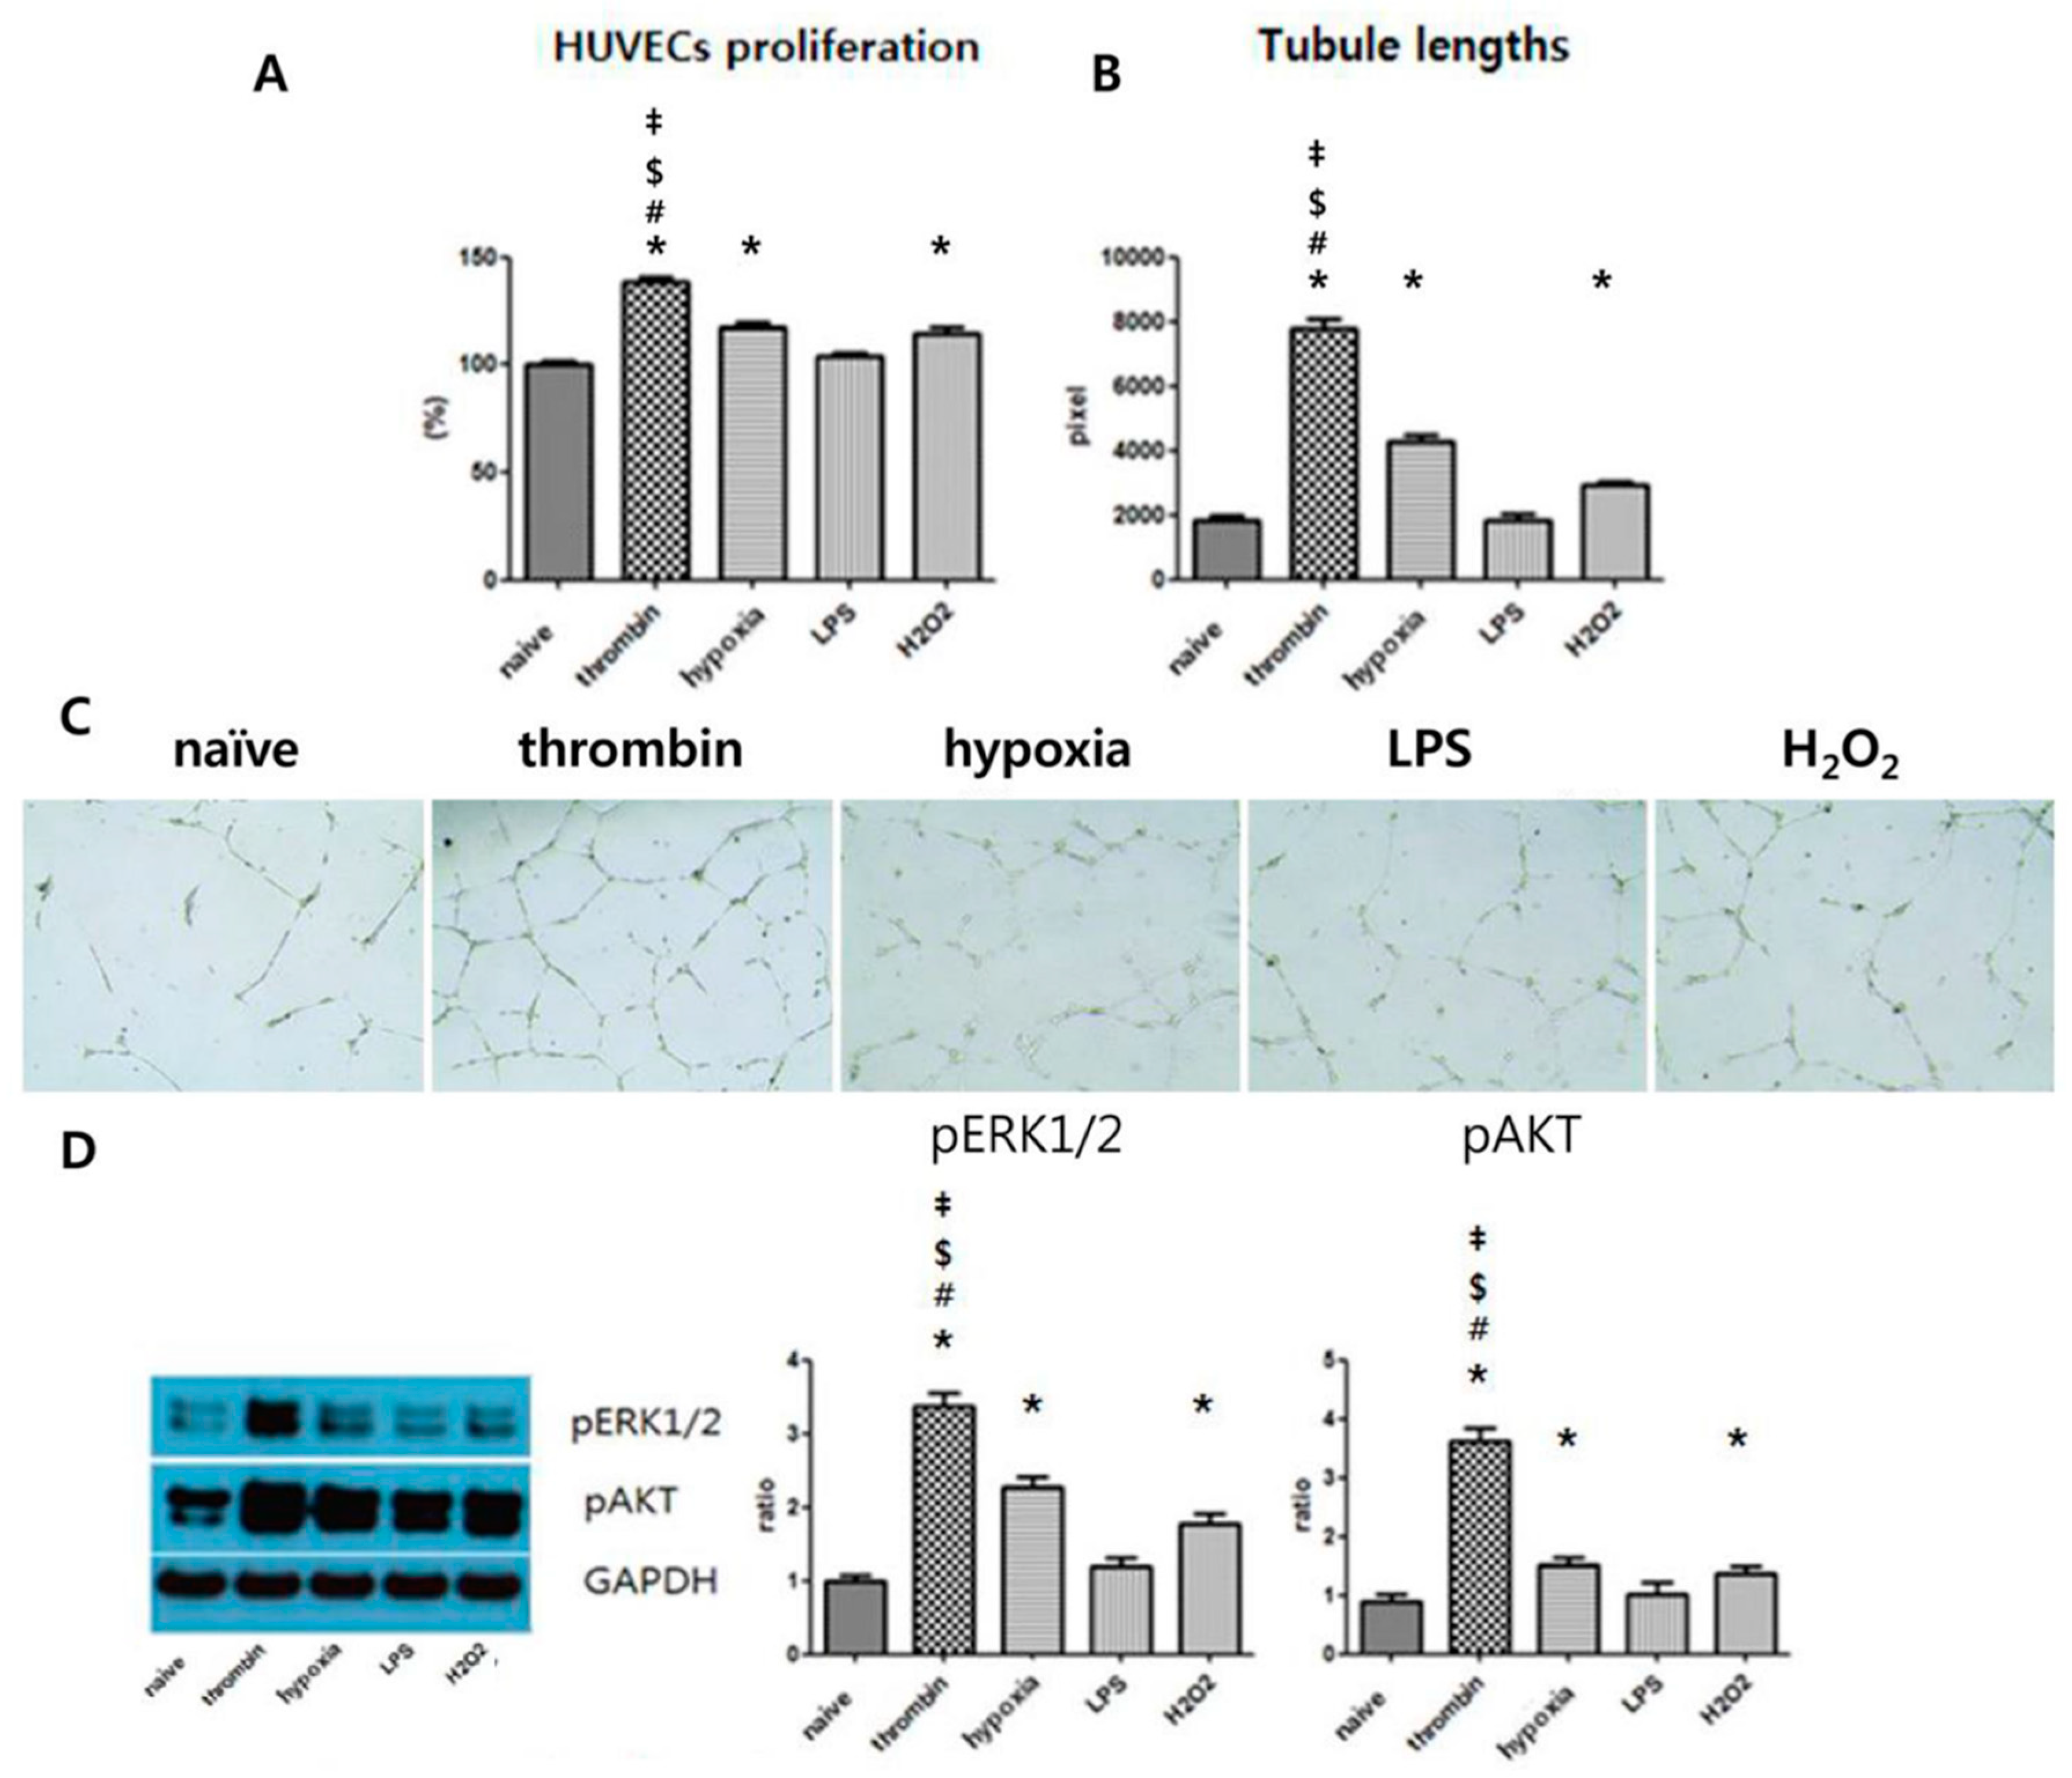
3.5. Effects of Preconditioning on Proangiogenic Effects and ERK Phosphorylation of EVs in Vitro
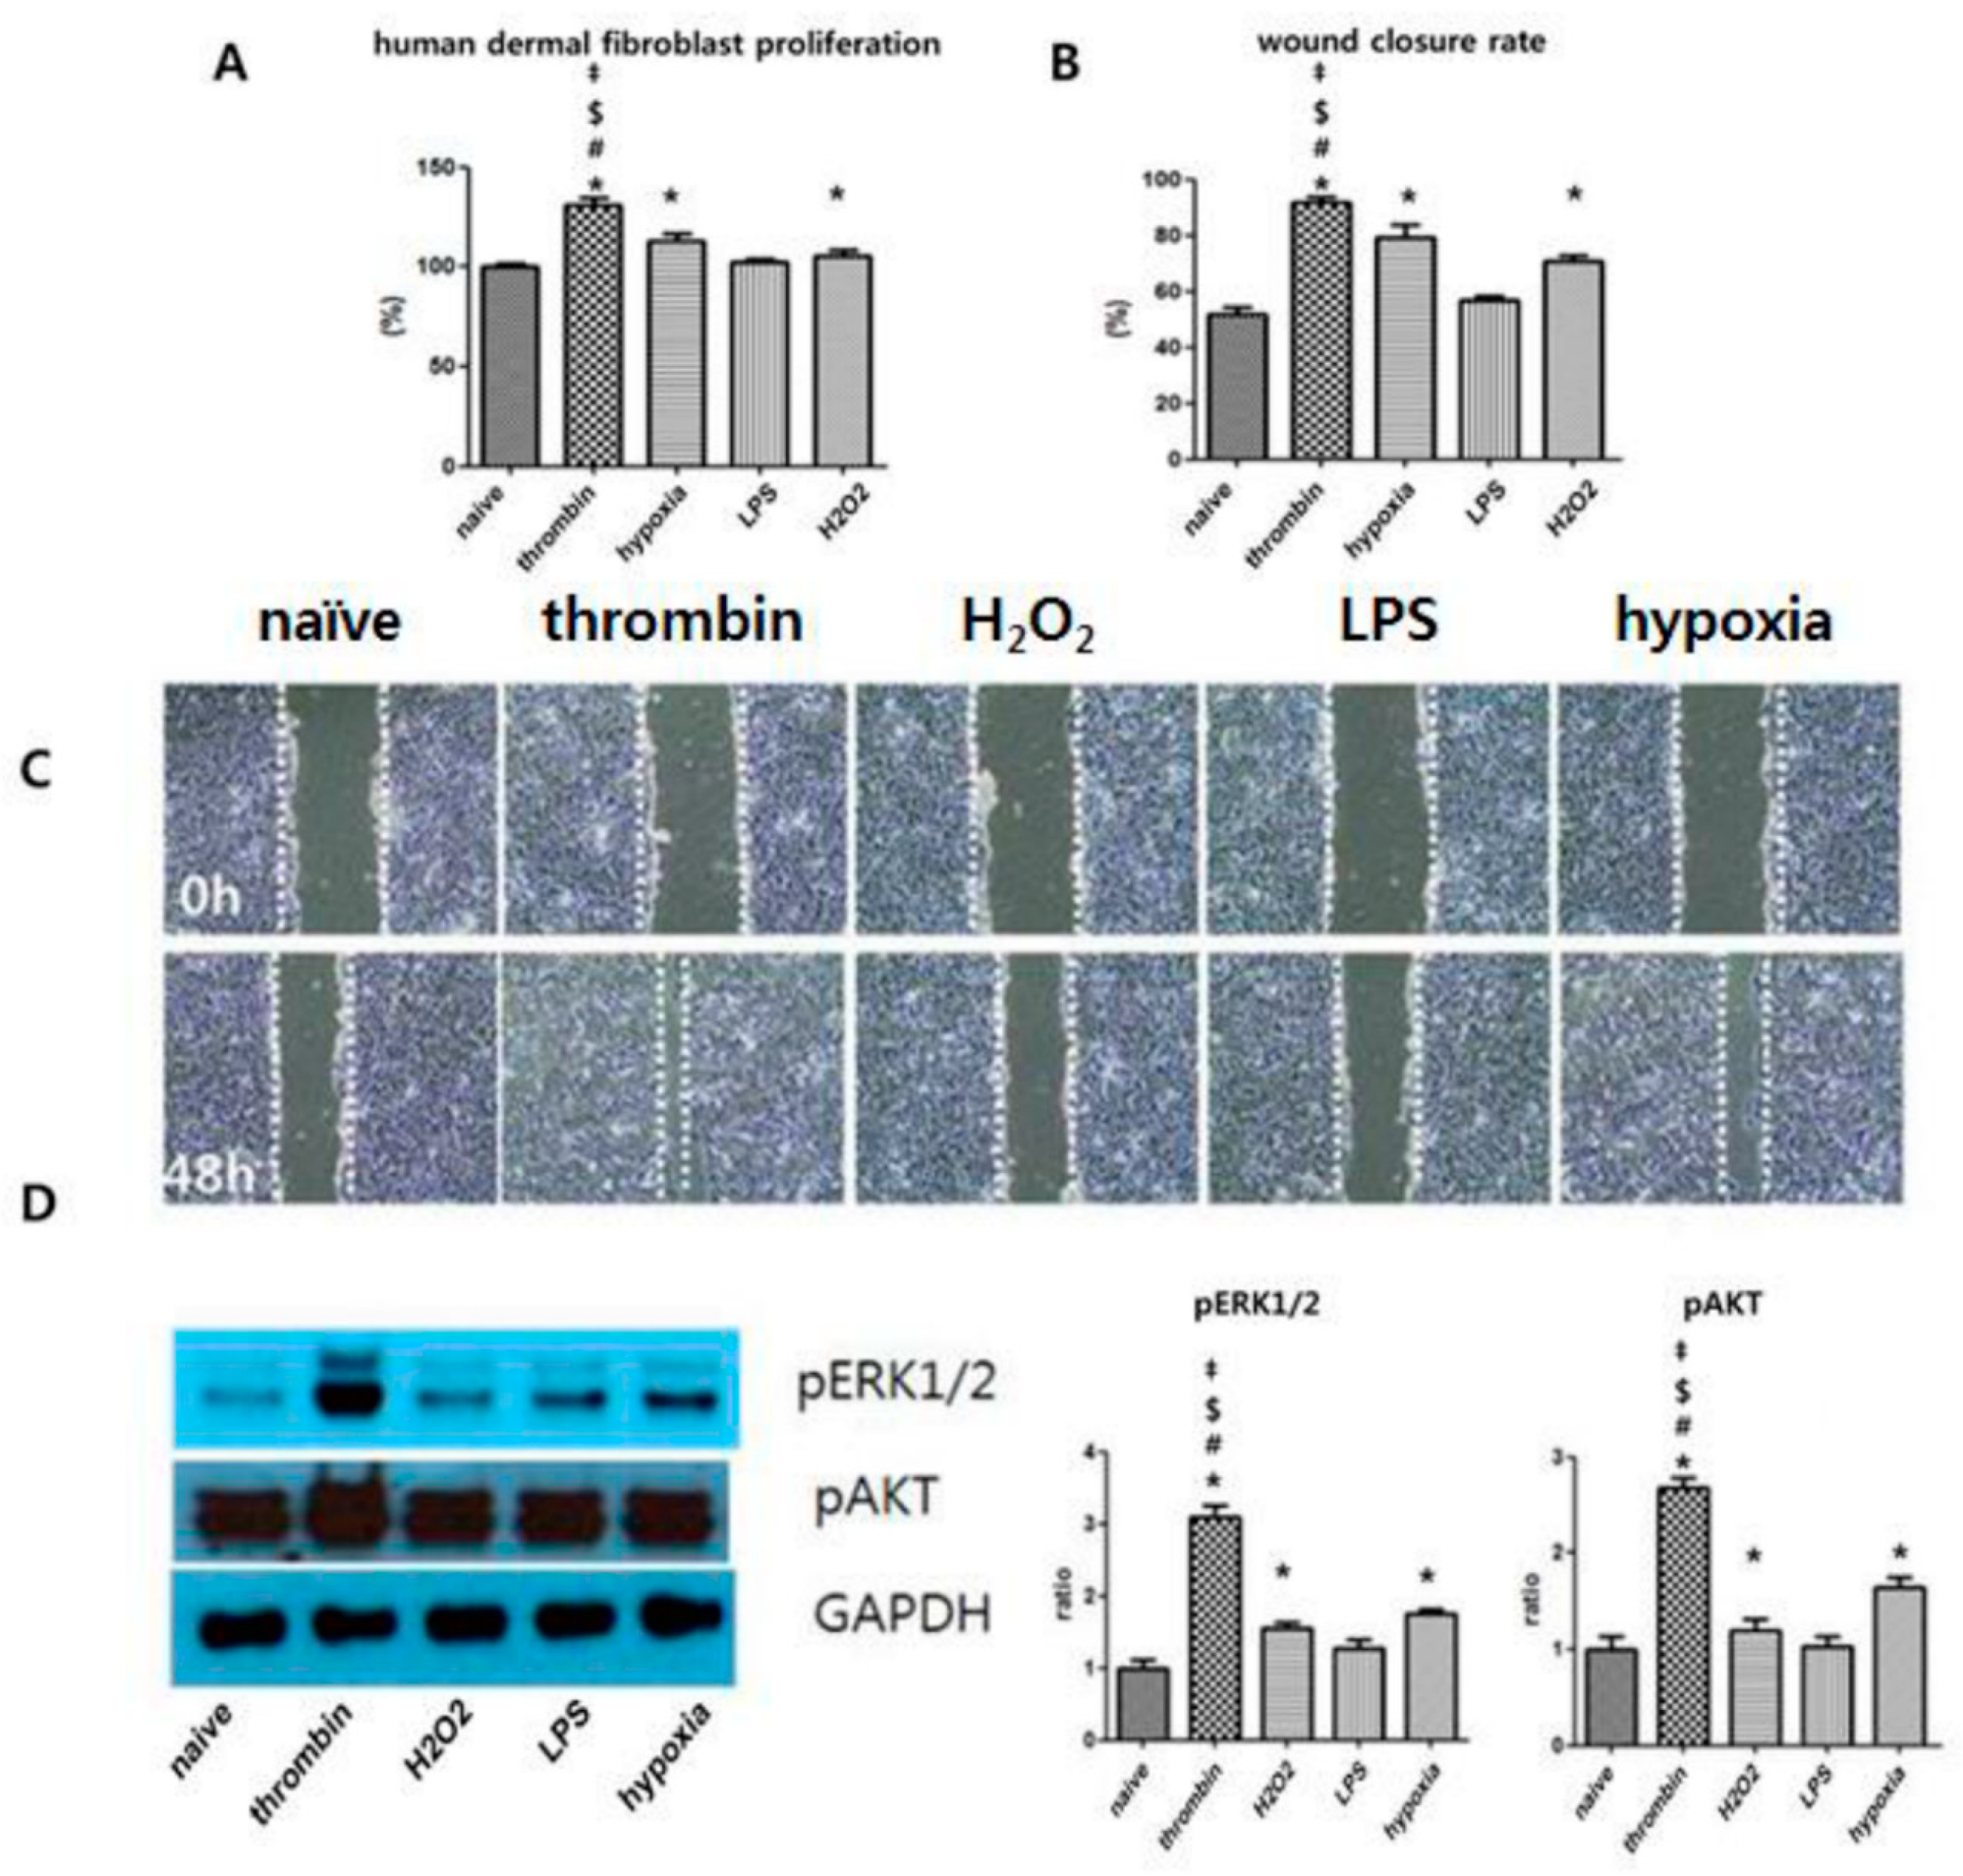
3.6. Effects of Preconditioning on Human Dermal Fibroblast Proliferation and the ERK Phosphorylation of EVs in Vitro
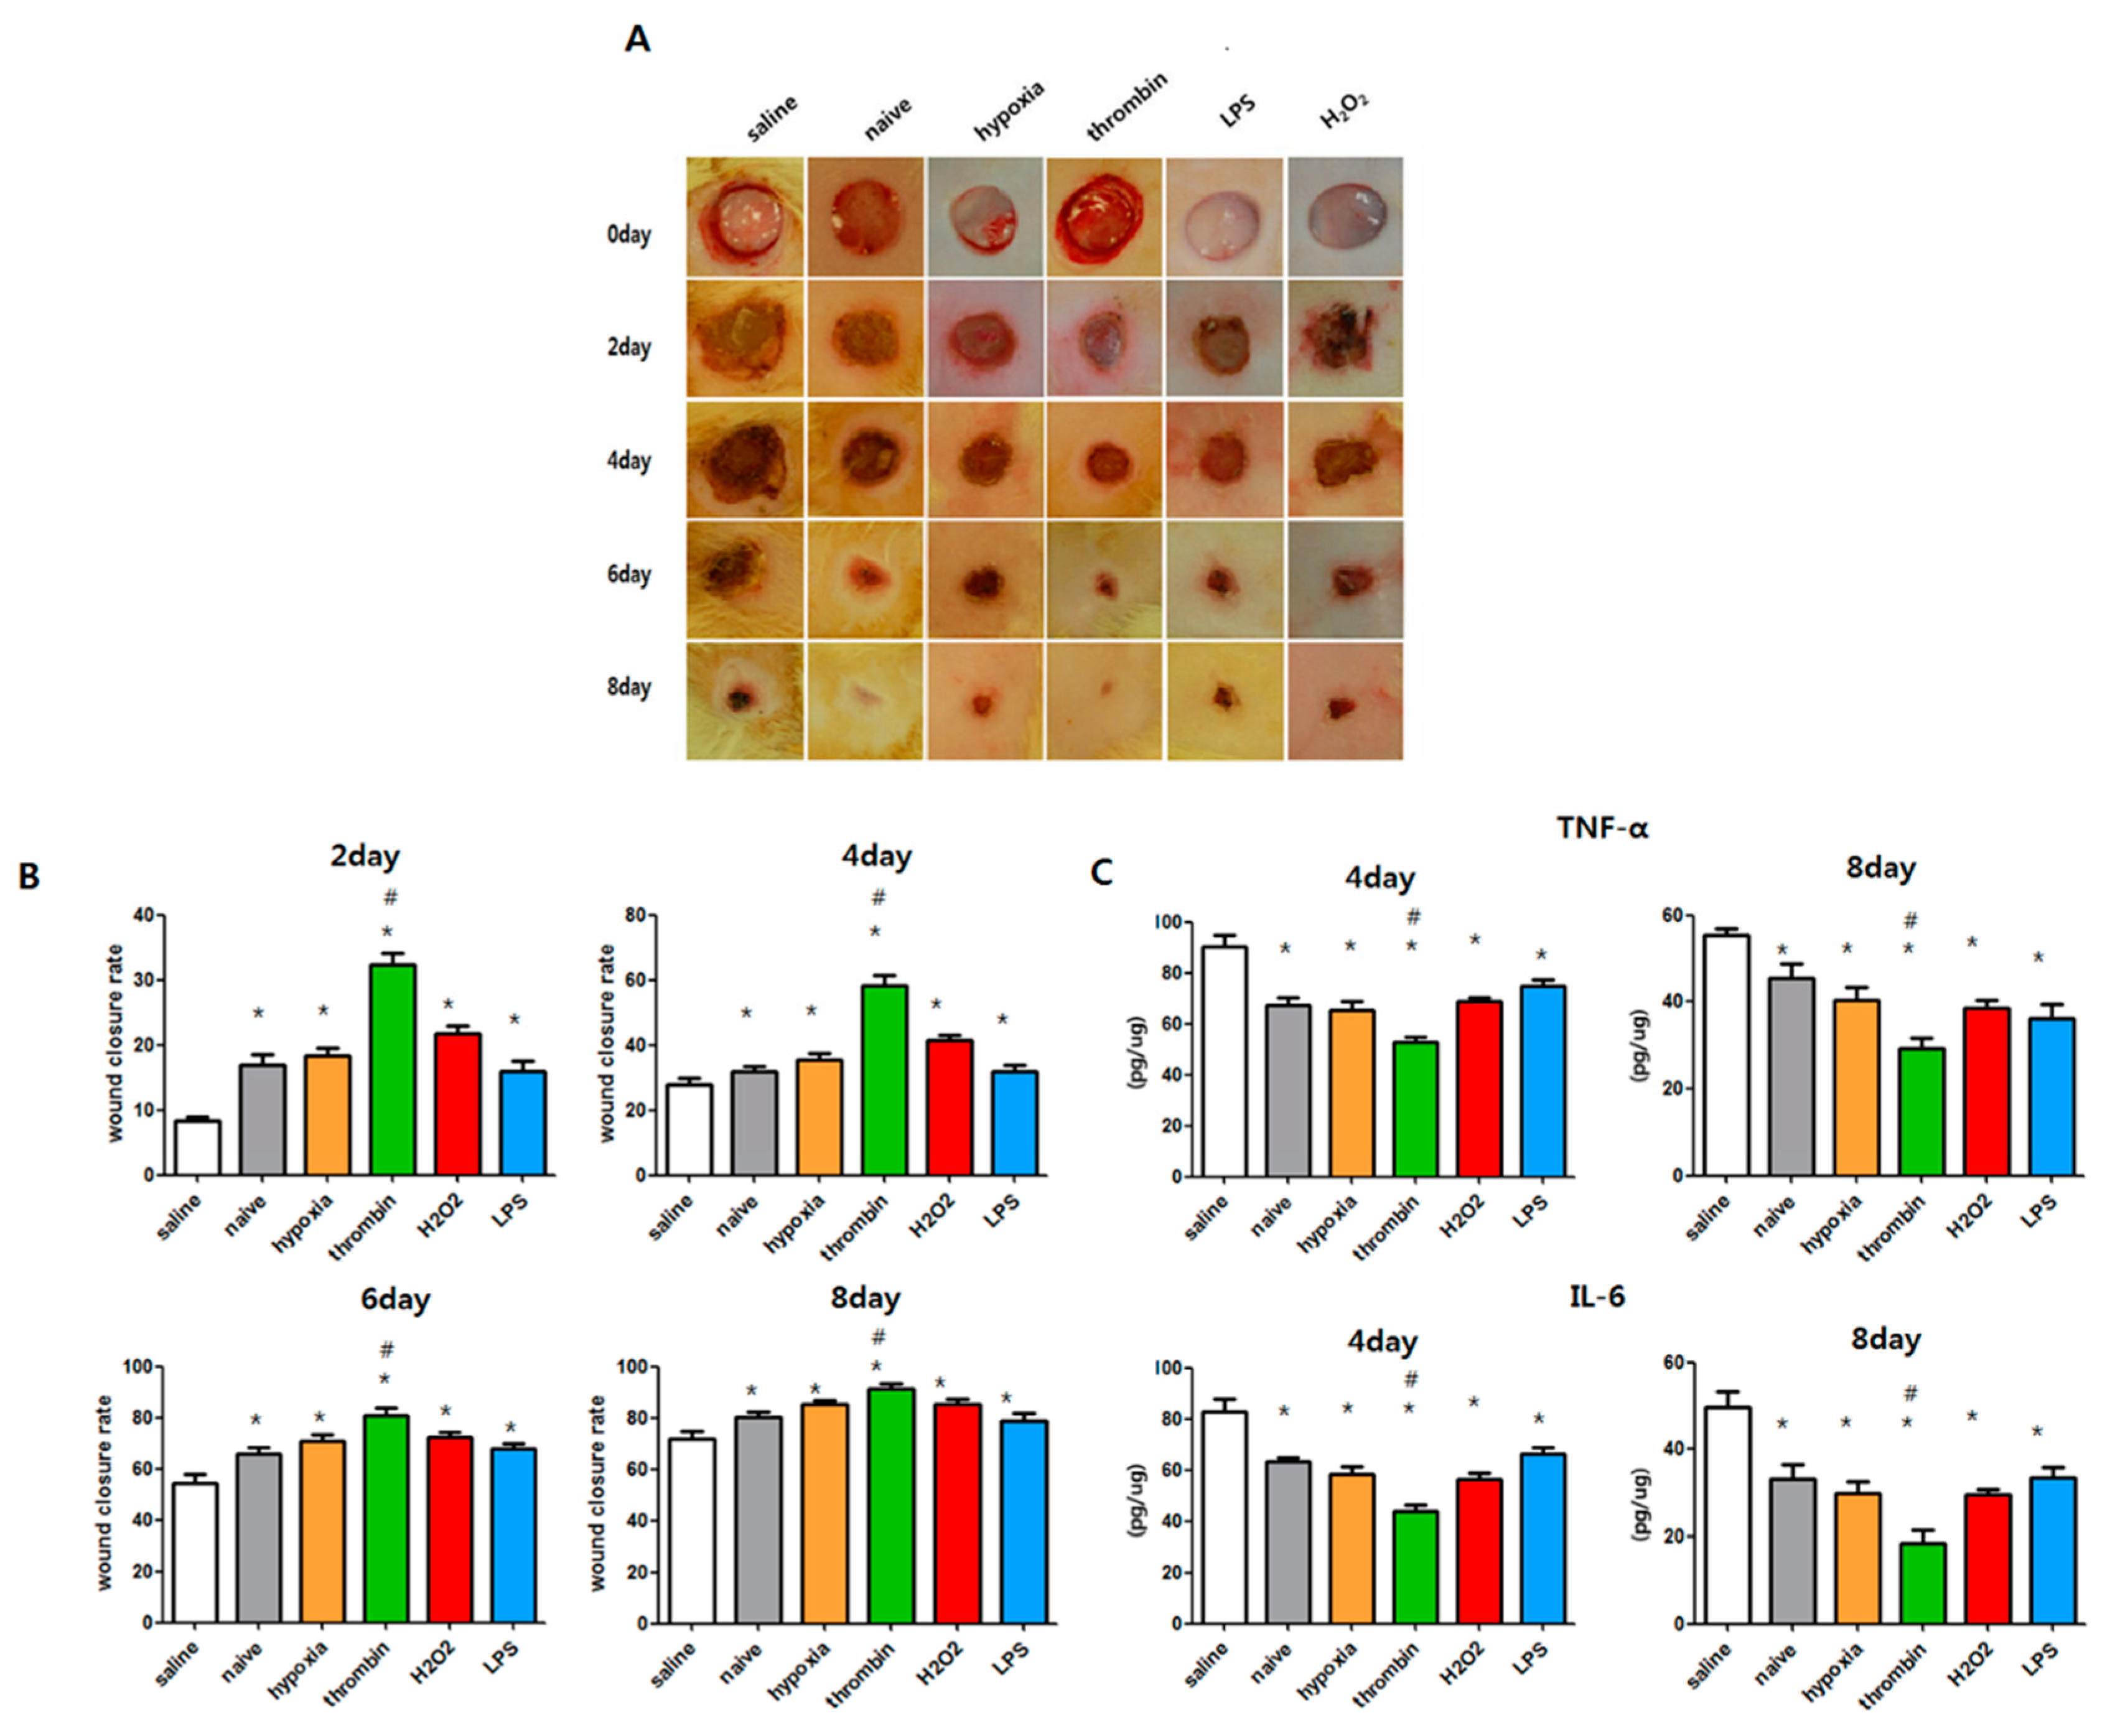
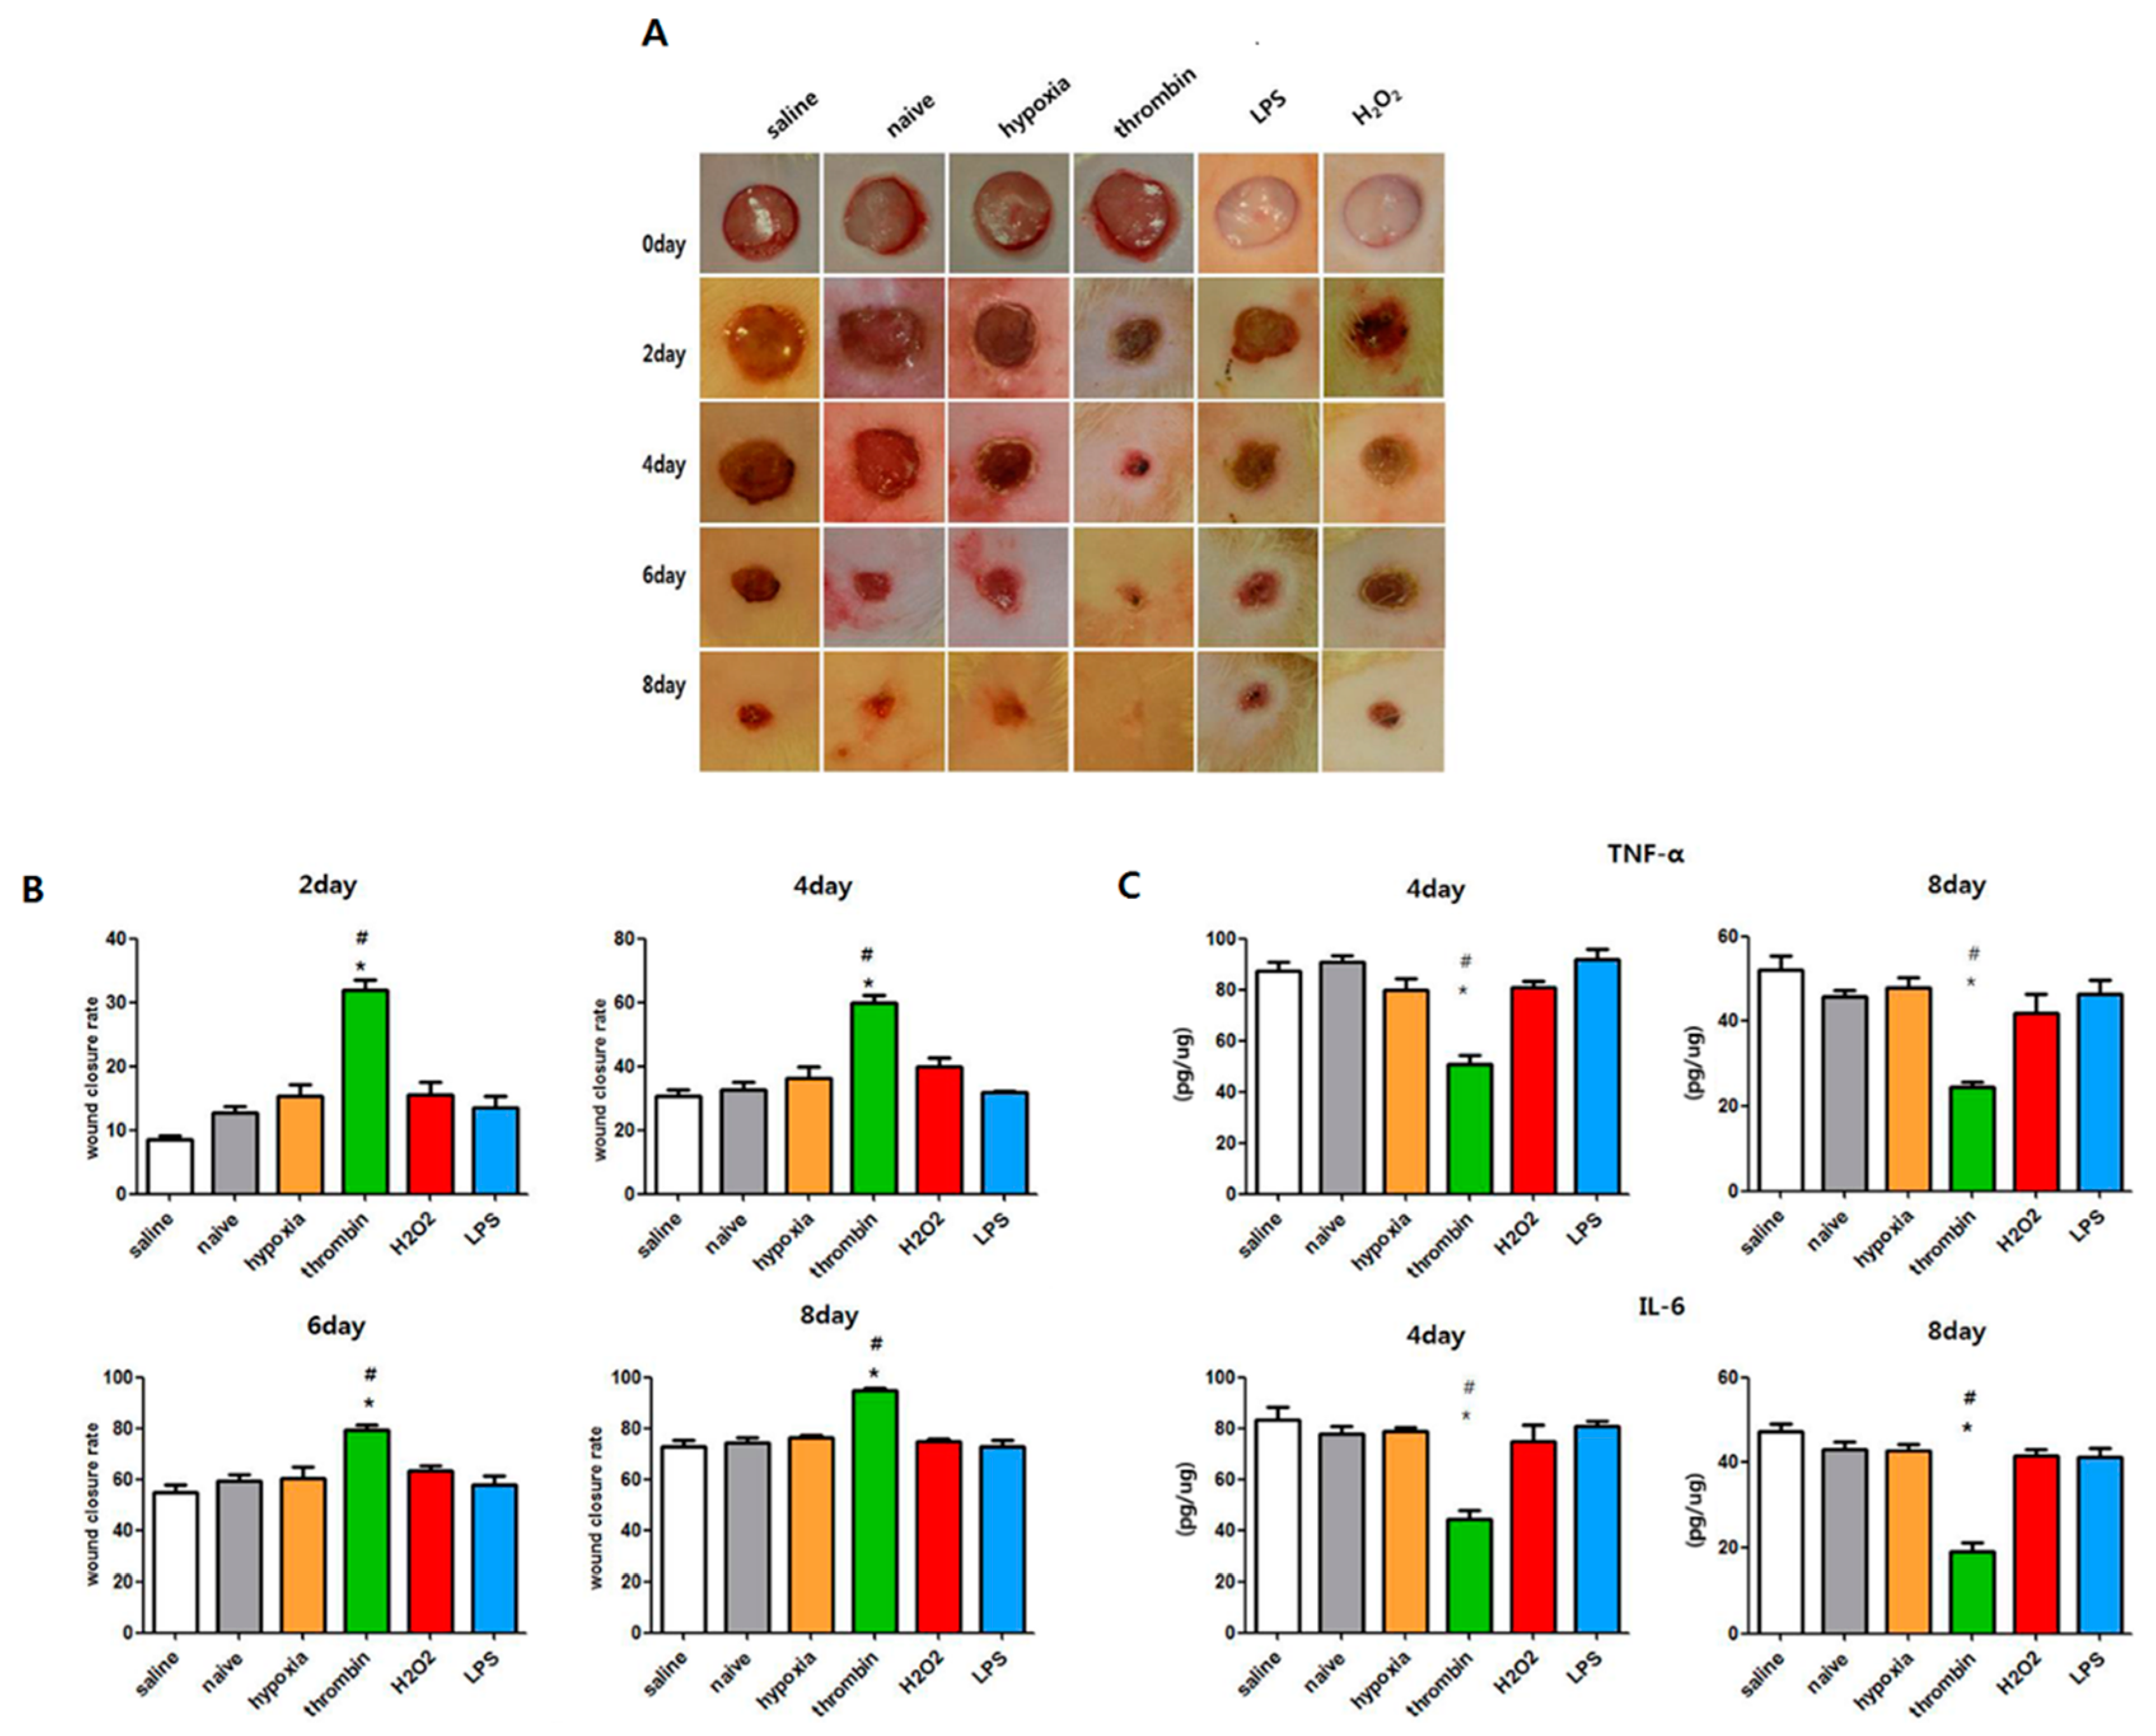
3.7. Effects of Preconditioning on the Cutaneous Wound Healing of EVs
4. Discussion
5. Conclusions
Supplementary Materials
Author Contributions
Acknowledgments
Conflicts of Interest
References
- Heng, M.C.Y. Wound healing in adult skin: Aiming for perfect regeneration. Int. J. Dermatol. 2011, 50, 1058–1066. [Google Scholar] [CrossRef] [PubMed]
- Martin, P. Wound healing—Aiming for perfect skin regeneration. Science 1997, 276, 75–81. [Google Scholar] [CrossRef]
- Cha, J.S.; Falanga, V. Stem cells in cutaneous wound healing. Clin. Dermatol. 2007, 25, 73–78. [Google Scholar] [CrossRef] [PubMed]
- Teng, M.; Huang, Y.S.; Zhang, H.S. Application of stems cells in wound healing An update. Wound Repair Regen. 2014, 22, 151–160. [Google Scholar] [CrossRef] [PubMed]
- Boulton, A.J.M.; Vileikyte, L.; Ragnarson-Tennvall, G.; Apelqvist, J. The global burden of diabetic foot disease. Lancet 2005, 366, 1719–1724. [Google Scholar] [CrossRef]
- Branski, L.K.; Gauglitz, G.G.; Herndon, D.N.; Jeschke, M.G. A review of gene and stem cell therapy in cutaneous wound healing. Burns 2009, 35, 171–180. [Google Scholar] [CrossRef]
- Sellheyer, K.; Krahl, D. Cutaneous mesenchymal stem cells. Current status of research and potential clinical applications. Hautarzt 2010, 61, 429–434. [Google Scholar] [CrossRef]
- Liang, X.T.; Ding, Y.; Zhang, Y.L.; Tse, H.F.; Lian, Q.Z. Paracrine Mechanisms of Mesenchymal Stem Cell-Based Therapy: Current Status and Perspectives. Cell Transplant. 2014, 23, 1045–1059. [Google Scholar] [CrossRef] [Green Version]
- Baglio, S.R.; Pegtel, D.M.; Baldini, N. Mesenchymal stem cell secreted vesicles provide novel opportunities in (stem) cell-free therapy. Front. Physiol. 2012, 3. [Google Scholar] [CrossRef] [Green Version]
- Xin, H.Q.; Li, Y.; Buller, B.; Katakowski, M.; Zhang, Y.; Wang, X.L.; Shang, X.; Zhang, Z.G.; Chopp, M. Exosome-Mediated Transfer of miR-133b from Multipotent Mesenchymal Stromal Cells to Neural Cells Contributes to Neurite Outgrowth. Stem Cells 2012, 30, 1556–1564. [Google Scholar] [CrossRef] [Green Version]
- Savina, A.; Furlan, M.; Vidal, M.; Colombo, M.I. Exosome release is regulated by a calcium-dependent mechanism in K562 cells. J. Biol. Chem. 2003, 278, 20083–20090. [Google Scholar] [CrossRef] [PubMed]
- Lespagnol, A.; Duflaut, D.; Beekman, C.; Blanc, L.; Fiucci, G.; Marine, J.C.; Vidal, M.; Amson, R.; Telerman, A. Exosome secretion, including the DNA damage-induced p53-dependent secretory pathway, is severely compromised in TSAP6/Steap3-null mice. Cell Death Differ. 2008, 15, 1723–1733. [Google Scholar] [CrossRef] [PubMed] [Green Version]
- Heijnen, H.F.G.; Schiel, A.E.; Fijnheer, R.; Geuze, H.J.; Sixma, J.J. Activated platelets release two types of membrane vesicles: Microvesicles by surface shedding and exosomes derived from exocytosis of multivesicular bodies and alpha-granules. Blood 1999, 94, 3791–3799. [Google Scholar]
- De Jong, O.G.; Verhaar, M.C.; Chen, Y.; Vader, P.; Gremmels, H.; Posthuma, G.; Schiffelers, R.M.; Gucek, M.; van Balkom, B.W. Cellular stress conditions are reflected in the protein and RNA content of endothelial cell-derived exosomes. J. Extracell. Vesicles 2012, 1. [Google Scholar] [CrossRef] [PubMed]
- Park, J.E.; Tan, H.S.; Datta, A.; Lai, R.C.; Zhang, H.; Meng, W.; Lim, S.K.; Sze, S.K. Hypoxic tumor cell modulates its microenvironment to enhance angiogenic and metastatic potential by secretion of proteins and exosomes. Mol. Cell. Proteom. 2010, 9, 1085–1099. [Google Scholar] [CrossRef]
- Ti, D.; Hao, H.; Tong, C.; Liu, J.; Dong, L.; Zheng, J.; Zhao, Y.; Liu, H.; Fu, X.; Han, W. LPS-preconditioned mesenchymal stromal cells modify macrophage polarization for resolution of chronic inflammation via exosome-shuttled let-7b. J. Transl. Med. 2015, 13, 308. [Google Scholar] [CrossRef] [PubMed]
- Jang, Y.K.; Jung, D.H.; Jung, M.H.; Kim, D.H.; Yoo, K.H.; Sung, K.W.; Koo, H.H.; Oh, W.; Yang, Y.S.; Yang, S.E. Mesenchymal stem cells feeder layer from human umbilical cord blood for ex vivo expanded growth and proliferation of hematopoietic progenitor cells. Ann. Hematol. 2006, 85, 212–225. [Google Scholar] [CrossRef]
- Kim, J.Y.; Kim, D.H.; Kim, D.S.; Kim, J.H.; Jeong, S.Y.; Jeon, H.B.; Lee, E.H.; Yang, Y.S.; Oh, W.; Chang, J.W. Galectin-3 secreted by human umbilical cord blood-derived mesenchymal stem cells reduces amyloid-beta42 neurotoxicity in vitro. FEBS Lett. 2010, 584, 3601–3608. [Google Scholar] [CrossRef] [PubMed]
- Lee, J.K.; Lee, M.K.; Jin, H.J.; Kim, D.S.; Yang, Y.S.; Oh, W.; Yang, S.E.; Park, T.S.; Lee, S.Y.; Kim, B.S.; et al. Efficient intracytoplasmic labeling of human umbilical cord blood mesenchymal stromal cells with ferumoxides. Cell Transplant. 2007, 16, 849–857. [Google Scholar] [CrossRef]
- Chang, Y.S.; Oh, W.; Choi, S.J.; Sung, D.K.; Kim, S.Y.; Choi, E.Y.; Kang, S.; Jin, H.J.; Yang, Y.S.; Park, W.S. Human umbilical cord blood-derived mesenchymal stem cells attenuate hyperoxia-induced lung injury in neonatal rats. Cell Transplant. 2009, 18, 869–886. [Google Scholar] [CrossRef] [PubMed]
- Ahn, S.Y.; Chang, Y.S.; Sung, D.K.; Yoo, H.S.; Sung, S.I.; Choi, S.J.; Park, W.S. Cell type-dependent variation in paracrine potency determines therapeutic efficacy against neonatal hyperoxic lung injury. Cytotherapy 2015, 17, 1025–1035. [Google Scholar] [CrossRef]
- Soares, R.; Balogh, G.; Guo, S.; Gartner, F.; Russo, J.; Schmitt, F. Evidence for the Notch signaling pathway on the role of estrogen in angiogenesis. Mol. Endocrinol. 2004, 18, 2333–2343. [Google Scholar] [CrossRef] [PubMed]
- Haralabopoulos, G.C.; Grant, D.S.; Kleinman, H.K.; Maragoudakis, M.E. Thrombin promotes endothelial cell alignment in Matrigel in vitro and angiogenesis in vivo. Am. J. Physiol. 1997, 273, C239–C245. [Google Scholar] [CrossRef] [PubMed]
- Tsopanoglou, N.E.; Maragoudakis, M.E. On the mechanism of thrombin-induced angiogenesis. Potentiation of vascular endothelial growth factor activity on endothelial cells by up-regulation of its receptors. J. Biol. Chem. 1999, 274, 23969–23976. [Google Scholar] [CrossRef] [PubMed]
- Tao, J.; Yan, C.H.; Tian, X.X.; Liu, S.W.; Li, Y.; Zhang, J.; Sun, M.Y.; Ma, X.L.; Han, Y.L. CREG Promotes the Proliferation of Human Umbilical Vein Endothelial Cells through the ERK/Cyclin E Signaling Pathway. Int. J. Mol. Sci. 2013, 14, 18437–18456. [Google Scholar] [CrossRef] [PubMed] [Green Version]
- Morello, F.; Perino, A.; Hirsch, E. Phosphoinositide 3-kinase signalling in the vascular system. Cardiovasc. Res. 2009, 82, 261–271. [Google Scholar] [CrossRef]
- Etscheid, M.; Beer, N.; Dodt, J. The hyaluronan-binding protease upregulates ERK1/2 and PI3K/Akt signalling pathways in fibroblasts and stimulates cell proliferation and migration. Cell. Signal. 2005, 17, 1486–1494. [Google Scholar] [CrossRef]
- Rani, S.; Ryan, A.E.; Griffin, M.D.; Ritter, T. Mesenchymal Stem Cell-derived Extracellular Vesicles: Toward Cell-free Therapeutic Applications. Mol. Ther. 2015, 23, 812–823. [Google Scholar] [CrossRef]
- Ailawadi, S.; Wang, X.; Gu, H.; Fan, G.C. Pathologic function and therapeutic potential of exosomes in cardiovascular disease. Biochim. Biophys. Acta 2015, 1852, 1–11. [Google Scholar] [CrossRef] [Green Version]
- Zhang, G.; Chen, L.; Guo, X.; Wang, H.; Chen, W.; Wu, G.; Gu, B.; Miao, W.; Kong, J.; Jin, X.; et al. Comparative Analysis of microRNA Expression Profiles of Exosomes Derived from Normal and Hypoxic Preconditioning Human Neural Stem Cells by Next Generation Sequencing. J. Biomed. Nanotechnol. 2018, 14, 1075–1089. [Google Scholar] [CrossRef]
- Du, W.; Zhang, K.; Zhang, S.; Wang, R.; Nie, Y.; Tao, H.; Han, Z.; Liang, L.; Wang, D.; Liu, J.; et al. Enhanced proangiogenic potential of mesenchymal stem cell-derived exosomes stimulated by a nitric oxide releasing polymer. Biomaterials 2017, 133, 70–81. [Google Scholar] [CrossRef] [PubMed]
- Ahn, S.Y.; Park, W.S.; Kim, Y.E.; Sung, D.K.; Sung, S.I.; Ahn, J.Y.; Chang, Y.S. Vascular endothelial growth factor mediates the therapeutic efficacy of mesenchymal stem cell-derived extracellular vesicles against neonatal hyperoxic lung injury. Exp. Mol. Med. 2018, 50, 26. [Google Scholar] [CrossRef] [Green Version]
- Alcayaga-Miranda, F.; Varas-Godoy, M.; Khoury, M. Harnessing the Angiogenic Potential of Stem Cell-Derived Exosomes for Vascular Regeneration. Stem Cells Int. 2016. [Google Scholar] [CrossRef] [PubMed]


© 2019 by the authors. Licensee MDPI, Basel, Switzerland. This article is an open access article distributed under the terms and conditions of the Creative Commons Attribution (CC BY) license (http://creativecommons.org/licenses/by/4.0/).
Share and Cite
Sung, D.K.; Chang, Y.S.; Sung, S.I.; Ahn, S.Y.; Park, W.S. Thrombin Preconditioning of Extracellular Vesicles Derived from Mesenchymal Stem Cells Accelerates Cutaneous Wound Healing by Boosting Their Biogenesis and Enriching Cargo Content. J. Clin. Med. 2019, 8, 533. https://doi.org/10.3390/jcm8040533
Sung DK, Chang YS, Sung SI, Ahn SY, Park WS. Thrombin Preconditioning of Extracellular Vesicles Derived from Mesenchymal Stem Cells Accelerates Cutaneous Wound Healing by Boosting Their Biogenesis and Enriching Cargo Content. Journal of Clinical Medicine. 2019; 8(4):533. https://doi.org/10.3390/jcm8040533
Chicago/Turabian StyleSung, Dong Kyung, Yun Sil Chang, Se In Sung, So Yoon Ahn, and Won Soon Park. 2019. "Thrombin Preconditioning of Extracellular Vesicles Derived from Mesenchymal Stem Cells Accelerates Cutaneous Wound Healing by Boosting Their Biogenesis and Enriching Cargo Content" Journal of Clinical Medicine 8, no. 4: 533. https://doi.org/10.3390/jcm8040533