Clinical and Biomarker Characteristics According to Clinical Spectrum of Alzheimer’s Disease (AD) in the Validation Cohort of Korean Brain Aging Study for the Early Diagnosis and Prediction of AD

 , , ,
, , ,
Abstract
:1. Introduction
2. Materials and Methods
2.1. Participants
2.2. Clinical Assessment
2.3. Neuropsychological Assessment
2.4. Brain MRI
2.5. Amyloid Positron Emission Tomography
2.6. Cerebrospinal Fluid Analysis
2.7. ATN Classification
2.8. Statistical Analysis
3. Results
4. Discussion
Author Contributions
Funding
Conflicts of Interest
References
- Hardy, J.; Selkoe, D.J. The amyloid hypothesis of Alzheimer’s disease: Progress and problems on the road to therapeutics. Science 2002, 297, 353–356. [Google Scholar] [CrossRef] [PubMed]
- Jansen, W.J.; Ossenkoppele, R.; Knol, D.L.; Tijms, B.M.; Scheltens, P.; Verhey, F.R.; Visser, P.J.; Aalten, P.; Aarsland, D.; Alcolea, D.; et al. Prevalence of cerebral amyloid pathology in persons without dementia: A meta-analysis. JAMA 2015, 313, 1924–1938. [Google Scholar] [CrossRef] [PubMed]
- Sperling, R.A.; Aisen, P.S.; Beckett, L.A.; Bennett, D.A.; Craft, S.; Fagan, A.M.; Iwatsubo, T.; Jack, C.R., Jr.; Kaye, J.; Montine, T.J.; et al. Toward defining the preclinical stages of Alzheimer’s disease: Recommendations from the National Institute on Aging-Alzheimer’s Association workgroups on diagnostic guidelines for Alzheimer’s disease. Alzheimers Dement. 2011, 7, 280–292. [Google Scholar] [CrossRef] [PubMed]
- Jessen, F.; Amariglio, R.E.; van Boxtel, M.; Breteler, M.; Ceccaldi, M.; Chetelat, G.; Dubois, B.; Dufouil, C.; Ellis, K.A.; van der Flier, W.M.; et al. A conceptual framework for research on subjective cognitive decline in preclinical Alzheimer’s disease. Alzheimers Dement. 2014, 10, 844–852. [Google Scholar] [CrossRef] [PubMed]
- Mitchell, A.J.; Beaumont, H.; Ferguson, D.; Yadegarfar, M.; Stubbs, B. Risk of dementia and mild cognitive impairment in older people with subjective memory complaints: Meta-analysis. Acta Psychiatr. Scand. 2014, 130, 439–451. [Google Scholar] [CrossRef] [PubMed]
- Dubois, B.; Hampel, H.; Feldman, H.H.; Scheltens, P.; Aisen, P.; Andrieu, S.; Bakardjian, H.; Benali, H.; Bertram, L.; Blennow, K.; et al. Preclinical Alzheimer’s disease: Definition, natural history, and diagnostic criteria. Alzheimers Dement. 2016, 12, 292–323. [Google Scholar] [CrossRef] [PubMed]
- Albert, M.S.; DeKosky, S.T.; Dickson, D.; Dubois, B.; Feldman, H.H.; Fox, N.C.; Gamst, A.; Holtzman, D.M.; Jagust, W.J.; Petersen, R.C.; et al. The diagnosis of mild cognitive impairment due to Alzheimer’s disease: Recommendations from the National Institute on Aging-Alzheimer’s Association workgroups on diagnostic guidelines for Alzheimer’s disease. Alzheimers Dement. 2011, 7, 270–279. [Google Scholar] [CrossRef] [PubMed]
- Livingston, G.; Sommerlad, A.; Orgeta, V.; Costafreda, S.G.; Huntley, J.; Ames, D.; Ballard, C.; Banerjee, S.; Burns, A.; Cohen-Mansfield, J.; et al. Dementia prevention, intervention, and care. Lancet 2017, 390, 2673–2734. [Google Scholar] [CrossRef]
- Jack, C.R., Jr.; Lowe, V.J.; Senjem, M.L.; Weigand, S.D.; Kemp, B.J.; Shiung, M.M.; Knopman, D.S.; Boeve, B.F.; Klunk, W.E.; Mathis, C.A.; et al. 11C PiB and structural MRI provide complementary information in imaging of Alzheimer’s disease and amnestic mild cognitive impairment. Brain 2008, 131, 665–680. [Google Scholar] [CrossRef] [PubMed]
- Bullich, S.; Seibyl, J.; Catafau, A.M.; Jovalekic, A.; Koglin, N.; Barthel, H.; Sabri, O.; De Santi, S. Optimized classification of 18F-Florbetaben PET scans as positive and negative using an SUVR quantitative approach and comparison to visual assessment. Neuroimage Clin. 2017, 15, 325–332. [Google Scholar] [CrossRef] [PubMed]
- Vandenberghe, R.; Van Laere, K.; Ivanoiu, A.; Salmon, E.; Bastin, C.; Triau, E.; Hasselbalch, S.; Law, I.; Andersen, A.; Korner, A.; et al. 18F-flutemetamol amyloid imaging in Alzheimer disease and mild cognitive impairment: A phase 2 trial. Ann. Neurol 2010, 68, 319–329. [Google Scholar] [CrossRef] [PubMed]
- Park, S.A.; Chae, W.S.; Kim, H.J.; Shin, H.S.; Kim, S.; Im, J.Y.; Ahn, S.I.; Min, K.D.; Yim, S.J.; Ye, B.S.; et al. Cerebrospinal Fluid Biomarkers for the Diagnosis of Alzheimer Disease in South Korea. Alzheimer Dis. Assoc. Disord. 2017, 31, 13–18. [Google Scholar] [CrossRef] [PubMed]
- Chhatwal, J.P.; Schultz, A.P.; Marshall, G.A.; Boot, B.; Gomez-Isla, T.; Dumurgier, J.; LaPoint, M.; Scherzer, C.; Roe, A.D.; Hyman, B.T.; et al. Temporal T807 binding correlates with CSF tau and phospho-tau in normal elderly. Neurology 2016, 87, 920–926. [Google Scholar] [CrossRef] [PubMed]
- Jack, C.R., Jr.; Bennett, D.A.; Blennow, K.; Carrillo, M.C.; Dunn, B.; Haeberlein, S.B.; Holtzman, D.M.; Jagust, W.; Jessen, F.; Karlawish, J.; et al. NIA-AA Research Framework: Toward a biological definition of Alzheimer’s disease. Alzheimers Dement. 2018, 14, 535–562. [Google Scholar] [CrossRef] [PubMed]
- Landau, S.M.; Harvey, D.; Madison, C.M.; Koeppe, R.A.; Reiman, E.M.; Foster, N.L.; Weiner, M.W.; Jagust, W.J. Alzheimer’s Disease Neuroimaging Initiative. Associations between cognitive, functional, and FDG-PET measures of decline in AD and MCI. Neurobiol. Aging 2011, 32, 1207–1218. [Google Scholar] [CrossRef] [PubMed]
- Dickerson, B.C.; Bakkour, A.; Salat, D.H.; Feczko, E.; Pacheco, J.; Greve, D.N.; Grodstein, F.; Wright, C.I.; Blacker, D.; Rosas, H.D.; et al. The cortical signature of Alzheimer’s disease: Regionally specific cortical thinning relates to symptom severity in very mild to mild AD dementia and is detectable in asymptomatic amyloid-positive individuals. Cereb Cortex 2009, 19, 497–510. [Google Scholar] [CrossRef] [PubMed]
- Byun, M.S.; Yi, D.; Lee, J.H.; Choe, Y.M.; Sohn, B.K.; Lee, J.Y.; Choi, H.J.; Baek, H.; Kim, Y.K.; Lee, Y.S.; et al. Korean Brain Aging Study for the Early Diagnosis and Prediction of Alzheimer’s Disease: Methodology and Baseline Sample Characteristics. Psychiatry Investig. 2017, 14, 851–863. [Google Scholar] [CrossRef] [PubMed]
- Lee, D.Y.; Lee, K.U.; Lee, J.H.; Kim, K.W.; Jhoo, J.H.; Kim, S.Y.; Yoon, J.C.; Woo, S.I.; Ha, J.; Woo, J.I. A normative study of the CERAD neuropsychological assessment battery in the Korean elderly. J. Int Neuropsychol. Soc. 2004, 10, 72–81. [Google Scholar] [CrossRef] [PubMed]
- Choi, S.H.; Lee, B.H.; Kim, S.; Hahm, D.S.; Jeong, J.H.; Yoon, S.J.; Jeong, Y.; Ha, C.K.; Nab, D.L. Interchanging scores between clinical dementia rating scale and global deterioration scale. Alzheimer Dis. Assoc. Disord. 2003, 17, 98–105. [Google Scholar] [CrossRef] [PubMed]
- Petersen, R.C.; Doody, R.; Kurz, A.; Mohs, R.C.; Morris, J.C.; Rabins, P.V.; Ritchie, K.; Rossor, M.; Thal, L.; Winblad, B. Current concepts in mild cognitive impairment. Arch. Neurol. 2001, 58, 1985–1992. [Google Scholar] [CrossRef] [PubMed]
- American Psychiatric Association. Diagnostic and Statistical Manual of Mental Disorders: DSM-IV-TR; American Psychiatric Association: Washington, DC, USA, 2000. [Google Scholar]
- McKhann, G.M.; Knopman, D.S.; Chertkow, H.; Hyman, B.T.; Jack, C.R., Jr.; Kawas, C.H.; Klunk, W.E.; Koroshetz, W.J.; Manly, J.J.; Mayeux, R.; et al. The diagnosis of dementia due to Alzheimer’s disease: Recommendations from the National Institute on Aging-Alzheimer’s Association workgroups on diagnostic guidelines for Alzheimer’s disease. Alzheimers Dement. 2011, 7, 263–269. [Google Scholar] [CrossRef] [PubMed]
- Catherine, T.A.; Sandrine, H.M.; Bernard, L. The cognitive complaint interview (CCI). Psychogeriatrics 2006, 6, S18–S22. [Google Scholar] [CrossRef]
- Crook, T.H.; Feher, E.P.; Larrabee, G.J. Assessment of Memory Complaint in Age-Associated Memory Impairment: The MAC-Q. Int. Psychogeriatr. 1992, 4, 165–176. [Google Scholar] [CrossRef] [PubMed]
- Youn, J.C.; Kim, K.W.; Lee, D.Y.; Jhoo, J.H.; Lee, S.B.; Park, J.H.; Choi, E.A.; Choe, J.Y.; Jeong, J.W.; Choo, I.H.; et al. Development of the Subjective Memory Complaints Questionnaire. Dement. Geriatr. Cogn. Disord. 2009, 27, 310–317. [Google Scholar] [CrossRef] [PubMed]
- Bae, J.N.; Cho, M.J. Development of the Korean version of the Geriatric Depression Scale and its short form among elderly psychiatric patients. J. Psychosom. Res. 2004, 57, 297–305. [Google Scholar] [CrossRef] [PubMed]
- Blessed, G.; Tomlinson, B.E.; Roth, M. The association between quantitative measures of dementia and of senile change in the cerebral grey matter of elderly subjects. Br. J. Psychiatry 1968, 114, 797–811. [Google Scholar] [CrossRef] [PubMed]
- Choi, S.H.; Na, D.L.; Kwon, H.M.; Yoon, S.J.; Jeong, J.H.; Ha, C.K. The Korean version of the neuropsychiatric inventory: A scoring tool for neuropsychiatric disturbance in dementia patients. J. Korean Med. Sci. 2000, 15, 609–615. [Google Scholar] [CrossRef] [PubMed]
- Podsiadlo, D.; Richardson, S. The timed “Up & Go”: A test of basic functional mobility for frail elderly persons. J. Am. Geriatr. Soc. 1991, 39, 142–148. [Google Scholar] [PubMed]
- Michikawa, T.; Nishiwaki, Y.; Takebayashi, T.; Toyama, Y. One-leg standing test for elderly populations. J. Orthop. Sci. 2009, 14, 675–685. [Google Scholar] [CrossRef] [PubMed]
- Movement Disorder Society Task Force on Rating Scales for Parkinson’s Disease. The Unified Parkinson’s Disease Rating Scale (UPDRS): Status and recommendations. Mov. Disord. 2003, 18, 738–750. [Google Scholar] [CrossRef] [PubMed]
- Hagstromer, M.; Oja, P.; Sjostrom, M. The International Physical Activity Questionnaire (IPAQ): A study of concurrent and construct validity. Public Health Nutr. 2006, 9, 755–762. [Google Scholar] [CrossRef] [PubMed]
- Wilson, M.M.; Thomas, D.R.; Rubenstein, L.Z.; Chibnall, J.T.; Anderson, S.; Baxi, A.; Diebold, M.R.; Morley, J.E. Appetite assessment: Simple appetite questionnaire predicts weight loss in community-dwelling adults and nursing home residents. Am. J. Clin. Nutr. 2005, 82, 1074–1081. [Google Scholar] [CrossRef] [PubMed]
- Tully, M.W.; Matrakas, K.L.; Muir, J.; Musallam, K. The Eating Behavior Scale. A simple method of assessing functional ability in patients with Alzheimer’s disease. J. Gerontol. Nurs. 1997, 23, 9–15. [Google Scholar] [CrossRef] [PubMed]
- Vellas, B.; Guigoz, Y.; Garry, P.J.; Nourhashemi, F.; Bennahum, D.; Lauque, S.; Albarede, J.L. The Mini Nutritional Assessment (MNA) and its use in grading the nutritional state of elderly patients. Nutrition 1999, 15, 116–122. [Google Scholar] [CrossRef]
- Sohn, S.I.; Kim, D.H.; Lee, M.Y.; Cho, Y.W. The reliability and validity of the Korean version of the Pittsburgh Sleep Quality Index. Sleep Breath 2012, 16, 803–812. [Google Scholar] [CrossRef] [PubMed]
- Hoddes, E.; Zarcone, V.; Smythe, H.; Phillips, R.; Dement, W.C. Quantification of Sleepiness: A New Approach. Psychophysiology 1973, 10, 431–436. [Google Scholar] [CrossRef] [PubMed]
- Cho, Y.W.; Lee, J.H.; Son, H.K.; Lee, S.H.; Shin, C.; Johns, M.W. The reliability and validity of the Korean version of the Epworth sleepiness scale. Sleep Breath 2011, 15, 377–384. [Google Scholar] [CrossRef] [PubMed]
- Fried, L.P.; Tangen, C.M.; Walston, J.; Newman, A.B.; Hirsch, C.; Gottdiener, J.; Seeman, T.; Tracy, R.; Kop, W.J.; Burke, G.; et al. Frailty in older adults: Evidence for a phenotype. J. Gerontol. A Biol. Sci. Med. Sci. 2001, 56, M146–M156. [Google Scholar] [CrossRef] [PubMed]
- Chen, L.K.; Liu, L.K.; Woo, J.; Assantachai, P.; Auyeung, T.W.; Bahyah, K.S.; Chou, M.Y.; Chen, L.Y.; Hsu, P.S.; Krairit, O.; et al. Sarcopenia in Asia: Consensus report of the Asian Working Group for Sarcopenia. J. Am. Med. Dir. Assoc. 2014, 15, 95–101. [Google Scholar] [CrossRef] [PubMed]
- Seo, E.H.; Lee, D.Y.; Choo, I.H.; Kim, S.G.; Kim, K.W.; Youn, J.C.; Jhoo, J.H.; Woo, J.I. Normative study of the Stroop Color and Word Test in an educationally diverse elderly population. Int. J. Geriatr. Psychiatry 2008, 23, 1020–1027. [Google Scholar] [CrossRef] [PubMed]
- Lee, D.Y.; Yoon, J.C.; Lee, K.U.; Jhoo, J.H.; Kim, K.W.; Lee, J.H.; Woo, J.I. Reliability and Validity of the Korean Version of Short Blessed Test (SBT-K) as a Dementia Screening Instrument. J. Korean Neuropsychiatr. Assoc. 1999, 38, 1365–1375. [Google Scholar]
- Seo, E.H.; Lee, D.Y.; Kim, K.W.; Lee, J.H.; Jhoo, J.H.; Youn, J.C.; Choo, I.H.; Ha, J.; Woo, J.I. A normative study of the Trail Making Test in Korean elders. Int. J. Geriatr. Psychiatry 2006, 21, 844–852. [Google Scholar] [CrossRef] [PubMed]
- Choi, H.J.; Lee, D.Y.; Seo, E.H.; Jo, M.K.; Sohn, B.K.; Choe, Y.M.; Byun, M.S.; Kim, J.W.; Kim, S.G.; Yoon, J.C.; et al. A normative study of the digit span in an educationally diverse elderly population. Psychiatry Investig. 2014, 11, 39–43. [Google Scholar] [CrossRef] [PubMed]
- Chey, J.; Kim, J.; Park, K.B.; Hwang, S.; Hong, S. Korean Wechsler Memory Scale-IV; Korea Psychology: Daegu, Korea, 2012. [Google Scholar]
- Fastenau, P.S.; Denburg, N.L.; Hufford, B.J. Adult norms for the Rey-Osterrieth Complex Figure Test and for supplemental recognition and matching trials from the Extended Complex Figure Test. Clin. Neuropsychol. 1999, 13, 30–47. [Google Scholar] [CrossRef] [PubMed]
- Hwang, S.; Kim, J.; Park, K.; Chey, J.; Hong, S. Korean Wechsler Adult Intelligence Scale-IV; Korea Psychology: Daegu, Korea, 2012. [Google Scholar]
- Dubois, B.; Slachevsky, A.; Litvan, I.; Pillon, B. The FAB: A Frontal Assessment Battery at bedside. Neurology 2000, 55, 1621–1626. [Google Scholar] [CrossRef] [PubMed]
- Beckett, L.A.; Donohue, M.C.; Wang, C.; Aisen, P.; Harvey, D.J.; Saito, N.; Alzheimer’s Disease Neuroimaging Initiative. The Alzheimer’s Disease Neuroimaging Initiative phase 2: Increasing the length, breadth, and depth of our understanding. Alzheimers Dement. 2015, 11, 823–831. [Google Scholar] [CrossRef] [PubMed]
- Zijdenbos, A.P.; Forghani, R.; Evans, A.C. Automatic “pipeline” analysis of 3-D MRI data for clinical trials: Application to multiple sclerosis. IEEE Trans. Med. Imaging 2002, 21, 1280–1291. [Google Scholar] [CrossRef] [PubMed]
- Sled, J.G.; Zijdenbos, A.P.; Evans, A.C. A nonparametric method for automatic correction of intensity nonuniformity in MRI data. IEEE Trans. Med. Imaging 1998, 17, 87–97. [Google Scholar] [CrossRef] [PubMed]
- Collins, D.L.; Neelin, P.; Peters, T.M.; Evans, A.C. Automatic 3D intersubject registration of MR volumetric data in standardized Talairach space. J. Comput. Assist. Tomogr. 1994, 18, 192–205. [Google Scholar] [CrossRef] [PubMed]
- Smith, S.M. Fast robust automated brain extraction. Hum. Brain Mapp. 2002, 17, 143–155. [Google Scholar] [CrossRef] [PubMed]
- Zijdenbos, A.; Evans, A.; Riahi, F.; Sled, J.; Chui, J.; Kollokian, V. Automatic quantification of multiple sclerosis lesion volume using stereotaxic space. In Visualization in Biomedical Computing; Höhne, K.H., Kikinis, R., Eds.; Springer: Berlin/Heidelberg, Germany, 1996; pp. 439–448. [Google Scholar]
- Kim, J.S.; Singh, V.; Lee, J.K.; Lerch, J.; Ad-Dab’bagh, Y.; MacDonald, D.; Lee, J.M.; Kim, S.I.; Evans, A.C. Automated 3-D extraction and evaluation of the inner and outer cortical surfaces using a Laplacian map and partial volume effect classification. NeuroImage 2005, 27, 210–221. [Google Scholar] [CrossRef] [PubMed]
- Kabani, N.; Le Goualher, G.; MacDonald, D.; Evans, A.C. Measurement of cortical thickness using an automated 3-D algorithm: A validation study. NeuroImage 2001, 13, 375–380. [Google Scholar] [CrossRef] [PubMed]
- Patenaude, B.; Smith, S.M.; Kennedy, D.N.; Jenkinson, M. A Bayesian model of shape and appearance for subcortical brain segmentation. NeuroImage 2011, 56, 907–922. [Google Scholar] [CrossRef] [PubMed]
- Klein, A.; Tourville, J. 101 labeled brain images and a consistent human cortical labeling protocol. Front. Neurosci. 2012, 6, 171. [Google Scholar] [CrossRef] [PubMed]
- Hwang, J.Y.; Byun, M.S.; Choe, Y.M.; Lee, J.H.; Yi, D.; Choi, J.W.; Hwang, S.H.; Lee, Y.J.; Lee, D.Y.; KBASE Research Group. Moderating effect of APOE ε4 on the relationship between sleep-wake cycle and brain β-amyloid. Neurology 2018, 90, e1167–e1173. [Google Scholar] [CrossRef] [PubMed]
- Miki, T.; Shimada, H.; Kim, J.S.; Yamamoto, Y.; Sugino, M.; Kowa, H.; Heurling, K.; Zanette, M.; Sherwin, P.F.; Senda, M. Brain uptake and safety of Flutemetamol F 18 injection in Japanese subjects with probable Alzheimer’s disease, subjects with amnestic mild cognitive impairment and healthy volunteers. Ann. Nucl. Med. 2017, 31, 260–272. [Google Scholar] [CrossRef] [PubMed]
- Kang, J.H.; Korecka, M.; Toledo, J.B.; Trojanowski, J.Q.; Shaw, L.M. Clinical utility and analytical challenges in measurement of cerebrospinal fluid amyloid-beta (1-42) and tau proteins as Alzheimer disease biomarkers. Clin. Chem. 2013, 59, 903–916. [Google Scholar] [CrossRef] [PubMed]
- Vandijck, M.; Kuwano, R.; Waligorska, T.; De Smet, S.; Tsukie, T.; Verdoodt, L.; Deleersnijder, W.; Trojanowski, J.; Iwatsubo, T.; Shaw, L. Inter-laboratory variation when using a unified test procedure for INNO-BIA AlzBio3. Alzheimers Dement. 2013, 9, 209–210. [Google Scholar] [CrossRef]
- Shaw, L.M.; Vanderstichele, H.; Knapik-Czajka, M.; Figurski, M.; Coart, E.; Blennow, K.; Soares, H.; Simon, A.J.; Lewczuk, P.; Dean, R.A.; et al. Qualification of the analytical and clinical performance of CSF biomarker analyses in ADNI. Acta Neuropathol. 2011, 121, 597–609. [Google Scholar] [CrossRef] [PubMed]
- Lear, S.A.; Hu, W.; Rangarajan, S.; Gasevic, D.; Leong, D.; Iqbal, R.; Casanova, A.; Swaminathan, S.; Anjana, R.M.; Kumar, R.; et al. The effect of physical activity on mortality and cardiovascular disease in 130 000 people from 17 high-income, middle-income, and low-income countries: The PURE study. Lancet 2017, 390, 2643–2654. [Google Scholar] [CrossRef]
- Iwatsubo, T.; Iwata, A.; Suzuki, K.; Ihara, R.; Arai, H.; Ishii, K.; Senda, M.; Ito, K.; Ikeuchi, T.; Kuwano, R.; et al. Japanese and North American Alzheimer’s Disease Neuroimaging Initiative studies: Harmonization for international trials. Alzheimers Dement. 2018, 14, 1077–1087. [Google Scholar] [CrossRef] [PubMed]
- Johnson, K.A.; Sperling, R.A.; Gidicsin, C.M.; Carmasin, J.S.; Maye, J.E.; Coleman, R.E.; Reiman, E.M.; Sabbagh, M.N.; Sadowsky, C.H.; Fleisher, A.S.; et al. Florbetapir (F18-AV-45) PET to assess amyloid burden in Alzheimer’s disease dementia, mild cognitive impairment, and normal aging. Alzheimers Dement. 2013, 9, S72–S83. [Google Scholar] [CrossRef] [PubMed]
- Burnham, S.C.; Bourgeat, P.; Dore, V.; Savage, G.; Brown, B.; Laws, S.; Maruff, P.; Salvado, O.; Ames, D.; Martins, R.N.; et al. Clinical and cognitive trajectories in cognitively healthy elderly individuals with suspected non-Alzheimer’s disease pathophysiology (SNAP) or Alzheimer’s disease pathology: A longitudinal study. Lancet Neurol. 2016, 15, 1044–1053. [Google Scholar] [CrossRef]
- Kielb, S.; Rogalski, E.; Weintraub, S.; Rademaker, A. Objective features of subjective cognitive decline in a United States national database. Alzheimers Dement. 2017, 13, 1337–1344. [Google Scholar] [CrossRef] [PubMed]
- Reisberg, B.; Shulman, M.B.; Torossian, C.; Leng, L.; Zhu, W. Outcome over seven years of healthy adults with and without subjective cognitive impairment. Alzheimers Dement. 2010, 6, 11–24. [Google Scholar] [CrossRef] [PubMed]
- Chin, J.; Oh, K.J.; Seo, S.W.; Na, D.L. Are depressive symptomatology and self-focused attention associated with subjective memory impairment in older adults? Int. Psychogeriatr. 2014, 26, 573–580. [Google Scholar] [CrossRef] [PubMed]
- Seo, E.H.; Kim, H.; Choi, K.Y.; Lee, K.H.; Choo, I.H. Association of subjective memory complaint and depressive symptoms with objective cognitive functions in prodromal Alzheimer’s disease including pre-mild cognitive impairment. J. Affect. Disord. 2017, 217, 24–28. [Google Scholar] [CrossRef] [PubMed]
- Doody, R.S.; Ferris, S.H.; Salloway, S.; Sun, Y.; Goldman, R.; Watkins, W.E.; Xu, Y.; Murthy, A.K. Donepezil treatment of patients with MCI: A 48-week randomized, placebo-controlled trial. Neurology 2009, 72, 1555–1561. [Google Scholar] [CrossRef] [PubMed]
- Lemos, R.; Cunha, C.; Marôco, J.; Afonso, A.; Simões, M.R.; Santana, I. Free and Cued Selective Reminding Test is superior to the Wechsler Memory Scale in discriminating mild cognitive impairment from Alzheimer’s disease. Geriatr. Gerontol. Int. 2015, 15, 961–968. [Google Scholar] [CrossRef] [PubMed]
- Hirose, D.; Hanyu, H.; Fukasawa, R.; Hatanaka, H.; Namioka, N.; Sakurai, H. Frailty and sarcopenia in subjects with Alzheimer’s disease with or without cerebrovascular disease. Geriatr. Gerontol. Int. 2016, 16, 1235–1236. [Google Scholar] [CrossRef] [PubMed]
- Santos, T.; Fonseca, L.C.; Tedrus, G.; Delbue, J.L. Alzheimer’s disease: Nutritional status and cognitive aspects associated with disease severity. Nutr. Hosp. 2018, 35, 1298–1304. [Google Scholar] [CrossRef] [PubMed]
- Dumurgier, J.; Vercruysse, O.; Paquet, C.; Bombois, S.; Chaulet, C.; Laplanche, J.L.; Peoc’h, K.; Schraen, S.; Pasquier, F.; Touchon, J.; et al. Intersite variability of CSF Alzheimer’s disease biomarkers in clinical setting. Alzheimers Dement. 2013, 9, 406–413. [Google Scholar] [CrossRef] [PubMed]
- Tang, W.; Huang, Q.; Wang, Y.; Wang, Z.Y.; Yao, Y.Y. Assessment of CSF Aβ42 as an aid to discriminating Alzheimer’s disease from other dementias and mild cognitive impairment: A meta-analysis of 50 studies. J. Neurol. Sci. 2014, 345, 26–36. [Google Scholar] [CrossRef] [PubMed]


| Same Measures with the KBASE | Additional Measures in the KBASE-V |
|---|---|
| Inclusion and exclusion criteria Mini-Mental State Examination [18] Consortium to Establish a Registry for AD [18] Short Blessed Test [42] Detailed neuropsychological tests: digit span forward and backward tests [44]; logical Memory test [45]; Rey Complex Figure Test [46]; block design [47]; clock drawing test; Controlled Oral Word Association Test; Stroop test [41]; Trail Making Test A and B [43]; Frontal Assessment Battery [48] Subjective Memory Complaints Questionnaire [25] Unified Parkinson’s Disease Rating Scale [31] Geriatric Depression Scale [26] Blessed Dementia Scale-Activities of Daily Livings [27] Clinical Dementia Rating scale Global Deterioration Scale Neuropsychiatric Inventory [28]. Mini Nutritional Assessment [35] Pittsburgh Sleep Quality Index [36] Brain MRI Amyloid PET (11C-PiB PET in the KBASE and 11C-PiB PET or 18F-flutemetamol PET in the KBASE-V) | Cognitive Complaint Interview [23] Memory Assessment Clinics Questionnaire [24] Timed Up and Go Test [29] One leg standing [30] Simple appetite questionnaire [33] Eating Behavior Scale [34] International Physical Activity Questionnaire [32] Stanford Sleepiness Scale [37] Epworth Sleepiness Scale [38] Cardiovascular Health Study Frailty Index [39] CSF analysis of Aβ42, p-tau, and t-tau |
| Variables (Range) | CU of KBASE | CU of KBASE-V | MCI of KBASE | MCI of KBASE-V | ADD of KBASE | ADD of KBASE-V |
|---|---|---|---|---|---|---|
| n | 291 | 167 | 139 | 72 | 87 | 56 |
| Age, years | 69.2 (8.1) | 67.7 (7.8) | 73.7 (7.0) | 73.1 (8.4) | 73.0 (8.1) | 75.6 (7.5) |
| Female | 149 (51%) | 103 (62%) a | 92 (66%) | 33 (46%) a | 60 (80%) | 44 (79%) |
| Education, years | 11.8 (4.8) | 10.6 (5.1) b | 10.0 (4.5) | 8.9 (4.2) | 9.1 (5.4) | 5.7 (4.1) b |
| APOE ε4 carrier | 53 (18%) | 35 (21%) | 47 (34%) | 16 (22%) | 52 (60%) | 26 (46%) |
| MMSE (0–30) | 26.9 (2.6) | 26.5 (3.0) | 22.5 (3.2) | 22.7 (4.3) | 16.4 (4.2) | 16.0 (3.7) |
| CDR 0:0.5:1 § | 291:0:0 | 167:0:0 | 0:139:0 | 0:72:0 | 0:29:58 | 0:19:37 |
| CDR-SB (0–18) § | 0.01 (0.06) | 0.01 (0.07) | 1.50 (0.65) | 1.16 (0.86) † | 5.05 (1.45) | 4.81 (2.03) |
| SBT (0–28) § | 2.5 (3.3) | 3.1 (4.4) | 9.1 (6.3) | 8.6 (6.7) | 18.9 (5.3) | 19.3 (6.4) |
| CERAD, Z score | 0.35 (0.56) | 0.33 (0.47) | −0.98 (0.63) | −0.73 (0.59) b | −1.60 (0.71) | −1.59 (0.69) |
| SMCQ (0–14) § | 2.1 (2.0) | 3.9 (3.4) * | 5.6 (3.1) | 6.0 (3.6) | 5.7 (3.0) | 8.8 (3.8) ‡ |
| GDS (0–30) § | 4.7 (4.9) | 8.4 (6.5) * | 10.3 (7.0) | 10.4 (6.9) | 7.9 (5.5) | 11.9 (7.9) ‡ |
| LM immediate recall | 19.1 (7.3) | 17.0 (8.1) * | 9.2 (5.7) | 7.7 (5.3) † | 3.8 (5.0) | 2.5 (2.9) |
| LM delayed recall | 13.9 (7.4) | 12.0 (7.8) * | 3.9 (4.6) | 3.4 (4.0) | 0.7 (4.3) | 0.5 (1.3) |
| RCFT copy (0–36) | 29.6 (6.2) | 31.1 (6.6) * | 24.7 (8.4) | 27.1 (9.5) | 17.8 (11.5) | 14.8 (11.0) |
| Clock drawing (0–30) | 27.7 (2.8) | 27.6 (3.2) | 25.6 (4.9) | 24.8 (5.8) | 20.9 (7.4) | 17.2 (7.9) |
| Stroop test, Z score | 0.18 (0.98) | 0.12 (1.00) | −0.66 (0.98) | −0.55 (1.05) | −1.26 (1.15) | −1.34 (1.07) |
| COWAT | 25.6 (11.4) | 23.6 (10.4) | 19.3 (9.0) | 16.6 (9.5) | 16.3 (10.0) | 8.0 (7.8) ‡ |
| A+ | 52 (18.1%) (n = 288) | 26 (19.8%) (n = 131) | 71 (53.0%) (n = 134) | 28 (48.3%) (n = 58) | 66 (81.5%) (n = 81) | 36 (90.0%) (n = 40) |
| Participant Characteristics | CN (n = 71) | SCD (n = 96) | MCI (n = 72) | ADD (n = 56) | P * | P < 0.05 † |
|---|---|---|---|---|---|---|
| Age, years | 66.2 (7.8) | 68.8 (7.7) | 73.1 (8.4) | 75.6 (7.5) | <0.001 | b, c, d, e |
| Female | 49 (69.0%) | 54 (56.3%) | 33 (45.8%) | 44 (78.6%) | 0.001 | |
| Education, years | 13.1 (4.0) | 8.8 (5.2) | 8.9 (4.2) | 5.7 (4.1) | <0.001 | a, b, c, e, f |
| Hypertension | 28 (39.4%) | 55 (57.3%) | 42 (58.3%) | 23 (41.1%) | 0.029 | |
| Diabetes Mellitus | 19 (26.8%) | 19 (19.8%) | 20 (27.8%) | 11 (19.5%) | 0.502 | |
| Dyslipidemia | 57 (80.3%) | 71 (74.0%) | 55 (76.4%) | 37 (66.1%) | 0.321 | |
| Current smoker | 2 (2.8%) | 3 (3.1%) | 4 (5.6%) | 1 (1.8%) | 0.668 | |
| Current drinker | 27 (38.0%) | 32 (33.3%) | 18 (25.0%) | 6 (10.7%) | 0.004 | |
| BMI, kg/m2 | 24.4 (2.4) | 24.4 (3.0) | 24.3 (2.8) | 22.6 (3.0) | 0.003 | c, e, f |
| ASMI, kg/m2 | 6.7 (0.9) | 7.3 (1.2) | 7.2 (1.1) | 6.6 (1.1) | 0.013 | |
| Hand grip, kg | 30. 9 (7.9) | 27.8 (8.7) | 27.5 (8.8) | 22.1 (7.2) | 0.268 | |
| Gait speed, m/s | 1.18 (0.42) | 1.04 (0.35) | 1.02 (0.40) | 0.86 (0.38) | 0.676 | |
| Sarcopenia | 4 (5.6%) | 8 (8.3%) | 8 (11.1%) | 16 (28.6%) | 0.001 | |
| MNA (range, 0–30) | 25.4 (2.0) | 24.4 (2.7) | 24.4 (2.3) | 21.9 (3.0) | <0.001 | c, e, f |
| Meeting the PA guideline ‡ | 63 (88.7%) | 66 (68.8%) | 56 (77.8%) | 36 (64.3%) | 0.005 | |
| Total sleep time, h | 6.4 (1.4) | 6.5 (1.3) | 6.6 (1.7) | 7.1 (2.0) | 0.077 | |
| ESS (range, 7–21) § | 4.5 (2.3) | 4.7 (3.6) | 3.1 (3.1) | 3.7 (3.9) | 0.010 | b, d |
| APOE ε4 carrier | 15 (21.1%) | 20 (20.8%) | 16 (22.2%) | 26 (46.4%) | 0.002 | |
| Family history of dementia | 11 (15.5%) | 28 (29.2%) | 16 (22.2%) | 6 (10.7%) | 0.028 | |
| MMSE (range, 0–30) | 28.1 (1.7) | 25.3 (3.2) | 22.7 (4.3) | 16.0 (3.7) | <0.001 | b, c, d, e, f |
| SBT (range, 0–28) § | 1.2 (1.5) | 4.5 (5.3) | 8.6 (6.7) | 19.3 (6.4) | <0.001 | b, c, d, e, f |
| CERAD, Z score | 0.55 (0.43) | 0.17 (0.43) | −0.73 (0.59) | −1.59 (0.69) | <0.001 | a, b, c, d, e, f |
| CCI (range, 0–10) § | 1.6 (1.6) | 3.3 (2.4) | 3.8 (3.2) | 6.2 (3.5) | <0.001 | a, b, c, e, f |
| SMCQ (range, 0–14) § | 2.1 (2.0) | 5.3 (3.6) | 6.0 (3.6) | 8.8 (3.8) | <0.001 | a, b, c, e, f |
| MAC-Q (range, 6–30) § | 21.1 (2.6) | 23.7 (4.2) | 24.9 (3.8) | 26.9 (4.2) | <0.001 | a, b, c, e |
| GDS (range, 0–30) § | 6.3 (5.3) | 10.0 (6.9) | 10.4 (6.9) | 11.9 (7.9) | 0.001 | a, b, c |
| NPI (range, 0–144) § | 0.2 (1.0) | 1.6 (3.9) | 2.5 (7.5) | 13.7 (16.6) | <0.001 | c, e, f |
| BDS-ADL (range, 0–17) § | 0.01 (0.12) | 0.42 (0.70) | 0.68 (0.82) | 3.13 (2.41) | <0.001 | c, e, f |
| CDR 0:0.5:1 | 71:0:0 | 96:0:0 | 0:72:0 | 0:19:37 | <0.001 | |
| CDR-SB (range, 0–18) § | 0.01 (0.06) | 0.01 (0.07) | 1.16 (0.86) | 4.81 (2.03) | <0.001 | b, c, d, e, f |
| Neuropsychological Test (Range) | CN (n = 71) | SCD (n = 96) | MCI (n = 72) | ADD (n = 56) | P * | P < 0.05 † |
|---|---|---|---|---|---|---|
| Auditory attention span | ||||||
| Digit Span Forward (0–9) | 6.7 (1.4) | 6.1 (1.5) | 5.8 (1.4) | 5.5 (1.5) | 0.748 | |
| Digit Span Backward (0–8) | 4.5 (1.2) | 3.4 (1.3) | 3.3 (1.1) | 2.3 (1.3) | 0.001 | a, b, c |
| Language | ||||||
| Verbal fluency, Z score, | 0.49 (1.05) | −0.12 (1.05) | −0.52 (1.03) | −1.37 (0.97) | <0.001 | a, b, c, e, f |
| Boston Naming, Z score | 0.90 (0.71) | 0.43 (0.79) | −0.10 (1.11) | −0.76 (1.35) | <0.001 | a, b, c, d, e, f |
| Episodic memory | ||||||
| Word list immediate recall, Z score | 0.78 (0.81) | 0.41 (0.88) | −0.71 (0.92) | −1.72 (1.03) | <0.001 | b, c, d, e, f |
| Word list delayed recall, Z score | 0.45 (0.77) | 0.09 (0.79) | −1.29 (0.85) | −2.14 (0.82) | <0.001 | b, c, d, e, f |
| Word list recognition, Z score | 0.26 (1.01) | 0.17 (0.66) | −1.26 (1.59) | −2.78 (1.55) | <0.001 | b, c, d, e, f |
| Praxis recall, Z score | 0.66 (0.82) | 0.11 (0.81) | −0.86 (1.00) | −1.51 (0.75) | <0.001 | a, b, c, d, e, f |
| RCFT, 3 min delayed recall (0–36) | 16.89 (6.33) | 12.89 (7.30) | 8.80 (6.30) | 1.20 (2.85) | <0.001 | b, c, d, e, f |
| RCFT, 30 min delayed recall (0–36) | 16.97 (6.76) | 12.28 (7.56) | 7.83 (6.27) | 1.31 (2.32) | <0.001 | a, b, c, d, e, f |
| LM immediate recall (0–50) | 21.6 (7.1) | 13.6 (7.1) | 7.7 (5.3) | 2.5 (2.9) | <0.001 | a, b, c, d, e, f |
| LM delayed recall (0–50) | 15.8 (7.3) | 9.1 (6.9) | 3.4 (4.0) | 0.5 (1.3) | <0.001 | a, b, c, d, e |
| LM recognition (0–30) | 23.0 (3.6) | 18.8 (4.2) | 15.4 (5.5) | 11.1 (6.5) | <0.001 | b, c, d, e |
| Visuoconstruction | ||||||
| Constructional praxis, Z score | 0.34 (0.57) | 0.09 (0.85) | −0.33 (1.29) | −0.86 (1.44) | <0.001 | b, c, e, f |
| RCFT copy (0–36) | 30.00 (0.96) | 29.07 (0.47) | 27.80 (0.86) | 18.82 (1.04) | <0.001 | c, e, f |
| Clock drawing (0–30) | 28.8 (1.7) | 26.8 (3.8) | 24.8 (5.8) | 17.2 (7.9) | <0.001 | b, c, e, f |
| Block design (0–66) | 34.3 (9.5) | 26.4 (10.5) | 24.8 (10.7) | 12.3 (9.8) | <0.001 | c, e, f |
| Executive function | ||||||
| Stroop color reading, Z score | 0.53 (0.91) | −0.19 (0.95) | −0.55 (1.05) | −1.34 (1.07) | <0.001 | a, b, c, e, f |
| COWAT | 28.4 (8.8) | 20.0 (10.1) | 16.6 (9.5) | 8.0 (7.8) | <0.001 | b, c, e, f |
| FAB (0–18) | 15.7 (1.9) | 13.9 (3.0) | 11.4 (3.8) | 7.9 (3.7) | <0.001 | b, c, d, e, f |
| TMT-A (0–360 s) | 50.8 (17.8) | 67.0 (35.3) | 93.3 (55.4) | 168.9 (87.4) | <0.001 | c, d, e, f |
| TMT-B (0–360 s) | 125.9 (64.1) | 171.0 (74.6) | 190.1 (91.3) | 255.8 (102) | <0.001 | a, b, c, e, f |
| CN (n = 71) | SCD (n = 96) | MCI (n = 72) | ADD (n = 56) | P† | P < 0.05 ‡ | |
|---|---|---|---|---|---|---|
| A+:A− | 4 (8.9%):41 | 22 (25.6%):64 | 28 (48.3%):30 | 36 (90.0%):4 | <0.001 | |
| T+:T− | 2 (6.9%):27 | 12 (20.7%):46 | 14 (48.3%):15 | 18 (78.3%):5 | <0.001 | |
| N+:N− | 22 (31.0%):49 | 72 (75.0%):24 | 57 (79.2%):15 | 53 (94.7%):3 | <0.001 | |
| Amyloid PET, n | 44 | 78 | 56 | 38 * | ||
| Aβ deposition on PET | 2 (4.5%) | 18 (23.1%) | 23 (41.1%) | 32 (84.2%) | <0.001 | |
| 18F-flutemetamol PET, n | 30 | 43 | 38 | 24 | ||
| FMM composite SUVR | 0.58 (0.03) | 0.62 (0.12) | 0.67 (0.12) | 0.81 (0.14) | <0.001 | b, c, e, f |
| 11C-PiB PET, n | 14 | 35 | 18 | 13 | ||
| PiB composite SUVR | 1.08 (0.04) | 1.14 (0.16) | 1.25 (0.28) | 1.56 (0.41) | <0.001 | c, e, f |
| Cerebrospinal fluid, n | 29 | 58 | 29 | 23 | ||
| Aβ42, pg/mL | 548.6 (87.1) | 510.1 (98.5) | 415.3 (141.4) | 306.2 (126.3) | <0.001 | b, c, d, e, f |
| T-tau, pg/mL | 49.6 (10.6) | 52.3 (21.4) | 55.4 (18.8) | 91.1 (62.0) | <0.001 | c, e, f |
| P-tau, pg/mL | 16.8 (5.0) | 18.5 (7.4) | 23.6 (14.7) | 37.0 (24.1) | <0.001 | c, e, f |
| T-tau/Aβ42 | 0.09 (0.02) | 0.12 (0.11) | 0.16 (0.10) | 0.37 (0.34) | <0.001 | c, e, f |
| P-Tau/Aβ42 | 0.03 (0.01) | 0.04 (0.03) | 0.07 (0.07) | 0.15 (0.11) | <0.001 | b, c, e, f |
| Brain MRI, n | 71 | 96 | 72 | 56 | ||
| Cortical thickness, mm | 3.17 (0.09) | 3.03 (0.15) | 3.05 (0.14) | 2.97 (0.15) | <0.001 | a, b, c, f |
| Hippocampal volume cm3 | 5.12 (0.63) | 5.09 (0.76) | 4.76 (0.77) | 4.40 (0.80) | <0.001 | b, c, d, e, f |
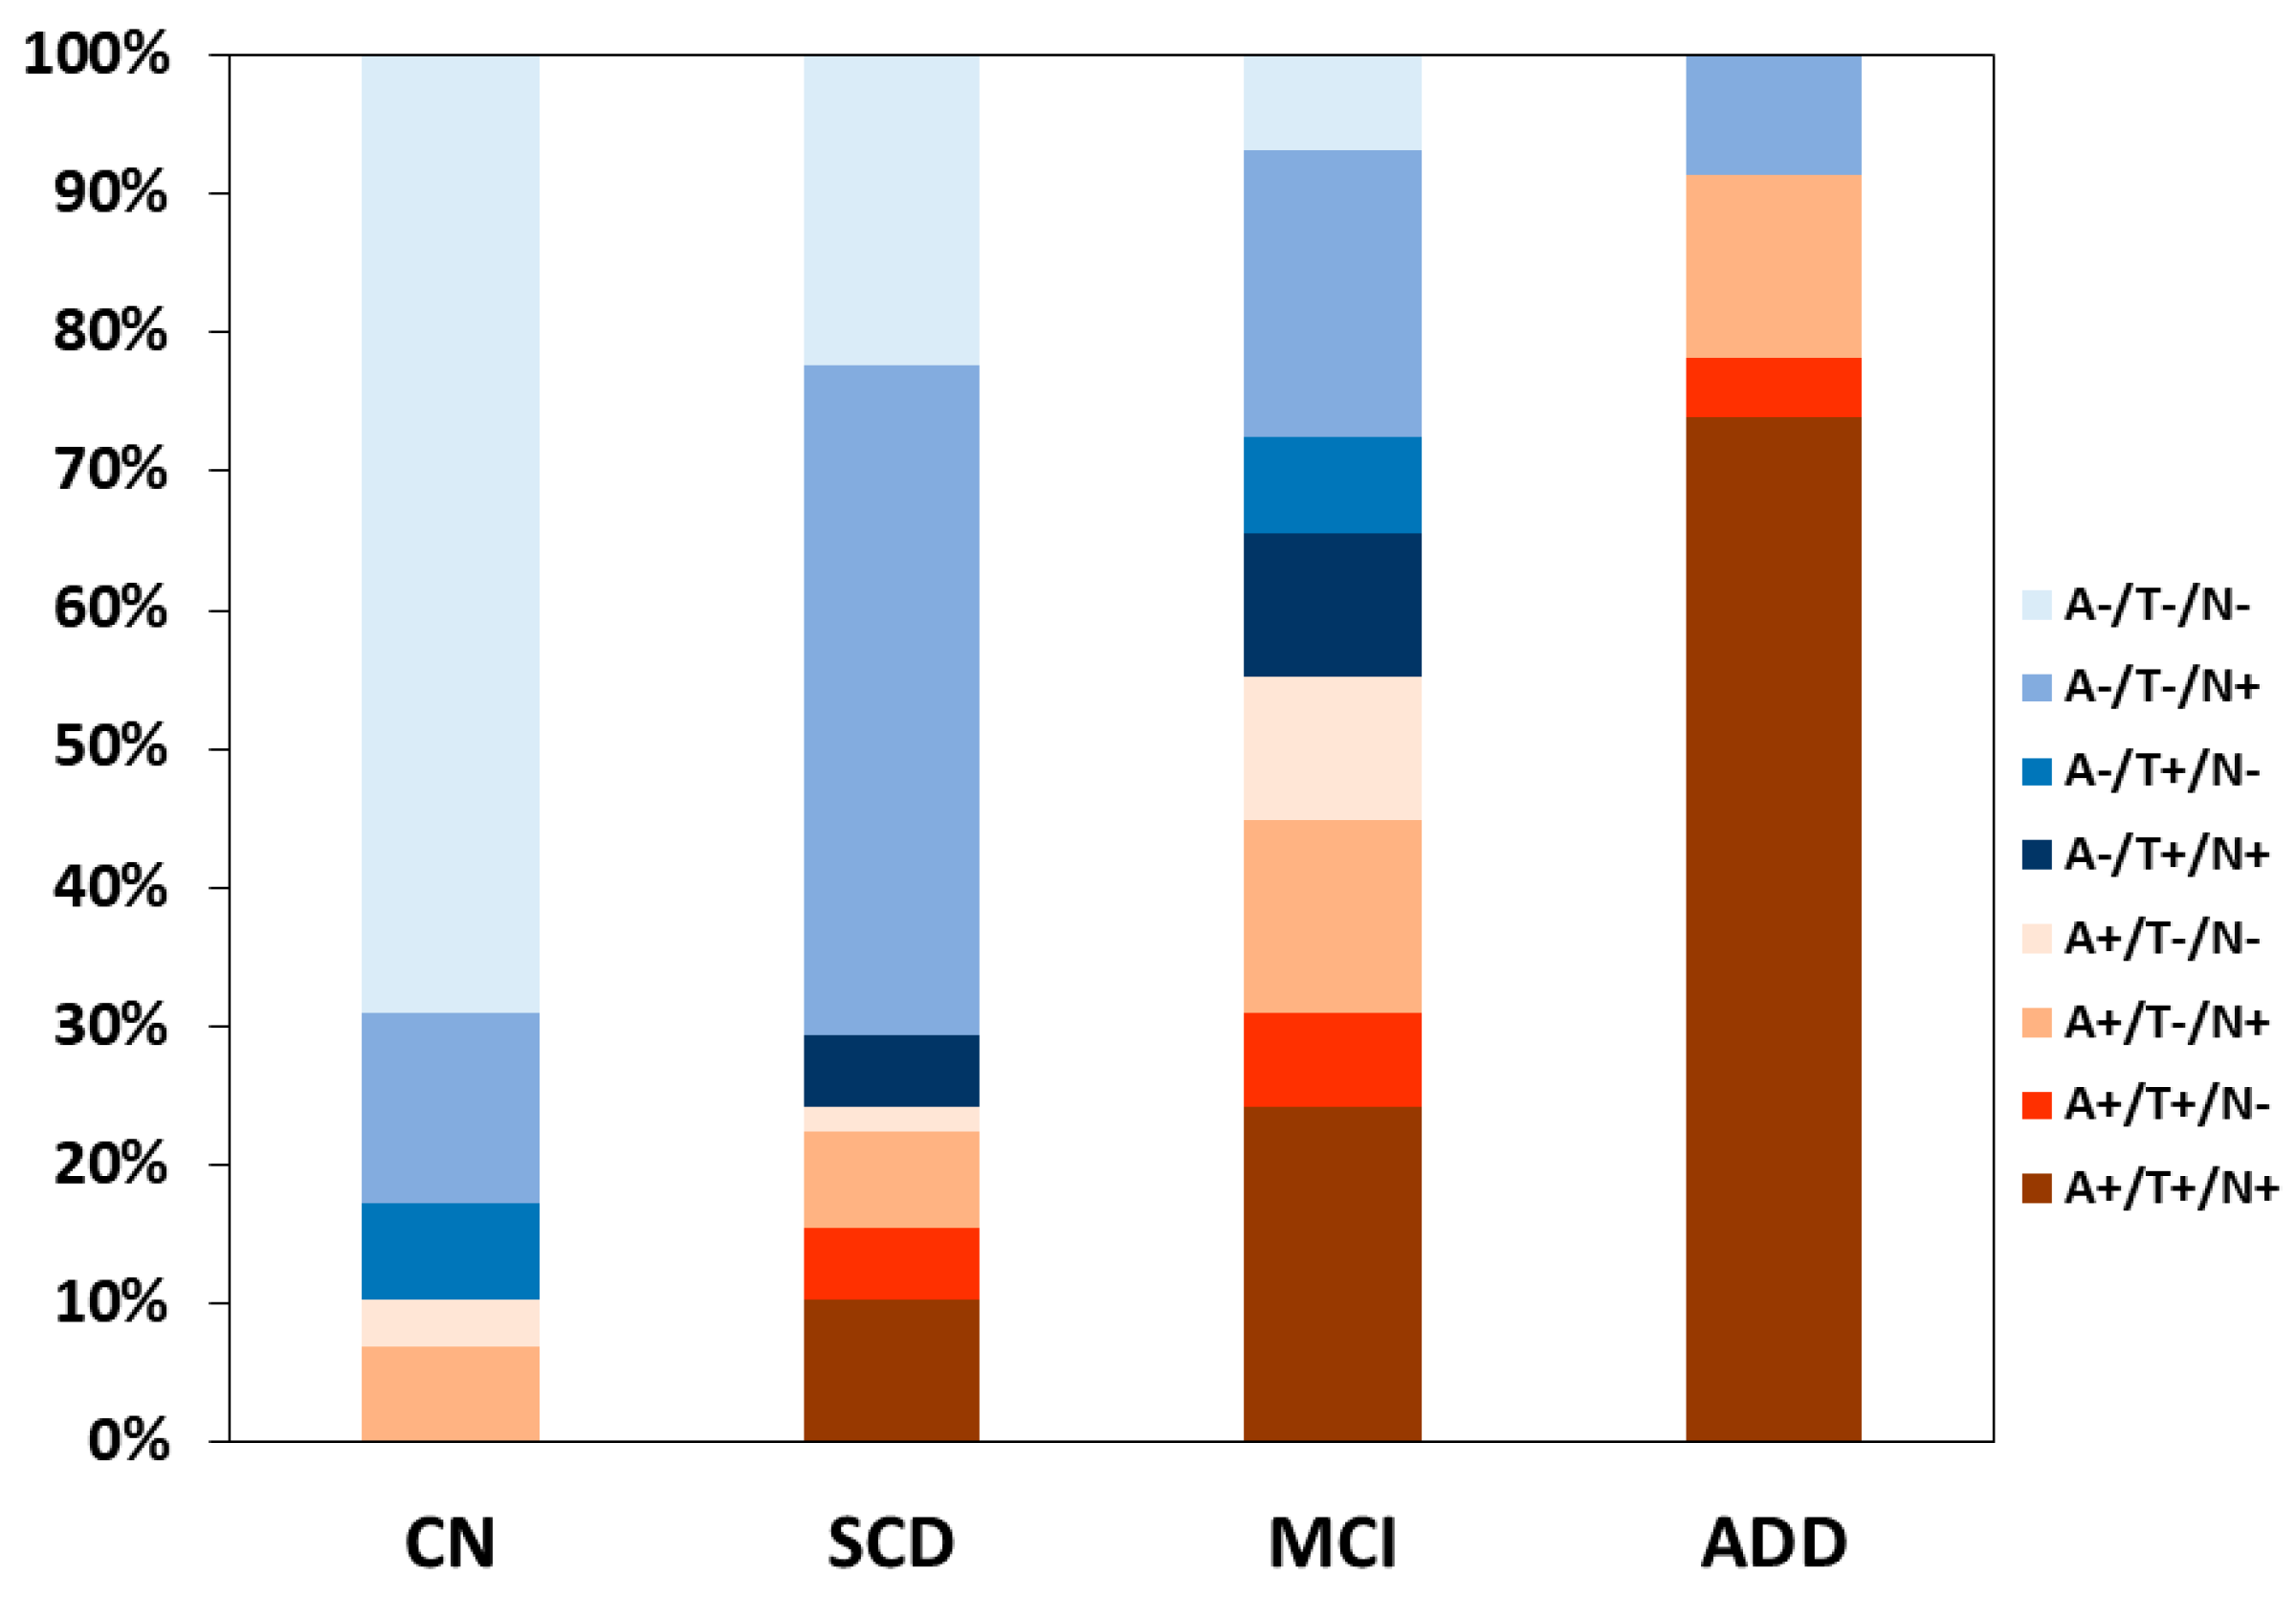
| ATN Profile | Biomarker Category | Syndromal Cognitive Stage | |||
|---|---|---|---|---|---|
| CN (n = 29) | SCD (n = 58) | MCI (n = 29) | ADD (n = 23) | ||
| A−/T−/N− | Normal AD biomarkers | 20 (69.0%) | 13 (22.4%) | 2 (6.9%) | 0 |
| A+/T−/N− | Alzheimer’s pathologic change | 1 (3.4%) | 1 (1.7%) | 3 (10.3%) | 0 |
| A+/T+/N− | Alzheimer’s disease | 0 | 3 (5.2%) | 2 (6.9%) | 1 (4.4%) |
| A+/T+/N+ | Alzheimer’s disease | 0 | 6 (10.3%) | 7 (24.1%) | 17 (73.9%) |
| A+/T−/N+ | Alzheimer’s and SNAP | 2 (6.9%) | 4 (6.9%) | 4 (13.8%) | 3 (13.0%) |
| A−/T+/N− | Non-AD pathologic change | 2 (6.9%) | 0 | 2 (6.9%) | 0 |
| A−/T+/N+ | Non-AD pathologic change | 0 | 3 (5.2%) | 3 (10.3%) | 0 |
| A−/T−/N+ | Non-AD pathologic change | 4 (13.8%) | 28 (48.3%) | 6 (20.7%) | 2 (8.7%) |
© 2019 by the authors. Licensee MDPI, Basel, Switzerland. This article is an open access article distributed under the terms and conditions of the Creative Commons Attribution (CC BY) license (http://creativecommons.org/licenses/by/4.0/).
Share and Cite
Hwang, J.; Jeong, J.H.; Yoon, S.J.; Park, K.W.; Kim, E.-J.; Yoon, B.; Jang, J.-W.; Kim, H.J.; Hong, J.Y.; Lee, J.-M.; et al. Clinical and Biomarker Characteristics According to Clinical Spectrum of Alzheimer’s Disease (AD) in the Validation Cohort of Korean Brain Aging Study for the Early Diagnosis and Prediction of AD. J. Clin. Med. 2019, 8, 341. https://doi.org/10.3390/jcm8030341
Hwang J, Jeong JH, Yoon SJ, Park KW, Kim E-J, Yoon B, Jang J-W, Kim HJ, Hong JY, Lee J-M, et al. Clinical and Biomarker Characteristics According to Clinical Spectrum of Alzheimer’s Disease (AD) in the Validation Cohort of Korean Brain Aging Study for the Early Diagnosis and Prediction of AD. Journal of Clinical Medicine. 2019; 8(3):341. https://doi.org/10.3390/jcm8030341
Chicago/Turabian StyleHwang, Jihye, Jee Hyang Jeong, Soo Jin Yoon, Kyung Won Park, Eun-Joo Kim, Bora Yoon, Jae-Won Jang, Hee Jin Kim, Jin Yong Hong, Jong-Min Lee, and et al. 2019. "Clinical and Biomarker Characteristics According to Clinical Spectrum of Alzheimer’s Disease (AD) in the Validation Cohort of Korean Brain Aging Study for the Early Diagnosis and Prediction of AD" Journal of Clinical Medicine 8, no. 3: 341. https://doi.org/10.3390/jcm8030341