Prediction of Acute Kidney Injury after Liver Transplantation: Machine Learning Approaches vs. Logistic Regression Model

 ,
,
Abstract
:1. Introduction
2. Materials and Methods
2.1. Study Design
2.2. Anesthesia and Surgical Techniques
2.3. Data Collection
2.4. Statistical Analysis
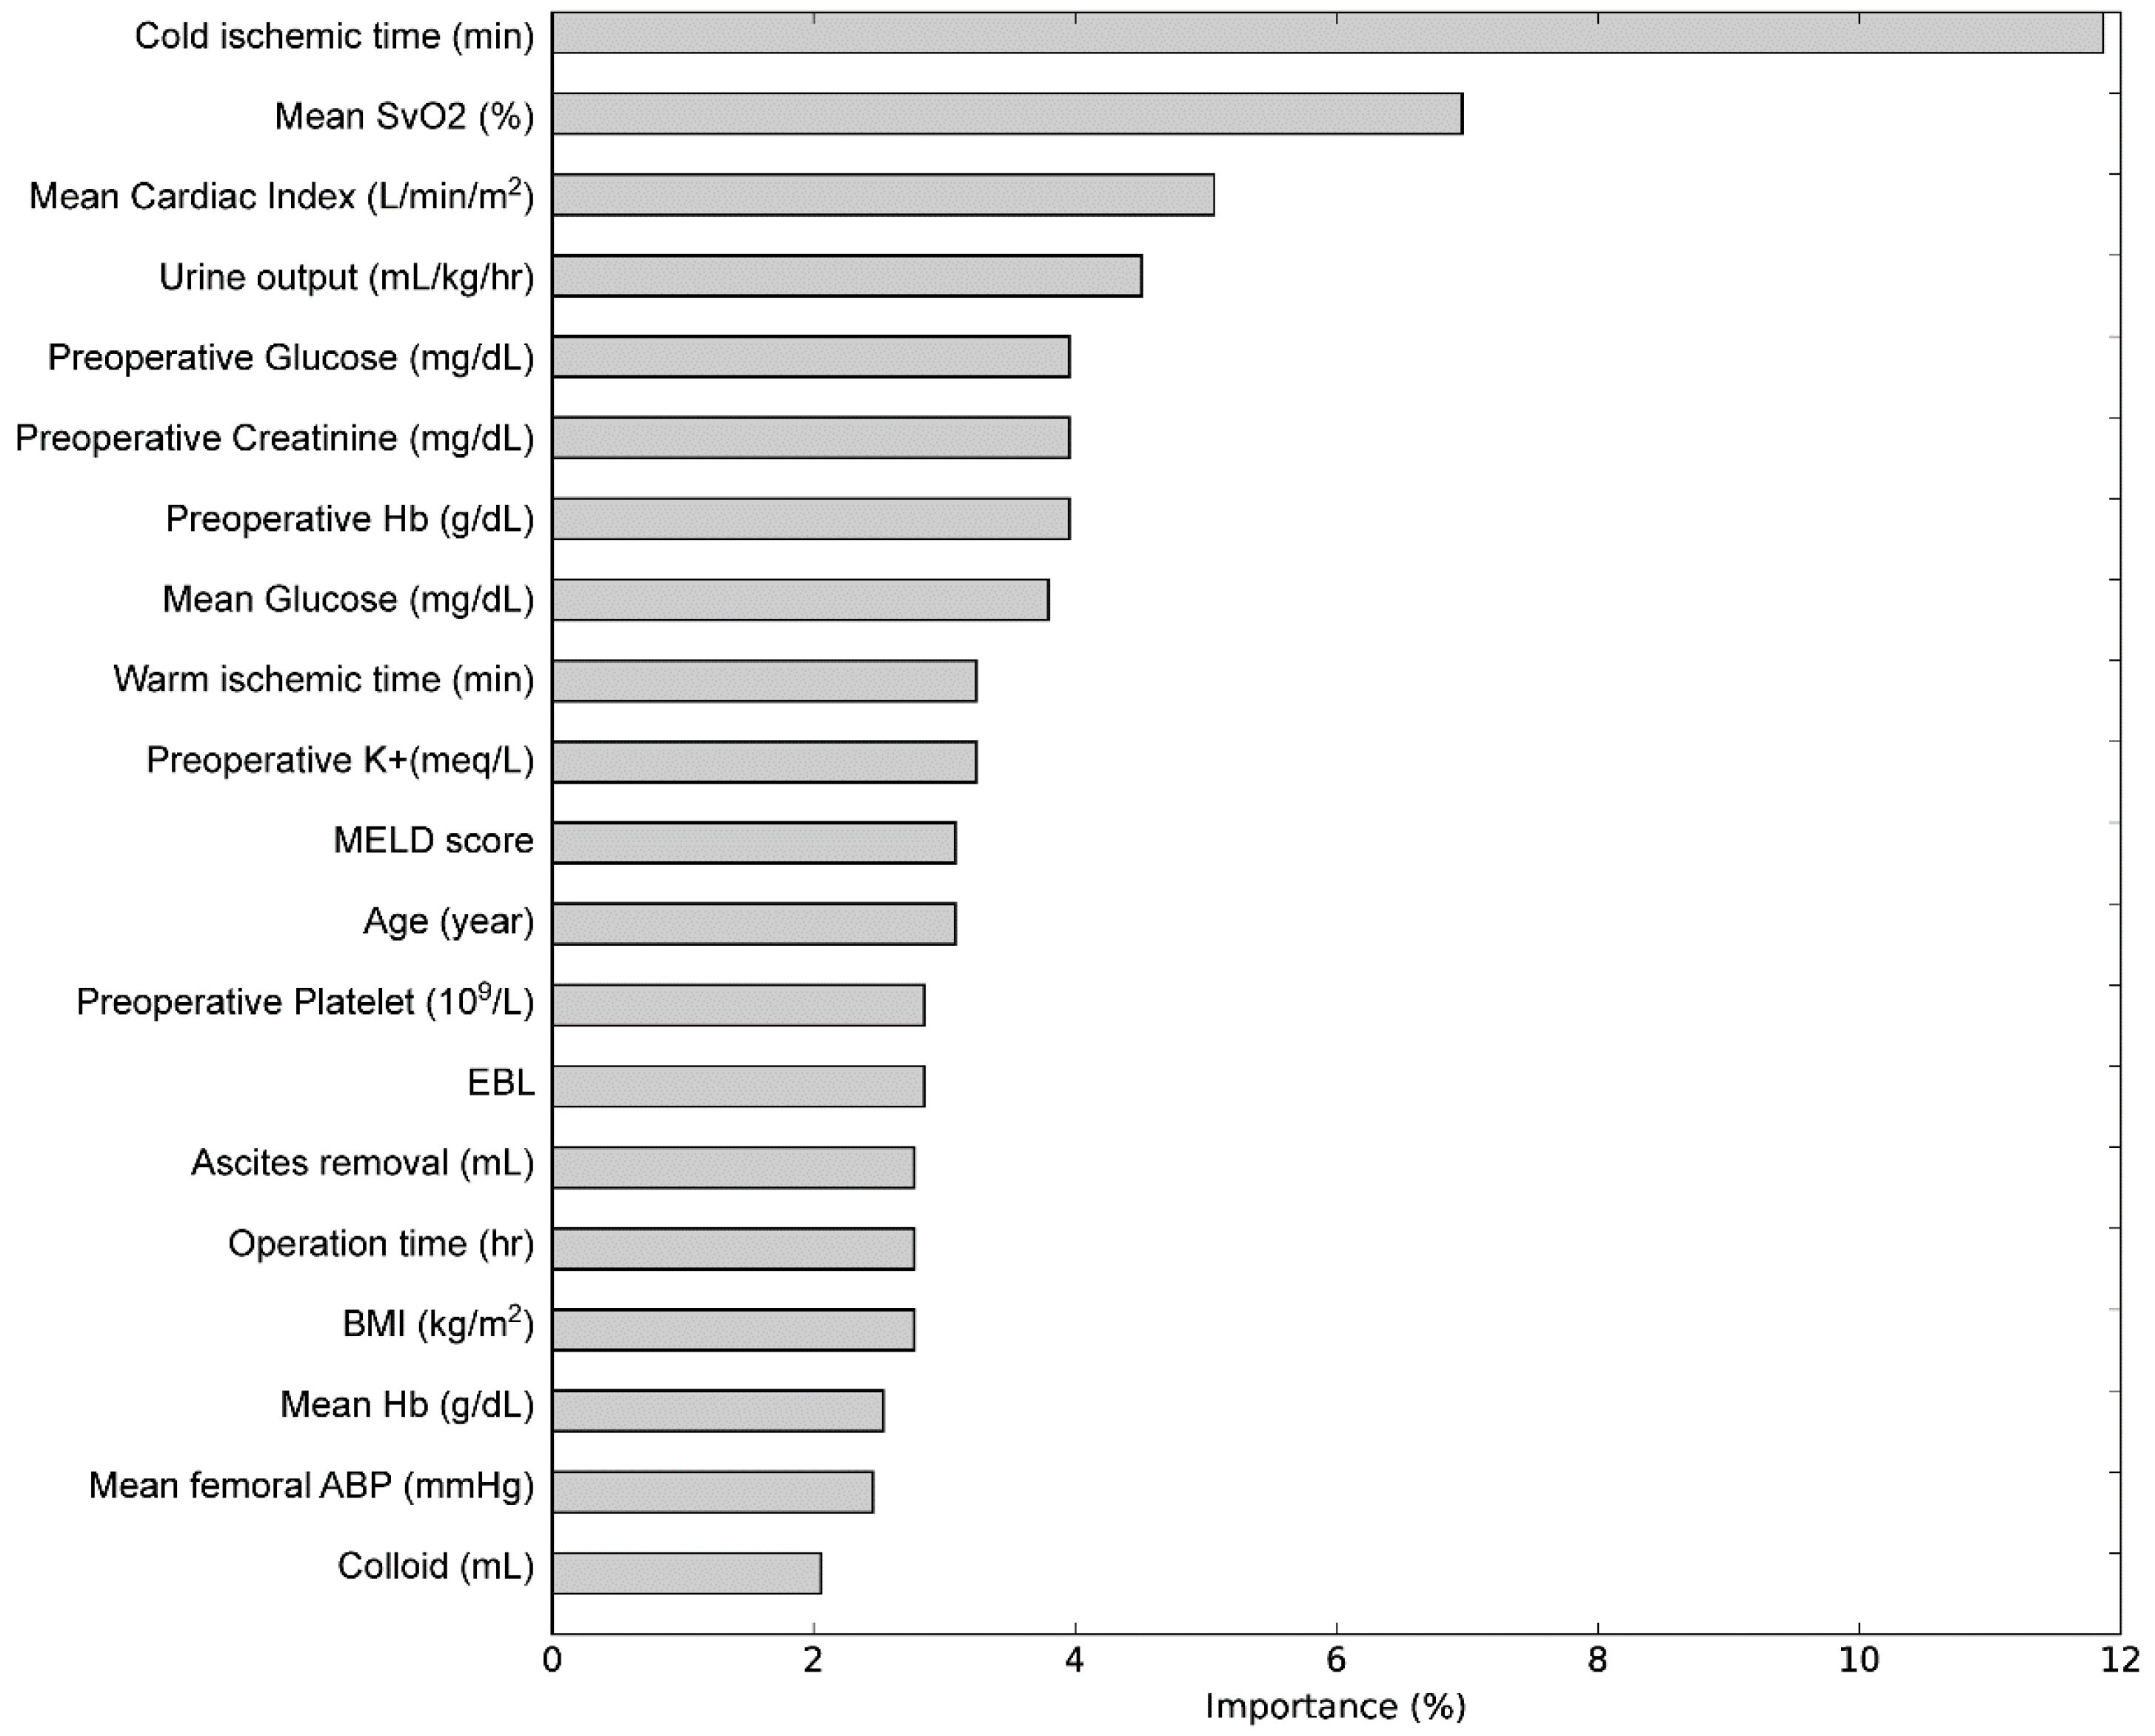
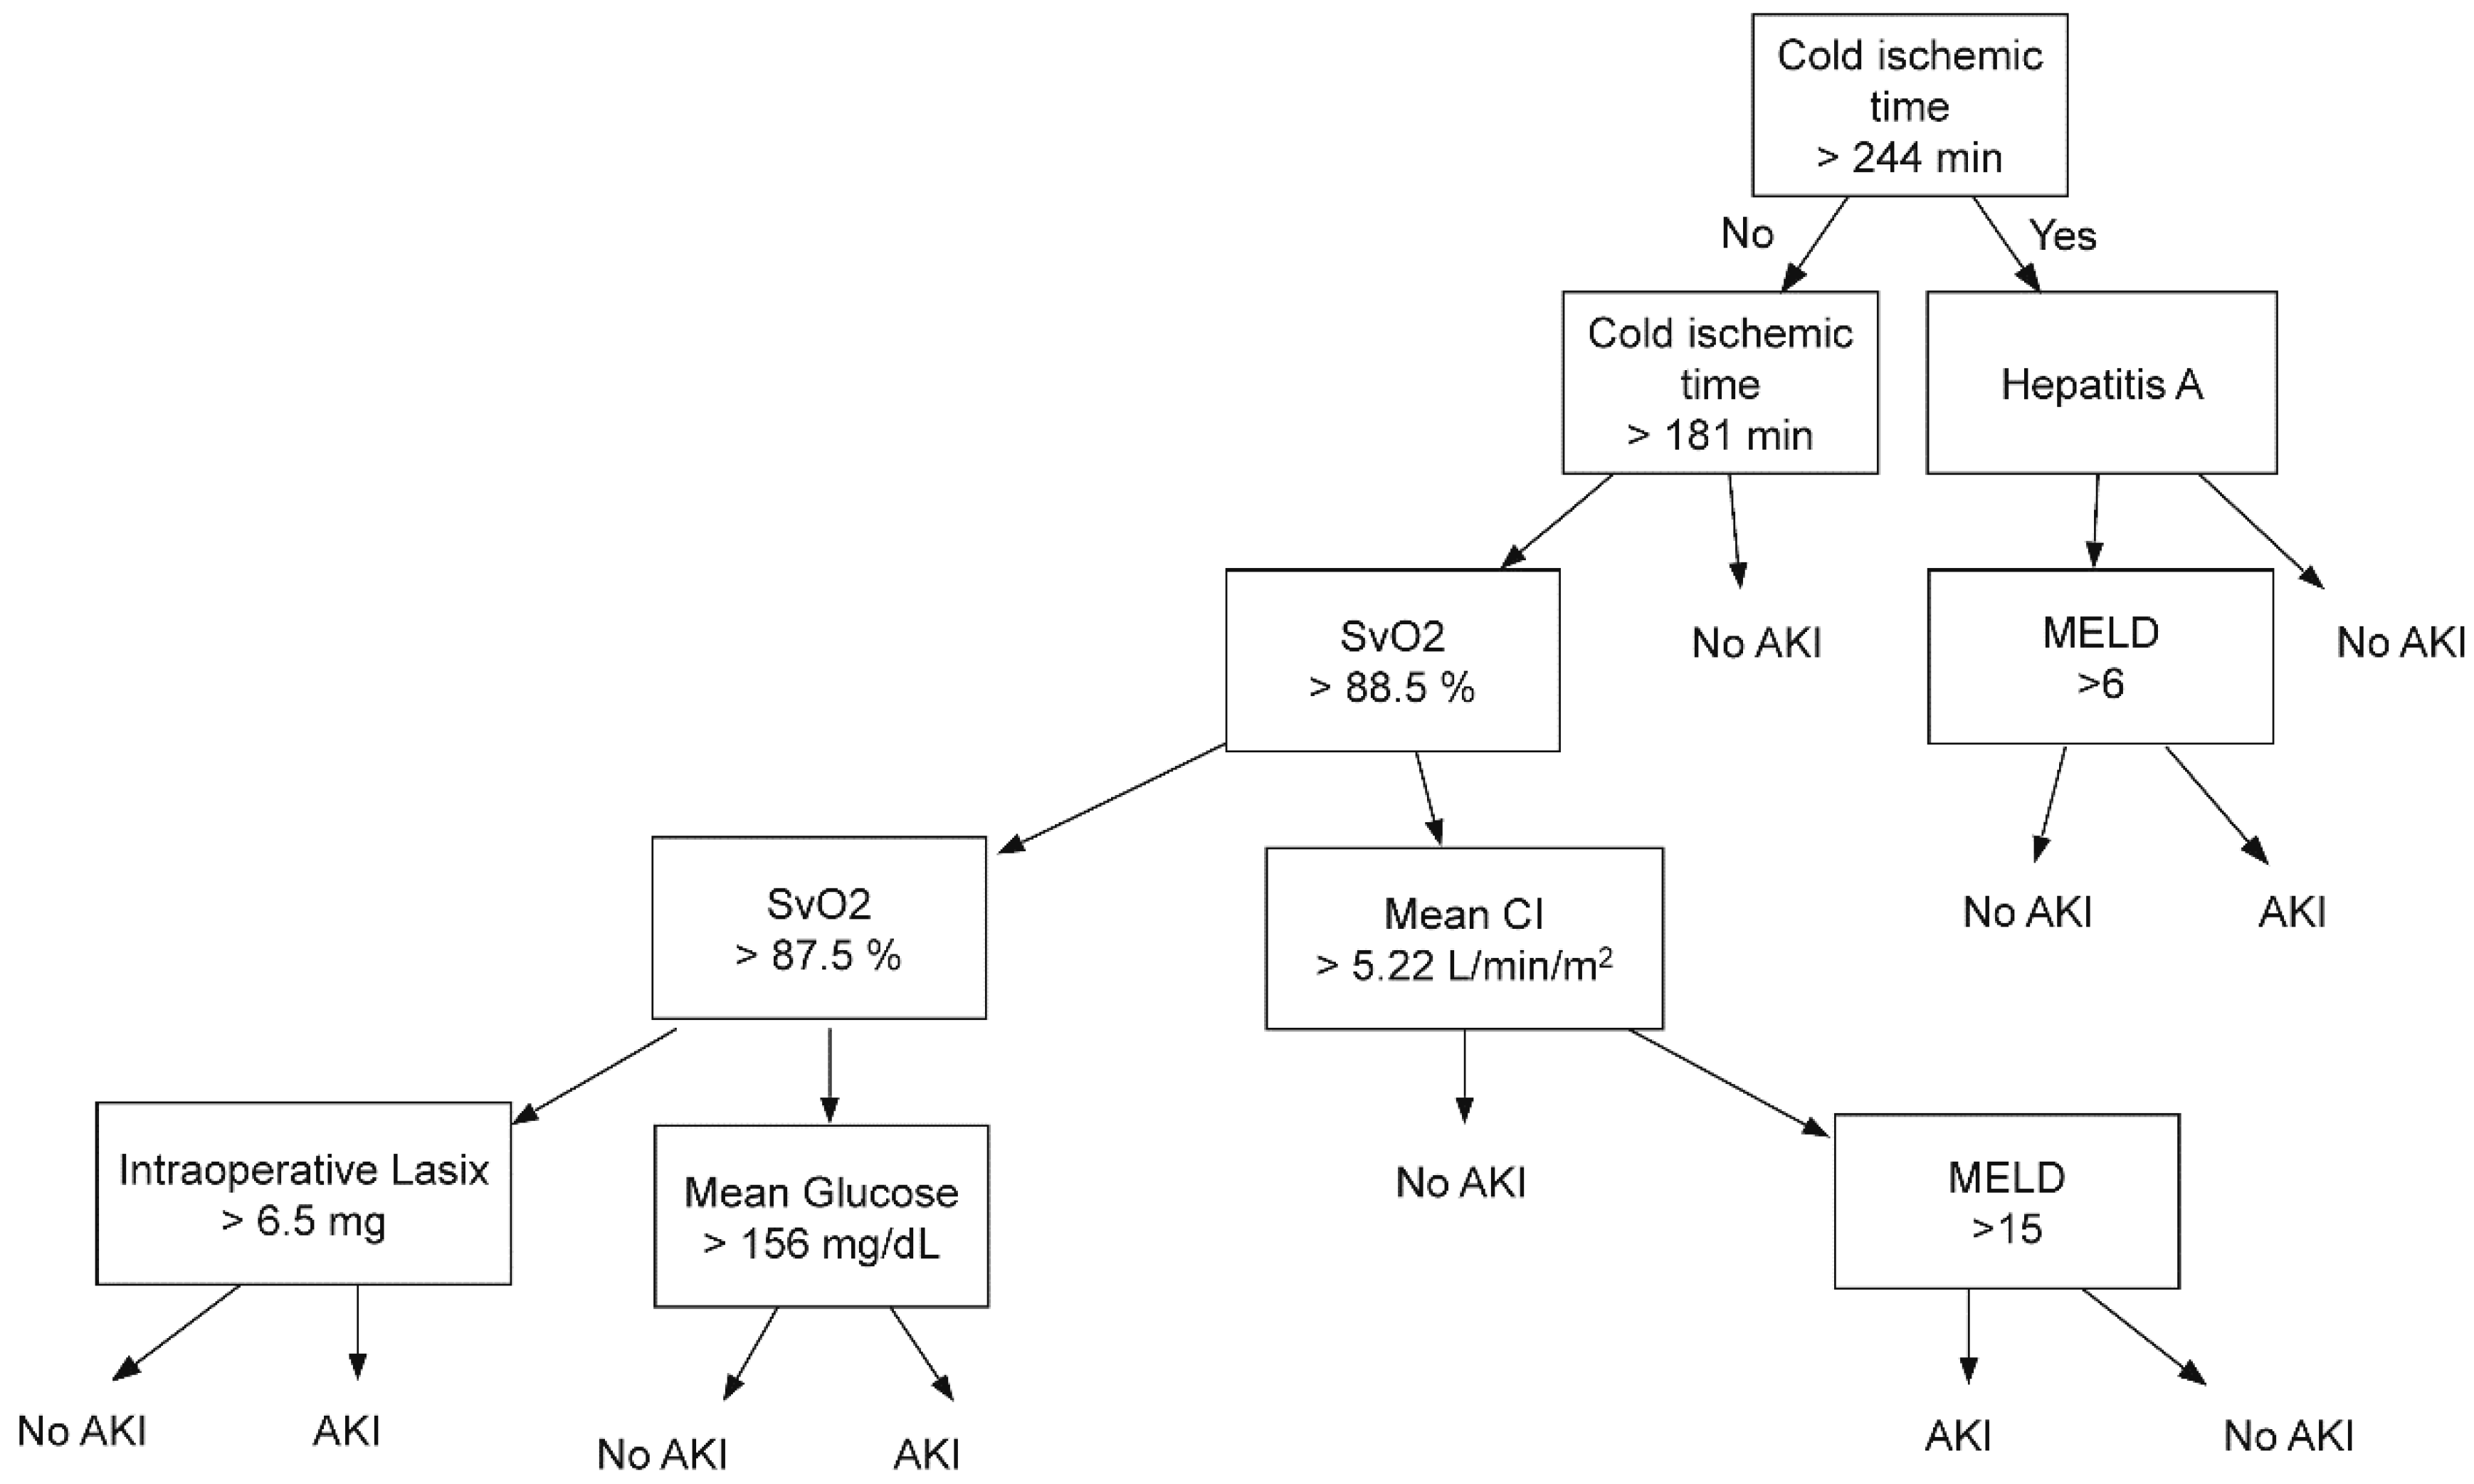
3. Results
4. Discussion
5. Conclusions
Supplementary Materials
Author contributions
Funding
Conflicts of Interest
References
- Lee, C.K.; Hofer, I.; Gabel, E.; Baldi, P.; Cannesson, M. Development and Validation of a Deep Neural Network Model for Prediction of Postoperative in-hospital Mortality. Anesthesiology 2018, 129, 649–662. [Google Scholar] [CrossRef] [PubMed]
- Fei, Y.; Hu, J.; Li, W.Q.; Wang, W.; Zong, G.Q. Artificial neural networks predict the incidence of portosplenomesenteric venous thrombosis in patients with acute pancreatitis. J. Thromb. Haemost. 2017, 15, 439–445. [Google Scholar] [CrossRef] [PubMed]
- Taylor, R.A.; Pare, J.R.; Venkatesh, A.K.; Mowafi, H.; Melnick, E.R.; Fleischman, W.; Hall, M.K. Prediction of In-hospital Mortality in Emergency Department Patients with Sepsis: A Local Big Data-Driven, Machine Learning Approach. Acad. Emerg. Med. 2016, 23, 269–278. [Google Scholar] [CrossRef] [PubMed]
- Koyner, J.L.; Carey, K.A.; Edelson, D.P.; Churpek, M.M. The Development of a Machine Learning Inpatient Acute Kidney Injury Prediction Model. Crit. Care Med. 2018, 46, 1070–1077. [Google Scholar] [CrossRef] [PubMed]
- Thottakkara, P.; Ozrazgat-Baslanti, T.; Hupf, B.B.; Rashidi, P.; Pardalos, P.; Momcilovic, P.; Bihorac, A. Application of Machine Learning Techniques to High-Dimensional Clinical Data to Forecast Postoperative Complications. PLoS ONE 2016, 11, e0155705. [Google Scholar] [CrossRef] [PubMed]
- Utsumi, M.; Umeda, Y.; Sadamori, H.; Nagasaka, T.; Takaki, A.; Matsuda, H.; Shinoura, S.; Yoshida, R.; Nobuoka, D.; Satohm, D.; et al. Risk factors for acute renal injury in living donor liver transplantation: Evaluation of the RIFLE criteria. Transpl. Int. 2013, 26, 842–852. [Google Scholar] [CrossRef] [PubMed]
- Lebron Gallardo, M.; Herrera Gutierrez, M.E.; Seller Perez, G.; Curiel Balsera, E.; Fernandez Ortega, J.F.; Quesada Garcia, G. Risk factors for renal dysfunction in the postoperative course of liver transplant. Liver Transpl. 2004, 10, 1379–1385. [Google Scholar] [CrossRef] [PubMed] [Green Version]
- Barri, Y.M.; Sanchez, E.Q.; Jennings, L.W.; Melton, L.B.; Hays, S.; Levy, M.F.; Klintmalm, G.B. Acute kidney injury following liver transplantation: Definition and outcome. Liver Transpl. 2009, 15, 475–483. [Google Scholar] [CrossRef] [PubMed] [Green Version]
- Thomas, M.E.; Blaine, C.; Dawnay, A.; Devonald, M.A.; Ftouh, S.; Laing, C.; Latchem, S.; Lewington, A.; Milford, D.V.; Ostermann, M. The definition of acute kidney injury and its use in practice. Kidney Int. 2015, 87, 62–73. [Google Scholar] [CrossRef] [PubMed]
- Chen, J.; Singhapricha, T.; Hu, K.Q.; Hong, J.C.; Steadman, R.H.; Busuttil, R.W.; Xia, V.M. Postliver transplant acute renal injury and failure by the RIFLE criteria in patients with normal pretransplant serum creatinine concentrations: A matched study. Transplantation 2011, 91, 348–353. [Google Scholar] [CrossRef] [PubMed]
- Paugam-Burtz, C.; Kavafyan, J.; Merckx, P.; Dahmani, S.; Sommacale, D.; Ramsay, M.; Belghiti, J.; Mantz, J. Postreperfusion syndrome during liver transplantation for cirrhosis: Outcome and predictors. Liver Transpl. 2009, 15, 522–529. [Google Scholar] [CrossRef] [PubMed] [Green Version]
- Vives, M.; Callejas, R.; Duque, P.; Echarri, G.; Wijeysundera, D.N.; Hernandez, A.; Sabate, A.; Bes-Rastrollo, M.; Monedero, P. Modern hydroxyethyl starch and acute kidney injury after cardiac surgery: A prospective multicentre cohort. Br. J. Anaesth. 2016, 117, 458–463. [Google Scholar] [CrossRef] [PubMed]
- Park, M.H.; Shim, H.S.; Kim, W.H.; Kim, H.J.; Kim, D.J.; Lee, S.H.; Kim, C.S.; Gwak, M.S.; Kim, G.S. Clinical Risk Scoring Models for Prediction of Acute Kidney Injury after Living Donor Liver Transplantation: A Retrospective Observational Study. PLoS ONE 2015, 10, e0136230. [Google Scholar]
- Jun, I.G.; Kwon, H.M.; Jung, K.W.; Moon, Y.J.; Shin, W.J.; Song, J.G.; Hwang, G.S. The Impact of Postreperfusion Syndrome on Acute Kidney Injury in Living Donor Liver Transplantation: A Propensity Score Analysis. Anesth. Analg. 2018, 127, 369–378. [Google Scholar] [CrossRef] [PubMed]
- Jun, I.G.; Lee, B.; Kim, S.O.; Shin, W.J.; Bang, J.Y.; Song, J.G.; Song, G.W.; Lee, S.G.; Hwang, G.S. Comparison of acute kidney injury between ABO-compatible and ABO-incompatible living donor liver transplantation: A propensity matching analysis. Liver Transpl. 2016, 22, 1656–1665. [Google Scholar] [CrossRef] [PubMed]
- Zou, K.H.; O’Malley, A.J.; Mauri, L. Receiver-operating characteristic analysis for evaluating diagnostic tests and predictive models. Circulation 2007, 115, 654–657. [Google Scholar] [CrossRef] [PubMed]
- Hilmi, I.A.; Damian, D.; Al-Khafaji, A.; Sakai, T.; Donaldson, J.; Winger, D.G.; Kellum, J.A. Acute kidney injury after orthotopic liver transplantation using living donor versus deceased donor grafts: A propensity score-matched analysis. Liver Transpl. 2015, 21, 1179–1185. [Google Scholar] [CrossRef] [PubMed]
- Selzner, M.; Kashfi, A.; Cattral, M.S.; Selzner, N.; McGilvray, I.D.; Greig, P.D.; Levy, G.A.; Renner, E.L.; Grant, D.R. Live donor liver transplantation in high MELD score recipients. Ann. Surg. 2010, 251, 153–157. [Google Scholar] [CrossRef] [PubMed]
- Cockcroft, D.W.; Gault, M.H. Prediction of creatinine clearance from serum creatinine. Nephron 1976, 16, 31–41. [Google Scholar] [CrossRef] [PubMed]
- Hori, D.; Katz, N.M.; Fine, D.M.; Ono, M.; Barodka, V.M.; Lester, L.C.; Yenokyan, G.; Hogue, C.W. Defining oliguria during cardiopulmonary bypass and its relationship with cardiac surgery-associated acute kidney injury. Br. J. Anaesth. 2016, 117, 733–740. [Google Scholar] [CrossRef] [PubMed]
- Mizota, T.; Yamamoto, Y.; Hamada, M.; Matsukawa, S.; Shimizu, S.; Kai, S. Intraoperative oliguria predicts acute kidney injury after major abdominal surgery. Br. J. Anaesth. 2017, 119, 1127–1134. [Google Scholar] [CrossRef] [PubMed]
- Kellum, J.A.; Zarbock, A.; Nadim, M.K. What endpoints should be used for clinical studies in acute kidney injury? Intens. Care Med. 2017, 43, 901–903. [Google Scholar] [CrossRef] [PubMed]
- Sheridan, R.P.; Wang, W.M.; Liaw, A.; Ma, J.; Gifford, E.M. Extreme Gradient Boosting as a Method for Quantitative Structure-Activity Relationships. J. Chem. Inf. Model. 2016, 56, 2353–2360. [Google Scholar] [CrossRef] [PubMed]
- Gao, C.; Sun, H.; Wang, T.; Tang, M.; Bohnen, N.I.; Muller, M.; Herman, T.; Giladi, N.; Kalinin, A.; Spino, C.; et al. Model-based and Model-free Machine Learning Techniques for Diagnostic Prediction and Classification of Clinical Outcomes in Parkinson’s Disease. Sci. Rep. 2018, 8, 7129. [Google Scholar] [CrossRef] [PubMed]
- DeLong, E.R.; DeLong, D.M.; Clarke-Pearson, D.L. Comparing the areas under two or more correlated receiver operating characteristic curves: A nonparametric approach. Biometrics 1988, 44, 837–845. [Google Scholar] [CrossRef] [PubMed]
- Lee, H.-C.; Yoon, H.-K.; Nam, K.; Cho, Y.; Kim, T.; Kim, W.; Bahk, J.H. Derivation and Validation of Machine Learning Approaches to Predict Acute Kidney Injury after Cardiac Surgery. J. Clin. Med. 2018, 7, 322. [Google Scholar] [CrossRef] [PubMed]
- Li, K.; Yu, N.; Li, P.; Song, S.; Wu, Y.; Li, Y.; Liu, M. Multi-label spacecraft electrical signal classification method based on DBN and random forest. PLoS ONE 2017, 12, e0176614. [Google Scholar] [CrossRef] [PubMed]
- Hsu, P.L.; Robbins, H. Complete Convergence and the Law of Large Numbers. Proc. Natl. Acad. Sci. USA 1947, 33, 25–31. [Google Scholar] [CrossRef] [PubMed]
- Aviles-Jurado, F.X.; Leon, X. Prognostic factors in head and neck squamous cell carcinoma, comparison of CHAID decision trees technology and Cox analysis. Head Neck 2013, 35, 877–883. [Google Scholar] [CrossRef] [PubMed]
- Kasbekar, P.U.; Goel, P.; Jadhav, S.P. A Decision Tree Analysis of Diabetic Foot Amputation Risk in Indian Patients. Front. Endocrinol. 2017, 8, 25. [Google Scholar] [CrossRef] [PubMed]
- Zintzaras, E.; Bai, M.; Douligeris, C.; Kowald, A.; Kanavaros, P. A tree-based decision rule for identifying profile groups of cases without predefined classes: Application in diffuse large B-cell lymphomas. Comput. Biol. Med. 2007, 37, 637–641. [Google Scholar] [CrossRef] [PubMed]
- Hornik, K. Approximation capabilities of multilayer feedforward networks. Neural Netw. 1991, 4, 251–257. [Google Scholar] [CrossRef]
- Kuo, P.J.; Wu, S.C.; Chien, P.C.; Rau, C.S.; Chen, Y.C.; Hsieh, H.Y.; Hsieh, C.H. Derivation and validation of different machine-learning models in mortality prediction of trauma in motorcycle riders: A cross-sectional retrospective study in southern Taiwan. BMJ Open. 2018, 8, e018252. [Google Scholar] [CrossRef] [PubMed]
- Kalisvaart, M.; Schlegel, A.; Umbro, I.; de Haan, J.E.; Scalera, I.; Polak, W.G.; IJzermans, J.N.M.; Mirza, D.F.; Perera, M.T.P.R.; Isaac, J.I.; et al. The Impact of Combined Warm Ischemia Time on Development of Acute Kidney Injury in Donation After Circulatory Death Liver Transplantation: Stay Within the Golden Hour. Transplantation 2018, 102, 783–793. [Google Scholar] [CrossRef] [PubMed]
- Rudnick, M.R.; Marchi, L.D.; Plotkin, J.S. Hemodynamic monitoring during liver transplantation: A state of the art review. World J. Hepatol. 2015, 7, 1302–1311. [Google Scholar] [CrossRef] [PubMed]
- Mayer, K.; Trzeciak, S.; Puri, N.K. Assessment of the adequacy of oxygen delivery. Curr. Opin. Crit. Care 2016, 22, 437–443. [Google Scholar] [CrossRef] [PubMed]
- Adelmann, D.; Kronish, K.; Ramsay, M.A. Anesthesia for Liver Transplantation. Anesthesiol. Clin. 2017, 35, 491–508. [Google Scholar] [CrossRef] [PubMed]


| Training Dataset (n = 848) | Testing Dataset (n = 363) | p-Value | |
|---|---|---|---|
| AKI defined by AKIN criteria (n) | 254 (30%) | 111 (31%) | 0.882 |
| AKI AKIN stage (n) | |||
| No AKI | 594 (70%) | 252 (69%) | 0.846 |
| Stage 1 AKI | 198 (23%) | 91 (25%) | |
| Stage 2 AKI | 42 (5%) | 15 (4%) | |
| Stage 3 AKI | 14 (2%) | 5 (1%) | |
| Demographic data | |||
| Age, recipient (years) | 54.0 (48.0–60.0) | 53.0 (48.0–60.0) | 0.747 |
| Gender (female) | 224 (26%) | 116 (32%) | 0.058 |
| Body mass index (kg/m2) | 23.1 (20.9–25.3) | 23.1 (21.4–25.3) | 0.466 |
| Surgery type | |||
| Deceased donor (n) | 265 (31%) | 105 (29%) | 0.461 |
| ABO incompatibility (n) | 26 (3%) | 14 (4%) | 0.596 |
| Medical history | |||
| Hypertension (n) | 92 (11%) | 38 (10%) | 0.924 |
| Diabetes mellitus (n) | 125 (15%) | 53 (15%) | 0.980 |
| Ischemic heart disease (n) | 17 (2%) | 4 (1%) | 0.388 |
| Chronic kidney disease (n) | 63 (7%) | 26 (7%) | 0.966 |
| Cerebrovascular accident (n) | 8 (1%) | 5 (1%) | 0.714 |
| COPD (n) | 19 (2%) | 5 (1%) | 0.446 |
| Pulmonary hypertension (n) | 10 (1%) | 7 (2%) | 0.454 |
| Prolonged QT interval (n) | 33 (4%) | 9 (2%) | 0.290 |
| Preoperative medication | |||
| Insulin (n) | 43 (5%) | 10 (3%) | 0.099 |
| Beta blocker (n) | 37 (4%) | 18 (5%) | 0.760 |
| Diuretics (n) | 26 (3%) | 22 (6%) | 0.022 |
| Cause of liver transplantation | |||
| Hepatitis B (n) | 355 (42%) | 137 (38%) | 0.203 |
| Hepatocellular carcinoma (n) | 383 (45%) | 178 (49%) | 0.240 |
| Alcoholic liver cirrhosis (n) | 85 (10%) | 40 (11%) | 0.675 |
| Hepatitis C (n) | 61 (7%) | 30 (8%) | 0.597 |
| Hepatitis A (n) | 4 (0%) | 2 (1%) | 1.000 |
| Acute hepatic failure (n) | 54 (6%) | 22 (6%) | 0.942 |
| Cholestatic liver cirrhosis (n) | 21 (2%) | 7 (2%) | 0.709 |
| Metabolic cause (n) | 4 (0%) | 4 (1%) | 0.250 |
| Preoperative status | |||
| MELD score | 15 (12–22) | 15 (12–22) | 0.635 |
| Child–Turcotte–Pugh score | 8 (6–10) | 8 (6–10) | 0.979 |
| Child–Turcotte–Pugh class | |||
| Class 1 | 253 (30%) | 98 (27%) | 0.571 |
| Class 2 | 331 (39%) | 144 (40%) | |
| Class 3 | 264 (31%) | 121 (33%) | |
| Hepato-renal syndrome (n) | 138 (16%) | 44 (12%) | 0.078 |
| Pleural effusion (n) | 55 (6%) | 30 (8%) | 0.324 |
| Spontaneous bacterial peritonitis (n) | 46 (5%) | 30 (8%) | 0.082 |
| Esophageal variceal ligation (n) | 181 (21%) | 90 (25%) | 0.213 |
| Hepatic encephalopathy (n) | 109 (13%) | 46 (13%) | 0.994 |
| Trans-arterial chemoembolization (n) | 200 (24%) | 79 (22%) | 0.538 |
| Portal hypertension (n) | 44 (5%) | 26 (7%) | 0.225 |
| Previous operation history (n) | 368 (43%) | 158 (44%) | 0.983 |
| Preoperative measurements | |||
| LVEF (%) | 65 (62–68) | 65 (62–69) | 0.645 |
| Hemoglobin (g/dL) | 10.9 (9.2–12.6) | 10.7 (9.35–12.3) | 0.599 |
| Albumin (g/dL) | 3.0 (2.5–3.5) | 3.0 (2.6–3.4) | 0.593 |
| Creatinine (mg/dL) | 0.90 (0.74–1.17) | 0.90 (0.73–1.10) | 0.485 |
| Platelet (109/L) | 64 (47–95) | 64 (45–89) | 0.233 |
| Na+ (mEq/L) | 137 (132–140) | 137 (132–140) | 0.771 |
| K+ (mEq/L) | 4.1 (3.8–4.4) | 4.1 (3.8–4.5) | 0.324 |
| Glucose (mg/dL) | 103 (89–133) | 103 (90–131) | 0.766 |
| Surgery and anesthesia details | |||
| Operation time (h) | 6.83 (5.78–7.92) | 6.75 (5.65–8.0) | 0.348 |
| Anesthesia time (h) | 7.92 (6.92–9.0) | 7.92 (6.67–9.0) | 0.376 |
| Cold ischemic time (min) | 86 (67–240) | 86 (66–230) | 0.460 |
| Warm ischemic time (min) | 30 (28–35) | 30 (26–35) | 0.227 |
| GRWR < 0.8 (n) | 45 (5%) | 16 (4%) | 0.609 |
| Ascites removal (mL) | 0 (0–2000) | 0 (0–2000) | 0.490 |
| Use of Intraoperative CRRT | 26 (3%) | 9 (2%) | 0.711 |
| Use of Intraoperative venovenous bypass | 20 (2%) | 4 (1%) | 0.225 |
| Estimated blood loss (mL) | 3000 (1550–6150) | 2930 (1500–6000) | 0.867 |
| Urine output (mL/kg/h) | 0.93 (0.58–1.55) | 0.91 (0.51–1.60) | 0.694 |
| Intraoperative fluid management | |||
| Crystalloid (L) | 3.5 (2.45–5.2) | 3.6 (2.6–5.3) | 0.404 |
| Colloid (mL) | 0 (0–500) | 0 (0–500) | 0.915 |
| Albumin (mL) | 300 (100–400) | 300 (100–400) | 0.948 |
| Intraoperative transfusion | |||
| Red blood cell transfusion (unit) | 6.0 (2.0–12.0) | 6.0 (2.0–12.0) | 0.854 |
| Fresh frozen plasma transfusion (unit) | 6.0 (1.0–12.0) | 6.0 (0.0–12.0) | 0.634 |
| Platelet transfusion (unit) | 0.0 (0.0–6.0) | 0.0 (0.0–6.0) | 0.705 |
| Cryoprecipitate transfusion (unit) | 0.0 (0.0–0.0) | 0.0 (0.0–0.0) | 0.287 |
| Intraoperative drugs | |||
| Dose of epinephrine, bolus (ug) | 6.5 (0.0–20.0) | 10.0 (0.0–25.0) | 0.127 |
| Dose of furosemide, bolus (mg) | 0.0 (0.0–5.0) | 0.0 (0.0–5.0) | 0.965 |
| Use of dopamine, continuous (n) | 160 (19%) | 55 (15%) | 0.142 |
| Use of epinephrine, continuous (n) | 23 (3%) | 2 (1%) | 0.028 * |
| Use of norepinephrine, continuous (n) | 38 (4%) | 14 (4%) | 0.737 |
| Intraoperative measurements | |||
| Mean SvO2 (%) | 89 (87–90) | 89 (87–90) | 0.981 |
| Mean CVP (mmHg) | 6 (5–8) | 7 (5–8) | 0.913 |
| Mean femoral ABP (mmHg) | 69 (62–75) | 69 (62–75) | 0.790 |
| Mean cardiac index (L/min/m2) | 4.24 (3.86–4.86) | 4.24 (3.84–4.77) | 0.418 |
| Mean hemoglobin (g/dL) | 9.3 (8.4–10.6) | 9.3 (8.2–10.3) | 0.110 |
| Mean blood glucose (mg/dL) | 162 (145–179) | 162 (143–181) | 0.973 |
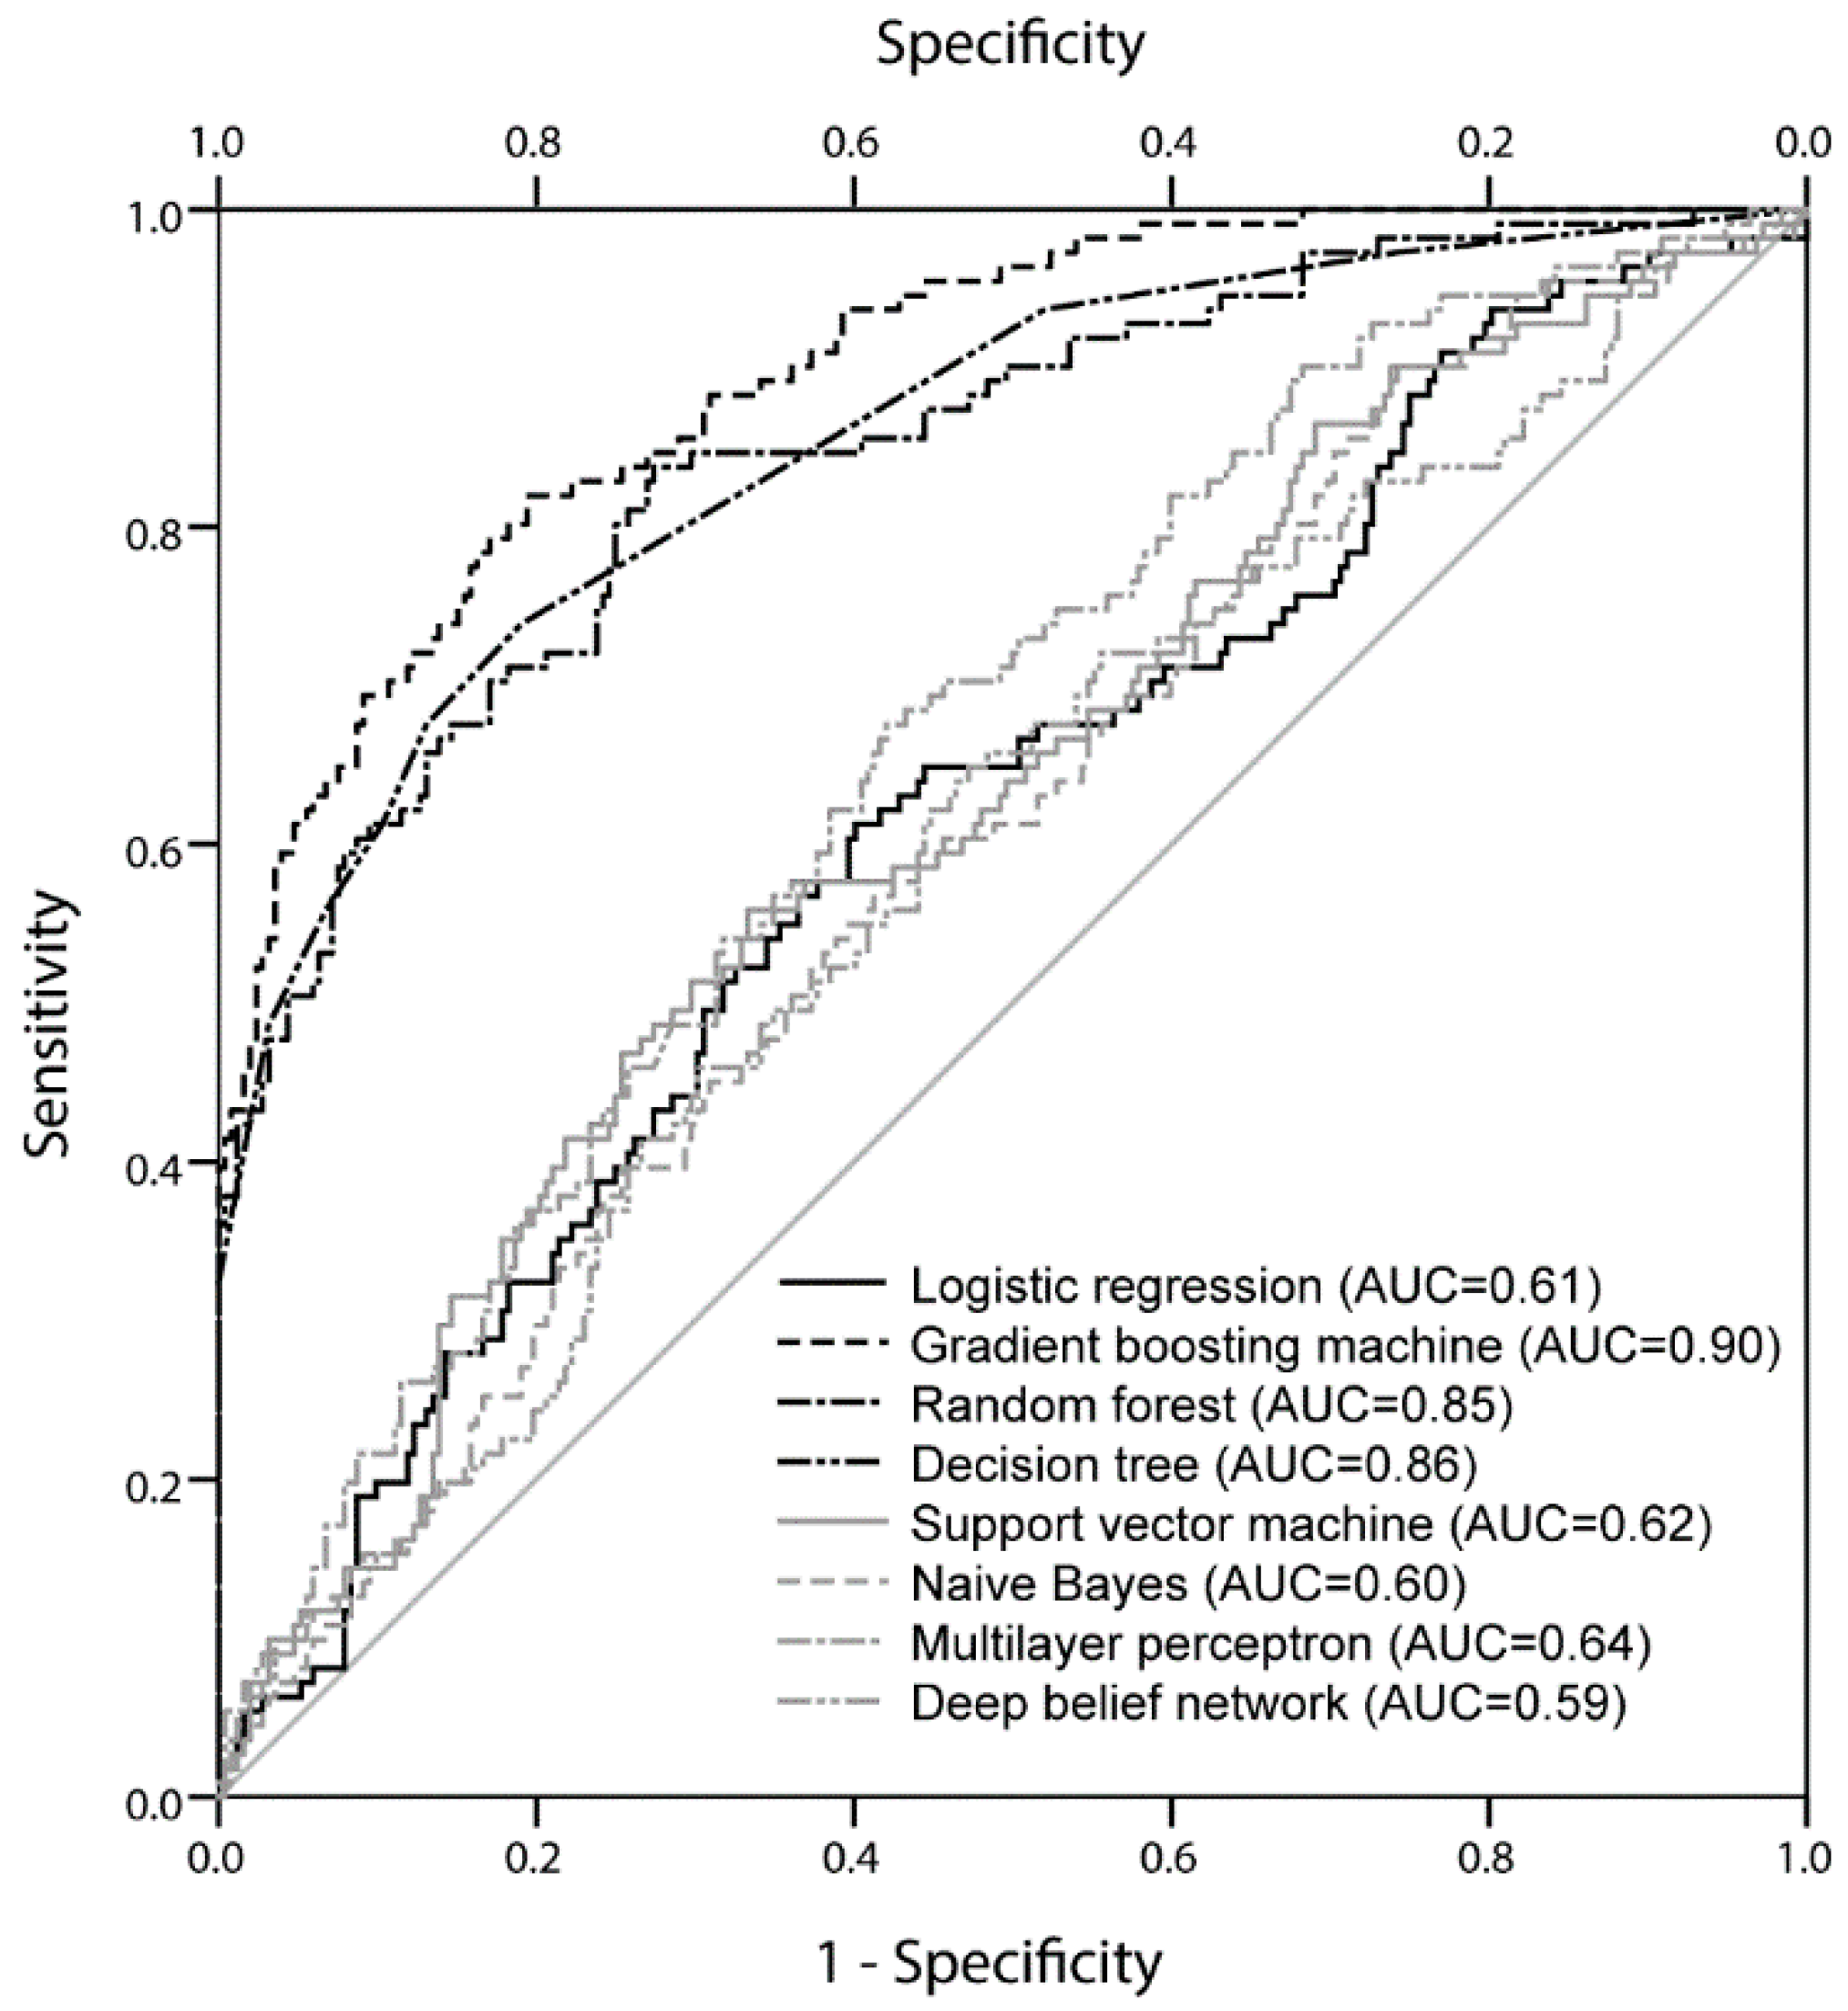
| Optimal Hyperparameter | AUROC (95% CI) | Accuracy | p-Value | |
|---|---|---|---|---|
| Logistic regression (LR) | 0.61 (0.56–0.66) | 0.68 | <0.001 vs. GBM <0.001 vs. RF <0.001 vs. DT 0.670 vs. SVM 0.608 vs. NB 0.239 vs. MLP 0.414 vs. DBN | |
| Gradient boosting machine (GBM) | Maximum depth = 5 Number of estimators = 100, gamma = 0.4 | 0.90 (0.86–0.93) | 0.84 | 0.001 vs. RF 0.033 vs. DT <0.011 vs. SVM <0.001 vs. NB <0.001 vs. MLP <0.001 vs. DBN |
| Random forest (RF) | Maximum depth = 5 Number of estimators = 150 | 0.85 (0.81–0.89) | 0.80 | 0.918 vs. DT <0.001 vs. SVM <0.001 vs. NB <0.001 vs. MLP <0.001 vs. DBN |
| Decision tree (DT) | Maximum depth = 5 Criterion = Gini index | 0.86 (0.81–0.89) | 0.81 | <0.001 vs. SVM <0.001 vs. NB <0.001 vs. MLP <0.001 vs. DBN |
| Support vector machine (SVM) | Kernel = radial basis C = 1.0 Log(gamma) = −3 | 0.62 (0.57–0.67) | 0.69 | 0.287 vs. NB 0.300 vs. MLP 0.084 vs. DBN |
| Naive Bayes (NB) | Model = Gaussian | 0.60 (0.54–0.65) | 0.64 | 0.088 vs. MLP 0.701 vs. DBN |
| Multilayer perceptron (MLP) | Number of hidden layers = 2 Number of nodes in a layer = 8 | 0.64 (0.59–0.69) | 0.66 | 0.016 vs. DBN |
| Deep belief network (DBN) | Number of hidden layers = 2 Number of nodes in a layer = 8 | 0.59 (0.53–0.64) | 0.65 |
| Variable | Beta-Coefficient | Odds Ratio | 95% CI | p-Value |
|---|---|---|---|---|
| Child–Turcotte–Pugh score | 0.067 | 1.069 | 0.999–1.144 | 0.055 |
| GRWR less than 0.8 | 0.669 | 1.952 | 1.021–3.733 | 0.043 |
| Operation time (per hour) | 0.384 | 1.472 | 1.008–2.149 | 0.045 |
| Cold ischemic time (per 30 min) | 0.147 | 1.159 | 1.092–1.230 | <0.001 |
| Transfusion of red blood cells (per 1 unit) | 0.017 | 1.017 | 1.002–1.031 | 0.022 |
| Intraoperative colloid administration (per 500 mL) | 0.269 | 1.309 | 1.119–1.531 | 0.001 |
| Intraoperative urine output (mL/kg/h) | −0.156 | 0.856 | 0.730–1.003 | 0.054 |
| Intraoperative mean SvO2 decrease (per 10%) | 0.311 | 1.285 | 1.099–1.501 | 0.002 |
| Intraoperative mean blood glucose level (per 1 mg/dL) | 0.081 | 1.085 | 1.029–1.144 | 0.003 |
© 2018 by the authors. Licensee MDPI, Basel, Switzerland. This article is an open access article distributed under the terms and conditions of the Creative Commons Attribution (CC BY) license (http://creativecommons.org/licenses/by/4.0/).
Share and Cite
Lee, H.-C.; Yoon, S.B.; Yang, S.-M.; Kim, W.H.; Ryu, H.-G.; Jung, C.-W.; Suh, K.-S.; Lee, K.H. Prediction of Acute Kidney Injury after Liver Transplantation: Machine Learning Approaches vs. Logistic Regression Model. J. Clin. Med. 2018, 7, 428. https://doi.org/10.3390/jcm7110428
Lee H-C, Yoon SB, Yang S-M, Kim WH, Ryu H-G, Jung C-W, Suh K-S, Lee KH. Prediction of Acute Kidney Injury after Liver Transplantation: Machine Learning Approaches vs. Logistic Regression Model. Journal of Clinical Medicine. 2018; 7(11):428. https://doi.org/10.3390/jcm7110428
Chicago/Turabian StyleLee, Hyung-Chul, Soo Bin Yoon, Seong-Mi Yang, Won Ho Kim, Ho-Geol Ryu, Chul-Woo Jung, Kyung-Suk Suh, and Kook Hyun Lee. 2018. "Prediction of Acute Kidney Injury after Liver Transplantation: Machine Learning Approaches vs. Logistic Regression Model" Journal of Clinical Medicine 7, no. 11: 428. https://doi.org/10.3390/jcm7110428