Diagnostic Accuracy of Fecal Calprotectin for Predicting Relapse in Inflammatory Bowel Disease: A Meta-Analysis

 , and
, and
Abstract
:1. Introduction
2. Materials and Methods
2.1. Search Strategy
2.2. Study Selection
2.3. Data Extraction and Quality Assessment
2.4. Data Synthesis and Analysis
3. Results
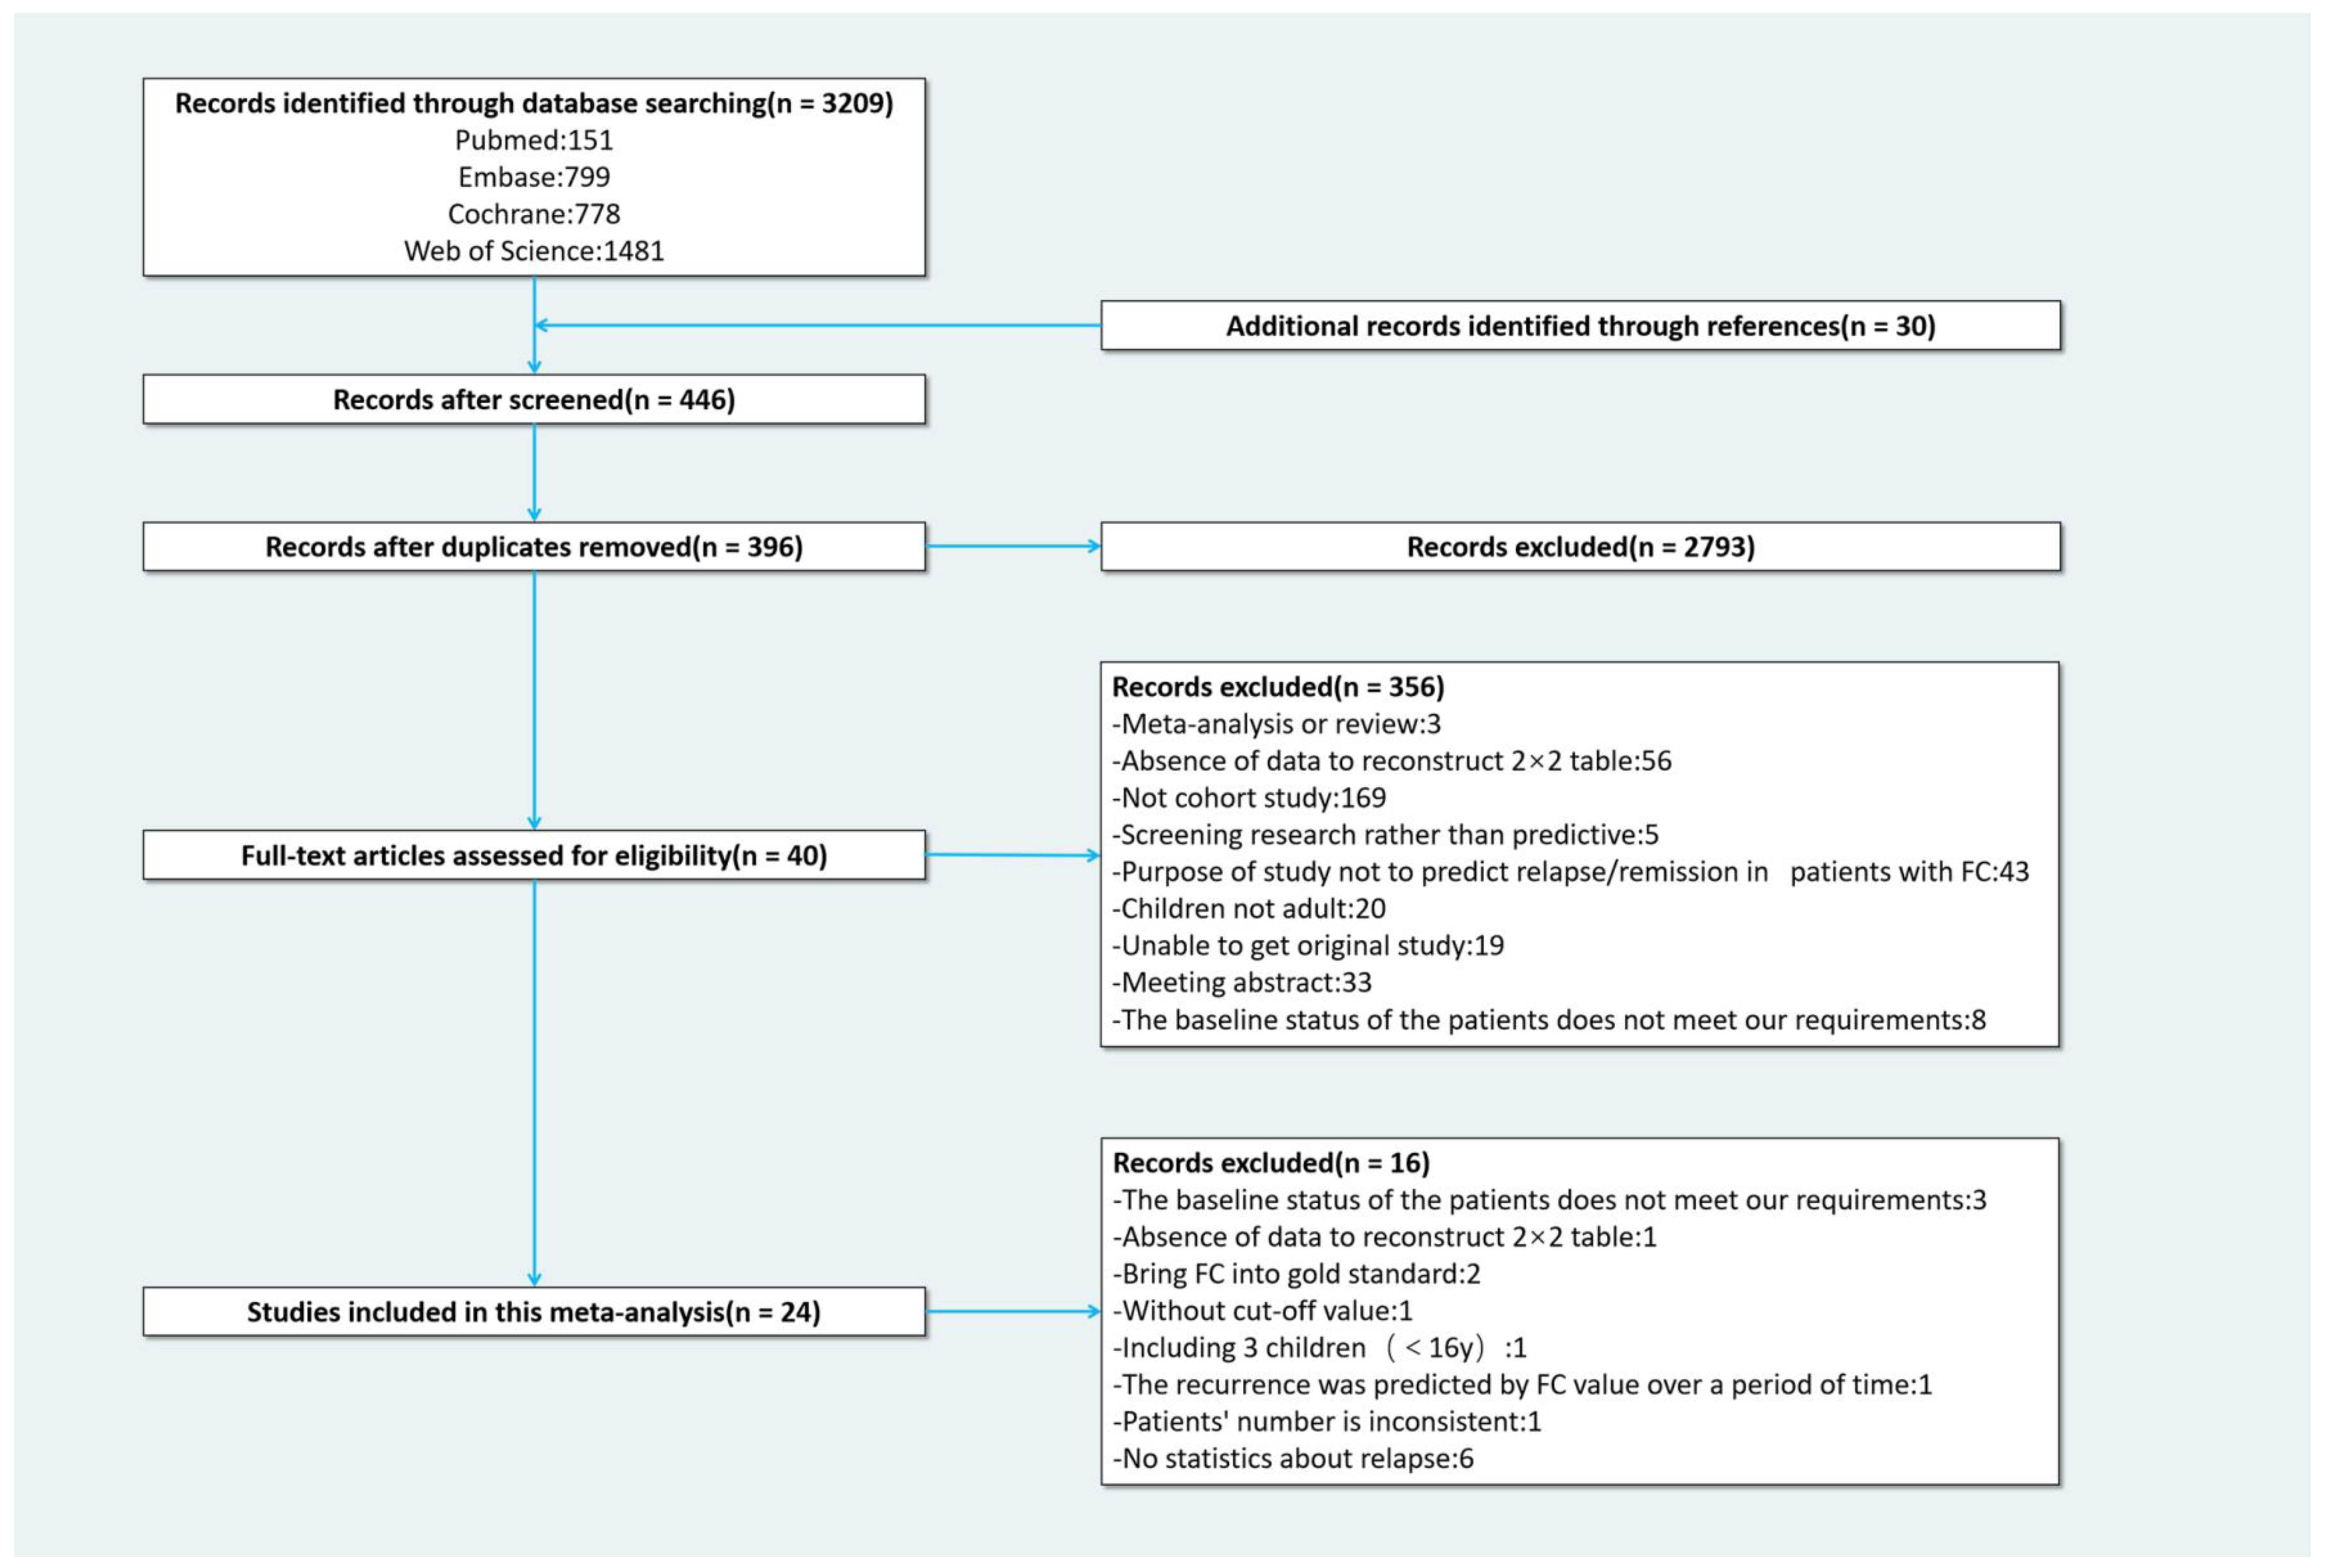
3.1. Selection, Characteristics, and Quality of Studies
3.2. Performance of FC at the Optimal Cut-Off Value
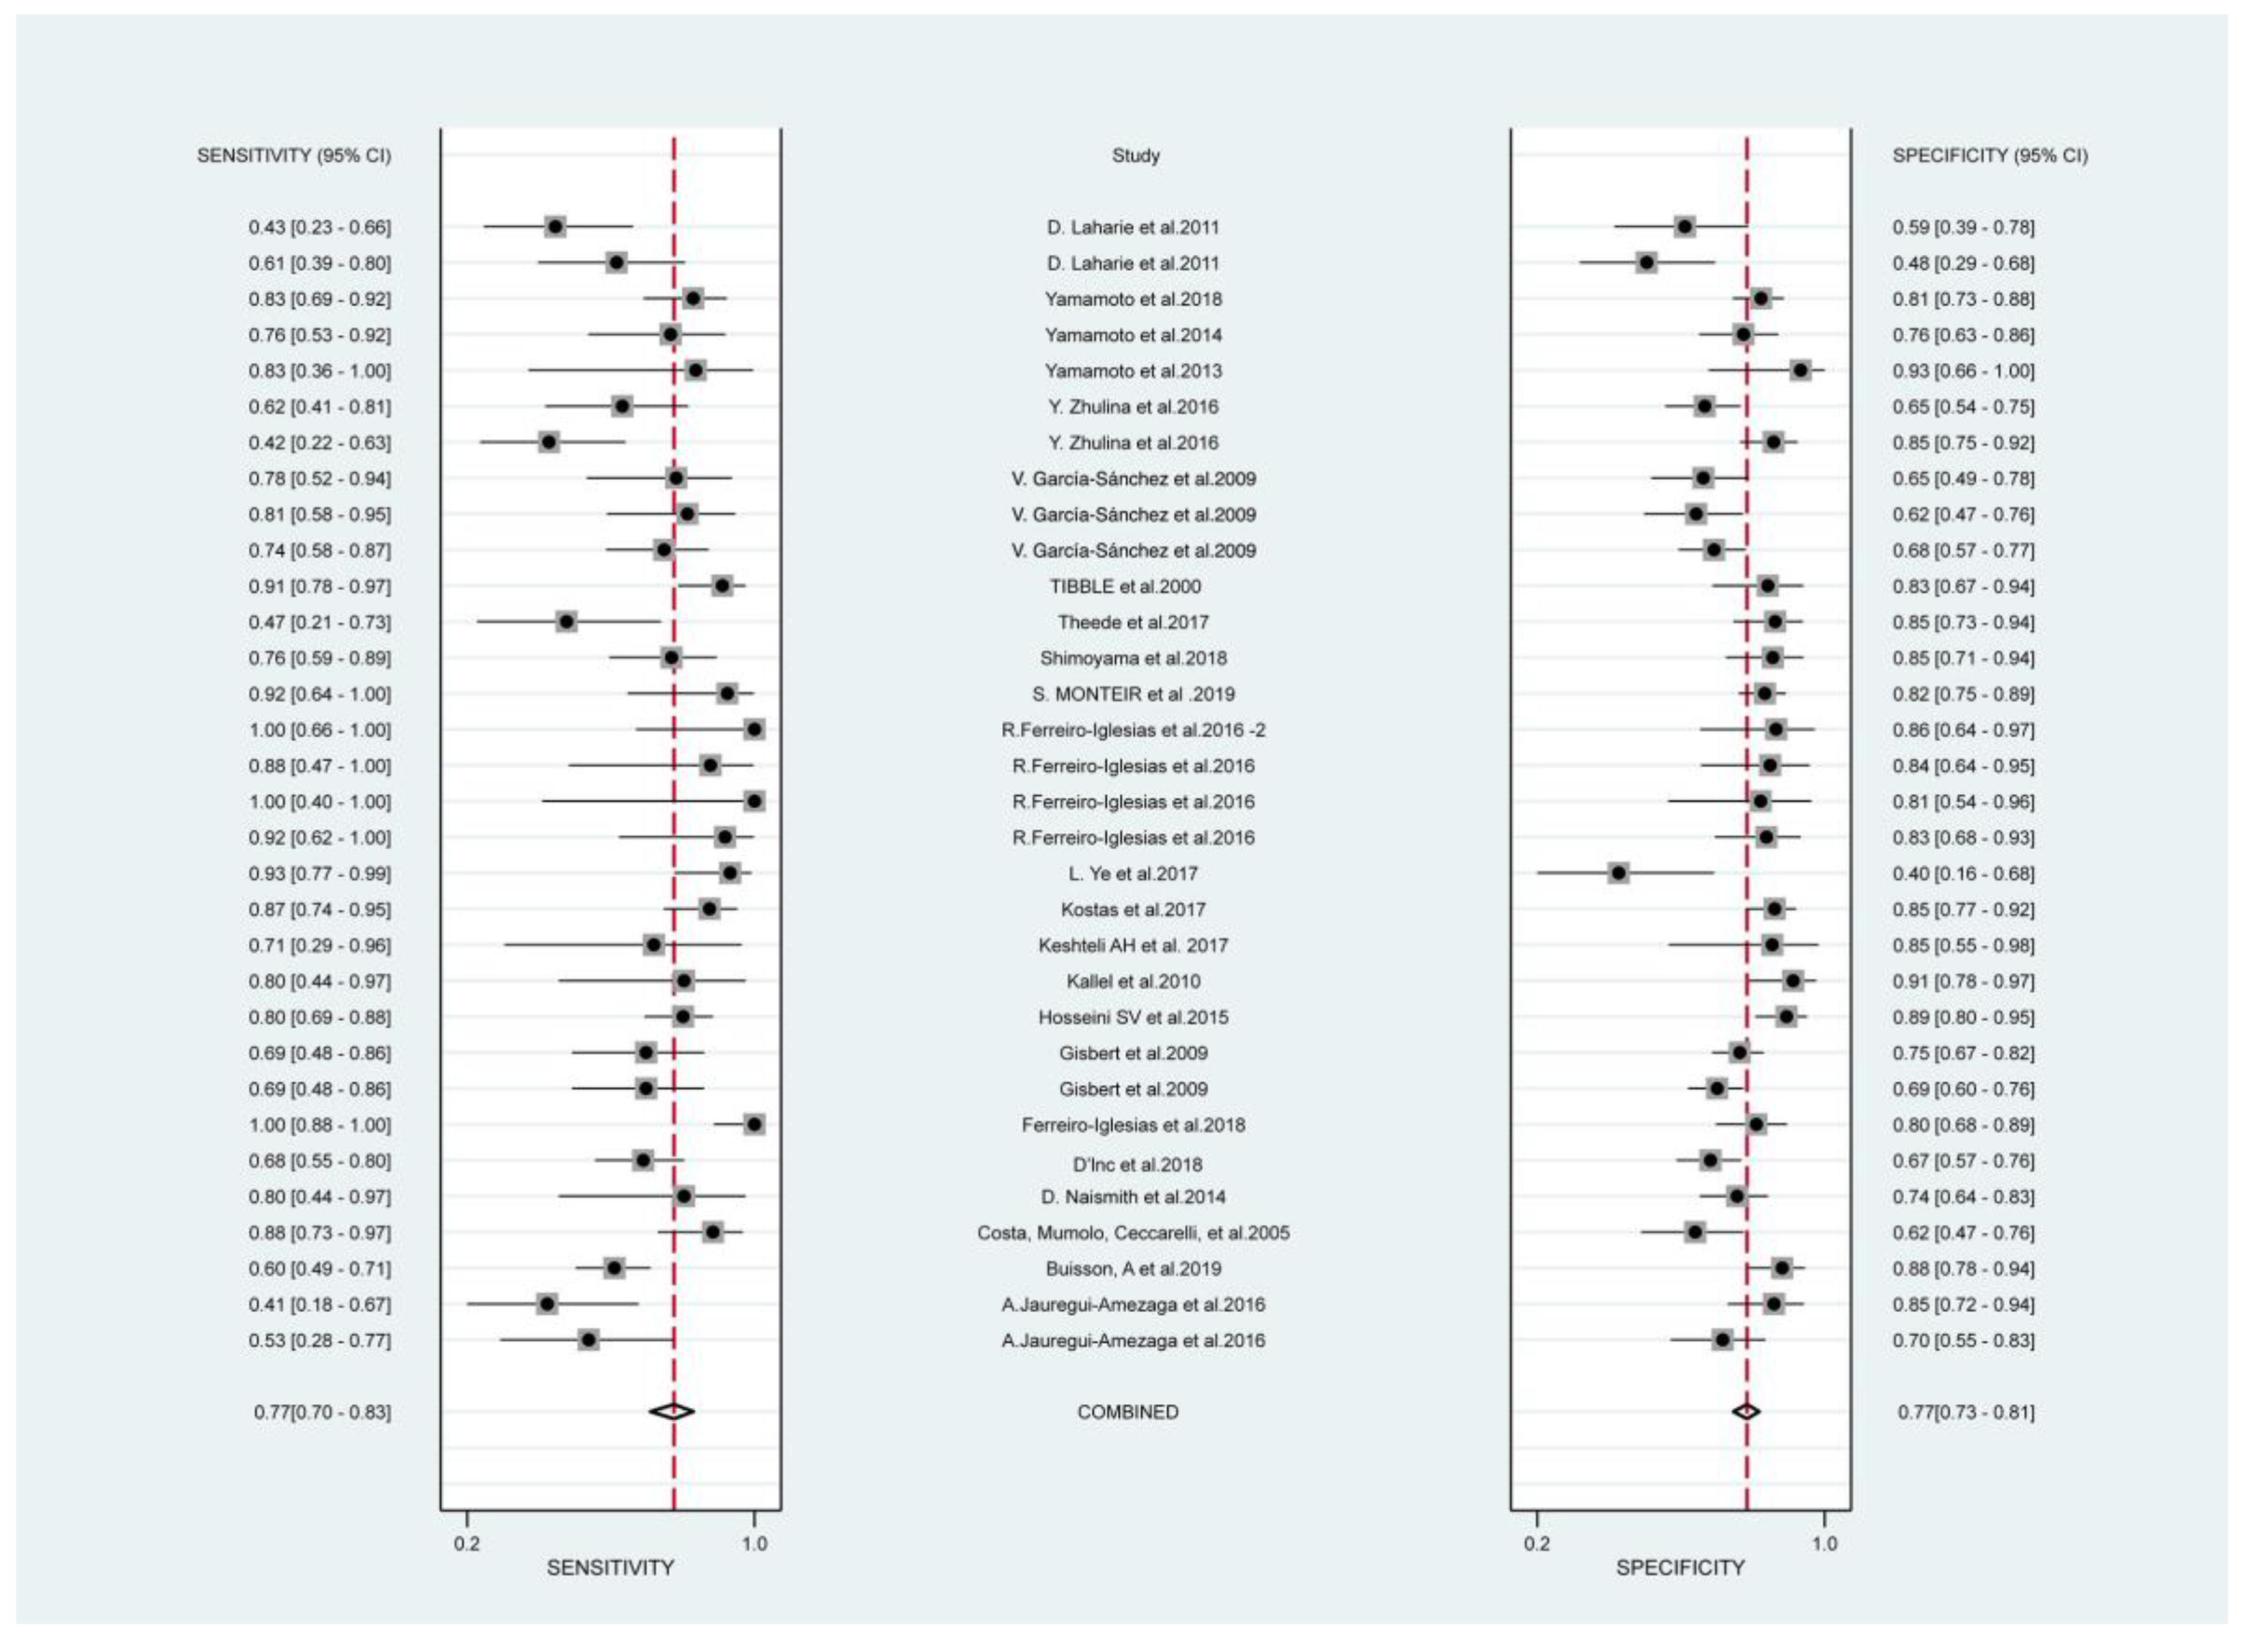
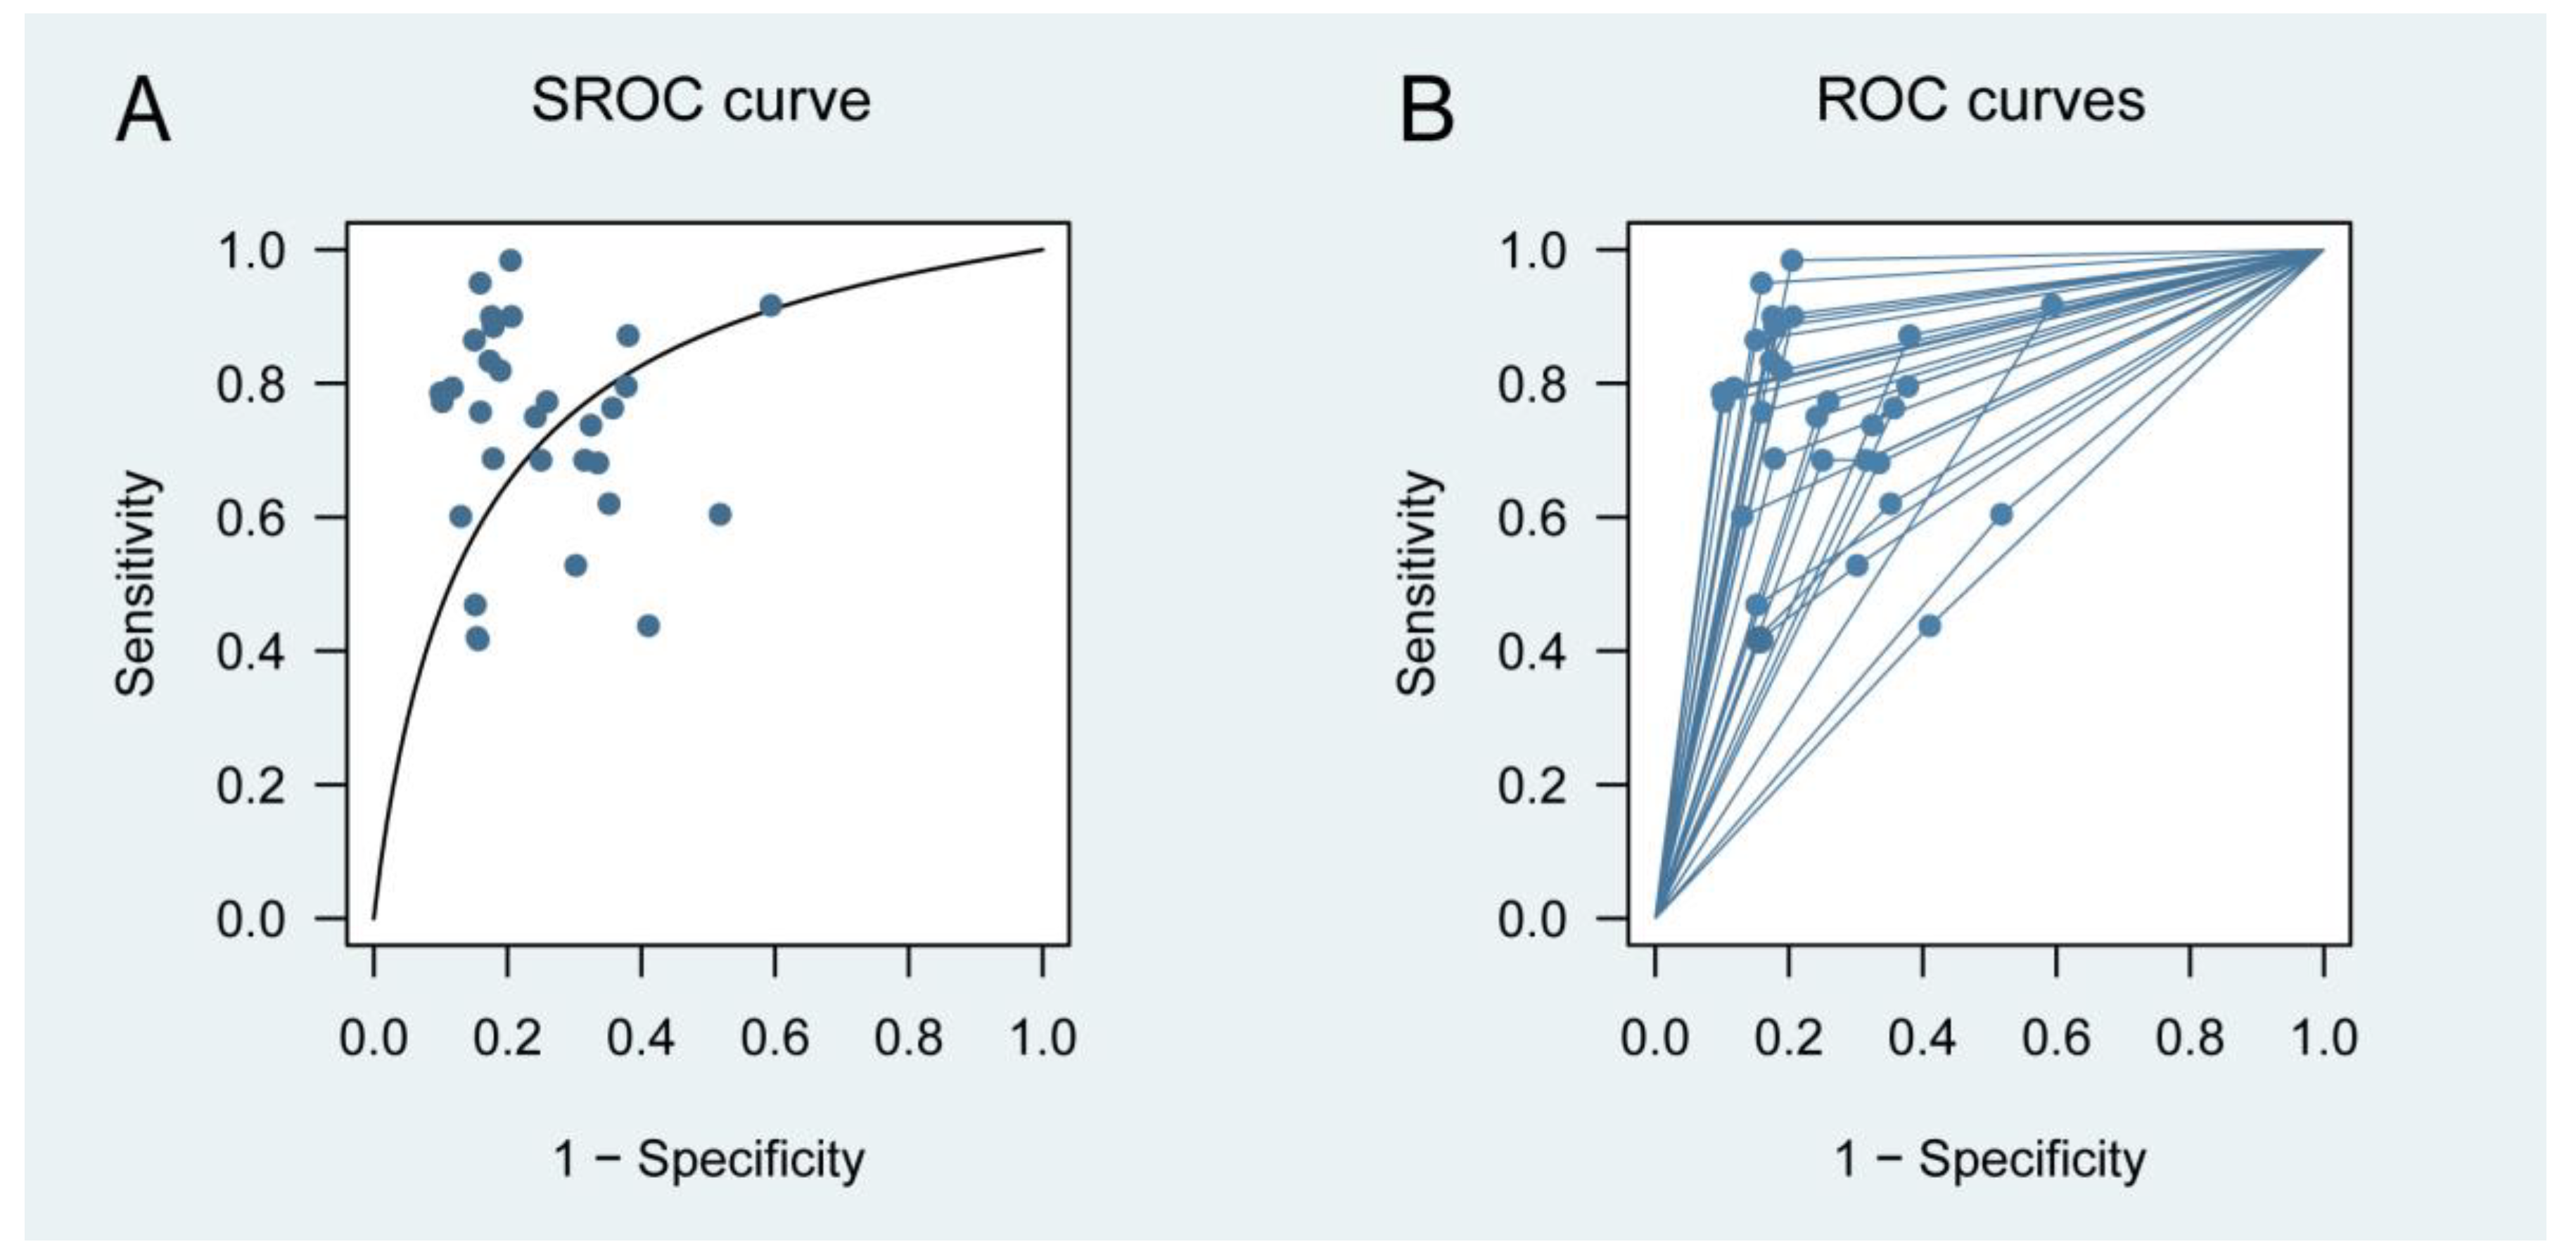
3.2.1. Primary Outcome
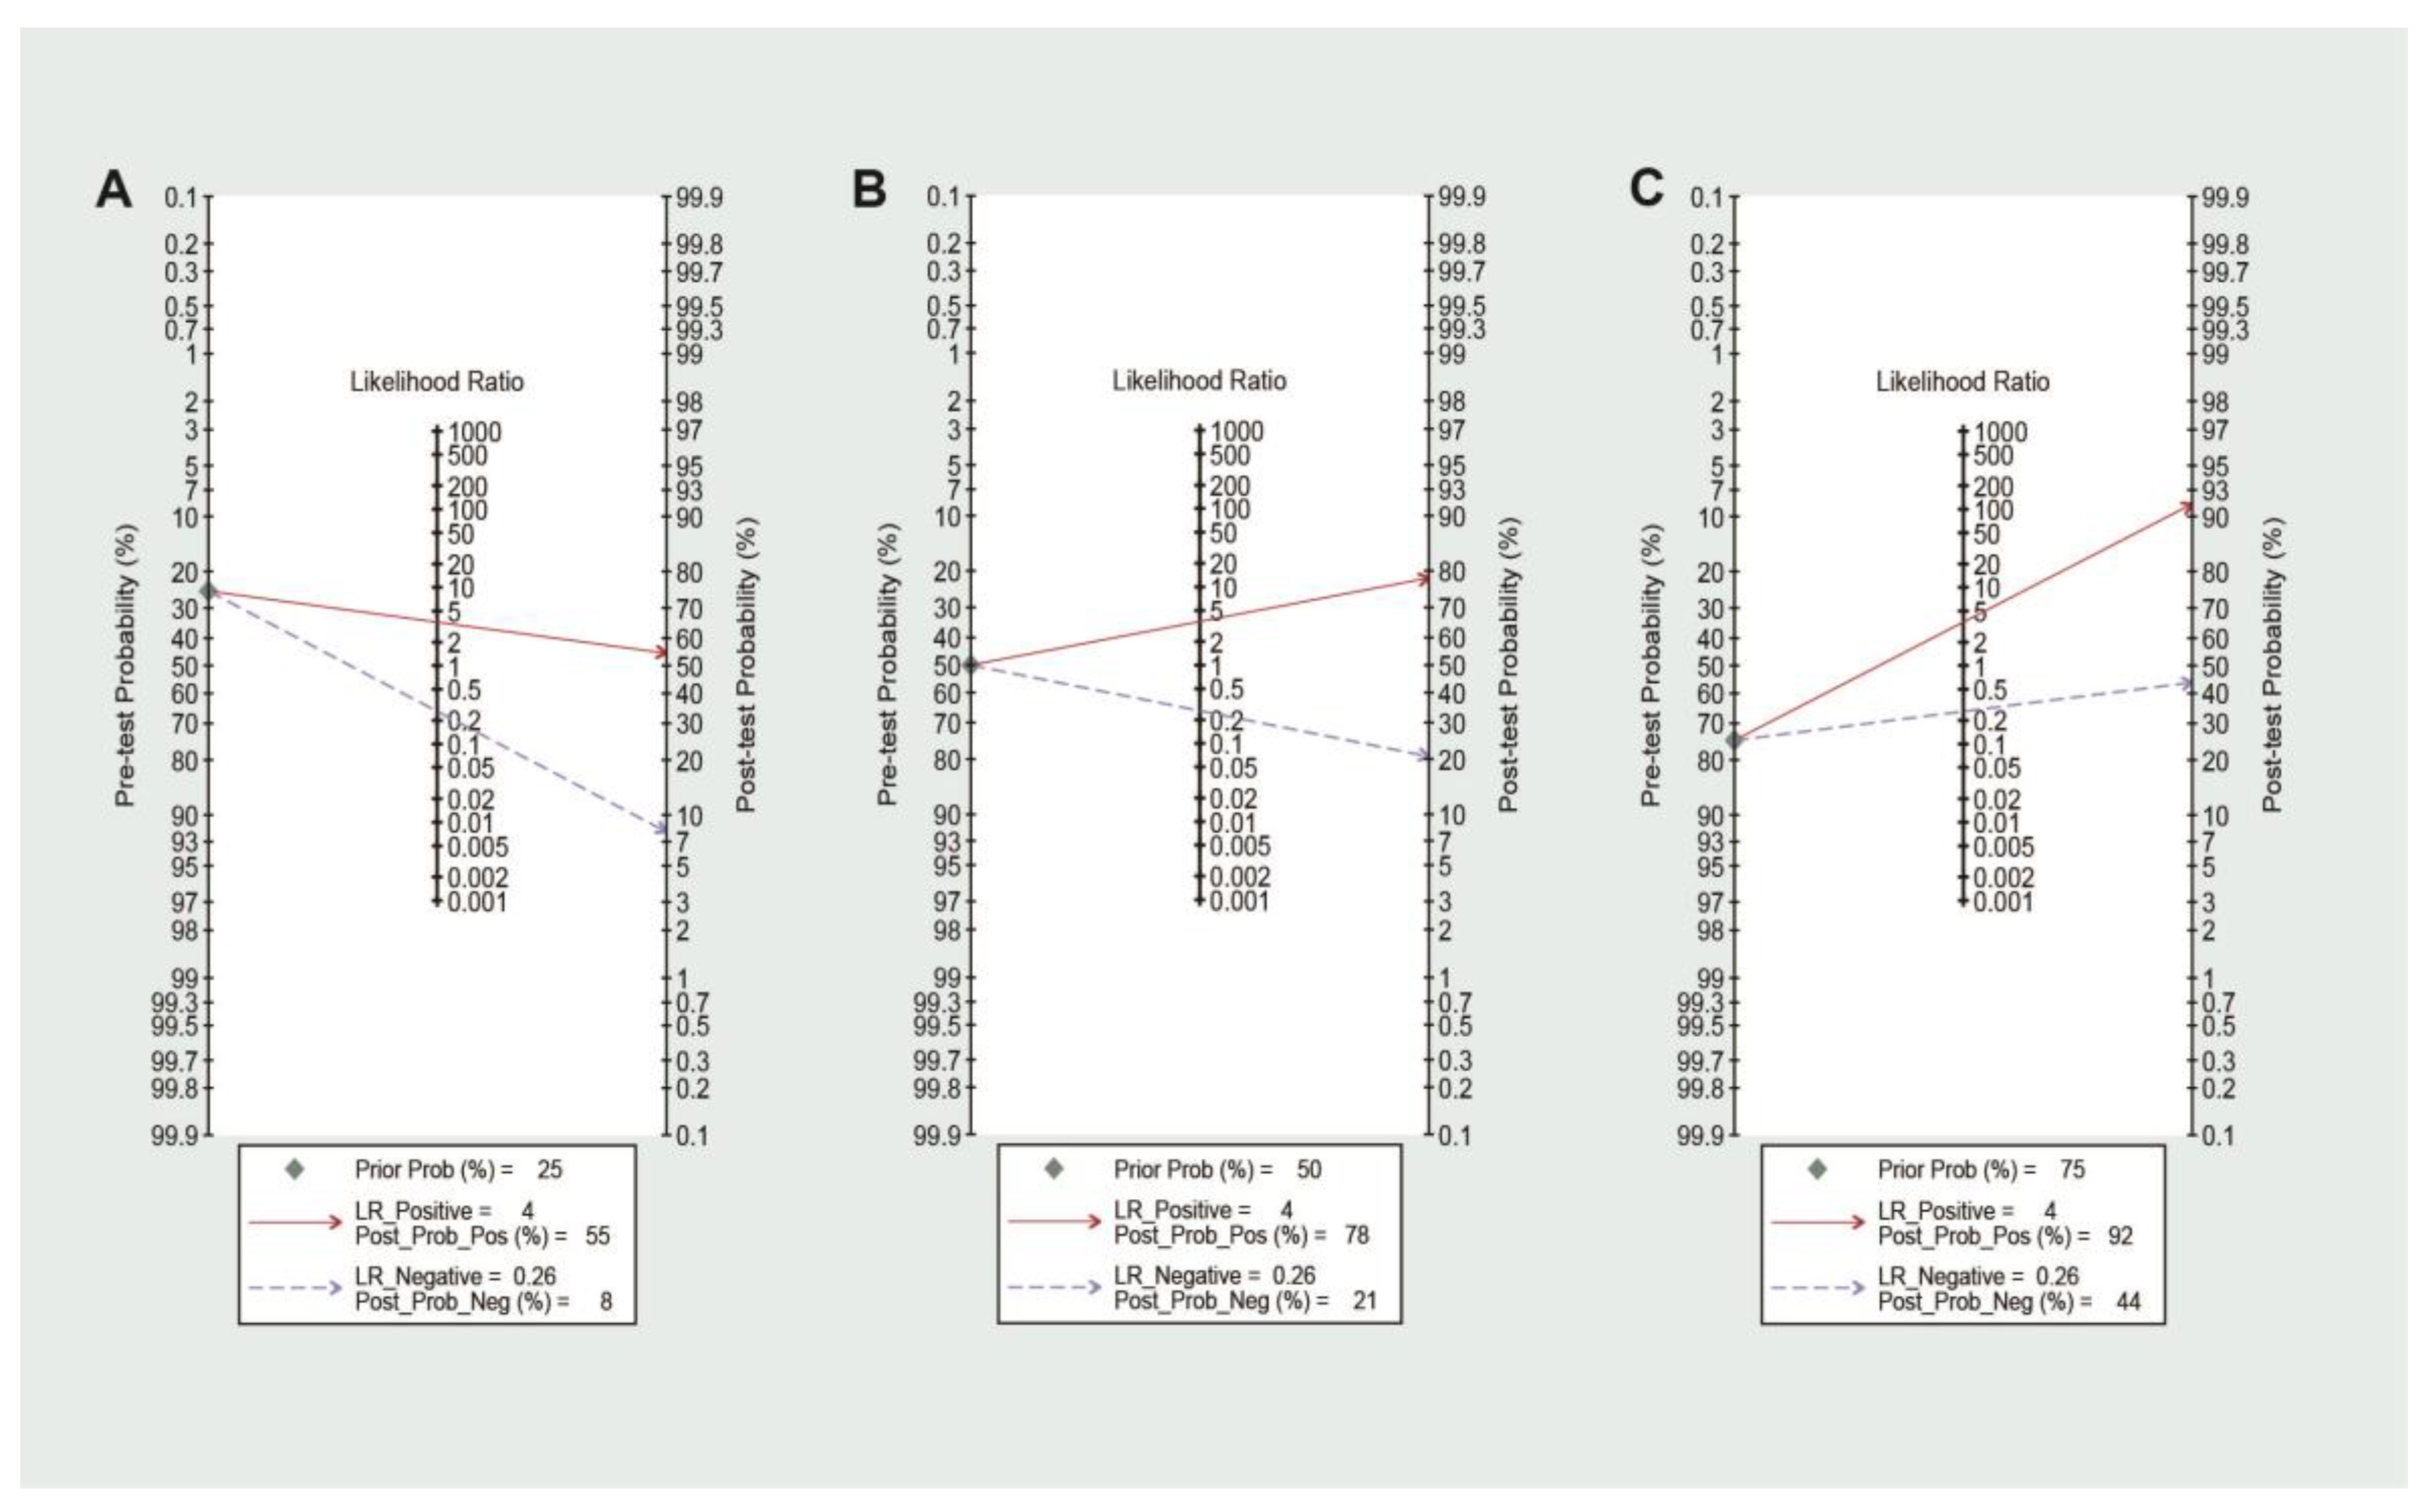
3.2.2. Post-Test Probability of Relapse
3.3. Subgroups Analysis
4. Discussion
4.1. Implications of Key Findings
4.2. Comparison with Other Reviews
4.3. Limitations of Study
5. Conclusions
Supplementary Materials
Funding
Institutional Review Board Statement
Informed Consent Statement
Data Availability Statement
Conflicts of Interest
References
- Wang, X.P.; Mao, M.J.; He, Z.L.; Zhang, L.; Chi, P.D.; Su, J.R.; Dai, S.Q.; Liu, W.L. A retrospective discussion of the prognostic value of combining prothrombin time(PT) and fibrinogen(Fbg) in patients with Hepatocellular carcinoma. J. Cancer 2017, 8, 2079–2087. [Google Scholar] [CrossRef] [PubMed]
- Ordás, I.; Eckmann, L.; Talamini, M.; Baumgart, D.C.; Sandborn, W.J. Ulcerative colitis. Lancet 2012, 380, 1606–1619. [Google Scholar] [CrossRef] [PubMed]
- Baumgart, D.C.; Sandborn, W.J. Crohn’s disease. Lancet 2012, 380, 1590–1605. [Google Scholar] [CrossRef]
- Stange, E.F.; Travis, S.P.; Vermeire, S.; Reinisch, W.; Geboes, K.; Barakauskiene, A.; Feakins, R.; Flejou, J.F.; Herfarth, H.; Hommes, D.W.; et al. European evidence-based Consensus on the diagnosis and management of ulcerative colitis: Definitions and diagnosis. J. Crohn’s Colitis 2008, 2, 1–23. [Google Scholar] [CrossRef] [PubMed]
- Annese, V.; Daperno, M.; Rutter, M.D.; Amiot, A.; Bossuyt, P.; East, J.; Ferrante, M.; Gotz, M.; Katsanos, K.H.; Kiesslich, R.; et al. European evidence based consensus for endoscopy in inflammatory bowel disease. J. Crohn’s Colitis 2013, 7, 982–1018. [Google Scholar] [CrossRef]
- Buisson, A.; Gonzalez, F.; Poullenot, F.; Nancey, S.; Sollellis, E.; Fumery, M.; Pariente, B.; Flamant, M.; Trang-Poisson, C.; Bonnaud, G.; et al. Comparative Acceptability and Perceived Clinical Utility of Monitoring Tools: A Nationwide Survey of Patients with Inflammatory Bowel Disease. Inflamm. Bowel Dis. 2017, 23, 1425–1433. [Google Scholar] [CrossRef]
- Tibble, J.A.; Sigthorsson, G.; Bridger, S.; Fagerhol, M.K.; Bjarnason, I. Surrogate markers of intestinal inflammation are predictive of relapse in patients with inflammatory bowel disease. Gastroenterology 2000, 119, 15–22. [Google Scholar] [CrossRef]
- Guo, X.; Huang, C.; Xu, J.; Xu, H.; Liu, L.; Zhao, H.; Wang, J.; Huang, W.; Peng, W.; Chen, Y.; et al. Gut Microbiota Is a Potential Biomarker in Inflammatory Bowel Disease. Front. Nutr. 2021, 8, 818902. [Google Scholar] [CrossRef]
- Caviglia, G.P.; Ribaldone, D.G.; Rosso, C.; Saracco, G.M.; Astegiano, M.; Pellicano, R. Fecal calprotectin: Beyond intestinal organic diseases. Panminerva Med. 2018, 60, 29–34. [Google Scholar] [CrossRef]
- Hurnakova, J.; Zavada, J.; Hanova, P.; Hulejova, H.; Klein, M.; Mann, H.; Sleglova, O.; Olejarova, M.; Forejtova, S.; Ruzickova, O.; et al. Serum calprotectin (S100A8/9): An independent predictor of ultrasound synovitis in patients with rheumatoid arthritis. Arthritis Res. Ther. 2015, 17, 252. [Google Scholar] [CrossRef] [Green Version]
- Wakeman, C.A.; Moore, J.L.; Noto, M.J.; Zhang, Y.; Singleton, M.D.; Prentice, B.M.; Gilston, B.A.; Doster, R.S.; Gaddy, J.A.; Chazin, W.J.; et al. The innate immune protein calprotectin promotes Pseudomonas aeruginosa and Staphylococcus aureus interaction. Nat. Commun. 2016, 7, 11951. [Google Scholar] [CrossRef] [PubMed]
- Radin, J.N.; Kelliher, J.L.; Parraga Solorzano, P.K.; Kehl-Fie, T.E. The Two-Component System ArlRS and Alterations in Metabolism Enable Staphylococcus aureus to Resist Calprotectin-Induced Manganese Starvation. PLoS Pathog. 2016, 12, e1006040. [Google Scholar] [CrossRef] [PubMed]
- Laserna-Mendieta, E.J.; Lucendo, A.J. Faecal calprotectin in inflammatory bowel diseases: A review focused on meta-analyses and routine usage limitations. Clin. Chem. Lab. Med. 2019, 57, 1295–1307. [Google Scholar]
- Chen, F.; Hu, Y.; Fan, Y.H.; Lv, B. Clinical Value of Fecal Calprotectin in Predicting Mucosal Healing in Patients With Ulcerative Colitis. Front. Med. 2021, 8, 679264. [Google Scholar] [CrossRef]
- Whiting, P.; Rutjes, A.; Westwood, M.; Mallett, S.; Deeks, J.; Reitsma, J.; Leeflang, M.; Sterne, J.; Bossuyt, P.; QUADAS-2 Group. QUADAS-2: A revised tool for the quality assessment of diagnostic accuracy studies. Ann. Intern. Med. 2011, 155, 529–536. [Google Scholar] [CrossRef]
- Steinhauser, S.; Schumacher, M.; Rücker, G. Modelling multiple thresholds in meta-analysis of diagnostic test accuracy studies. BMC Med. Res. Methodol. 2016, 16, 97. [Google Scholar] [CrossRef]
- Rupprecht, T.A.; Manz, K.M.; Fingerle, V.; Lechner, C.; Klein, M.; Pfirrmann, M.; Koedel, U. Diagnostic value of cerebrospinal fluid CXCL13 for acute Lyme neuroborreliosis. A systematic review and meta-analysis. Clin. Microbiol. Infect. 2018, 24, 1234–1240. [Google Scholar] [CrossRef]
- Hellmich, M.; Lehmacher, W. A ruler for interpreting diagnostic test results. Methods Inf. Med. 2005, 44, 124–126. [Google Scholar] [PubMed]
- Schneider, A.; Linde, K.; Reitsma, J.; Steinhauser, S.; Rücker, G. A novel statistical model for analyzing data of a systematic review generates optimal cut-off values for fractional exhaled nitric oxide for asthma diagnosis. J. Clin. Epidemiol. 2017, 92, 69–78. [Google Scholar] [CrossRef]
- Bürkner, P.; Doebler, P. Testing for publication bias in diagnostic meta-analysis: A simulation study. Stat. Med. 2014, 33, 3061–3077. [Google Scholar] [CrossRef]
- Macaskill, P.; Gatsoni, C.; Deeks, J.; Harbord, R.; Takwoingi, Y. Cochrane Handbook for Systematic Reviews of Diagnostic Test Accuracy, Version 1.0; The Cochrane Collaboration: London, UK, 2010. [Google Scholar]
- Koziarz, A.; Sne, N.; Kegel, F.; Nath, S.; Badhiwala, J.H.; Nassiri, F.; Mansouri, A.; Yang, K.; Zhou, Q.; Rice, T.; et al. Bedside Optic Nerve Ultrasonography for Diagnosing Increased Intracranial Pressure: A Systematic Review and Meta-analysis. Ann. Intern. Med. 2019, 171, 896–905. [Google Scholar] [CrossRef] [PubMed]
- Zamora, J.; Abraira, V.; Muriel, A.; Khan, K.; Coomarasamy, A. Meta-DiSc: A software for meta-analysis of test accuracy data. BMC Med. Res. Methodol. 2006, 6, 31. [Google Scholar] [CrossRef] [PubMed]
- Boschetti, G.; Garnero, P.; Moussata, D.; Cuerq, C.; Préaudat, C.; Duclaux-Loras, R.; Mialon, A.; Drai, J.; Flourié, B.; Nancey, S.; et al. Accuracies of serum and fecal S100 proteins (calprotectin and calgranulin C) to predict the response to TNF antagonists in patients with Crohn’s disease. Inflamm. Bowel Dis. 2015, 21, 331–336. [Google Scholar] [CrossRef] [PubMed]
- Lasson, A.; Simrén, M.; Stotzer, P.O.; Isaksson, S.; Ohman, L.; Strid, H. Fecal calprotectin levels predict the clinical course in patients with new onset of ulcerative colitis. Inflamm. Bowel Dis. 2013, 19, 576–581. [Google Scholar] [CrossRef]
- Yamamoto, T.; Shimoyama, T.; Matsumoto, K. Consecutive monitoring of faecal calprotectin during mesalazine suppository therapy for active rectal inflammation in ulcerative colitis. Aliment. Pharmacol. Ther. 2015, 42, 549–558. [Google Scholar] [CrossRef]
- Brooks, A.J.; Sebastian, S.; Cross, S.S.; Robinson, K.; Warren, L.; Wright, A.; Marsh, A.M.; Tsai, H.; Majeed, F.; Lobo, A.J.; et al. Outcome of elective withdrawal of anti-tumour necrosis factor-α therapy in patients with Crohn’s disease in established remission. J. Crohns Colitis 2017, 11, 1456–1462. [Google Scholar] [CrossRef]
- De Vos, M.; Dewit, O.; D’Haens, G.; Baert, F.; Fontaine, F.; Vermeire, S.; Franchimont, D.; Moreels, T.; Staessen, D.; Terriere, L.; et al. Fast and sharp decrease in calprotectin predicts remission by infliximab in anti-TNF naïve patients with ulcerative colitis. J. Crohns Colitis 2012, 6, 557–562. [Google Scholar] [CrossRef]
- Sollelis, E.; Quinard, R.M.; Bouguen, G.; Goutte, M.; Goutorbe, F.; Bouvier, D.; Pereira, B.; Bommelaer, G.; Buisson, A. Combined evaluation of biomarkers as predictor of maintained remission in Crohn’s disease. World J. Gastroenterol. 2019, 25, 2354–2364. [Google Scholar] [CrossRef]
- Reinisch, W.; Bressler, B.; Curtis, R.; Parikh, A.; Yang, H.; Rosario, M.; Røseth, A.; Danese, S.; Feagan, B.; E Sands, B.; et al. Fecal Calprotectin Responses Following Induction Therapy With Vedolizumab in Moderate to Severe Ulcerative Colitis: A Post Hoc Analysis of GEMINI 1. Inflamm. Bowel Dis. 2018, 25, 803–810. [Google Scholar] [CrossRef]
- Mooiweer, E.; Severs, M.; Schipper, M.E.; Fidder, H.H.; Siersema, P.D.; Laheij, R.J.; Oldenburg, B. Low Fecal Calprotectin Predicts Sustained Clinical Remission in Inflammatory Bowel Disease Patients: A Plea for Deep Remission. J. Crohn’s Colitis 2014, 9, 50–55. [Google Scholar] [CrossRef]
- Molander, P.; Färkkilä, M.; Ristimäki, A.; Salminen, K.; Kemppainen, H.; Blomster, T.; Koskela, R.; Jussila, A.; Rautiainen, H.; Nissinen, M.; et al. Does fecal calprotectin predict short-term relapse after stopping TNFα-blocking agents in inflammatory bowel disease patients in deep remission? J. Crohn’s Colitis 2014, 9, 33–40. [Google Scholar] [CrossRef] [PubMed] [Green Version]
- Garcia-Planella, E.; Mañosa, M.; Chaparro, M.; Beltrán, B.; Barreiro-De-Acosta, M.; Gordillo, J.; Ricart, E.; Bermejo, F.; García-Sánchez, V.; Piqueras, M.; et al. Serial semi-quantitative measurement of fecal calprotectin in patients with ulcerative colitis in remission. Scand. J. Gastroenterol. 2017, 53, 152–157. [Google Scholar] [CrossRef] [PubMed]
- Tursi, A.; Mocci, G.; Faggiani, R.; Allegretta, L.; Della Valle, N.; de Medici, A.; Forti, G.; Franceschi, M.; Ferronato, A.; Gallina, S.; et al. Vedolizumab is effective and safe in real-life treatment of inflammatory bowel diseases outpatients: A multicenter, observational study in primary inflammatory bowel disease centers. Eur. J. Intern. Med. 2019, 66, 85–91. [Google Scholar] [CrossRef] [PubMed]
- Bertani, L.; Blandizzi, C.; Mumolo, M.G.; Ceccarelli, L.; Albano, E.; Tapete, G.; Svizzero, G.B.; Zanzi, F.; Coppini, F.; de Bortoli, N.; et al. Fecal Calprotectin Predicts Mucosal Healing in Patients With Ulcerative Colitis Treated With Biological Therapies: A Prospective Study. Clin. Transl. Gastroenterol. 2020, 11, e00174. [Google Scholar] [CrossRef]
- Bertani, L.; Fornai, M.; Fornili, M.; Antonioli, L.; Benvenuti, L.; Tapete, G.; Svizzero, G.B.; Ceccarelli, L.; Mumolo, M.G.; Blandizzi, C.; et al. Serum oncostatin M at baseline predicts mucosal healing in Crohn’s disease patients treated with infliximab. Aliment. Pharmacol. Ther. 2020, 52, 284–291. [Google Scholar] [CrossRef]
- Guidi, L.; Marzo, M.; Andrisani, G.; Felice, C.; Pugliese, D.; Mocci, G.; Nardone, O.; De Vitis, I.; Papa, A.; Rapaccini, G.; et al. Faecal calprotectin assay after induction with anti-Tumour Necrosis Factor α agents in inflammatory bowel disease: Prediction of clinical response and mucosal healing at one year. Dig. Liver Dis. 2014, 46, 974–979. [Google Scholar] [CrossRef]
- Beswick, L.; Rosella, O.; Rosella, G.; Headon, B.; Sparrow, M.P.; Gibson, P.R.; Van Langenberg, D.R. Exploration of Predictive Biomarkers of Early Infliximab Response in Acute Severe Colitis: A Prospective Pilot Study. J. Crohns Colitis 2017, 12, 289–297. [Google Scholar] [CrossRef]
- Reinisch, W.; Panaccione, R.; Bossuyt, P.; Baert, F.; Armuzzi, A.; Hébuterne, X.; Travis, S.; Danese, S.; Sandborn, W.J.; Schreiber, S.; et al. Association of Biomarker Cutoffs and Endoscopic Outcomes in Crohn’s Disease: A Post Hoc Analysis From the CALM Study. Inflamm. Bowel Dis. 2020, 26, 1562–1571. [Google Scholar] [CrossRef]
- Naismith, G.D.; Smith, L.A.; Barry, S.J.; Munro, J.I.; Laird, S.; Rankin, K.; Morris, A.J.; Winter, J.W.; Gaya, D.R. A prospective evaluation of the predictive value of faecal calprotectin in quiescent Crohn’s disease. J. Crohn’s Colitis 2014, 8, 1022–1029. [Google Scholar] [CrossRef]
- Kallel, L.; Ayadi, I.; Matri, S.; Fekih, M.; Mahmoud, N.B.; Feki, M.; Karoui, S.; Zouari, B.; Boubaker, J.; Kaabachi, N.; et al. Fecal calprotectin is a predictive marker of relapse in Crohn’s disease involving the colon: A prospective study. Eur. J. Gastroenterol. Hepatol. 2010, 22, 340–345. [Google Scholar] [CrossRef] [PubMed]
- Ye, L.; Chen, B.Q.; Wang, S.D.; Shi, H.; Yang, Z.; Wang, F.Y. Fecal calprotectin is a strong predictive marker of relapse in Chinese patients with Crohn’s disease: A two-year prospective study. Scand. J. Gastroenterol. 2017, 52, 1113–1119. [Google Scholar] [CrossRef] [PubMed]
- Ferreiro-Iglesias, R.; Barreiro-de Acosta, M.; Lorenzo-Gonzalez, A.; Dominguez-Munoz, J.E. Usefulness of a rapid faecal calprotectin test to predict relapse in Crohn’s disease patients on maintenance treatment with adalimumab. Scand. J. Gastroenterol. 2016, 51, 442–447. [Google Scholar] [CrossRef] [PubMed]
- Monteiro, S.; de Castro, F.D.; Leite, S.; Moreira, M.J.; Cotter, J. Low fecal calprotectin predicts clinical remission in Crohn’s disease patients: The simple answer to a challenging question. Scand. J. Gastroenterol. 2019, 54, 49–54. [Google Scholar] [CrossRef] [PubMed]
- Yamamoto, T.; Shiraki, M.; Bamba, T.; Umegae, S.; Matsumoto, K. Faecal calprotectin and lactoferrin as markers for monitoring disease activity and predicting clinical recurrence in patients with Crohn’s disease after ileocolonic resection: A prospective pilot study. United Eur. Gastroenterol. J. 2013, 1, 368–374. [Google Scholar] [CrossRef] [PubMed]
- Laharie, D.; Mesli, S.; El Hajbi, F.; Chabrun, E.; Chanteloup, E.; Capdepont, M.; Razaire, S.; de Ledinghen, V.; Zerbib, F. Prediction of Crohn’s disease relapse with faecal calprotectin in infliximab responders: A prospective study. Aliment. Pharmacol. Ther. 2011, 34, 462–469. [Google Scholar] [CrossRef]
- Jauregui-Amezaga, A.; Lopez-Ceron, M.; Aceituno, M.; Jimeno, M.; Rodriguez de Miguel, C.; Pino-Donnay, S.; Zabalza, M.; Sans, M.; Ricart, E.; Ordas, I.; et al. Accuracy of advanced endoscopy and fecal calprotectin for prediction of relapse in ulcerative colitis: A prospective study. Inflamm. Bowel Dis. 2014, 20, 1187–1193. [Google Scholar] [CrossRef]
- Hosseini, S.V.; Jafari, P.; Taghavi, S.A.; Safarpour, A.R.; Rezaianzadeh, A.; Moini, M.; Mehrabi, M. Fecal Calprotectin is an Accurate Tool and Correlated to Seo Index in Prediction of Relapse in Iranian Patients With Ulcerative Colitis. Iran. Red Crescent Med. J. 2015, 17, e22796. [Google Scholar] [CrossRef]
- Keshteli, A.H.; van den Brand, F.F.; Madsen, K.L.; Mandal, R.; Valcheva, R.; Kroeker, K.I.; Han, B.; Bell, R.C.; Cole, J.; Hoevers, T.; et al. Dietary and metabolomic determinants of relapse in ulcerative colitis patients: A pilot prospective cohort study. World J. Gastroenterol. 2017, 23, 3890–3899. [Google Scholar] [CrossRef]
- Shimoyama, T.; Yamamoto, T.; Umegae, S.; Matsumoto, K. Faecal calprotectin level for assessing endoscopic activity and predicting future clinical course in patients with moderately active ulcerative colitis undergoing granulomonocytapheresis: A prospective cohort study. BMC Gastroenterol. 2018, 18, 120. [Google Scholar] [CrossRef]
- Theede, K.; Holck, S.; Ibsen, P.; Kallemose, T.; Nordgaard-Lassen, I.; Nielsen, A.M. Fecal Calprotectin Predicts Relapse and Histological Mucosal Healing in Ulcerative Colitis. Inflamm. Bowel Dis. 2016, 22, 1042–1048. [Google Scholar] [CrossRef]
- Yamamoto, T.; Shiraki, M.; Bamba, T.; Umegae, S.; Matsumoto, K. Fecal calprotectin and lactoferrin as predictors of relapse in patients with quiescent ulcerative colitis during maintenance therapy. Int. J. Color. Dis. 2014, 29, 485–491. [Google Scholar] [CrossRef]
- Yamamoto, T.; Shimoyama, T.; Umegae, S.; Matsumoto, K. Endoscopic score vs. fecal biomarkers for predicting relapse in patients with ulcerative colitis after clinical remission and mucosal healing. Clin. Transl. Gastroenterol. 2018, 9, e136. [Google Scholar] [CrossRef]
- Costa, F.; Mumolo, M.G.; Ceccarelli, L.; Bellini, M.; Romano, M.R.; Sterpi, C.; Ricchiuti, A.; Marchi, S.; Bottai, M. Calprotectin is a stronger predictive marker of relapse in ulcerative colitis than in Crohn’s disease. Gut 2005, 54, 364–368. [Google Scholar] [CrossRef] [PubMed]
- D’Inca, R.; Dal Pont, E.; Di Leo, V.; Benazzato, L.; Martinato, M.; Lamboglia, F.; Oliva, L.; Sturniolo, G.C. Can calprotectin predict relapse risk in inflammatory bowel disease? Am. J. Gastroenterol. 2008, 103, 2007–2014. [Google Scholar] [CrossRef]
- Ferreiro-Iglesias, R.; Barreiro-de Acosta, M.; Lorenzo-Gonzalez, A.; Dominguez-Munoz, J.E. Accuracy of Consecutive Fecal Calprotectin Measurements to Predict Relapse in Inflammatory Bowel Disease Patients Under Maintenance With Anti-TNF Therapy: A Prospective Longitudinal Cohort Study. J. Clin. Gastroenterol. 2018, 52, 229–234. [Google Scholar] [CrossRef] [PubMed]
- Gisbert, J.P.; Bermejo, F.; Perez-Calle, J.L.; Taxonera, C.; Vera, I.; McNicholl, A.G.; Algaba, A.; Lopez, P.; Lopez-Palacios, N.; Calvo, M.; et al. Fecal calprotectin and lactoferrin for the prediction of inflammatory bowel disease relapse. Inflamm. Bowel Dis. 2009, 15, 1190–1198. [Google Scholar] [CrossRef] [PubMed]
- Kostas, A.; Siakavellas, S.I.; Kosmidis, C.; Takou, A.; Nikou, J.; Maropoulos, G.; Vlachogiannakos, J.; Papatheodoridis, G.V.; Papaconstantinou, I.; Bamias, G. Fecal calprotectin measurement is a marker of short-term clinical outcome and presence of mucosal healing in patients with inflammatory bowel disease. World J. Gastroenterol. 2017, 23, 7387–7396. [Google Scholar] [CrossRef]
- Ferreiro-Iglesias, R.; Acosta, M.B.-D.; Santiago, M.O.; Gonzalez, A.L.; De La Peña, C.A.; Estevez, A.J.B.; Dominguez-Munoz, J.E. Fecal Calprotectin as Predictor of Relapse in Patients With Inflammatory Bowel Disease Under Maintenance Infliximab Therapy. J. Clin. Gastroenterol. 2016, 50, 147–151. [Google Scholar] [CrossRef]
- Garcia-Sanchez, V.; Iglesias-Flores, E.; Gonzalez, R.; Gisbert, J.P.; Gallardo-Valverde, J.M.; Gonzalez-Galilea, A.; Naranjo-Rodriguez, A.; de Dios-Vega, J.F.; Muntane, J.; Gomez-Camacho, F. Does fecal calprotectin predict relapse in patients with Crohn’s disease and ulcerative colitis? J. Crohn’s Colitis 2010, 4, 144–152. [Google Scholar] [CrossRef]
- Zhulina, Y.; Cao, Y.; Amcoff, K.; Carlson, M.; Tysk, C.; Halfvarson, J. The prognostic significance of faecal calprotectin in patients with inactive inflammatory bowel disease. Aliment. Pharmacol. Ther. 2016, 44, 495–504. [Google Scholar] [CrossRef]
- Buisson, A.; Mak, W.Y.; Andersen, M.J.; Lei, D.; Kahn, S.A.; Pekow, J.; Cohen, R.D.; Zmeter, N.; Pereira, B.; Rubin, D.T. Faecal Calprotectin Is a Very Reliable Tool to Predict and Monitor the Risk of Relapse After Therapeutic De-escalation in Patients With Inflammatory Bowel Diseases. J. Crohn’s Colitis 2019, 13, 1012–1024. [Google Scholar] [CrossRef] [PubMed]
- Heida, A.; Park, K.T.; van Rheenen, P.F. Clinical Utility of Fecal Calprotectin Monitoring in Asymptomatic Patients with Inflammatory Bowel Disease: A Systematic Review and Practical Guide. Inflamm. Bowel Dis. 2017, 23, 894–902. [Google Scholar] [CrossRef] [PubMed]
- Li, J.; Zhao, X.; Li, X.; Lu, M.; Zhang, H. Systematic Review with Meta-Analysis: Fecal Calprotectin as a Surrogate Marker for Predicting Relapse in Adults with Ulcerative Colitis. Mediat. Inflamm. 2019, 2019, 2136501. [Google Scholar] [CrossRef] [PubMed]
- Mao, R.; Xiao, Y.L.; Gao, X.; Chen, B.L.; He, Y.; Yang, L.; Hu, P.J.; Chen, M.H. Fecal calprotectin in predicting relapse of inflammatory bowel diseases: A meta-analysis of prospective studies. Inflamm. Bowel Dis. 2012, 18, 1894–1899. [Google Scholar] [CrossRef]
- Qiu, Y.; Mao, R.; Chen, B.L.; He, Y.; Zeng, Z.R.; Xue, L.; Song, X.M.; Li, Z.P.; Chen, M.H. Fecal calprotectin for evaluating postoperative recurrence of Crohn’s disease: A meta-analysis of prospective studies. Inflamm. Bowel Dis. 2015, 21, 315–322. [Google Scholar] [CrossRef]
- Tham, Y.S.; Yung, D.E.; Fay, S.; Yamamoto, T.; Ben-Horin, S.; Eliakim, R.; Koulaouzidis, A.; Kopylov, U. Fecal calprotectin for detection of postoperative endoscopic recurrence in Crohn’s disease: Systematic review and meta-analysis. Ther. Adv. Gastroenterol. 2018, 11, 1756284818785571. [Google Scholar] [CrossRef]
- Rucker, G.; Schumacher, M. Summary ROC curve based on a weighted Youden index for selecting an optimal cutpoint in meta-analysis of diagnostic accuracy. Stat. Med. 2010, 29, 3069–3078. [Google Scholar] [CrossRef]


| Author | Year | Title | Reason for Exclusion | |
|---|---|---|---|---|
| 1 | Boschetti G | 2015 [24] | Accuracies of serum and fecal S100 proteins (calprotectin and calgranulin C) to predict the response to TNF antagonists in patients with Crohn’s disease. | The baseline status of the patients does not meet our requirements. |
| 2 | Lasson A | 2013 [25] | Fecal calprotectin levels predict the clinical course in patients with new onset of ulcerative colitis. | The baseline status of the patients does not meet our requirements. |
| 3 | Yamamoto T | 2015 [26] | Consecutive monitoring of faecal calprotectin during mesalazine suppository therapy for active rectal inflammation in ulcerative colitis. | The baseline status of the patients does not meet our requirements. |
| 4 | Brooks AJ | 2017 [27] | Outcome of elective withdrawal of anti-tumour necrosis factor-α therapy in patients with Crohn’s disease in established remission. | Absence of data to reconstruct 2 × 2 table. |
| 5 | De Vos M | 2011 [28] | Fast and sharp decrease in calprotectin predicts remission by infliximab in anti-TNF naïve patients with ulcerative colitis. | Bring FC into gold standard. |
| 6 | Sollelis E | 2019 [29] | Combined evaluation of biomarkers as predictor of maintained remission in Crohn’s disease. | Bring FC into gold standard. |
| 7 | Reinisch W | 2019 [30] | Fecal Calprotectin Responses Following Induction Therapy With Vedolizumab in Moderate to Severe Ulcerative Colitis: A Post Hoc Analysis of GEMINI 1. | Without cut-off value. |
| 8 | Mooiweer E | 2015 [31] | Low fecal calprotectin predicts sustained clinical remission in inflammatory bowel disease patients: a plea for deep remission. | Including children (<16 y). |
| 9 | Molander P | 2014 [32] | Does fecal calprotectin predict short-term relapse after stopping TNFα-blocking agents in inflammatory bowel disease patients in deep remission? | The recurrence was predicted by FC value over a period of time. |
| 10 | Garcia-Planella E | 2018 [33] | Serial semi-quantitative measurement of fecal calprotectin in patients with ulcerative colitis in remission. | Patients’ numbers are inconsistent. |
| 11 | Tursi A | 2019 [34] | Vedolizumab is effective and safe in real-life treatment of inflammatory bowel diseases outpatients: A multicenter, observational study in primary inflammatory bowel disease centers. | No statistics about relapse. |
| 12 | Bertani L | 2020 [35] | Fecal Calprotectin Predicts Mucosal Healing in Patients With Ulcerative Colitis Treated With Biological Therapies: A Prospective Study. | No statistics about relapse. |
| 13 | Bertani L | 2020 [36] | Serum oncostatin M at baseline predicts mucosal healing in Crohn’s disease patients treated with infliximab. | No statistics about relapse. |
| 14 | Guidi L | 2014 [37] | Faecal calprotectin assay after induction with anti-Tumour Necrosis Factor α agents in inflammatory bowel disease: Prediction of clinical response and mucosal healing at one year. | No statistics about relapse. |
| 15 | Beswick L | 2018 [38] | Exploration of Predictive Biomarkers of Early Infliximab Response in Acute Severe Colitis: A Prospective Pilot Study. | No statistics about relapse. |
| 16 | Reinisch W | 2020 [39] | Association of Biomarker Cutoffs and Endoscopic Outcomes in Crohn’s Disease: A Post Hoc Analysis From the CALM Study. | No statistics about relapse. |
| Study | Country | Age | Male (%) | Disease Type (N) | Follow-Up Time | TP | FP | FN | TN | Cut-Off (μg/g) | Reference Standard | Medication | FC-Assay ELISA |
|---|---|---|---|---|---|---|---|---|---|---|---|---|---|
| A. Jauregui-Amezaga 2014 [47] | Spain | 46 (13.6 relapse); 46 (15.9 no relapse) | 46.88 | UC (82) | 12 (m) | 9 | 14 | 8 | 33 | 100 | 1, 2, 4 | Mixed | Cerba Internacional |
| 7 | 7 | 10 | 40 | 250 | |||||||||
| Buisson 2019 [62] | America | 36 (16.3) | 50.63 | IBD (160) | 12 (m) | 53 | 9 | 35 | 63 | 100 | 1 | Mixed | Genova Diagnostics |
| F.Costa 2005 [54] | Italy | 56.96 | IBD (79) | 12 (m) | 30 | 17 | 4 | 28 | 150 | 1, 3 | Mixed | Calprest | |
| 41.2 (12.7) | UC (41) | 17 | 4 | 2 | 18 | ||||||||
| 35.7 (11.6) | CD (38) | 13 | 13 | 2 | 10 | ||||||||
| D. Naismith 2014 [40] | UK | 18–83 | 35.87 | CD (97) | 12 (m) | 8 | 21 | 2 | 61 | 240 | 2, 3, 4 | Mixed | Buhlmann |
| D’Inca 2008 [55] | Italy | 15–80 | 51.85 | IBD (162) | 12 (m) | 39 | 35 | 18 | 70 | 130 | 1 | Mixed | Calprest |
| UC (97) | 26 | 18 | 11 | 42 | |||||||||
| CD (65) | 13 | 17 | 7 | 28 | |||||||||
| Ferreiro-Iglesias 2018 [56] | Spain | 18–78 | 49.47 | IBD (106) | 12 (m) | 30 | 13 | 0 | 52 | 130 | 1 | anti-TNF | Buhlmann |
| Gisbert 2009 [57] | Spain | 43 (13) | 51.30 | IBD (163) | 12 (m) | 18 | 43 | 8 | 94 | 150 | 1 | Mixed | PhiCal |
| 18 | 34 | 8 | 103 | 167 | |||||||||
| UC (74) | 9 | 20 | 4 | 41 | 150 | ||||||||
| 9 | 16 | 4 | 45 | 164 | |||||||||
| CD (89) | 9 | 23 | 4 | 53 | 150 | ||||||||
| 9 | 18 | 4 | 58 | 169 | |||||||||
| Hosseini 2015 [48] | Iran | 20–83 | 51.30 | UC (157) | 12 (m) | 59 | 9 | 15 | 71 | 341 | 1, 3 | NA | Buhlmann |
| Kallel 2010 [41] | Tunis | 15–66 | 43.40 | CD (53) | 12 (m) | 8 | 4 | 2 | 39 | 340 | 1, 3 | Mixed | Calprest |
| Keshteli 2017 [49] | Canada | 42.7 (14.8) | 45.00 | UC (20) | 12 (m) | 5 | 2 | 2 | 11 | 124 | 1 | Mixed | Buhlmann |
| Kostas 2017 [58] | Greece | 17–76 | 51.68 | IBD (149) | 6 (m) | 41 | 15 | 6 | 87 | 261 | 1, 3 | NA | Buhlmann |
| L. Ye 2017 [42] | China | 24 (23–43.5 relapse); 28 (19–42.5no relapse) | 64.52 | CD (62) | 24 (m) | 27 | 9 | 2 | 6 | 225 | 1, 2, 3 | Mixed | Buhlmann |
| Ferreiro-Iglesias 2016 [43] | Spain | 18–68 | 47.17 | IBD (53) | 2 (m) | 11 | 7 | 1 | 34 | 160 | 1 | IFX | Buhlmann |
| UC (20) | 2 (m) | 4 | 3 | 0 | 13 | 198 | |||||||
| CD (33) | 2 (m) | 7 | 4 | 1 | 21 | 160 | |||||||
| R.Ferreiro-Iglesias 2016 [59] | Spain | 24–64 | 43.33 | CD (30) | 4 (m) | 9 | 3 | 0 | 18 | 204 | 1 | ADA | Buhlmann |
| S. Monteir 2019 [44] | Portugal | 38.4 (12.2) | 45.83 | CD (144) | 6 (m) | 12 | 23 | 1 | 108 | 327 | 2,3 | Mixed | Buhlmann |
| Shimoyama 2018 [50] | Japan | NA | NA | UC (196) | 12 (m) | 26 | 7 | 8 | 39 | 114 | 1 | Mixed | Cell Sciences |
| Theede 2017 [51] | Denmark | 39.3 (13.92) | 72.86 | UC (70) | 12 (m) | 7 | 8 | 8 | 47 | 321 | 3 | Mixed | Buhlmann |
| Tibble 2000 [7] | UK | 33 (16–77 CD); 49 (21–72 UC) | 45.00 | IBD (80) | 12 (m) | 40 | 6 | 4 | 30 | 50 | 1, 3 | Mixed | NA |
| V. García-Sánchez 2009 [60] | Spain | 57.04 | IBD (135) | 12 (m) | 29 | 31 | 10 | 65 | 150 | 1 | Mixed | Calprest | |
| 40.4(13.1) | UC (69) | 17 | 18 | 4 | 30 | 120 | |||||||
| 36.9(9.2) | CD (66) | 14 | 17 | 4 | 31 | 200 | |||||||
| Y. Zhulina 2016 [61] | Sweden | 50 (42–61 relapse)/ 58 (41–64 no relapse) | 23.08 | IBD (130) | 3 (m) | 5 | 17 | 3 | 79 | 500 | 3 | Mixed | Buhlmann |
| 6 | 37 | 2 | 59 | 250 | |||||||||
| 12 (m) | 10 | 12 | 14 | 68 | 500 | ||||||||
| 15 | 28 | 9 | 52 | 250 | |||||||||
| 24 (m) | 11 | 11 | 26 | 56 | 500 | ||||||||
| 18 | 25 | 19 | 42 | 250 | |||||||||
| Yamamoto 2013 [45] | Japan | 32 (1.6) | 60.00 | CD (20) | 12 (m) | 5 | 1 | 1 | 13 | 170 | 1 | Mixed | Cell Sciences |
| Yamamoto 2014 [52] | Japan | 35.1 (0.8) | 61.25 | UC (80) | 12 (m) | 16 | 14 | 5 | 45 | 170 | 1, 2 | Mixed | Cell Sciences |
| Yamamoto 2018 [53] | Japan | 35 (31–39) | 61.59 | UC (164) | 12 (m) | 38 | 22 | 8 | 96 | 115 | 1 | Mixed | Cell Sciences |
| D. Laharie 2011 [46] | France | 27(17–65 relapse); 31(15–68 no relapse) | 32.00 | CD (65) | 38 (m) | 14 | 14 | 9 | 13 | 130 | 1,3 | Mixed | Buhlmann |
| 10 | 11 | 13 | 16 | 250 |
| Study | Disease Type | Definition of Relapse |
|---|---|---|
| A. Jauregui-Amezaga 2014 [47] | UC | Presence of blood in stool and MES ≥ 3 with histologic confirmation. |
| Buisson 2019 [62] | UC | Reappearance of clinical manifestation (SCCAI > 2 with subscore > 1 for at least one item among stool frequency and rectal bleeding) leading to medication intensification, hospitalization, or colectomy. |
| CD | Reappearance of clinical manifestation (HBI > 4) leading to therapeutic intensification, hospitalization, or CD-related surgery. | |
| F.Costa 2005 [54] | UC | Worsening of symptoms, accompanied by an increase in the UCAI score to >4, sufficient to require a change in therapy (addition of steroids, immunosuppressors, surgery, etc.). |
| CD | Worsening of symptoms, accompanied by an increase in the CDAI score to >150, sufficient to require a change in therapy (addition of steroids, immunosuppressors, surgery, etc.). | |
| D. Naismith 2014 [40] | CD | An unplanned escalation in therapy, progression of disease phenotype by the Montreal classification or hospitalisation and/or emergency surgery for active CD. |
| D’Inca 2008 [55] | UC | ET scores exceeding 4 and requiring additional treatment. |
| CD | CDAI exceeding 150, with an increment of more than 50 points over the baseline score (75 points in resected patients) and requiring additional treatment. | |
| Ferreiro-Iglesias 2018 [56] | UC | PMS > 2. |
| CD | HBI > 4. | |
| Gisbert 2009 [57] | UC | Truelove modified index > 11 points. |
| CD | CDAI > 150. | |
| Hosseini 2015 [48] | UC | Elevated Seo activity index higher than 220 or worsening of symptoms (including abdominal pain, diarrhea with or without blood and rectal bleeding) sufficient to require a change in therapy (increasing the dose, changing the current drug (s), addition of steroids, hospitalization or surgery). |
| Kallel 2010 [41] | CD | CDAI > 150 or an increase of more than 100 from the inclusion value and was sufficiently severe to warrant treatment. |
| Keshteli 2017 [49] | UC | PMS ≥ 3. |
| Kostas 2017 [58] | UC | (1) Significant increase in respective clinical activity indices above accepted cut-offs for remission in UC (Simple Colitis Activity Index ≥ 3) and/or (2) step up in the patient’s therapeutic regimen, including surgery for intractable disease-related symptoms. |
| CD | (1) Significant increase in respective clinical activity indices above accepted cut-offs for remission in CD (HBI ≥ 5) and/or (2) step up in the patient’s therapeutic regimen, including surgery for intractable disease-related symptoms. | |
| L. Ye 2017 [42] | CD | Worsening symptoms requiring intensified therapy or surgery or a CDAI score > 150, with confirmation by ileocolonoscopy. |
| Ferreiro-Iglesias 2016 [43] | UC | PMS > 3. |
| CD | HBI > 4. | |
| R.Ferreiro-Iglesias 2016 [59] | CD | HBI > 4. |
| S. MONTEIR 2019 [44] | CD | An unexpected escalation in therapy, hospitalization or surgery for active CD with ileocolonoscopy and inflammatory activity assessed by SES-CD or Rutgeerts score. |
| Shimoyama 2018 [50] | UC | The sum of ‘stool frequency’ score (0–3) and ‘rectal bleeding’ score (0–3) in the Mayo scoring system exceeding 0. |
| Theede 2017 [51] | UC | The symptoms of active UC demanding adjustment of actual or initiation of new UC therapy. |
| Tibble 2000 [7] | UC | HBI > 4 and an increase of >2 from the inclusion value. All relapses were of sufficient severity to warrant a change in treatment. |
| CD | CDAI > 150 with an increase of >100 from the inclusion value. All relapses were of sufficient severity to warrant a change in treatment. | |
| V. García-Sánchez 2009 [60] | UC | Worsening of the symptoms, accompanied by or a modified TW score of ≥11 points. |
| CD | Worsening of the symptoms, accompanied by a CDAI score of ≥150 points. | |
| Y. Zhulina 2016 [61] | IBD | Increasing symptoms necessitating intensified medical therapy or surgery. |
| Yamamoto 2013 [45] | CD | CDAI > 150 with an increase of ≥70 points. |
| Yamamoto 2014 [52] | UC | Worsening of stool frequency and/or rectal bleeding with an endoscopic score of 2 or 3. |
| Yamamoto 2018 [53] | UC | Worsening of stool frequency and/or rectal bleeding with the MES of 2 or 3. |
| D. Laharie 2011 [46] | CD | Increasing symptoms (CDAI > 250 within 2 weeks or CDAI > 150 with an at least 70 points of increase as compared with CDAI at week 14) or the need for an additional steroid or IFX course or for a surgical resection. |
| Test Result | Number of Participants (Studies) | Number of Results per 100 Patients Tested (95% CI) | Importance (Grade) * | Comments | ||
|---|---|---|---|---|---|---|
| Prevalence 25% | Prevalence 50% | Prevalence 75% | ||||
| True positive (TP) | 2457 (24) | 18 (13 to 21) | 36 (26 to 43) | 54 (40 to 64) | 8 | Benefit from early identification of relapse. |
| False negative (FN) | 7 (4 to 12) | 14 (7 to 24) | 21 (11 to 35) | 9 | Detriment from delays in identification of relapse and treatment. | |
| True negative (TN) | 56 (46 to 63) | 37 (31 to 42) | 19 (15 to 21) | 8 | Benefit from reassurance and relief of economic costs. | |
| False positive (FP) | 19 (12 to 29) | 13 (8 to 19) | 6 (4 to 10) | 7 | Detriment from undertake unnecessary psychological burden and financial expenditure. | |
| Type of the Causes | Specific Reasons |
|---|---|
| Infections | Giardia lamblia |
| Bacterial dysentery | |
| Viral gastroenteritis | |
| Helicobacter pylori gastritis | |
| Clostridium difficile | |
| HIV | |
| Malignancies | Colorectal cancer |
| Gastric carcinoma | |
| Intestinal lymphoma | |
| Pancreatic cancer | |
| Polyposis intestinalis | |
| Drugs | NSAIDs |
| PPIs | |
| Other gastrointestinal diseases | Gastro-oesophageal reflux disease |
| Cystic fibrosis | |
| Coeliac disease (untreated) | |
| Diverticular disease | |
| Protein losing enteropathy | |
| Colorectal adenoma | |
| Juvenile polyp | |
| Autoimmune enteropathy | |
| Microscopic colitis | |
| Liver cirrhosis | |
| Gastrointestinal bleeding | |
| IBS | |
| Proctitis after radiation therapy | |
| Colon inflammation bag | |
| Pancreatitis | |
| Lifestyle | Obesity |
| Physical inactivity | |
| Age | <9 years |
| >65 years | |
| Others | Bowel preparation for colonoscopy |
| Rheumatologic diseases | |
| Perianal disease | |
| Stoma | |
| Immune deficiency | |
| Intestinal transplant | |
| Proteolysis | |
| Food allergy (untreated) |
Disclaimer/Publisher’s Note: The statements, opinions and data contained in all publications are solely those of the individual author(s) and contributor(s) and not of MDPI and/or the editor(s). MDPI and/or the editor(s) disclaim responsibility for any injury to people or property resulting from any ideas, methods, instructions or products referred to in the content. |
© 2023 by the authors. Licensee MDPI, Basel, Switzerland. This article is an open access article distributed under the terms and conditions of the Creative Commons Attribution (CC BY) license (https://creativecommons.org/licenses/by/4.0/).
Share and Cite
Shi, J.-T.; Chen, N.; Xu, J.; Goyal, H.; Wu, Z.-Q.; Zhang, J.-X.; Xu, H.-G. Diagnostic Accuracy of Fecal Calprotectin for Predicting Relapse in Inflammatory Bowel Disease: A Meta-Analysis. J. Clin. Med. 2023, 12, 1206. https://doi.org/10.3390/jcm12031206
Shi J-T, Chen N, Xu J, Goyal H, Wu Z-Q, Zhang J-X, Xu H-G. Diagnostic Accuracy of Fecal Calprotectin for Predicting Relapse in Inflammatory Bowel Disease: A Meta-Analysis. Journal of Clinical Medicine. 2023; 12(3):1206. https://doi.org/10.3390/jcm12031206
Chicago/Turabian StyleShi, Jin-Tong, Nuo Chen, Jia Xu, Hemant Goyal, Zhi-Qi Wu, Jie-Xin Zhang, and Hua-Guo Xu. 2023. "Diagnostic Accuracy of Fecal Calprotectin for Predicting Relapse in Inflammatory Bowel Disease: A Meta-Analysis" Journal of Clinical Medicine 12, no. 3: 1206. https://doi.org/10.3390/jcm12031206