

Skin Autofluorescence Measurement as Initial Assessment of Hepatic Parenchyma Quality in Patients Undergoing Liver Resection
 , , ,
, , ,
Abstract
:1. Introduction
2. Materials and Methods
3. Results
4. Discussion
5. Conclusions
Author Contributions
Funding
Institutional Review Board Statement
Informed Consent Statement
Data Availability Statement
Conflicts of Interest
References
- Mendez, J.D.; Xie, J.; Aguilar-Hernandez, M.; Mendez-Valenzuela, V. Molecular susceptibility to glycation and its implication in diabetes mellitus and related diseases. Mol. Cell Biochem. 2010, 344, 185–193. [Google Scholar] [CrossRef] [PubMed]
- Xie, J.; Mendez, J.D.; Mendez-Valenzuela, V.; Aguilar-Hernandez, M.M. Cellular signalling of the receptor for advanced glycation end products (RAGE). Cell Signal. 2013, 25, 2185–2197. [Google Scholar] [CrossRef] [PubMed]
- Twarda-Clapa, A.; Olczak, A.; Bialkowska, A.M.; Koziolkiewicz, M. Advanced Glycation End-Products (AGEs): Formation, Chemistry, Classification, Receptors, and Diseases Related to AGEs. Cells 2022, 11, 1312. [Google Scholar] [CrossRef] [PubMed]
- Uribarri, J.; Cai, W.; Peppa, M.; Goodman, S.; Ferrucci, L.; Striker, G.; Vlassara, H. Circulating glycotoxins and dietary advanced glycation endproducts: Two links to inflammatory response, oxidative stress, and aging. J. Gerontol. A Biol. Sci. Med. Sci. 2007, 62, 427–433. [Google Scholar] [CrossRef]
- Takeuchi, M. Toxic AGEs (TAGE) theory: A new concept for preventing the development of diseases related to lifestyle. Diabetol. Metab. Syndr. 2020, 12, 105. [Google Scholar] [CrossRef]
- Vlassara, H.; Uribarri, J.; Cai, W.; Striker, G. Advanced glycation end product homeostasis: Exogenous oxidants and innate defenses. Ann. N. Y. Acad. Sci. 2008, 1126, 46–52. [Google Scholar] [CrossRef]
- Ribeiro, R.T.; Macedo, M.P.; Raposo, J.F. HbA1c, Fructosamine, and Glycated Albumin in the Detection of Dysglycaemic Conditions. Curr. Diabetes Rev. 2016, 12, 14–19. [Google Scholar] [CrossRef]
- Wizenty, J.; Schumann, T.; Theil, D.; Stockmann, M.; Pratschke, J.; Tacke, F.; Aigner, F.; Wuensch, T. Recent Advances and the Potential for Clinical Use of Autofluorescence Detection of Extra-Ophthalmic Tissues. Molecules 2020, 25, 2095. [Google Scholar] [CrossRef]
- Jaisson, S.; Gillery, P. Methods to assess advanced glycation end-products. Curr. Opin. Clin. Nutr. Metab. Care 2021, 24, 411–415. [Google Scholar] [CrossRef]
- Atzeni, I.M.; van de Zande, S.C.; Westra, J.; Zwerver, J.; Smit, A.J.; Mulder, D.J. The AGE Reader: A non-invasive method to assess long-term tissue damage. Methods 2021, 203, 533–541. [Google Scholar] [CrossRef]
- Meerwaldt, R.; Graaff, R.; Oomen, P.H.N.; Links, T.P.; Jager, J.J.; Alderson, N.L.; Thorpe, S.R.; Baynes, J.W.; Gans, R.O.B.; Smit, A.J. Simple non-invasive assessment of advanced glycation endproduct accumulation. Diabetologia 2004, 47, 1324–1330. [Google Scholar] [CrossRef] [PubMed]
- Temma, J.; Matsuhisa, M.; Horie, T.; Kuroda, A.; Mori, H.; Tamaki, M.; Endo, I.; Aihara, K.; Abe, M.; Matsumoto, T. Non-invasive Measurement of Skin Autofluorescence as a Beneficial Surrogate Marker for Atherosclerosis in Patients with Type 2 Diabetes. J. Med. Investig. 2015, 62, 126–129. [Google Scholar] [CrossRef] [PubMed]
- Kunimoto, M.; Yokoyama, M.; Shimada, K.; Matsubara, T.; Aikawa, T.; Ouchi, S.; Fukao, K.; Miyazaki, T.; Fujiwara, K.; Abulimiti, A.; et al. Relationship between skin autofluorescence levels and clinical events in patients with heart failure undergoing cardiac rehabilitation. Cardiovasc. Diabetol. 2021, 20, 208. [Google Scholar] [CrossRef] [PubMed]
- Viramontes Horner, D.; Taal, M.W. Skin autofluorescence: An emerging biomarker in persons with kidney disease. Curr. Opin. Nephrol. Hypertens. 2019, 28, 507–512. [Google Scholar] [CrossRef]
- Hosseini, M.S.; Razavi, Z.; Ehsani, A.H.; Firooz, A.; Afazeli, S. Clinical Significance of Non-invasive Skin Autofluorescence Measurement in Patients with Diabetes: A Systematic Review and Meta-analysis. EClinicalMedicine 2021, 42, 101194. [Google Scholar] [CrossRef]
- Krasnodebski, M.; Grat, K.; Morawski, M.; Borkowski, J.; Krawczyk, P.; Zhylko, A.; Skalski, M.; Kalinowski, P.; Zieniewicz, K.; Grat, M. Skin autofluorescence as a novel predictor of acute kidney injury after liver resection. World J. Surg. Oncol. 2021, 19, 276. [Google Scholar] [CrossRef]
- Adams, R.B.; Aloia, T.A.; Loyer, E.; Pawlik, T.M.; Taouli, B.; Vauthey, J.N. Americas Hepato-Pancreato-Biliary Association, Society of Surgical Oncology, Society for Surgery of the Alimentary Tract. Selection for hepatic resection of colorectal liver metastases: Expert consensus statement. HPB 2013, 15, 91–103. [Google Scholar] [CrossRef]
- Alkhouri, N.; Singh, T.; Alsabbagh, E.; Guirguis, J.; Chami, T.; Hanouneh, I.; Grove, D.; Lopez, R.; Dweik, R. Isoprene in the Exhaled Breath is a Novel Biomarker for Advanced Fibrosis in Patients with Chronic Liver Disease: A Pilot Study. Clin. Transl. Gastroenterol. 2015, 6, e112. [Google Scholar] [CrossRef]
- Pijls, K.E.; Smolinska, A.; Jonkers, D.M.; Dallinga, J.W.; Masclee, A.A.; Koek, G.H.; van Schooten, F.J. A profile of volatile organic compounds in exhaled air as a potential non-invasive biomarker for liver cirrhosis. Sci. Rep. 2016, 6, 19903. [Google Scholar] [CrossRef]
- Loomba, R.; Adams, L.A. Advances in non-invasive assessment of hepatic fibrosis. Gut 2020, 69, 1343–1352. [Google Scholar] [CrossRef]
- Tapper, E.B.; Lok, A.S. Use of Liver Imaging and Biopsy in Clinical Practice. N. Engl. J. Med. 2017, 377, 756–768. [Google Scholar] [CrossRef] [PubMed]
- Maury, E.; Vergniol, J.; Ledinghen, V.; Rigalleau, V. Skin autofluorescence is high in patients with cirrhosis—further arguing for the implication of Advanced Glycation End products. J. Hepatol. 2011, 54, 1079–1080. [Google Scholar] [CrossRef]
- Rye, K.; Mortimore, G.; John, S.G.; Jefferies, H.; Korsheed, S.; Owen, P.; Fluck, R.; McIntyre, C.W.; Austin, A.; Freeman, J.G. Tissue advanced glycation endproducts in two populations associated with increased oxidative stress: Normal in cirrhosis but elevated in haemodialysis patients. Gastroenterol. Hepatol. 2009, 58 (Suppl. I), A1–A156. [Google Scholar]
- McCormack, L.; Petrowsky, H.; Jochum, W.; Furrer, K.; Clavien, P.A. Hepatic steatosis is a risk factor for postoperative complications after major hepatectomy: A matched case-control study. Ann. Surg. 2007, 245, 923–930. [Google Scholar] [CrossRef] [PubMed]
- Pathak, S.; Tang, J.M.; Terlizzo, M.; Poston, G.J.; Malik, H.Z. Hepatic steatosis, body mass index and long term outcome in patients undergoing hepatectomy for colorectal liver metastases. Eur. J. Surg. Oncol. 2010, 36, 52–57. [Google Scholar] [CrossRef]
- Ramos, E.; Torras, J.; Llado, L.; Rafecas, A.; Serrano, T.; Lopez-Gordo, S.; Busquets, J.; Fabregat, J. The influence of steatosis on the short- and long-term results of resection of liver metastases from colorectal carcinoma. HPB 2016, 18, 389–396. [Google Scholar] [CrossRef]
- Batts, K.P.; Ludwig, J. Chronic hepatitis. An update on terminology and reporting. Am. J. Surg. Pathol. 1995, 19, 1409–1417. [Google Scholar] [CrossRef]
- Wang, X.; Zhao, X.; Lian, T.; Wei, J.; Yue, W.; Zhang, S.; Chen, Q. Skin autofluorescence and the complexity of complications in patients with type 2 diabetes mellitus: A cross-sectional study. BMC Endocr. Disord. 2021, 21, 58. [Google Scholar] [CrossRef]
- Pilleron, S.; Rajaobelina, K.; Tabue Teguo, M.; Dartigues, J.F.; Helmer, C.; Delcourt, C.; Rigalleau, V.; Feart, C. Accumulation of advanced glycation end products evaluated by skin autofluorescence and incident frailty in older adults from the Bordeaux Three-City cohort. PLoS ONE 2017, 12, e0186087. [Google Scholar] [CrossRef]
- Van Waateringe, R.P.; Slagter, S.N.; van der Klauw, M.M.; van Vliet-Ostaptchouk, J.V.; Graaff, R.; Paterson, A.D.; Lutgers, H.L.; Wolffenbuttel, B.H. Lifestyle and clinical determinants of skin autofluorescence in a population-based cohort study. Eur. J. Clin. Investig. 2016, 46, 481–490. [Google Scholar] [CrossRef]
- Pereira, E.; Paula, D.P.; de Araujo, B.P.; da Fonseca, M.J.M.; Diniz, M.; Daliry, A.; Griep, R.H. Advanced glycation end product: A potential biomarker for risk stratification of non-alcoholic fatty liver disease in ELSA-Brasil study. World J. Gastroenterol. 2021, 27, 4913–4928. [Google Scholar] [CrossRef] [PubMed]
- Yagmur, E.; Tacke, F.; Weiss, C.; Lahme, B.; Manns, M.P.; Kiefer, P.; Trautwein, C.; Gressner, A.M. Elevation of Nepsilon-(carboxymethyl)lysine-modified advanced glycation end products in chronic liver disease is an indicator of liver cirrhosis. Clin. Biochem. 2006, 39, 39–45. [Google Scholar] [CrossRef] [PubMed]
- Sebekova, K.; Kupcova, V.; Schinzel, R.; Heidland, A. Markedly elevated levels of plasma advanced glycation end products in patients with liver cirrhosis—amelioration by liver transplantation. J. Hepatol. 2002, 36, 66–71. [Google Scholar] [CrossRef]
- Leung, C.; Herath, C.B.; Jia, Z.; Andrikopoulos, S.; Brown, B.E.; Davies, M.J.; Rivera, L.R.; Furness, J.B.; Forbes, J.M.; Angus, P.W. Dietary advanced glycation end-products aggravate non-alcoholic fatty liver disease. World J. Gastroenterol. 2016, 22, 8026–8040. [Google Scholar] [CrossRef]
- Hyogo, H.; Yamagishi, S.; Iwamoto, K.; Arihiro, K.; Takeuchi, M.; Sato, T.; Ochi, H.; Nonaka, M.; Nabeshima, Y.; Inoue, M.; et al. Elevated levels of serum advanced glycation end products in patients with non-alcoholic steatohepatitis. J. Gastroenterol. Hepatol. 2007, 22, 1112–1119. [Google Scholar] [CrossRef]
- Smedsrod, B.; Melkko, J.; Araki, N.; Sano, H.; Horiuchi, S. Advanced glycation end products are eliminated by scavenger-receptor-mediated endocytosis in hepatic sinusoidal Kupffer and endothelial cells. Biochem. J. 1997, 322 Pt 2, 567–573. [Google Scholar] [CrossRef]
- Guimaraes, E.L.; Empsen, C.; Geerts, A.; van Grunsven, L.A. Advanced glycation end products induce production of reactive oxygen species via the activation of NADPH oxidase in murine hepatic stellate cells. J. Hepatol. 2010, 52, 389–397. [Google Scholar] [CrossRef]
- Rungratanawanich, W.; Qu, Y.; Wang, X.; Essa, M.M.; Song, B.J. Advanced glycation end products (AGEs) and other adducts in aging-related diseases and alcohol-mediated tissue injury. Exp. Mol. Med. 2021, 53, 168–188. [Google Scholar] [CrossRef]
- Da Moura Semedo, C.; Webb, M.; Waller, H.; Khunti, K.; Davies, M. Skin autofluorescence, a non-invasive marker of advanced glycation end products: Clinical relevance and limitations. Postgrad. Med. J. 2017, 93, 289–294. [Google Scholar] [CrossRef]
- Mulder, D.J.; Water, T.V.; Lutgers, H.L.; Graaff, R.; Gans, R.O.; Zijlstra, F.; Smit, A.J. Skin autofluorescence, a novel marker for glycemic and oxidative stress-derived advanced glycation endproducts: An overview of current clinical studies, evidence, and limitations. Diabetes Technol. Ther. 2006, 8, 523–535. [Google Scholar] [CrossRef]
- D’Orazio, J.; Jarrett, S.; Amaro-Ortiz, A.; Scott, T. UV radiation and the skin. Int. J. Mol. Sci. 2013, 14, 12222–12248. [Google Scholar] [CrossRef] [PubMed] [Green Version]
- Blanco-Grau, A.; Gabriel-Medina, P.; Rodriguez-Algarra, F.; Villena, Y.; Lopez-Martinez, R.; Augustin, S.; Pons, M.; Cruz, L.M.; Rando-Segura, A.; Enfedaque, B.; et al. Assessing Liver Fibrosis Using the FIB4 Index in the Community Setting. Diagnostics 2021, 11, 2236. [Google Scholar] [CrossRef] [PubMed]


| Median (IQR) or n (%) | |
|---|---|
| Patient sex | |
| male | 91 (48.9%) |
| female | 95 (51.1%) |
| Patient age (years) | 60 (51–65) |
| SAF (AU) | 2.3 (1.9–2.6) |
| Body mass index (kg/m2) | 26.4 (23.5–30.1) |
| HBV | 18 (9.7%) |
| HCV | 7 (3.8%) |
| Chemotherapy | 86 (46.2%) |
| Diabetes | 24 (12.9%) |
| Arterial hypertension | 63 (33.9%) |
| Smokers | 84/181 (46.4%) |
| Cirrhosis | 7 (3.8%) |
| Liver fibrosis | 49/174 (28.2%) |
| Macrovesicular steatosis ≥ 10% | 54/155 (34.8%) |
| Macrovesicular steatosis ≥ 20% | 26/155 (16.8%) |
| Macrovesicular steatosis ≥ 30% | 18/155 (11.6%) |
| Preoperative laboratory tests | |
| white blood count (103/mm3) | 6.3 (5.3–7.8) |
| hemoglobin (g/dL) | 13.5 (12.6–14.2) |
| platelets (103/mm3) | 222 (181–263) |
| creatinine (mg/dL) | 0.8 (0.7–0.9) |
| bilirubin (mg/dL) | 0.5 (0.4–0.7) |
| INR | 1.0 (1.0–1.1) |
| albumin (g/dL) | 4.4 (4.1–4.6) |
| AST (U/L) | 28 (23–39) |
| ALT (U/L) | 27 (20–41) |
| Primary diagnosis | |
| colorectal liver metastases | 81 (43.6%) |
| hepatocellular cancer | 22 (11.8%) |
| gallbladder cancer | 17 (9.1%) |
| cholangiocarcinoma | 19 (10.2%) |
| other | 47 (25.3%) |
| Patient | Age | Cause of Cirrhosis | Indication to Surgery | Child-Pugh Class | Albumin (g/dL) | Bilirubin (mg/dL) | INR | Ascites | Encephalopathy | PLT (10²/µL) | Portal Hypertension | SAF (AU) |
|---|---|---|---|---|---|---|---|---|---|---|---|---|
| 1. Female | 63 | HCV * | HCC | A | 5.0 | 0.68 | 1.08 | absent | - | 126 | - | 1.6 |
| 2. Male | 45 | HBV | HCC | A | 4.9 | 0.39 | 1.29 | absent | - | 247 | - | 2.1 |
| 3. Male | 62 | Alcohol | HCC | A | 4.9 | 0.28 | 1.04 | absent | - | 157 | - | 2.6 |
| 4. Male | 65 | HCV * | HCC | A | 4.5 | 0.31 | 1.08 | absent | - | 250 | - | 2.5 |
| 5. Female | 66 | HCV | HCC | A | 4.4 | 2.35 | 1.23 | absent | - | 95 | - | 1.7 |
| 6. Male | 76 | HCV * | HCC | A | 4.3 | 0.43 | 1.07 | absent | - | 121 | yes | 1.5 |
| 7. Male | 55 | Alcohol | HCC | A | 3.8 | 0.61 | 1.11 | absent | - | 167 | - | 2.4 |
| Variable | Median (AU) | Median (AU) | p | |
|---|---|---|---|---|
| Male | 2.4 | Female | 2.2 | 0.107 |
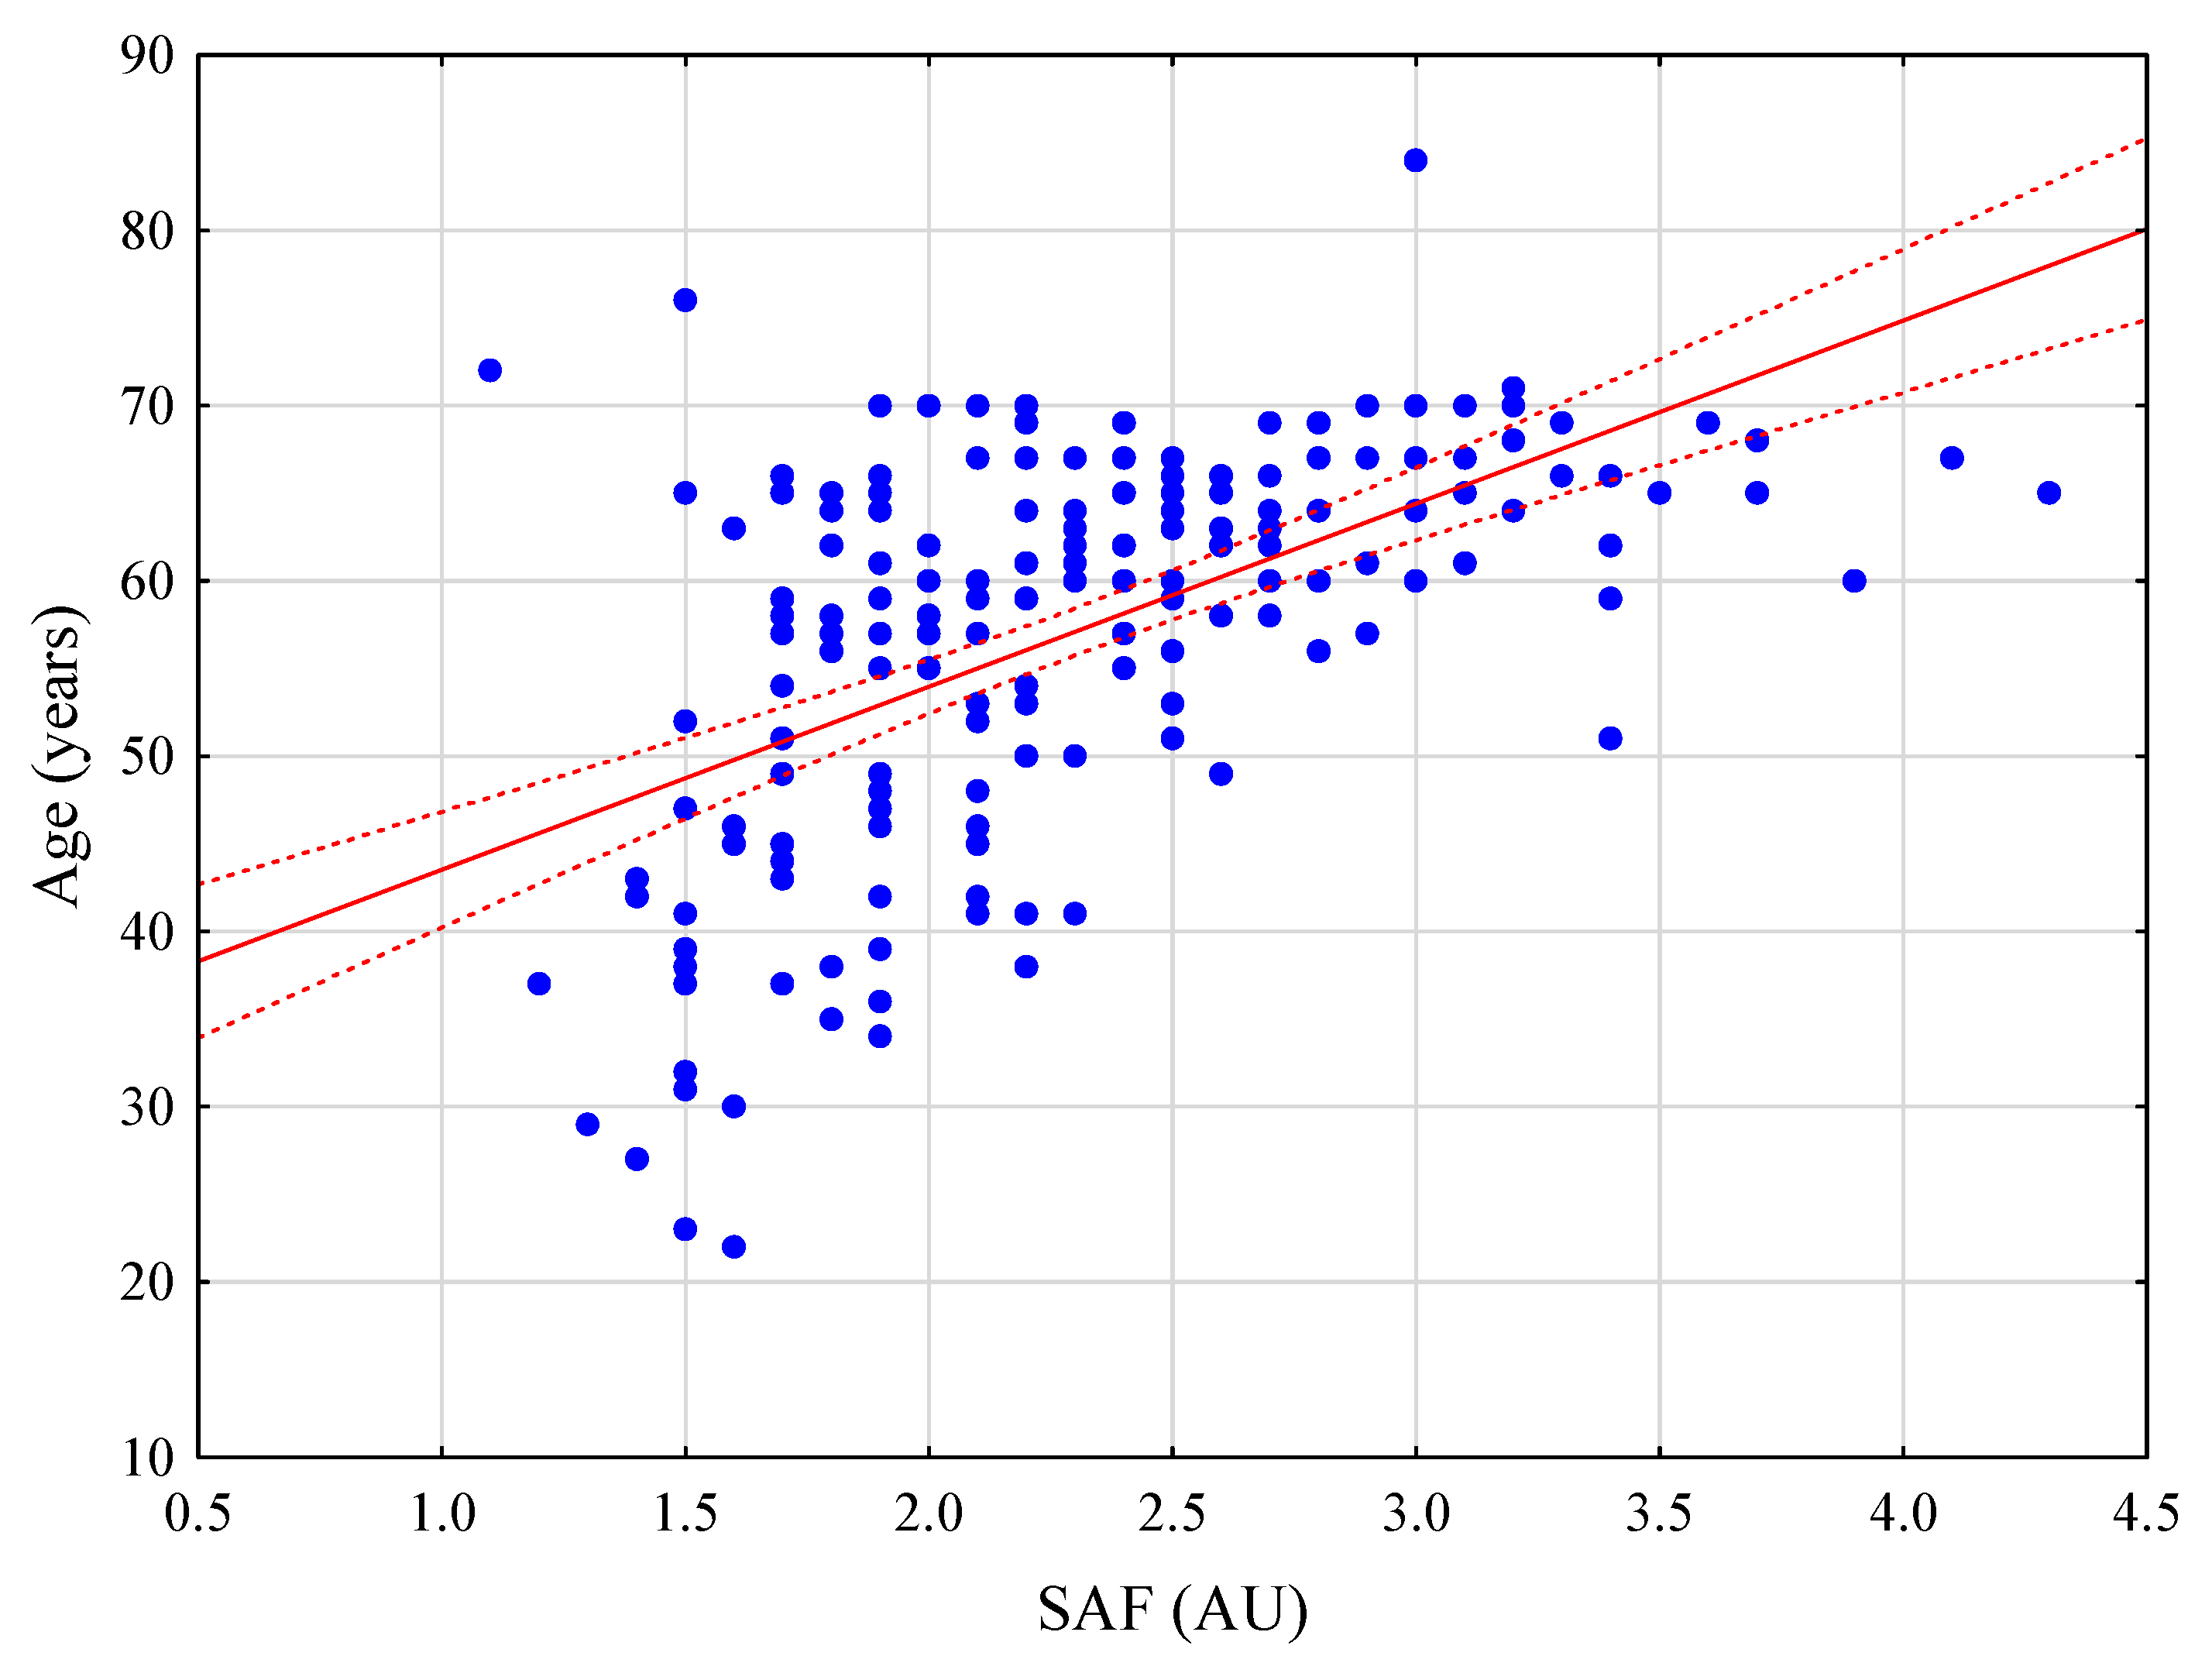
| Age ≥ 65 years | 2.6 | Age < 65 years | 2.1 | <0.001 |
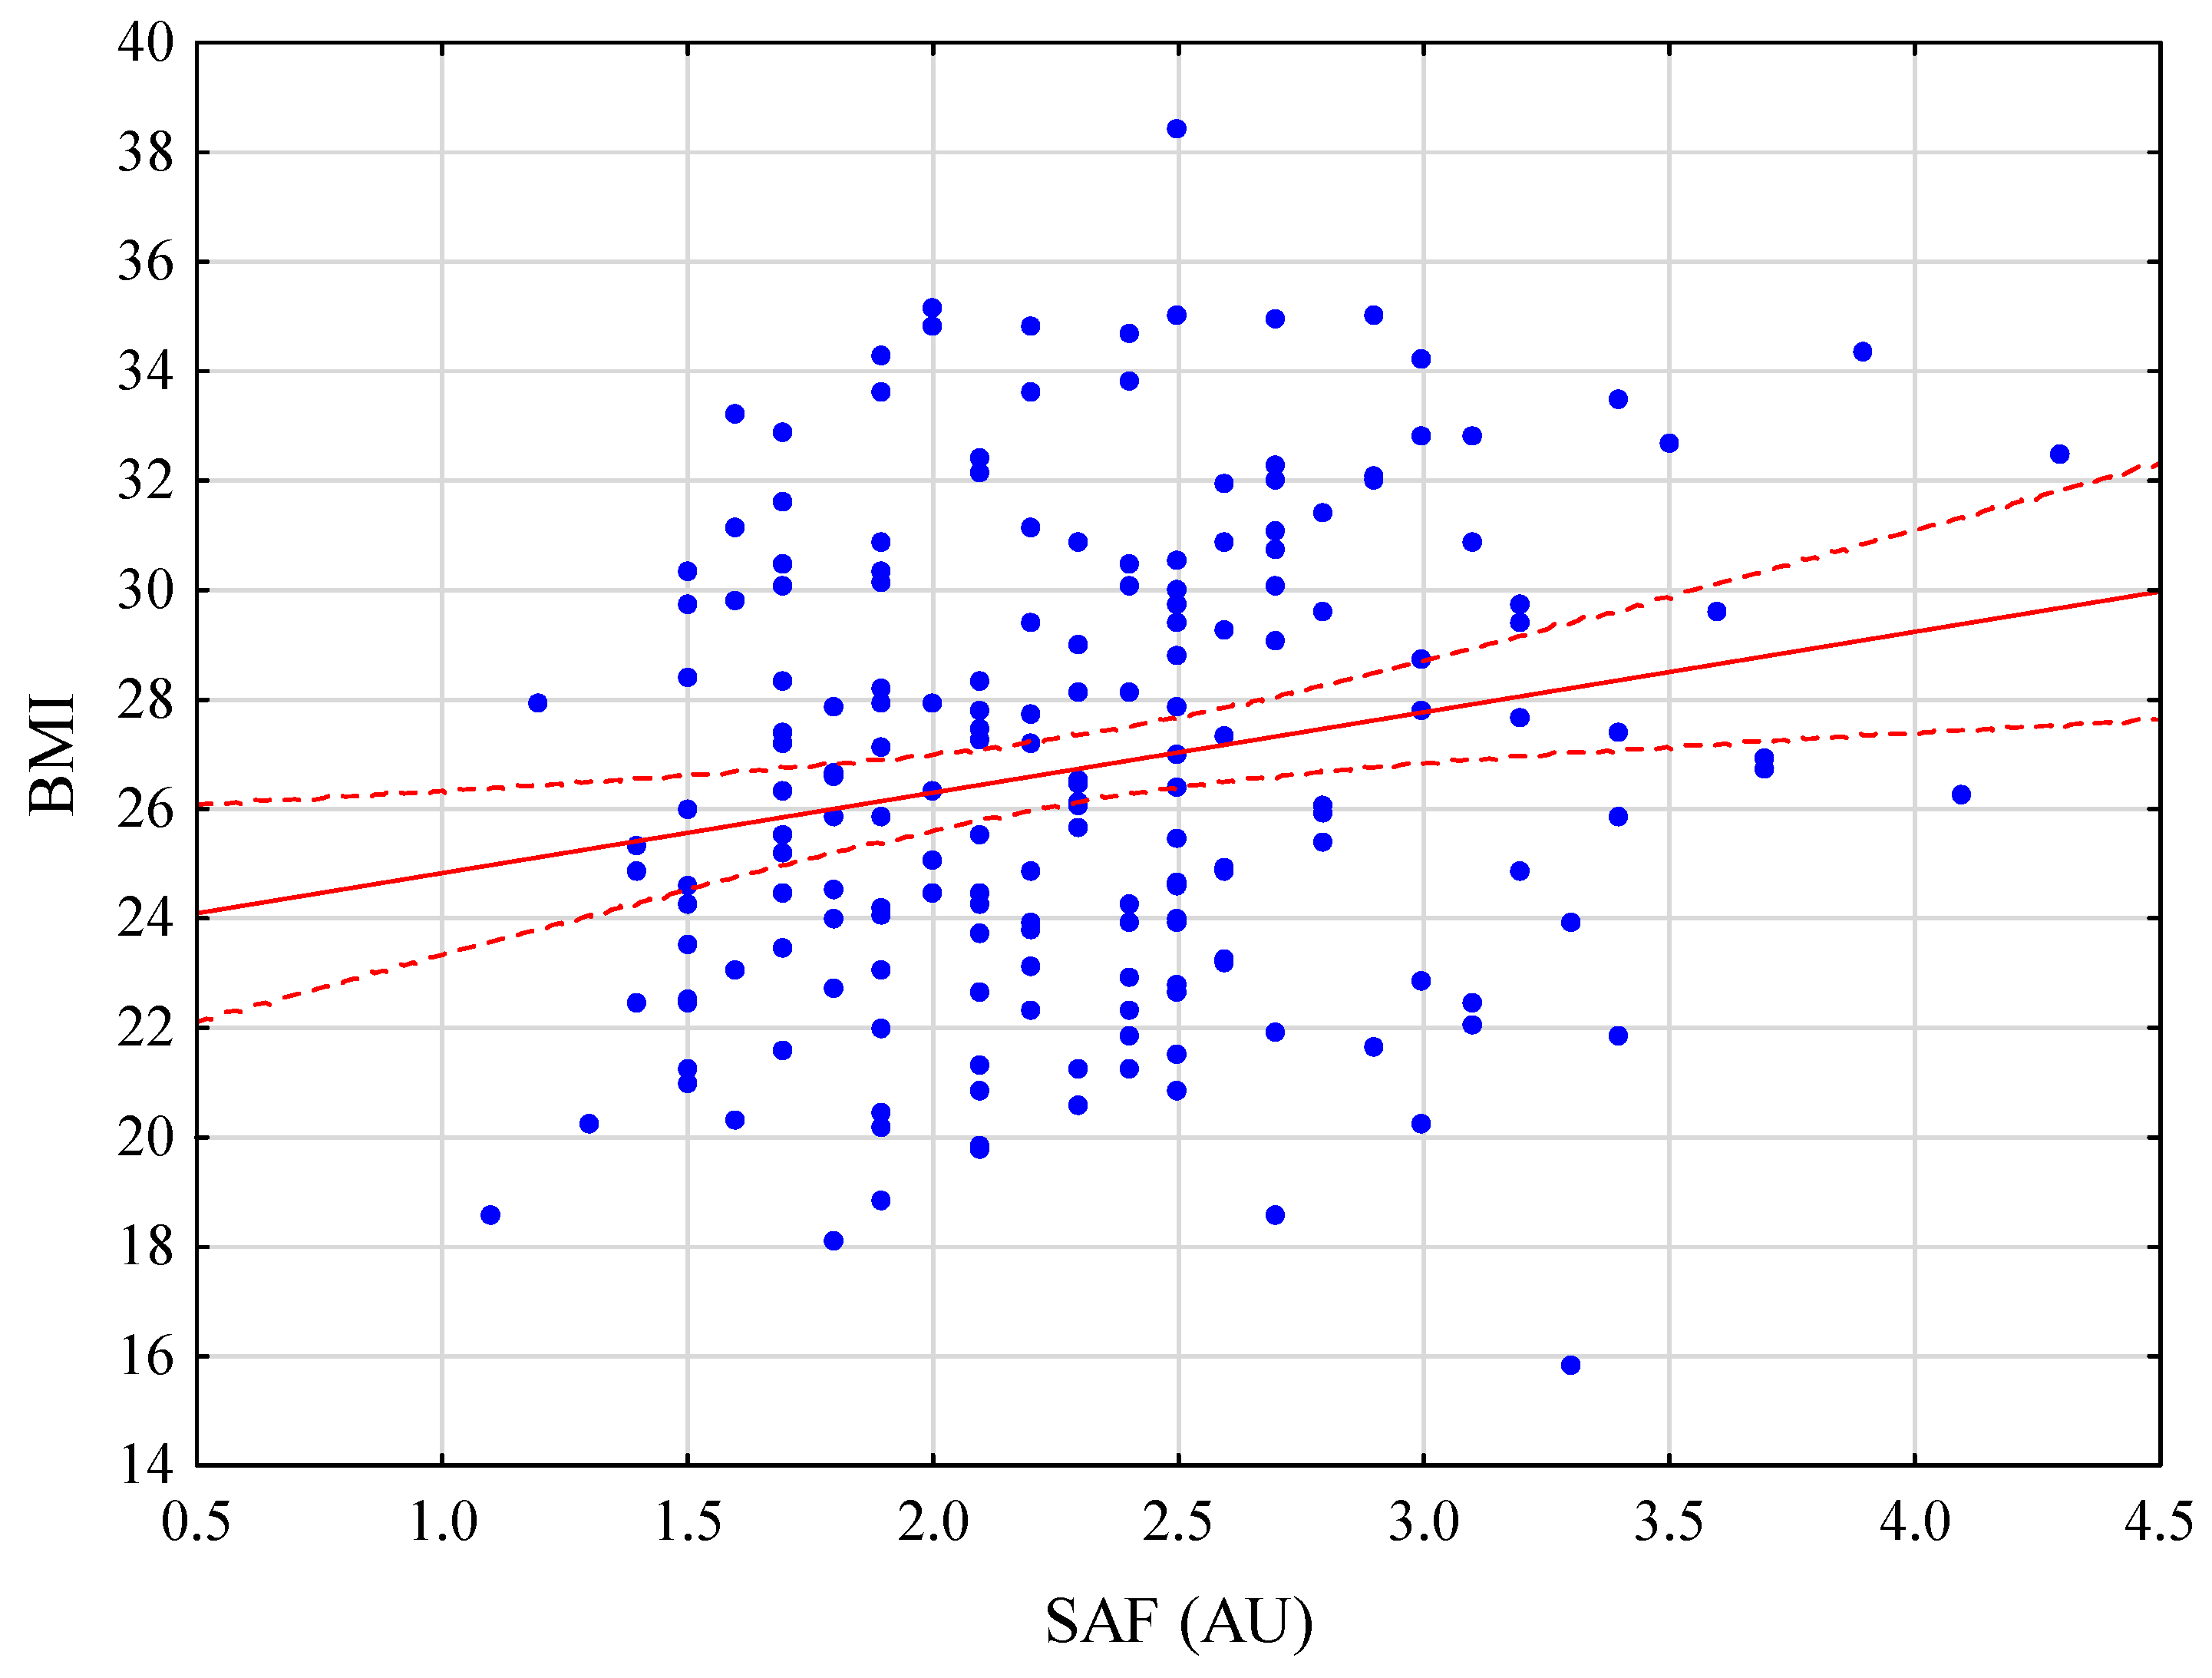
| BMI ≥ 30 | 2.4 | BMI < 30 | 2.2 | 0.047 |
| Diabetes | 2.7 | No diabetes | 2.2 | <0.001 |
| Smoking | 2.5 | Non-smokers | 2.1 | <0.001 |
| Chemotherapy | 2.3 | No chemotherapy | 2.2 | 0.746 |
| Arterial hypertension | 2.5 | No arterial hypertension | 2.1 | <0.001 |
| Liver fibrosis | 2.5 | No fibrosis | 2.2 | 0.020 |
| Cirrhosis | 2.1 | Liver fibrosis (Stage 1–3) | 2.5 | 0.061 |
| Serum bilirubin ≥ 1.2 mg/dL | 2.2 | Serum bilirubin < 1.2 mg/dL | 2.3 | 0.990 |
| INR ≥ 1.2 | 2.1 | INR < 1.2 | 2.3 | 0.727 |
| Albumin ≤ 3.5 g/dL | 2.2 | Albumin > 3.5 g/dL | 2.4 | 0.182 |
| AST ≥ 40 (U/L) | 2.2 | AST < 40 (U/L) | 2.4 | 0.462 |
| ALT ≥ 40 (U/L) | 2.3 | ALT < 40 (U/L) | 2.2 | 0.523 |
| Macrovesicular steatosis ≥ 10% | 2.5 | Macrovesicular steatosis < 10% | 2.2 | 0.008 |
| HBV or HBV infection | 2.5 | No viral infection | 2.2 | 0.199 |
| OR (95% CI) | p | OR (95% CI) | p | |
|---|---|---|---|---|
| Age | 1.03 (0.99–1.07) | 0.055 | - | - |
| BMI | 1.22 (1.11–1.34) | <0.001 | 1.21 (1.10–1.33) | <0.001 |
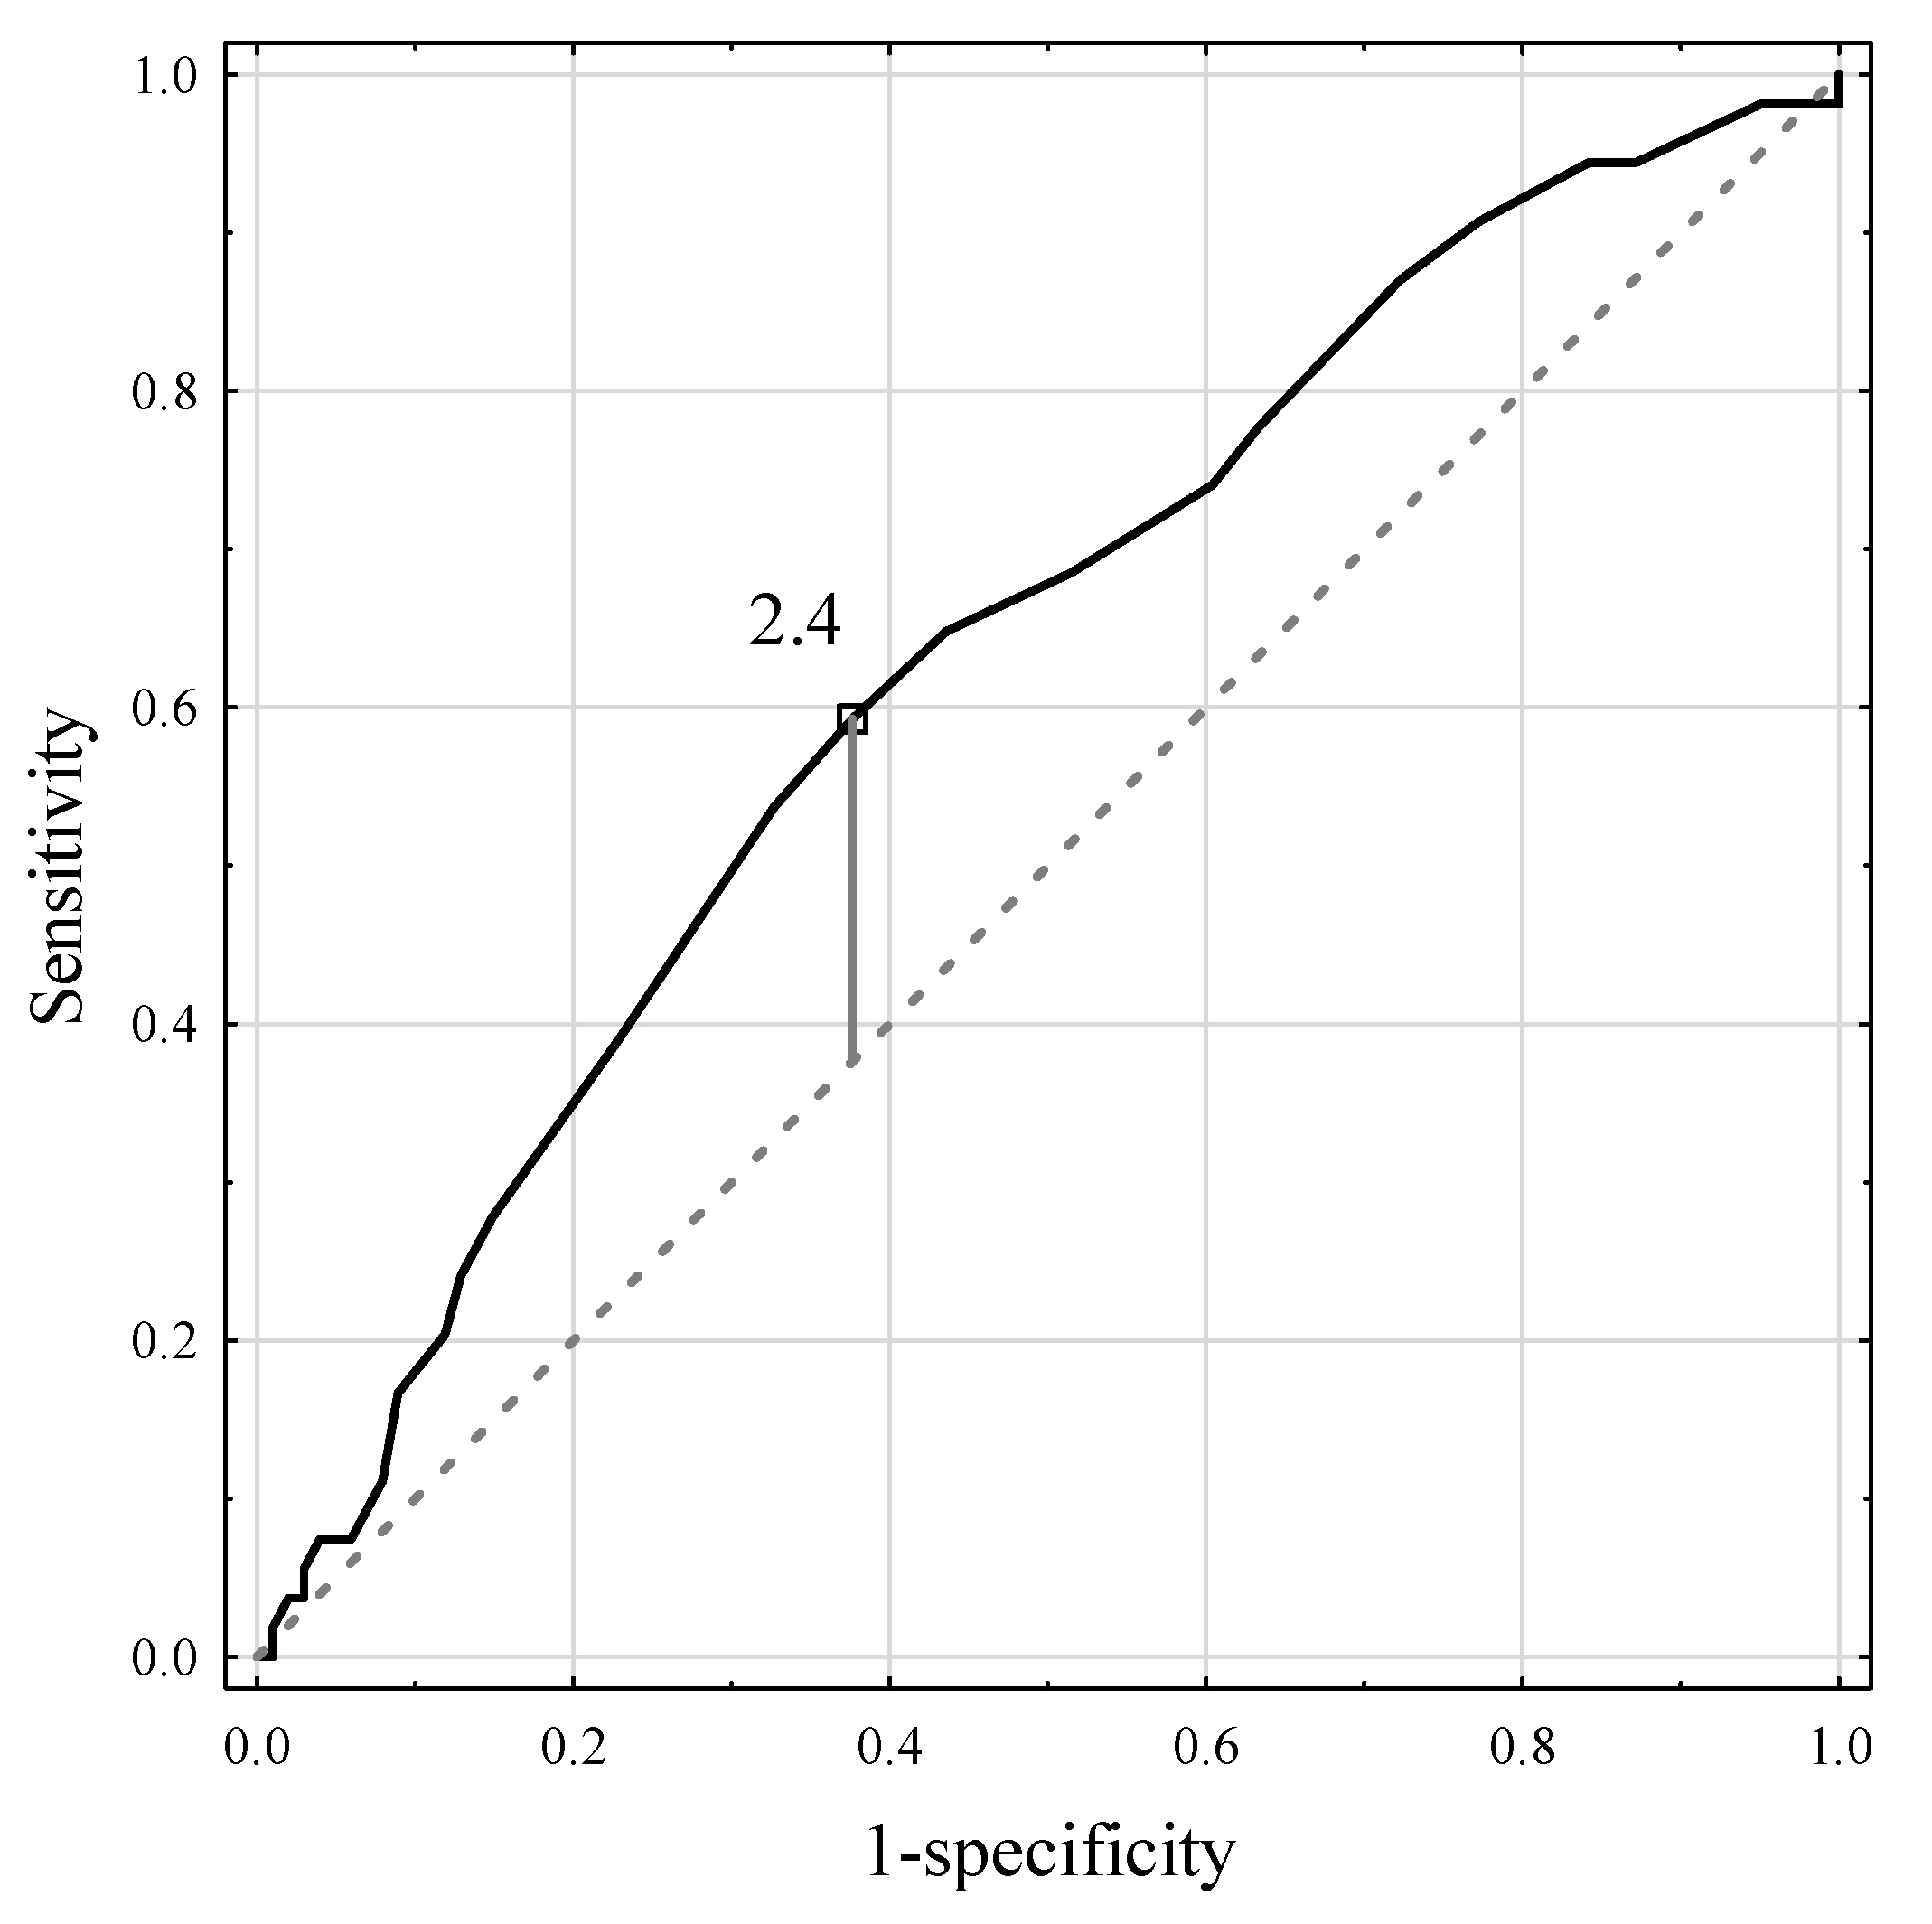
| SAF ≥ 2.4 | 2.41 (1.23–4.74) | 0.011 | 2.16 (1.05–4.43) | 0.036 |
| Diabetes | 3.05 (1.09–8.55) | 0.034 | - | - |
| Chemotherapy | 0.94 (0.49–1.83) | 0.860 | - | - |
| Smoking | 1.72 (0.88–3.83) | 0.115 | - | - |
| OR (95% CI) | p | OR (95% CI) | p | |
|---|---|---|---|---|
| Age | 1.07 (1.03–1.11) | 0.001 | 1.06 (1.02–1.11) | 0.005 |
| BMI | 1.04 (0.96–1.12) | 0.333 | - | - |
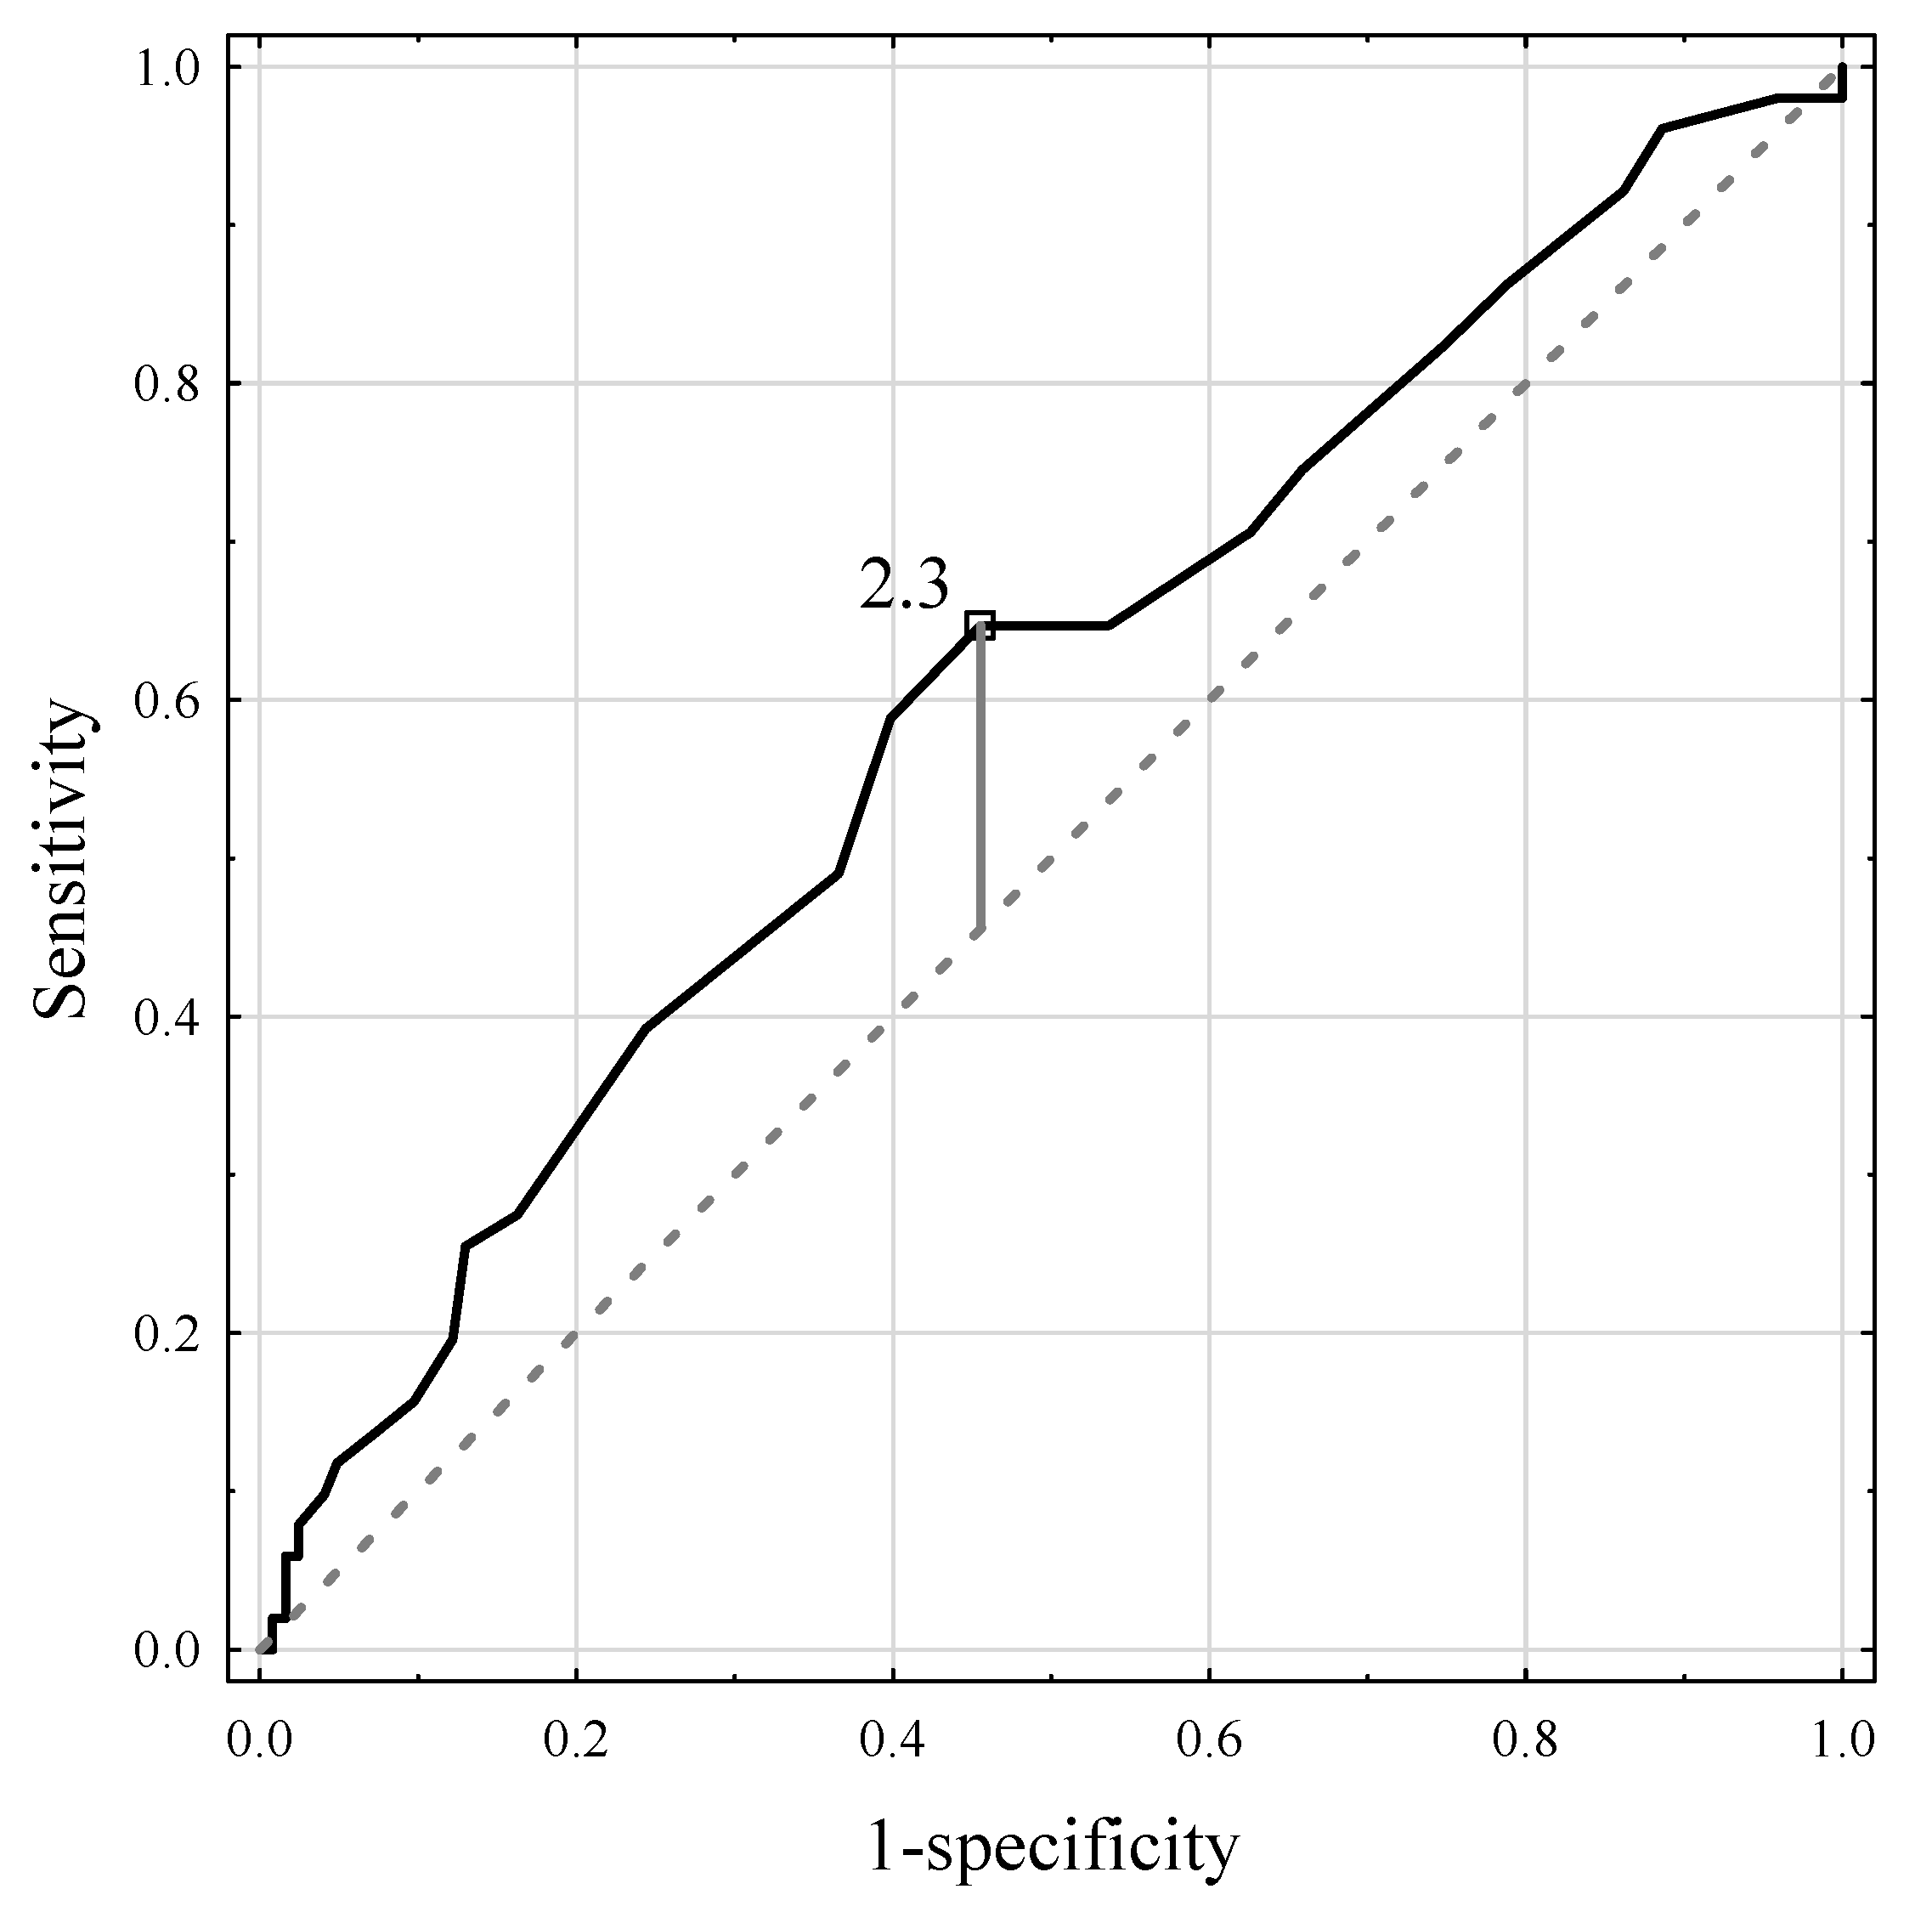
| SAF ≥ 2.3 | 2.54 (1.13–5.08) | 0.008 | - | - |
| Diabetes | 2.95 (1.14–7.62) | 0.026 | - | - |
| Smoking | 2.05 (1.03–4.07) | 0.040 | - | - |
| HCV | 17.30 (2.03–147.84) | 0.009 | 13.66 (1.55–120.62) | 0.019 * |
| HBV | 3.29 (1.19–9.11) | 0.022 | 2.99 (1.02–8.76) | 0.046 * |
Publisher’s Note: MDPI stays neutral with regard to jurisdictional claims in published maps and institutional affiliations. |
© 2022 by the authors. Licensee MDPI, Basel, Switzerland. This article is an open access article distributed under the terms and conditions of the Creative Commons Attribution (CC BY) license (https://creativecommons.org/licenses/by/4.0/).
Share and Cite
Krasnodębski, M.; Morawski, M.; Borkowski, J.; Grąt, K.; Stypułkowski, J.; Skalski, M.; Zhylko, A.; Krawczyk, M.; Grąt, M. Skin Autofluorescence Measurement as Initial Assessment of Hepatic Parenchyma Quality in Patients Undergoing Liver Resection. J. Clin. Med. 2022, 11, 5341. https://doi.org/10.3390/jcm11185341
Krasnodębski M, Morawski M, Borkowski J, Grąt K, Stypułkowski J, Skalski M, Zhylko A, Krawczyk M, Grąt M. Skin Autofluorescence Measurement as Initial Assessment of Hepatic Parenchyma Quality in Patients Undergoing Liver Resection. Journal of Clinical Medicine. 2022; 11(18):5341. https://doi.org/10.3390/jcm11185341
Chicago/Turabian StyleKrasnodębski, Maciej, Marcin Morawski, Jan Borkowski, Karolina Grąt, Jan Stypułkowski, Michał Skalski, Andriy Zhylko, Marek Krawczyk, and Michał Grąt. 2022. "Skin Autofluorescence Measurement as Initial Assessment of Hepatic Parenchyma Quality in Patients Undergoing Liver Resection" Journal of Clinical Medicine 11, no. 18: 5341. https://doi.org/10.3390/jcm11185341