
The Genomic Environment of BRAF Mutated and BRAF/PIK3CA Double Mutated Colorectal Cancers

1
Algoma District Cancer Program, Sault Area Hospital, Sault Ste. Marie, ON P6B 0A8, Canada
2
Section of Internal Medicine, Division of Clinical Sciences, Northern Ontario School of Medicine, Sudbury, ON P6B 0A8, Canada
J. Clin. Med. 2022, 11(17), 5132; https://doi.org/10.3390/jcm11175132
Submission received: 31 July 2022
/
Revised: 23 August 2022
/
Accepted: 29 August 2022
/
Published: 31 August 2022
(This article belongs to the Section Oncology)
Abstract
:Background: Colorectal cancer represents the most prevalent gastrointestinal malignancy. Prognosis of metastatic disease has improved in recent years with the introduction of effective systemic therapies, but mean survival remains in the range of two to three years. Targeted therapies based on specific molecular alterations in sub-sets of colorectal cancers have the potential of contributing to therapeutic progress. BRAF and PIK3CA are oncogenic kinases commonly mutated in colorectal cancers and can be targeted through small molecule kinase inhibitors. Methods: Clinical and genomic data from two extensive series of colorectal cancers were interrogated to define the molecular characteristics of cancers with BRAF mutations with and without concomitant mutations in PIK3CA. Results: Colorectal cancers that are BRAF and PIK3CA double mutants represent a small minority of about 5% of colorectal cancers in the two examined series of mostly localized disease. They also represent about one third of all BRAF mutated colorectal cancers. Most mutations in BRAF are classic V600E mutations. A high prevalence of MSI and CIMP is observed in BRAF mutated colorectal cancers with or without PIK3CA mutations. Mutations in tumor suppressors FBXW7 and ATM display a higher prevalence in BRAF mutated cancers. The prognosis of BRAF mutated colorectal cancers with or without PIK3CA mutations is not significantly different than counterparts with wild type BRAF. This contrasts with the known adverse prognostic effect of BRAF in metastatic disease and relates to the different prevalence of MSI in mutant BRAF localized versus metastatic colorectal cancers. Conclusions: BRAF mutations are the defining molecular alterations in double mutant BRAF and PIK3CA colorectal cancers as determined by increased MSI and CIMP in BRAF subsets with and without PIK3CA mutations. Moreover, BRAF mutated cancers with and without PIK3CA mutations are characterized by the absence of KRAS mutations and a lower prevalence of APC mutations than BRAF wild type counterparts. Mismatch-repair-associated gene mutations display higher frequencies in BRAF mutated colorectal cancers. Despite the absence of prognosis implications of BRAF mutations in the studied cohorts of mostly localized cancers, such mutations could be prognostic in certain subsets. The presence of mutations in other genes, such as ATM and high MSI status present opportunities for combination therapies.
1. Introduction
BRAF is a serine threonine kinase which is part of the RAF/MEK/ERK cascade transducing signals from growth factors for cell proliferation and apoptosis inhibition [1]. Two other RAF homologues, ARAF and CRAF (also known as RAF1), exist in human cells encoded by distinct genes. BRAF is encoded by a gene at human chromosome 7q34 while genes encoding for ARAF and CRAF are located at chromosomes Xp11.3 and 3p25.2, respectively. The three proteins can homodimerize or heterodimerize with another protein of the family [2]. Wild type RAF proteins are activated by RAS to dimerize and phosphorylate kinases of the MEK family which in their turn activate ERK kinases. ERK kinases inhibit apoptosis and promote proliferation by activating transcription factors, the prototypic being the AP1 (Activating Protein 1) complex.
In contrast to other RAF homologues, BRAF is commonly mutated in cancers. The most common canonical mutations at position V600 are currently effectively targeted with small molecule inhibitors in malignant melanoma and other cancers [3]. Mutations in BRAF occur in about 10% of colorectal cancers and have been examined for therapeutic targeting with the same small molecule inhibitors used in melanoma [4]. A BRAF inhibitor is currently approved in combination with the anti-EGFR monoclonal antibody cetuximab for second line treatment of metastatic colorectal cancers with BRAF mutations [5]. However, as shown in the registration trial, only one in five patients respond to therapy, despite all patients bearing the targeted BRAF mutation [6]. Development of resistance leading to progression in responding patients is also the rule [7].
The other signal transduction cascade activated by growth factors and receptor tyrosine kinases is the PI3K/AKT/mTOR cascade. The cascade is triggered through the activation of kinase PI3K by diverse receptor tyrosine kinases, such as the Epidermal Growth Factor Receptor (EGFR) family receptors, the Fibroblast Growth Factor Receptor (FGFR) family receptors, the Platelet-derived Growth Factor Receptor (PGFR), and the Insulin-like Growth Factor Receptor (IGFR) [8]. Production of the lipid phosphatidylinositol-3,4,5-triphosphate in the cell membrane by activated PI3K enables proximity of kinase PDK1, the mTORC2 complex and kinase AKT, resulting in phosphorylation and activation of the latter [9]. AKT has several substrates involved in carcinogenesis and results in the promotion of cell proliferation and apoptosis inhibition. Through down-stream activation of the mTORC1 complex, AKT positively regulates protein translation and cell growth [10,11]. The most common mutation in the PI3K/AKT pathway is in the gene encoding for the alpha catalytic sub-unit of PI3K, PIK3CA, occurring in about one in four colorectal cancers [12]. Half of the activating mutations in PIK3CA occurring in colorectal cancers concern hotspots of amino acid positions E545, E542 and Q546 of the helical domain or position H1047 of the kinase domain, while the other half is distributed across the gene [12]. Mutations in PIK3CA are not mutually exclusive with BRAF mutations and occur in both BRAF mutated and wild type colorectal cancers. Thus, these mutations may play a role in resistance of a subset of BRAF mutated cancers to targeted therapies, through the extensive crosstalk of the KRAS/RAF/MEK/ERK and the PI3K/AKT/mTOR pathways [13,14]. For example, mTORC1 activation by PI3K/AKT provides a feedback inhibition of receptor tyrosine kinase signaling through Insulin Receptor Substrate proteins IRS1 and IRS2 and adaptor protein GRB10 (Growth Factor Receptor Bound protein 10) [15,16]. Other crosstalk points between the pathways are mediated by activation of mTORC1 and inhibition of TSC1 and TSC2 (Tuberous Sclerosis Complex 1 and 2) by MEK kinases and activation of PI3K by KRAS [17].
This paper examines colorectal cancers with BRAF mutations with and without concomitant PIK3CA mutations using data from published genomic studies. A detailed understanding of the molecular processes associated with these distinct subsets of colorectal cancers and additional molecular aberrations that support BRAF mutations in the neoplastic process is needed for improving therapeutic results.
2. Methods
The Cancer Genome Atlas (TCGA) colorectal cancer cohort study and the Dana Farber Cancer Institute (DFCI) cohort, two genomic studies with 594 and 619 included patients, respectively, were included in this analysis and analyzed separately due to differences in the genomic platforms used and different tools for molecular characteristics assignment [18,19]. TCGA includes data on both single nucleotide variants and copy number alterations, while the DFCI study provides only molecular information for single nucleotide variants. Both series used whole-exome sequencing for detection of somatic single nucleotide alterations. A third series including only metastatic colorectal cancers employed a targeted genomic panel and was used for exploration of the prevalence of BRAF mutation in primary versus metastatic site biopsies [20].
The current study used the cBioPortal for Cancer Genomics portal (cBioportal, http://www.cbioportal.org (accessed on 5 May 2022)), an open-source genomics site maintained by MSKCC and other academic institutions, for interrogation of the three studies of interest [21,22]. Subsets of cases with and without BRAF and PIK3CA mutations were examined in cBioportal for pertinent clinical and genomic characteristics. TCGA uses three different pipelines for single nucleotide variant calling, while the DFCI series used the MuTect algorithm [23]. TCGA provides two scores for the evaluation of global chromosomal instability of a sample, the Aneuploidy Score (AS) and the Fraction Genome Altered (FGA) score. AS was derived by summing the number of chromosome arms in each sample that have copy number alterations (gains or losses). A chromosome arm was considered copy number altered, gained, or lost, if there was a somatic copy number alteration in more than 80% of the length of the arm as calculated by the ABSOLUTE algorithm from Affymetrix 6.0 SNP arrays [24]. Chromosomal arms with somatic copy number alterations in 20–80% of the arm length are considered indeterminate (not called) and chromosomal arms with somatic copy number alterations in less than 20% of the arm length are considered not altered. The FGA was derived by source segment files and is calculated by summing the length of segments with log2 greater than 0.2 divided by the total length of all segments measured in the sample. The pathogenic implications of mutations in genes of interest were derived from the OncoKB knowledgebase [25].
Statistical comparisons of categorical and continuous data were carried out with the Fisher’s exact test or the χ2 test and the t-test or ANOVA (Analysis of Variance) test. Survival analysis was performed with construction of Kaplan–Meier survival curves from source data. The log rank test was used to compare Kaplan–Meier survival curves. All statistical comparisons were considered significant if p < 0.05.
3. Results
In total, 22 of 534 profiled colorectal cancer patients in the TCGA cohort (4.1%) had mutations in both BRAF and PIK3CA oncogenes. This represents 35% of the total number of cases (62 cases) with BRAF mutations. A total of 15 of the 22 patients had V600E BRAF mutations (with additional non-classical BRAF mutations in 2 of the 15 patients). Three patients had mutations at codons 594 and 597 of BRAF that are also considered pathogenic (categorized as classes II and III as opposed to codon V600 mutations that are categorized as class I) and 4 patients had other BRAF mutations of unknown significance. In 20 of the 22 patients, PIK3CA mutations that are considered pathogenic were present, while in 2 patients PIK3CA mutations were evaluated as of unknown significance. Three cases had PIK3CA mutations at hotspot amino acid position E545, 1 patient at position E542, and 10 patients had PIK3CA mutations at hotspot position H1047. The six remaining cases with PIK3CA pathogenic mutations were mutations in amino acid positions other than E545, E542, and H1047.
In the DFCI cohort, 35 of 619 patients (5.7%) had mutations in both BRAF and PIK3CA oncogenes. This represented 27.6% of the total number of cases with BRAF mutations in the DFCI cohort. In total, 28 of the 35 patients had classic V600E mutations, while 6 patients had non-classic mutations also considered pathogenic (in 1 patient with two additional mutations of unknown significance) and 1 patient had a BRAF mutation of unknown significance. The most common PIK3CA mutation in BRAF mutated cases were at H1047 but the predominance of H1047 position mutations compared to other classic hotspot positions was less pronounced than in TCGA. Mutations in the hotspot amino acid positions E542 (4 patients), E545 (3 patients), Q546 (6 patients), and H1047 (6 patients) of PIK3CA were present in 19 of 35 BRAF/PIK3CA double mutant patients, and 12 additional patients had pathogenic non-hotspot PIK3CA mutations. Four patients had mutations of unknown significance.
Compared with colorectal cancer patients without BRAF mutations, BRAF mutant colorectal cancer patients in the TCGA cohort presented at a more advanced age (Table 1). This was true independently of whether they had concomitant PIK3CA mutations. However, no significant differences were observed in age at presentation of BRAF mutant colorectal cancer patients in the DFCI cohort (Table 2). BRAF mutant patients and even more so BRAF/PIK3CA double mutant colorectal cancers in TCGA tended to be of earlier stage (stages I and II) than BRAF wild type disease (p = 0.003, Table 1). In the double mutant group, 86.4% of patients presented with stage I or II cancers. This was also observed in the DFCI cohort, where BRAF mutant colorectal cancers with or without concomitant PIK3CA mutations presented less often as stage III or IV than colorectal cancer with both genes on a wild type configuration (Table 2). At odds with TCGA, the group with mutant PIK3CA and wild type BRAF had similar prevalence of stage III and stage IV presentation, compared with the double mutant group in the DFCI cohort. BRAF mutant cancers were located almost exclusively in the colon and rarely in the rectum. Rectal cancers constituted 25.9% and 22.2% of cases in the whole TCGA and DFCI cohorts, respectively.
BRAF mutant cancers were more commonly MSI high or POLE positive. Compared with BRAF mutant/PIK3CA wild type cancers, double mutant cancers were even more often MSI or POLE positive (Table 3). Consistent with the high prevalence of MSI and POLE subtype, BRAF/PIK3CA double mutant colorectal cancers in TCGA had a high Tumor Mutation Burden (TMB) above 200 in 86.4% of cases (Table 3). BRAF mutant cancers with wild type PIK3CA had TMB above 200 in 70% of cases. In the DFCI cohort, 77.1% of BRAF/PIK3CA double mutant colorectal cancers and 65.2% of BRAF mutant cancers with wild type PIK3CA have a TMB above 200 (Table 4). In contrast, in the TCGA cohort, colorectal cancers with wild type BRAF had TMB above 200 in 16.8% of cases when PIK3CA was mutant and in 7.3% of cases when PIK3CA was wild type (Table 3). In the DFCI cohort, colorectal cancers with wild type BRAF had TMB above 200 in 35% of cases when PIK3CA was mutant and in 18.5% of cases when PIK3CA was also wild type (Table 4).
In the metastatic colon cancer study cohort published by MSKCC, with 1099 patients, BRAF mutations were present in 10.8% of patients. Among these patients, about one third or 3.4% of the whole cohort had BRAF and PIK3CA double mutant cancers. Patients in this study, although all with metastatic disease, had genomic evaluation either from a metastatic site biopsy (n = 522) or from the primary tumor (n = 596, a few patients had biopsies from both sites). BRAF mutated cancers evaluated from primary tumor biopsy showed MSI high in 51.9% of samples while in BRAF mutated cancers evaluated from metastatic site biopsies showed MSI high in 11.5% of samples (Fisher’s exact test p = 0.02, Figure 1). These data suggest that, in MSI high BRAF mutated colorectal cancers, metastatic disease develops from clones that have become MSS or had been MSS from the beginning.
BRAF mutant colorectal cancers show a higher prevalence of chromosomal stability as determined by low Aneuploidy Score (AS) and low Fraction of Genome Altered (FGA) score. BRAF/PIK3CA double mutant cancers had higher rates of chromosomal stability than BRAF mutant cancers with wild type PIK3CA (Table 3). On the other hand, BRAF wild type colorectal cancers show higher rates of chromosomal instability (CIN) as determined by higher AS and FGA scores. The most frequent amplified locus in colorectal cancer at chromosome 20q11.21 is observed exclusively in cancers with wild type BRAF, with or without mutations in PIK3CA (in about 10% of cases in TCGA, not shown). The CpG Island Methylator Phenotype (CIMP) is more prevalent in BRAF mutant cancers than in BRAF wild type cancers (Table 4).
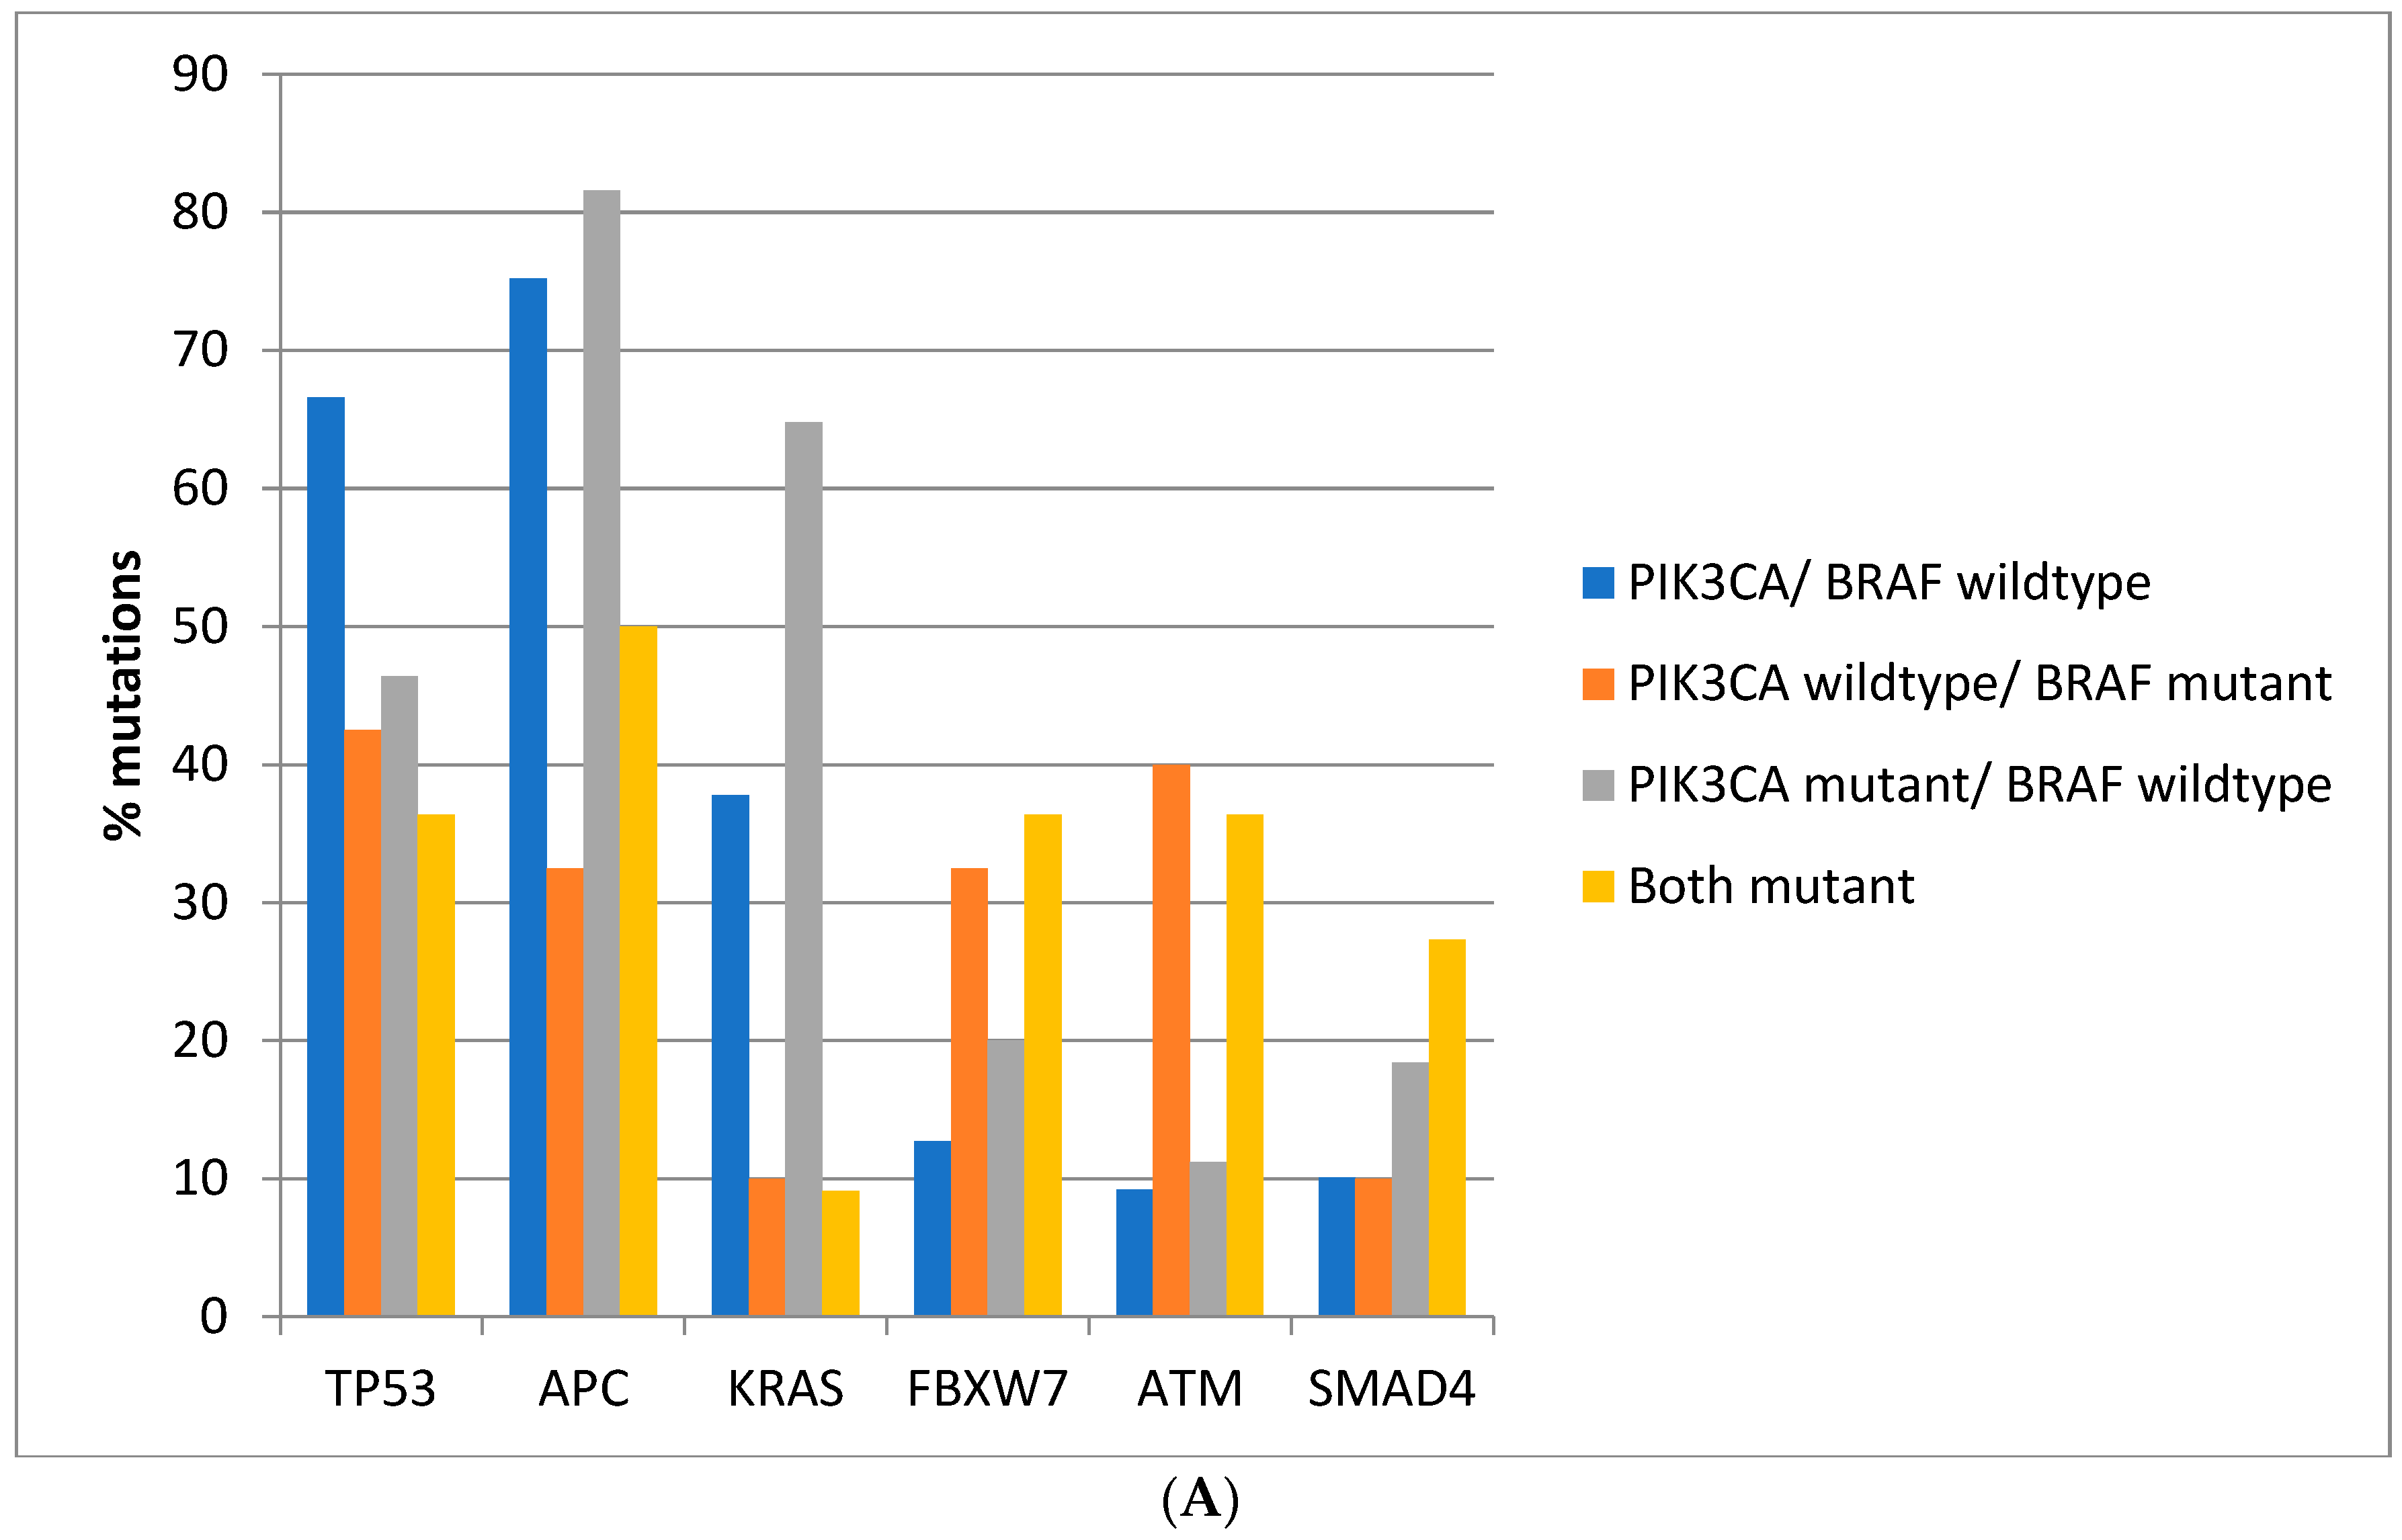
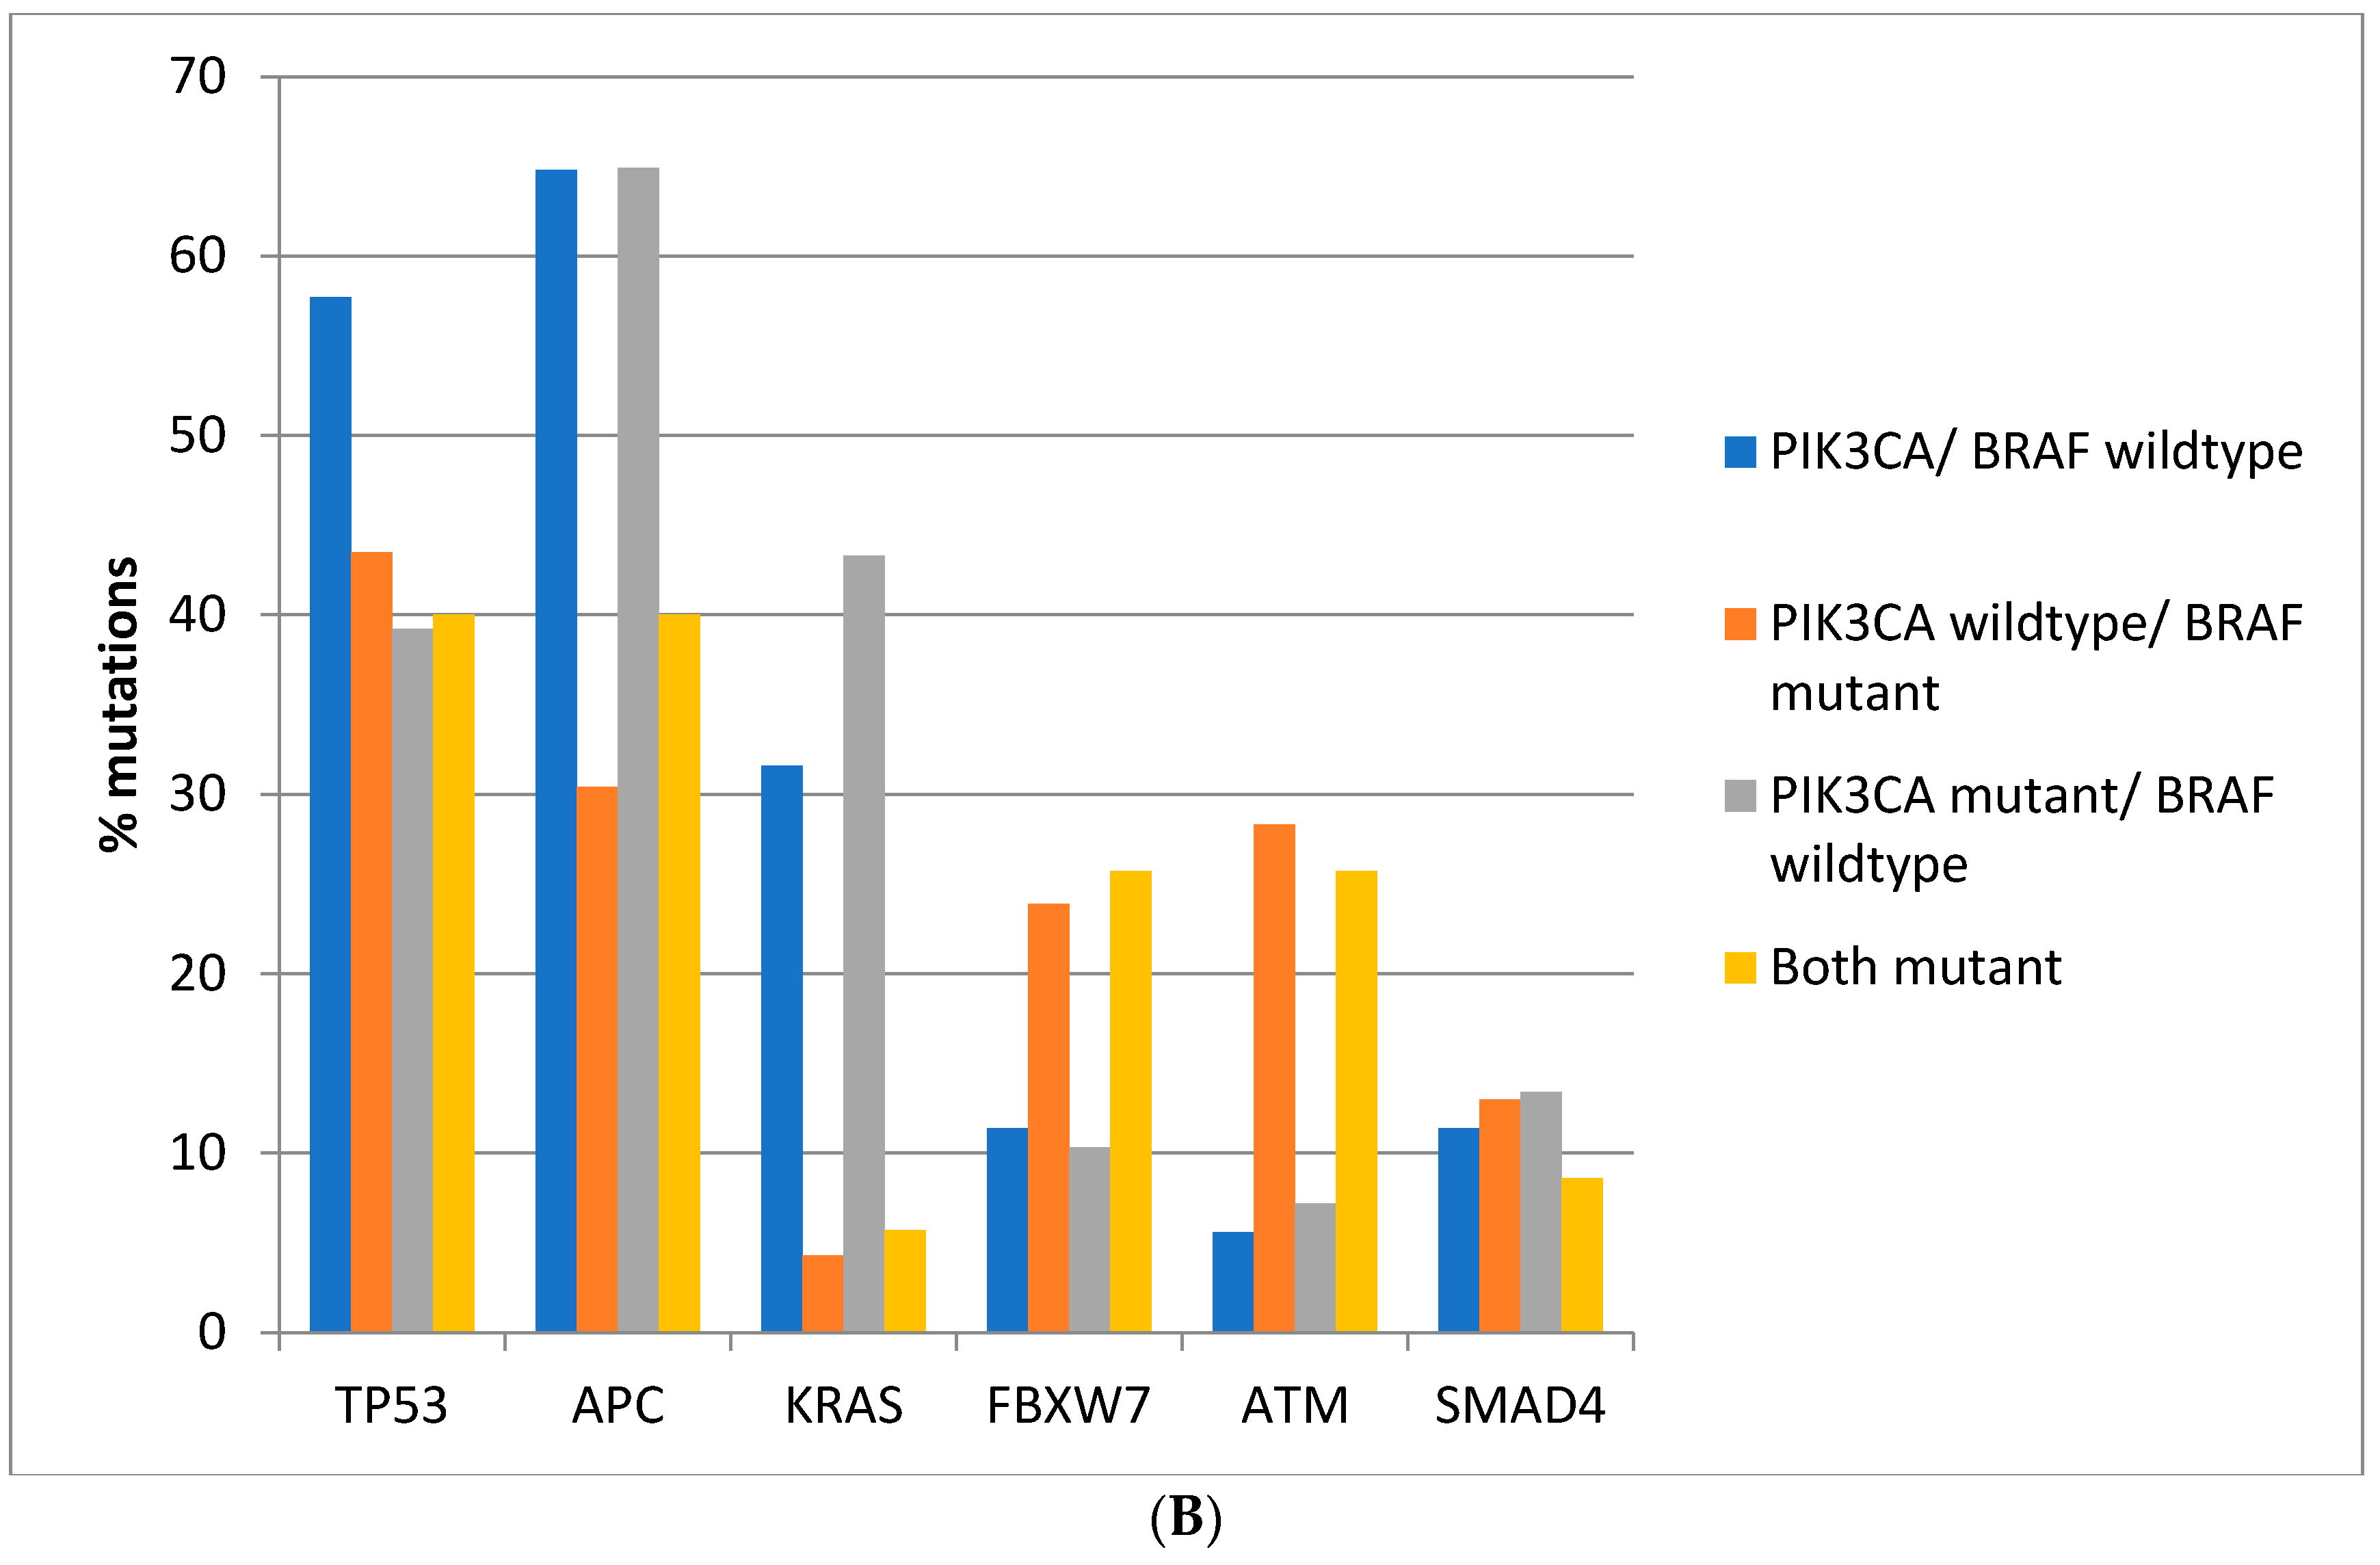
Regarding the prevalence of mutations in other commonly mutated oncogenes and tumor suppressors, there are significant differences between colorectal cancers depending on the presence of BRAF and PIK3CA mutations. Mutations in the tumor suppressor TP53 are more prevalent in colorectal cancers of the TCGA cohort with BRAF and PIK3CA wild type (66.6%) compared with cancers with either or both BRAF and PIK3CA mutated, where mutations in TP53 are encountered in 36.4–46.4% of cases (Fisher’s exact test p < 0.0001, Figure 2A). Similarly, in the DFCI cohort, the prevalence of TP53 mutations was 57.7% in BRAF and PIK3CA wild type cancers and 39.2–43.5% in cancers with either or both BRAF and PIK3CA mutated (Fisher’s exact test p < 0.0001, Figure 2B). Mutations in the tumor suppressor APC are more prevalent in BRAF wild type colorectal cancers independently of the presence or absence of concomitant PIK3CA mutations in both cohorts (Fisher’s exact test p < 0.0001 for the comparisons in both cohorts, Figure 2A,B). Oncogene KRAS mutations are rather rare in BRAF mutant colorectal cancers, occurring in 10% of such cancers in TCGA and in about 5% in the DFCI cohort, compared with 37.8% and 31.6% in cancers with BRAF and PIK3CA wild type and 64.8% and 43.3% of cancers with BRAF wild type and PIK3CA mutations (Figure 2A,B). Tumor suppressor FBXW7 and ATM mutations are more common in BRAF mutant cancers with or without PIK3CA mutations than in BRAF wild type colorectal cancers (Fisher’s exact test p = 0.0004 for FBXW7 and p < 0.0001 for ATM in TCGA and Fisher’s exact test p = 0.0003 for FBXW7 and p < 0.0001 for ATM in the DFCI cohort, Figure 2). SMAD4 mutations show a higher prevalence in BRAF/PIK3CA double mutant cancers of the TCGA cohort but not in cancers with BRAF mutations without PIK3CA mutations. In addition, no significant differences in SMAD4 mutations’ prevalence were observed in the DFCI cohort.
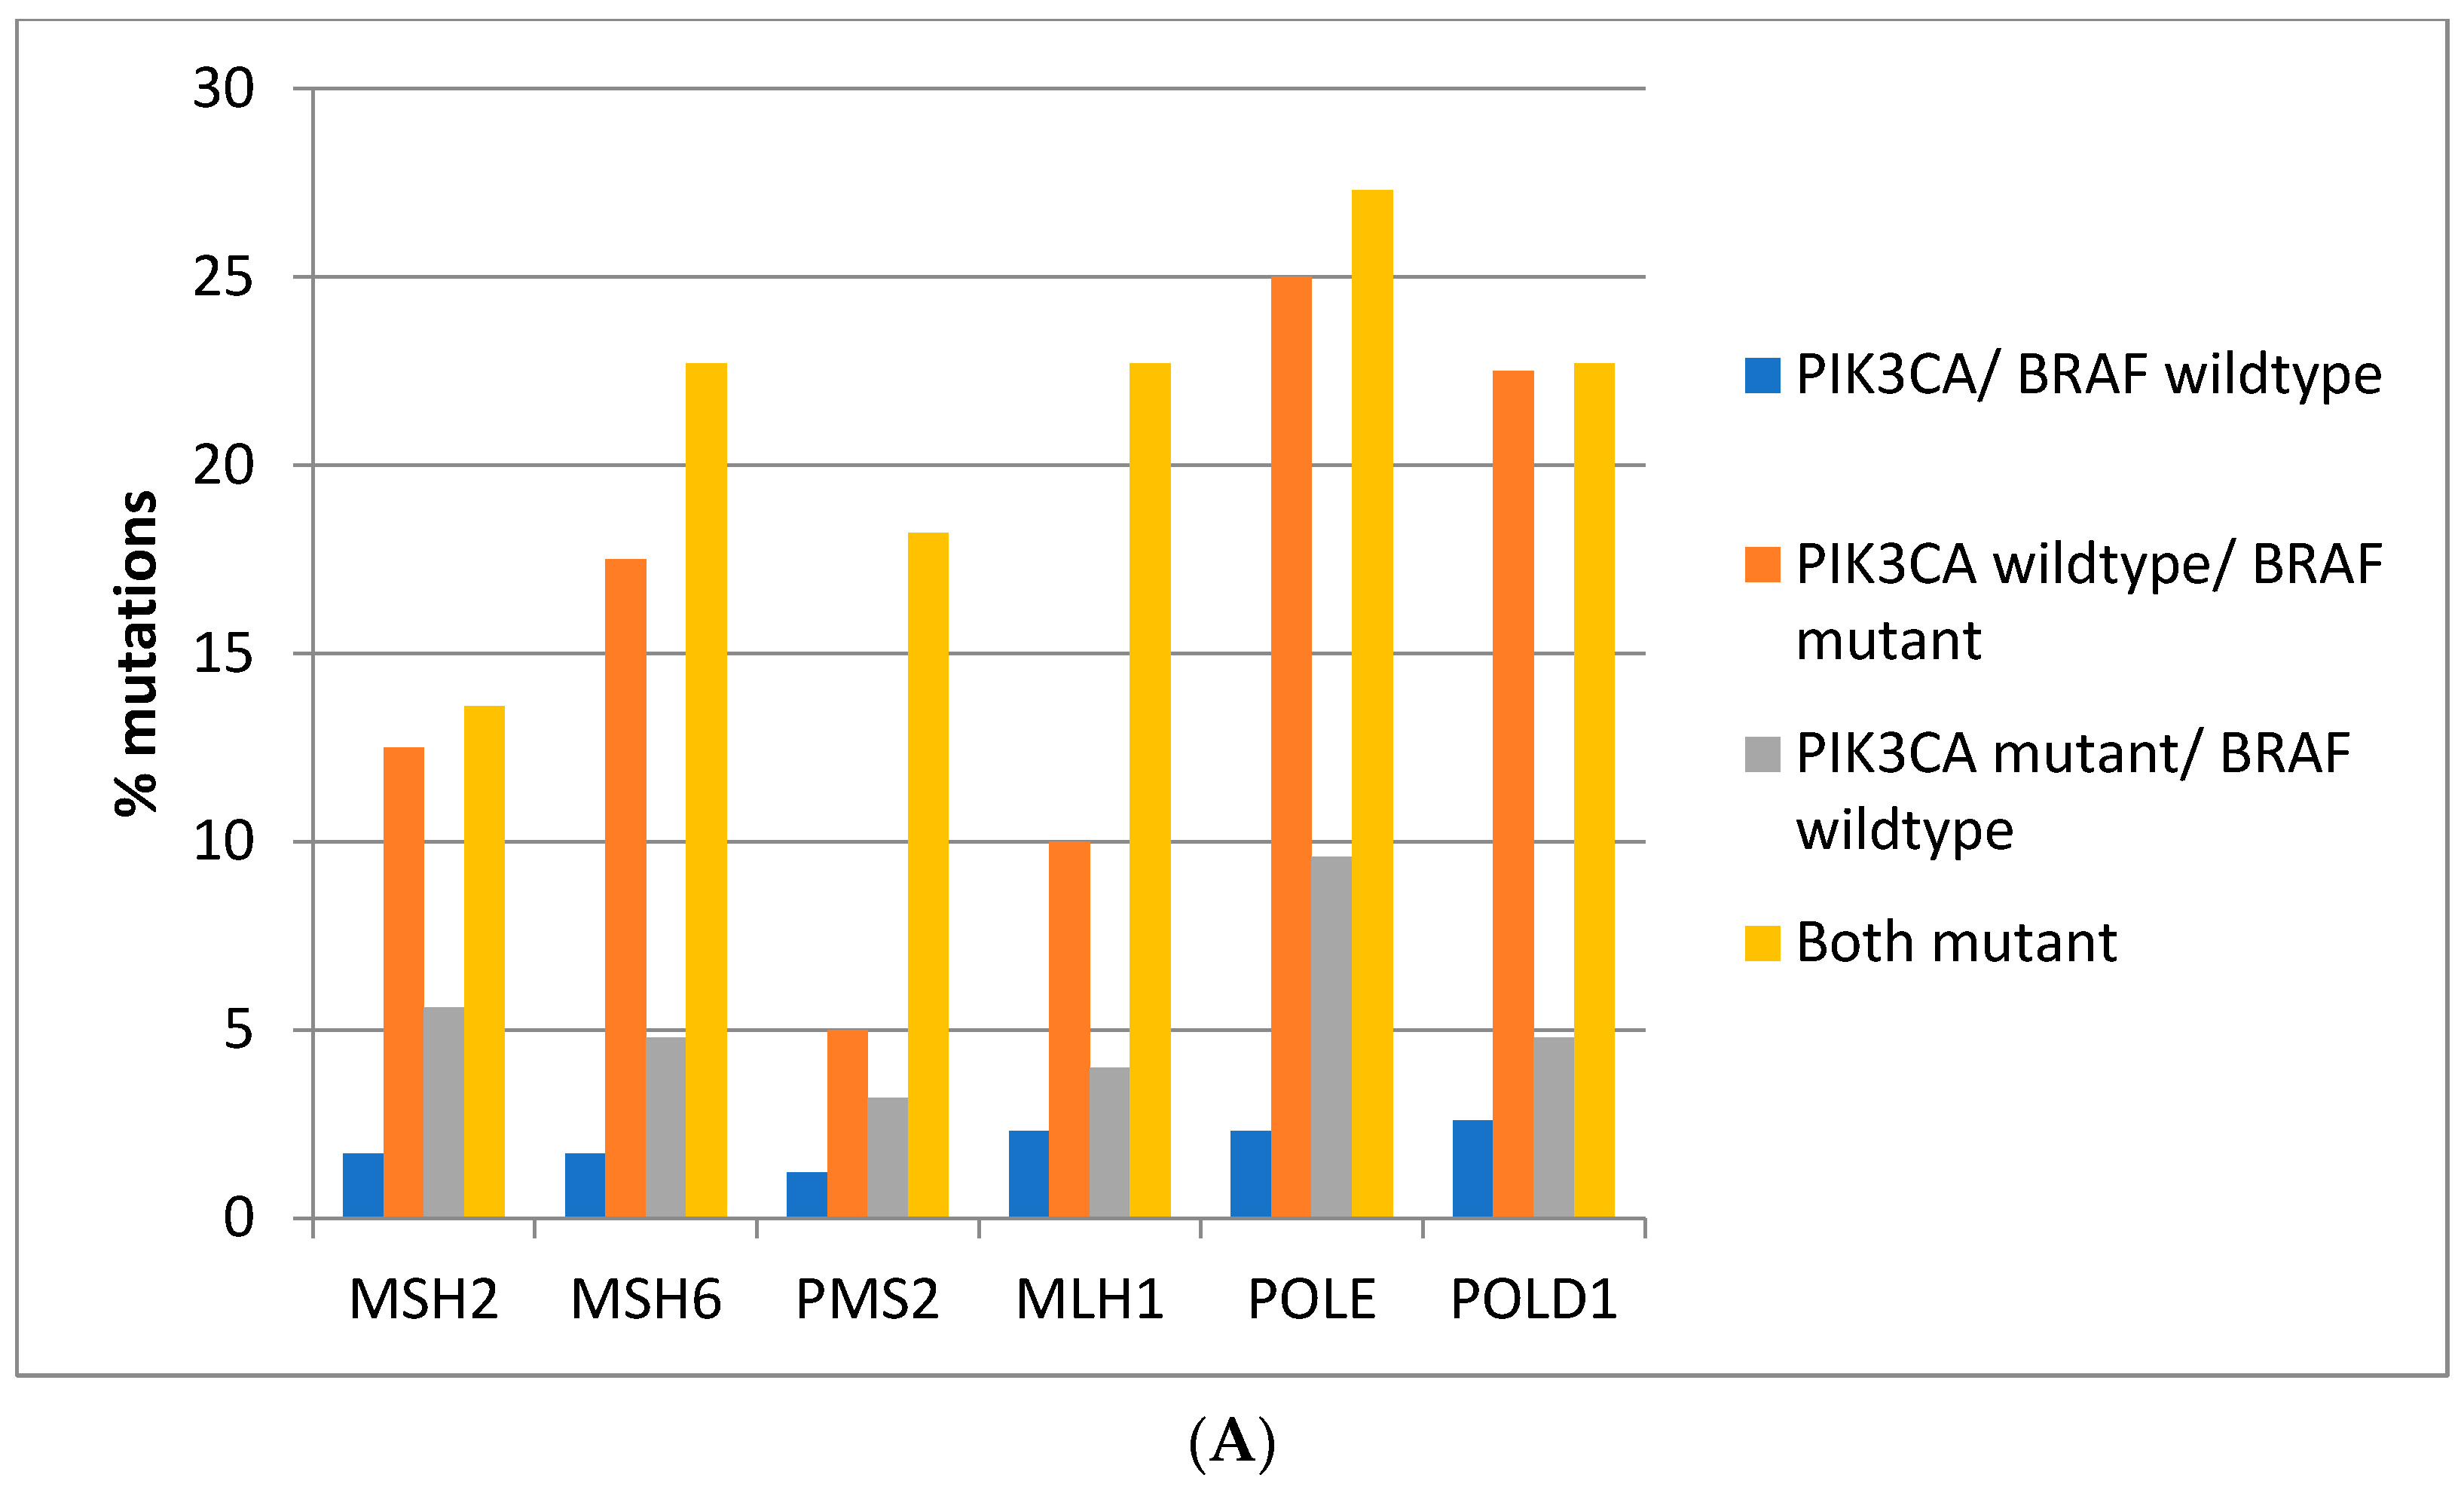
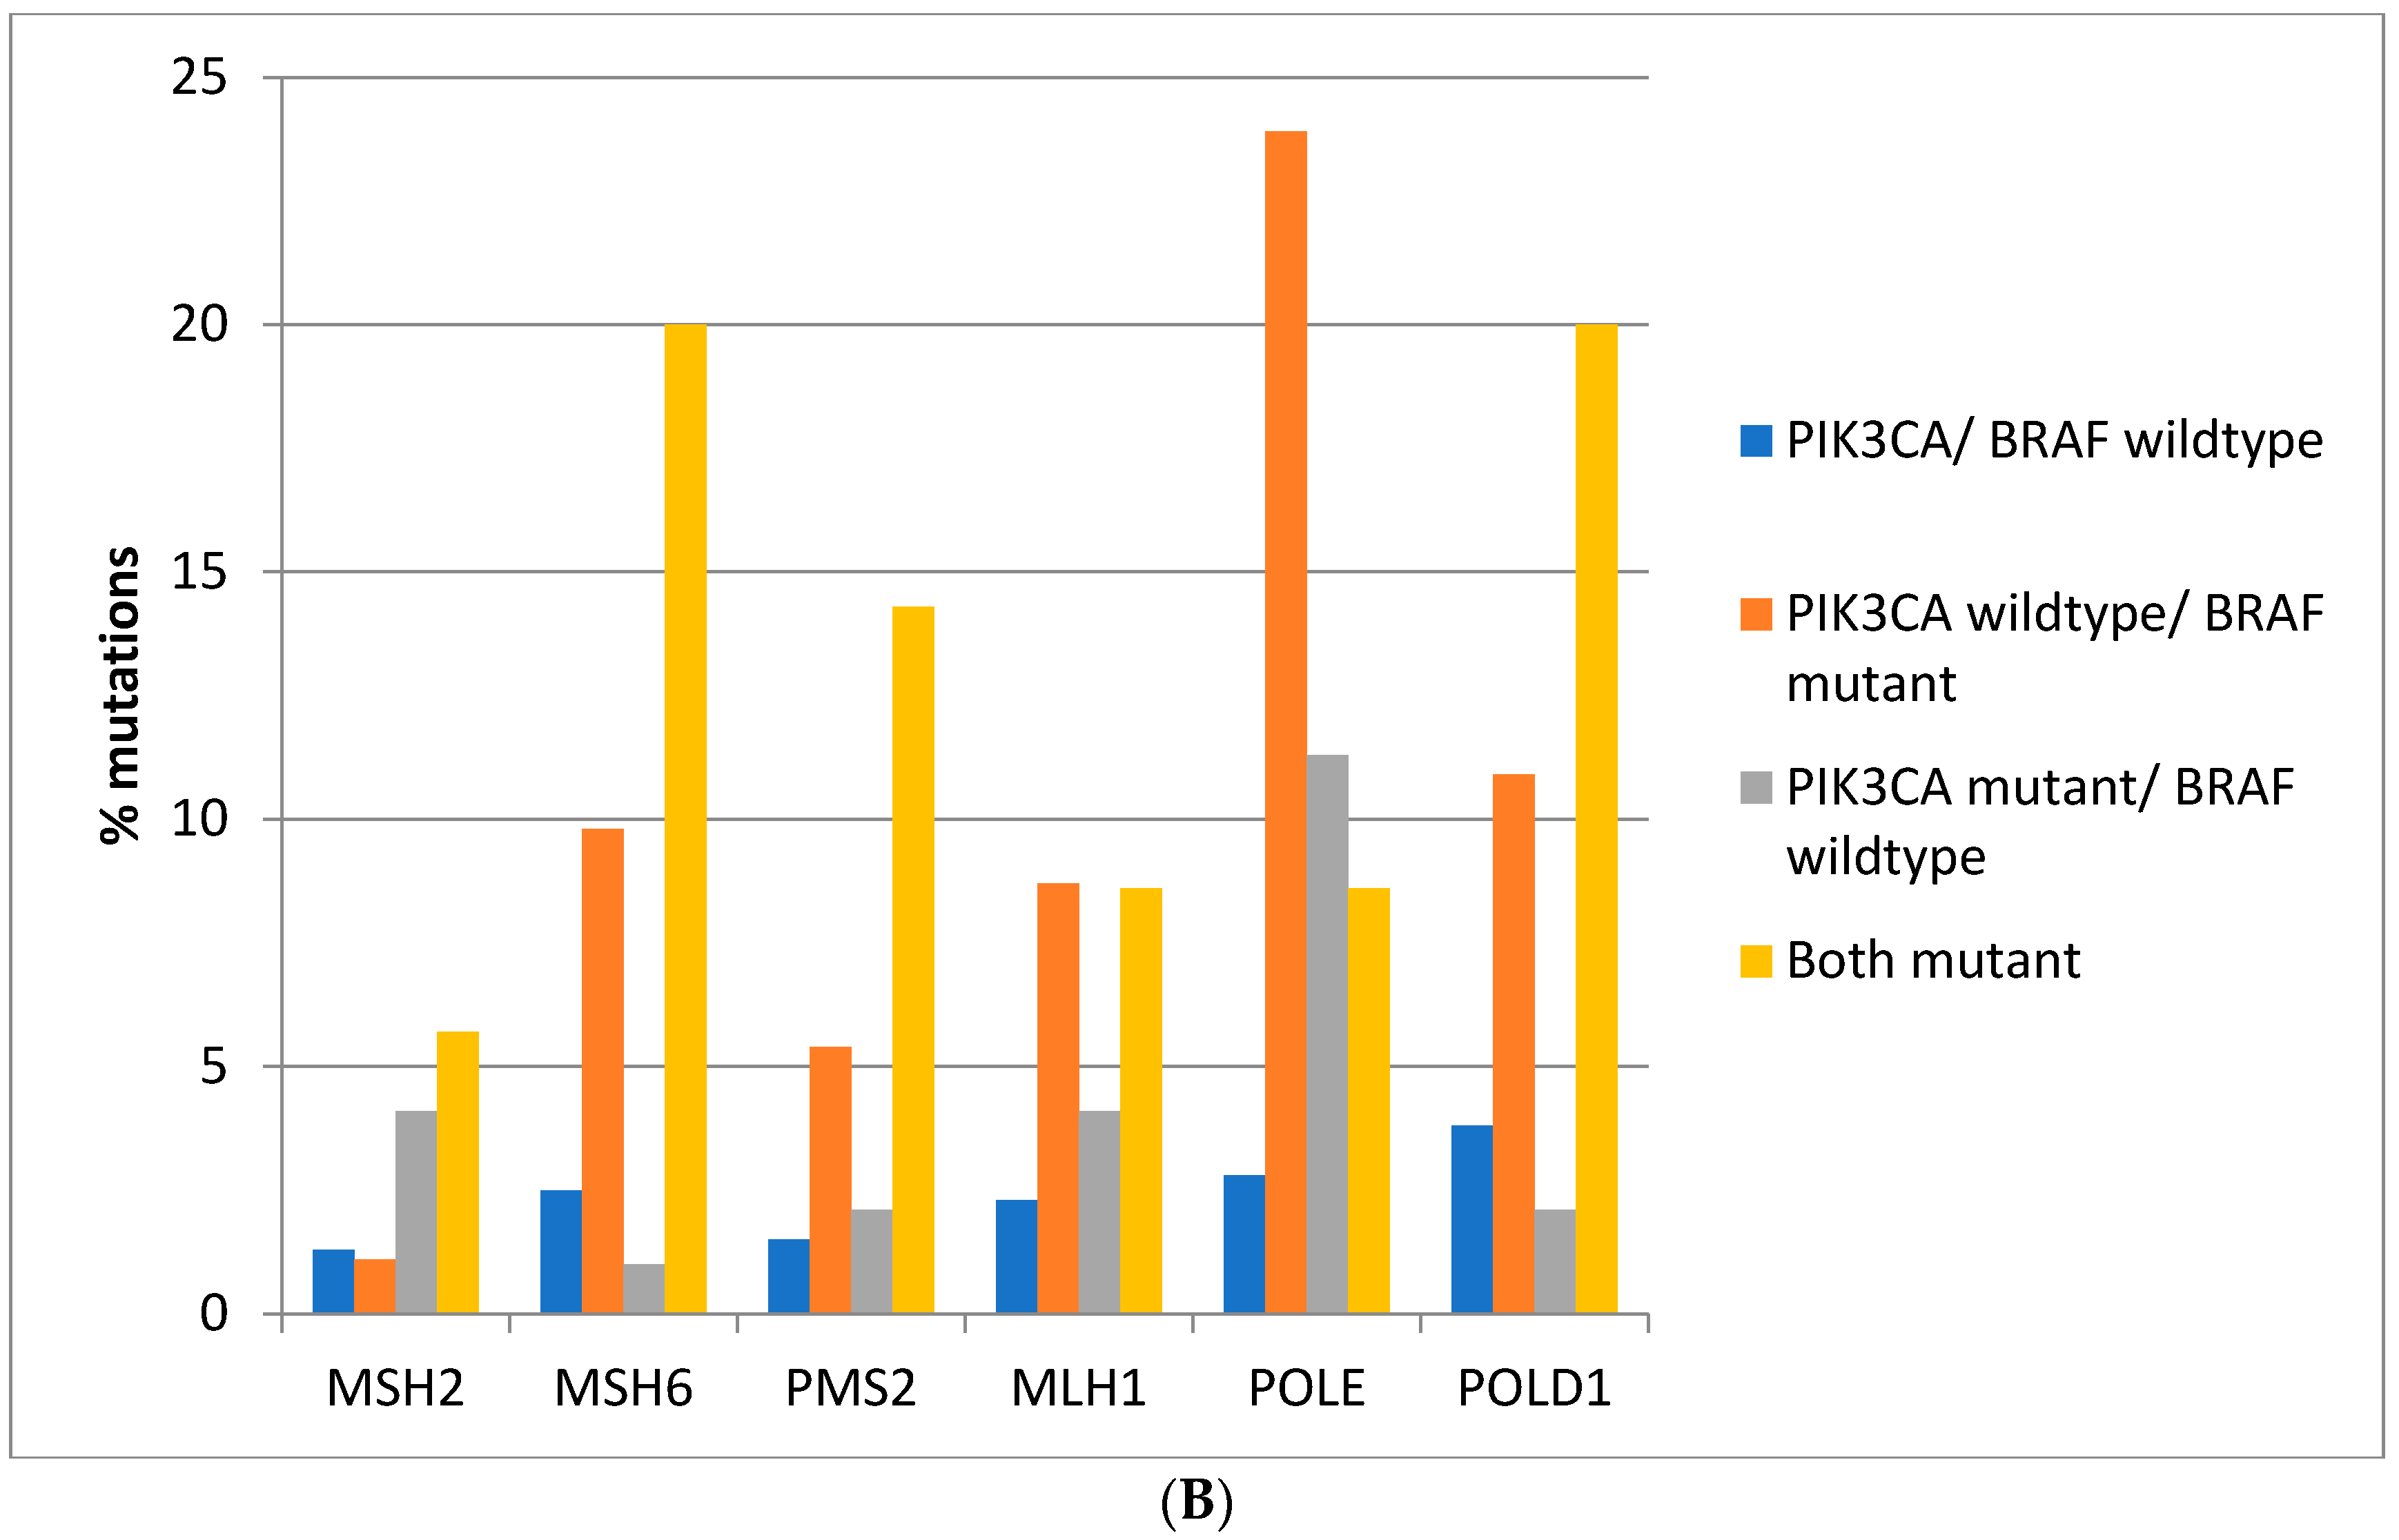
Mutations in the genes associated with MMR (MSH2, MSH6, PMS2, and MLH1) and those encoding for proof-reading polymerases epsilon (POLE) and delta (POLD1) show higher mutation rates in BRAF/PIK3CA double mutant colorectal cancers while cancers with BRAF mutations and PIK3CA wild type display similarly high mutation rates except for PMS2 and MLH1 which show significantly lower mutation rates (Figure 3A). Consistently, in the DFCI cohort, the highest prevalence of MMR/proof-reading polymerases mutations is in double BRAF and PIK3CA mutant colorectal cancers with the exception of POLE which shows the highest mutation prevalence in BRAF mutant cancers without PIK3CA mutations (Figure 3B).
The majority of mutations observed in TCGA and DFCI cohorts in the three most frequently mutated cancer-related genes in colorectal cancer, TP53, KRAS, and APC are oncogenic or likely oncogenic. In the colorectal cancer TCGA cohort, 99.1% of TP53 mutations, 98.7% of KRAS mutations, and 89.7% of APC mutations are deemed oncogenic or likely oncogenic by the OncoKB database. Similarly, in the DFCI cohort, 98.6%, 97.2%, and 89.2% of mutations in TP53, KRAS, and APC are oncogenic or likely oncogenic. The functional implications of other frequent mutations in colorectal cancer, occurring in more than 10% of cases, are shown in Table 5. The oncogenicity or likely oncogenicity of these mutations varies from 15.3% for atypical cadherin gene FAT1 to 84.1% for ubiquitin ligase gene FBXW7, in the entire cohort, while the rest of the observed mutations are variants of unknown significance. Although the number of mutations in individual genes are low, when colorectal cancers are categorized according to BRAF and PIK3CA mutations, the prevalence of oncogenic or likely oncogenic mutations in these genes as a whole is higher in colorectal cancers with both BRAF and PIK3CA wild type (63.4%) than in double mutant cancers (47.3%) or cancers with BRAF mutated and PIK3CA wild type (41.7%) and with PIK3CA mutant and BRAF wild type (49.8%, χ2 p < 0.001, Table 5). However, in the DFCI cohort, although double BRAF and PIK3CA wild type colorectal cancers have a numerically higher prevalence of oncogenic/likely oncogenic mutations in commonly mutated cancer-associated genes (53.8%), the differences from the three other groups (BRAF or PIK3CA mutated or both mutated) were small and borderline statistically insignificant (χ2 p = 0.051, Table 6).
Mutations in genes associated with MMR and encoding for proof-reading polymerases POLE and POLD1 are designated as oncogenic or likely oncogenic in 20–25% of cases and show no significant differences in their oncogenic functional status in the four groups according to BRAF and PIK3CA mutations in either TCGA or DFCI cohorts (Table 7 and Table 8).
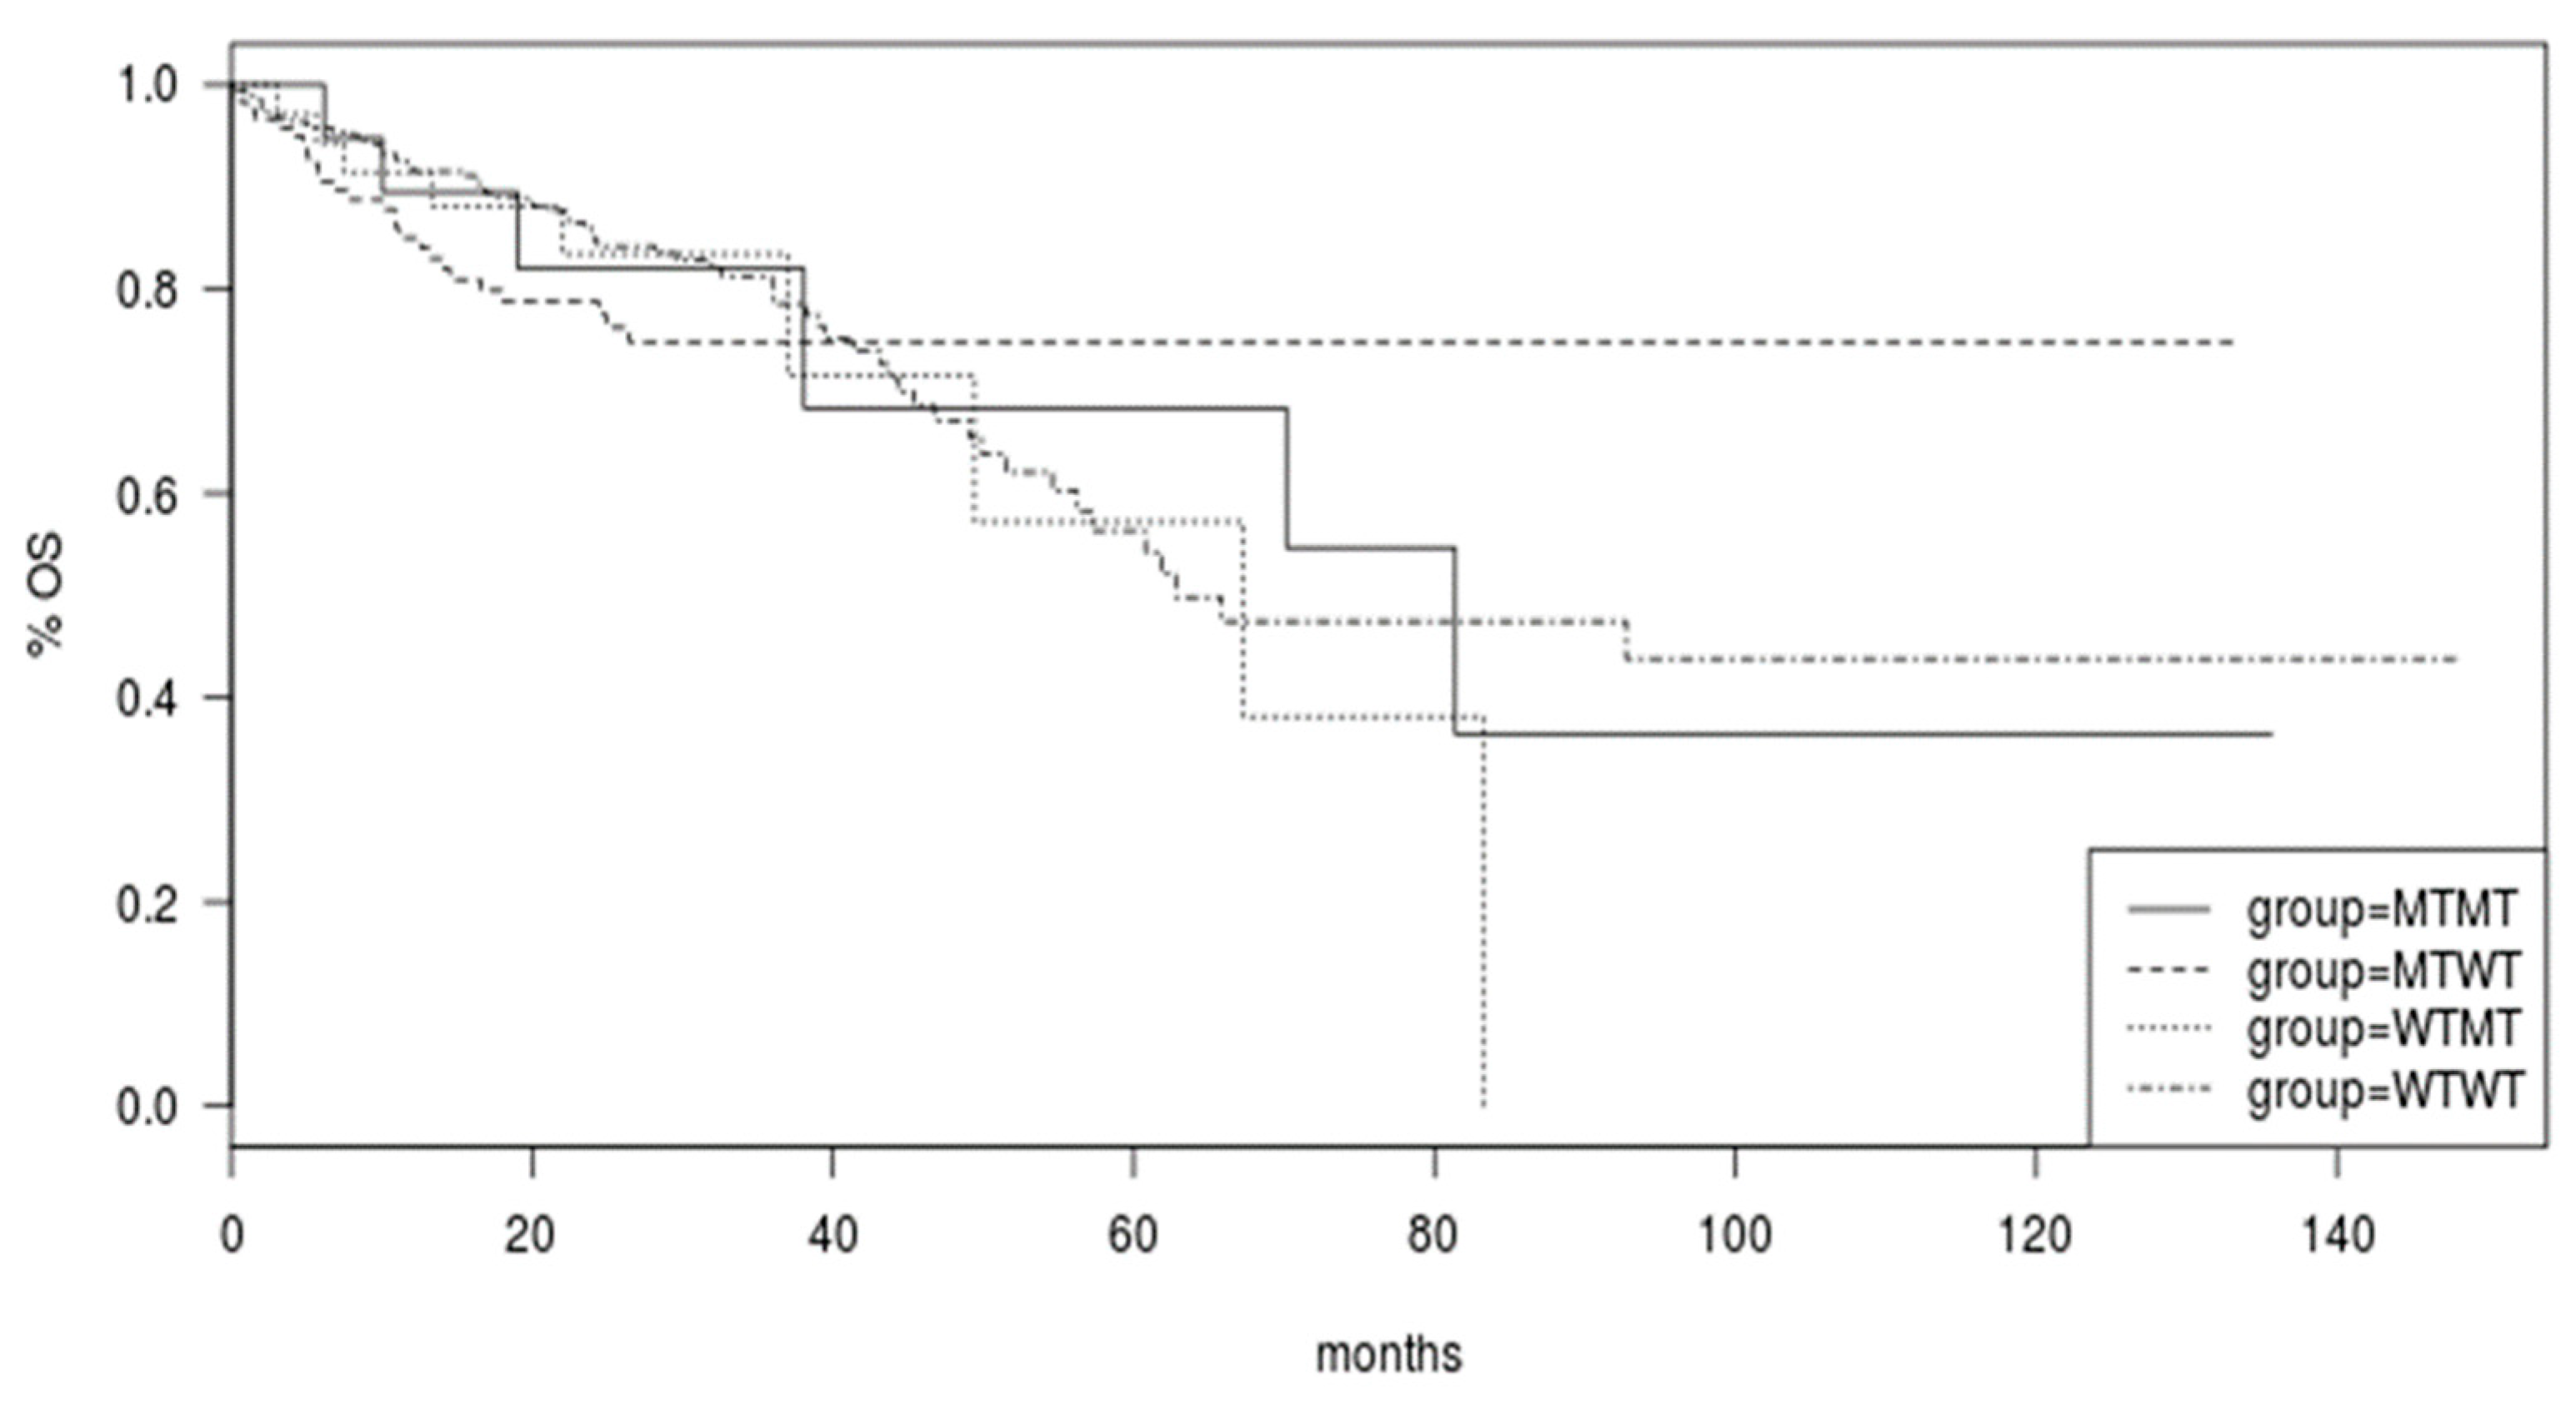
Survival of colorectal cancer patients of the TCGA was not different in the groups with BRAF and PIK3CA mutated or both genes mutated compared with cancers with both genes being wild type (Log Rank p = 0.9, Figure 4).
4. Discussion
BRAF is an oncogenic serine/threonine kinase which is frequently mutated in various cancers. In colorectal cancers, the prevalence of BRAF mutations is 8–12% [26]. The majority of BRAF mutations result in the classical V600E position substitution. In a smaller number of cases, mutations resulting in substitutions on other amino acid positions of the protein, including at positions G469, G496, K601, L597, D594, G596, and G466, are present [27]. While V600E substitutions enable the protein to signal autonomously as a monomer and activate the downstream ERK cascade, alternative substitutions require BRAF homodimerization or heterodimerization with other RAF proteins. At odds with canonical V600E mutations, some alternative site mutations retain dependence to upstream KRAS signals for activation [27].
KRAS mutations are more common than BRAF mutations and are present in 30–40% of colorectal cancers [18]. KRAS codon 12 or 13 mutations are mutually exclusive with BRAF V600 mutations. For example, in a TCGA colorectal study with 534 analyzed cases only one sample had a concomitant KRAS G12D substitution with a BRAF V600E substitution. In the DFCI series, only one of the six KRAS mutations occurring in samples with BRAF mutations was a classic G13D substitution and the concomitant BRAF mutation was a G469E substitution. In contrast to KRAS mutations, mutations of the gene encoding for the catalytic sub-unit alpha of kinase PI3K, PIK3CA, which are common in colorectal cancer are not mutually exclusive with BRAF mutations. Among patients with BRAF mutations, 35.5% of patients in TCGA and 27.5% of patients in the DFCI cohort had concomitant PIK3CA mutations. This prevalence is higher than the overall prevalence of PIK3CA mutations in the two series (27.5% in TCGA and 21.3% in DFCI).
In the current work, using data from TCGA and the DFCI cohorts, it is shown that double mutant BRAF/PIK3CA colorectal cancers and BRAF mutant colorectal cancers without PIK3CA mutations, which represent 4.1% and 7.5% of cases in TCGA and 5.7% and 14.9% of cases in the DFCI cohort, respectively, differ in their clinical and genomic characteristics from the groups of patients without BRAF mutations. BRAF mutations are the defining molecular alteration that links double mutant BRAF/PIK3CA colorectal cancers with MSI, a higher TMB, high CIMP, and low CIN, given that cancers with BRAF mutant/PIK3CA wild type cancers have similar rates of these characteristics without statistically significant differences compared to double mutants. Although not all BRAF mutated colorectal cancers are MSI high, the association of BRAF mutations with MSI and CIMP has been previously reported and MSI is commonly the result of MLH1 suppression through promoter methylation in cancers with BRAF mutations [28]. About 60% of sporadic MSI high colorectal cancers exhibit BRAF mutations [29]. However, the presence of PIK3CA mutations in BRAF mutated colorectal cancers leads to a numeric increase in the prevalence of MSI (from 59.5% to 68.2% in TCGA and from 47.1% to 62.9% in the DFCI cohort). In contrast, colorectal cancers with PIK3CA mutations but without BRAF mutations have statistically significant lower MSI, TMB, and CIMP rates and higher CIN rates compared with double mutants.
Despite different platforms used in the two studied cohorts, molecular alterations observed are consistent between them, with few differences. One such difference is in the mutation rate of tumor suppressor SMAD4, which showed a higher prevalence in double mutant cancers in TCGA but not in the DFCI cohort, where all four groups had similar SMAD4 mutation rates. SMAD4 loss of function has been implicated in the serrated pathway of colorectal carcinogenesis where BRAF mutations are also present [30]. In a mouse model of colorectal carcinogenesis in vivo, BRAF V600E mutations in intestinal stem cells promote differentiation and require inactivation of SMAD4 or of intestinal differentiation transcription factor CDX2 for efficient tumor formation [31]. SMAD4 inactivation has been suggested as an important molecular event in the group of BRAF mutated serrated carcinomas that are microsatellite stable [30]. However, mutations of SMAD4 occur only in a minority of BRAF mutated colorectal cancers and accumulation of alternative lesions may be needed to advance BRAF-associated carcinogenesis. Indeed, activation of the WNT/β-catenin pathway is required even in the presence of SMAD4 inactivation in BRAF-associated colorectal cancers [30]. Given that the prevalence of APC mutations is shown to be lower in BRAF mutated colorectal cancers, alternative modes of pathway activation are at play and may involve inhibition of kinase GSK3 through PI3K/AKT signaling [32,33]. Thus, concomitant PIK3CA mutations could provide the required WNT/β-catenin pathway activation in BRAF mutated cancers.
BRAF mutations are used as biomarkers of therapy guidance in metastatic colorectal cancer based on the results of the phase III randomized BEACON trial [5]. This trial established that the combination of the BRAF inhibitor encorafenib with EGFR monoclonal antibody cetuximab was superior to chemotherapy in pretreated patients with metastatic colorectal cancer bearing BRAF V600E mutations. The study included a triplet arm with the MEK inhibitor binimetinib in addition to encorafenib and cetuximab which had a higher overall response rate than the doublet arm (26.8% versus 19.5% in the doublet arm). Despite that, median overall survival (OS) was 9.3 months in both targeted therapies arms [6]. Median OS was 5.9 months in the control arm treated with chemotherapy. Thus, the encorafenib with cetuximab doublet is the preferred second line treatment for metastatic colorectal cancers with V600E BRAF mutations. Besides showing that MEK inhibition with binimetinib has no benefit for OS, the BEACON results establish that pretreated patients with BRAF mutations have short survivals even with the improved outcomes provided by the targeted treatment. It is worth noting that only 10% of the patients that participated in BEACON had MSI high cancers compared with a prevalence of MSI exceeding 50% in BRAF mutant colorectal cancers of the TCGA and DFCI cohorts. Similarly, in a “real life” cohort of BRAF mutant metastatic colorectal cancers treated with targeted therapies as used in the BEACON trial in several Italian centers, the prevalence of MSI or Mismatch Repair deficiency was 15% [34]. This suggests that MSS cancers are enriched in the metastatic setting and that MSI-associated BRAF mutated cancers progress less often to a metastatic stage. Consistently, data from a metastatic cohort, presented here, confirm that BRAF mutations in biopsies from the patients’ primary tumor display MSI high in 37.8% of cases while biopsies from metastatic sites in similar BRAF mutated cancer patients from the same cohort showed MSI high in 11.5% of cases. The prevalence of high TMB, in the range associated with putative responses to immune checkpoint inhibitors, is also lower in metastatic BRAF mutated cancers, when evaluated from biopsy samples of metastatic sites compared with samples from biopsies of the primary tumor [20]. In contrast, MSI high, BRAF mutated cancers have in general a better prognosis [35,36]. In patients with stage III colorectal cancers who participated in the NCCTG N0147 trial, event-free survival (EFS) of the group with BRAF mutations and MMR deficiency was similar to cancers with MMR proficiency and no BRAF or KRAS mutations, while EFS of proficient for MMR cancers with BRAF mutations was inferior [35]. OS is also inferior in stage III BRAF mutant MSS colorectal cancers compared to MSS colorectal cancers with wild type BRAF, but no difference dependent on BRAF status is present in MSI high cancers [37]. In addition, in metastatic colorectal cancer patients participating in four trials, BRAF mutations were associated with worse PFS and OS in MMR proficient but not in MMR deficient cancers [36].
BRAF mutant cancers have been divided in two subsets, based on unsupervised genomic clustering, that do not correlate with their MSI status or PIK3CA mutation status [38]. One of the sub-types called BM1 displays activation of KRAS/AKT and mTOR/protein translation pathways as well as features of epithelial to mesenchymal transition. The other sub-type BM2, which is more frequent, presents deregulation of cell cycle checkpoints as the main feature [38]. Despite the lack of association of this clustering directly with the presence of concomitant mutations in PIK3CA, the fact that the BM1 sub-type includes activation of the pathway among its defining characteristics suggests that this activation, independently of the specific nature of the underlying molecular lesion(s) producing it, is important in the pathogenesis of this BRAF mutated sub-set. Moreover, in some cancers of the BM2 sub-type the presence of PIK3CA mutations is not sufficient to activate the KRAS/AKT and mTOR/protein translation pathways. Despite the key function of PI3K/AKT/mTOR activity in a sub-set of BRAF mutated colorectal cancers, few trials have attempted to target the pathway in these cancers or to systematically exploit therapeutically the sub-set with concomitant BRAF and PIK3CA mutations. A phase Ib trial of encorafenib, cetuximab with or without alpelisib in 54 metastatic BRAF mutated colorectal cancer patients showed no significant difference in median PFS which was 3.7 months with the dual combination and 4.2 moths with the addition of alpelisib [39]. A next generation sequence analysis which was performed in a subset of 21 patients (13 patients in the doublet arm and 8 patients in the triplet arm) showed that 3 of 7 patients (2 in the triplet arm and 1 patient in the doublet arm) with median PFS around or longer than 6 months had concomitant mutations in PIK3CA while none of 14 patients with median PFS shorter than 6 months had such mutations [39].
An additional key observation of the current report is that BRAF mutated colorectal cancers with or without PIK3CA mutations display lower prevalence of APC mutations than colorectal cancers with wild type BRAF. Moreover, BRAF mutated colorectal cancers with or without PIK3CA mutations, as well as PIK3CA mutated cancers without BRAF mutations possess lower mutation rates of TP53, suggesting that activation of either or both oncogenes decrease pressure for disabling of TP53 in colorectal cancer cells. A negative correlation of PIK3CA mutations and TP53 mutations was also observed in a recently published series, which did not examine BRAF mutations [40]. In contrast to APC and TP53, the prevalence of mutations in tumor suppressors FBXW7 and ATM is higher in BRAF mutated cancers. A high prevalence of ATM mutations is observed in BRAF mutated colorectal cancers in both TCGA and DFCI cohorts. In TCGA, ATM mutations are present in 40% of cases with PIK3CA wild type and in 36.4% of cases with PIK3CA mutations. In the DFCI cohort, ATM mutations are present in 28.3% of cases with PIK3CA wild type and in 25.7% of cases with PIK3CA mutations. The prevalence of ATM mutations in the entire TCGA and DFCI cohorts is 13.1 % and 10.3%, respectively. Other series have shown an ATM mutation prevalence of 15% in metastatic colorectal cancer but no increased prevalence in BRAF mutated cases compared to BRAF wild type metastatic colorectal cancers [41]. This suggests that ATM mutations in BRAF mutated colorectal cancers are associated with a better prognosis sub-group such as MSI high. Indeed, 21 of 24 BRAF and ATM mutated colorectal cancers (87.5%) in TCGA are MSI or POLE subtype while among BRAF mutated, in ATM wild type cancers only 55.3% belong to these subtypes (Fisher’s exact test p = 0.01). In total, 20 of the 24 ATM mutations (83.3%) in BRAF mutated colorectal cancers are categorized as likely oncogenic. In addition to ATM, other genes related to DNA damage response (DDR) are mutated in smaller percentages of colorectal cancers and show a predilection for BRAF mutated cancers. Mutations in DDR involved genes leading to homologous recombination defects sensitized to PARP inhibitors [42]. In colorectal cancer, a phase II trial examining the PARP inhibitor olaparib as monotherapy in pretreated metastatic colorectal cancer patients showed no responses in either MSI or MSS disease [43]. A phase I trial of olaparib in combination with irinotecan in unselected metastatic colorectal cancer patients showed also no responses and 9 of 25 patients had stable disease as the best response [44]. The olaparib/irinotecan combination was used in a heavily pretreated metastatic colorectal cancer patient with an ATM mutation who obtained stable disease for 3 months with a longer clinical and serologic markers improvement [45]. Although PARP inhibitors in unselected colorectal cancer patients seem to have minimal activity, study of specific molecular subsets and of combinations with other targeted treatments deserve consideration. Combinations with BRAF inhibitors in BRAF mutated cancers with ATM mutations or other homologous recombination defects could be a prime target.
In conclusion, the current study shows that the complex landscape of BRAF mutated colorectal cancer with or without concomitant PIK3CA mutations offers several leads for therapeutic targeting to improve outcomes of this subset of metastatic cancer patients associated with adverse survival. Newer BRAF inhibitors in development which avoid the paradoxical activation of wild type BRAF mediated by current inhibitors in use are also expected to advance therapeutics of these difficult to treat, resistant cancers [46].
Funding
This research received no external funding.
Institutional Review Board Statement
Due to the retrospective nature of the data, no ethical review and approval were required or obtained for the performance of this study.
Informed Consent Statement
Not applicable.
Data Availability Statement
No additional data beyond the data presented in the manuscript are available.
Conflicts of Interest
The author declares no conflict of interest.
References
- Caputo, F.; Santini, C.; Bardasi, C.; Cerma, K.; Casadei-Gardini, A.; Spallanzani, A.; Andrikou, K.; Cascinu, S.; Gelsomino, F. BRAF-Mutated Colorectal Cancer: Clinical and Molecular Insights. Int. J. Mol. Sci. 2019, 20, 5369. [Google Scholar] [CrossRef] [PubMed]
- Cook, F.A.; Cook, S.J. Inhibition of RAF dimers: It takes two to tango. Biochem. Soc. Trans. 2021, 49, 237–251. [Google Scholar] [CrossRef] [PubMed]
- Roskoski, R., Jr. Targeting oncogenic Raf protein-serine/threonine kinases in human cancers. Pharmacol. Res. 2018, 135, 239–258. [Google Scholar] [CrossRef] [PubMed]
- Grothey, A.; Fakih, M.; Tabernero, J. Management of BRAF-mutant metastatic colorectal cancer: A review of treatment options and evidence-based guidelines. Ann. Oncol. 2021, 32, 959–967. [Google Scholar] [CrossRef] [PubMed]
- Kopetz, S.; Grothey, A.; Yaeger, R.; Van Cutsem, E.; Desai, J.; Yoshino, T.; Wasan, H.; Ciardiello, F.; Loupakis, F.; Hong, Y.S.; et al. Encorafenib, Binimetinib, and Cetuximab in BRAF V600E–Mutated Colorectal Cancer. N. Engl. J. Med. 2019, 381, 1632–1643. [Google Scholar] [CrossRef] [PubMed]
- Tabernero, J.; Grothey, A.; Van Cutsem, E.; Yaeger, R.; Wasan, H.; Yoshino, T.; Desai, J.; Ciardiello, F.; Loupakis, F.; Hong, Y.S.; et al. Encorafenib Plus Cetuximab as a New Standard of Care for Previously Treated BRAF V600E–Mutant Metastatic Colorectal Cancer: Updated Survival Results and Subgroup Analyses from the BEACON Study. J. Clin. Oncol. 2021, 39, 273–284. [Google Scholar] [CrossRef]
- Huijberts, S.C.F.A.; Boelens, M.C.; Bernards, R.; Opdam, F.L. Mutational profiles associated with resistance in patients with BRAFV600E mutant colorectal cancer treated with cetuximab and encorafenib +/− binimetinib or alpelisib. Br. J. Cancer 2021, 124, 176–182. [Google Scholar] [CrossRef]
- Manning, B.D.; Toker, A. AKT/PKB Signaling: Navigating the Network. Cell 2017, 169, 381–405. [Google Scholar] [CrossRef]
- Saxton, R.A.; Sabatini, D.M. mTOR Signaling in Growth, Metabolism, and Disease. Cell 2017, 168, 960–976. [Google Scholar] [CrossRef]
- Battaglioni, S.; Benjamin, D.; Wälchli, M.; Maier, T.; Hall, M.N. mTOR substrate phosphorylation in growth control. Cell 2022, 185, 1814–1836. [Google Scholar] [CrossRef]
- Stefani, C.; Miricescu, D.; Stanescu-Spinu, I.-I.; Nica, R.I.; Greabu, M.; Totan, A.R.; Jinga, M. Growth Factors, PI3K/AKT/mTOR and MAPK Signaling Pathways in Colorectal Cancer Pathogenesis: Where Are We Now? Int. J. Mol. Sci. 2021, 22, 10260. [Google Scholar] [CrossRef] [PubMed]
- Voutsadakis, I.A. The Landscape of PIK3CA Mutations in Colorectal Cancer. Clin. Colorectal Cancer 2021, 20, 201–215. [Google Scholar] [CrossRef] [PubMed]
- Fruman, D.A.; Chiu, H.; Hopkins, B.D.; Bagrodia, S.; Cantley, L.C.; Abraham, R.T.; Fruman, D.A.; Chiu, H.; Hopkins, B.D.; Bagrodia, S.; et al. The PI3K Pathway in Human Disease. Cell 2017, 170, 605–635. [Google Scholar] [CrossRef] [PubMed]
- Voutsadakis, I.A. Pathogenesis of colorectal carcinoma and therapeutic implications: The roles of the ubiquitin?proteasome system and Cox-2. J. Cell. Mol. Med. 2007, 11, 252–285. [Google Scholar] [CrossRef]
- Hsu, P.P.; Kang, S.A.; Rameseder, J.; Zhang, Y.; Ottina, K.A.; Lim, D.; Peterson, T.R.; Choi, Y.; Gray, N.S.; Yaffe, M.B.; et al. The mTOR-Regulated Phosphoproteome Reveals a Mechanism of mTORC1-Mediated Inhibition of Growth Factor Signaling. Science 2011, 332, 1317–1322. [Google Scholar] [CrossRef]
- Moench, R.; Grimmig, T.; Kannen, V.; Tripathi, S.; Faber, M.; Moll, E.-M.; Chandraker, A.; Lissner, R.; Germer, C.-T.; Waaga-Gasser, A.M.; et al. Exclusive inhibition of PI3K/Akt/mTOR signaling is not sufficient to prevent PDGF-mediated effects on glycolysis and proliferation in colorectal cancer. Oncotarget 2016, 7, 68749–68767. [Google Scholar] [CrossRef]
- Mendoza, M.C.; Er, E.E.; Blenis, J. The Ras-ERK and PI3K-mTOR pathways: Cross-talk and compensation. Trends Biochem. Sci. 2011, 36, 320–328. [Google Scholar] [CrossRef]
- The Cancer Genome Atlas (TCGA) Research Network. Comprehensive molecular characterization of human colon and rectal cancer. Nature 2012, 487, 330–337. [Google Scholar] [CrossRef]
- Giannakis, M.; Mu, X.J.; Shukla, S.A.; Qian, Z.R.; Cohen, O.; Nishihara, R.; Bahl, S.; Cao, Y.; Amin-Mansour, A.; Yamauchi, M.; et al. Genomic Correlates of Immune-Cell Infiltrates in Colorectal Carcinoma. Cell Rep. 2016, 15, 857–865. [Google Scholar] [CrossRef]
- Yaeger, R.; Chatila, W.K.; Lipsyc, M.D.; Hechtman, J.F.; Cercek, A.; Sanchez-Vega, F.; Jayakumaran, G.; Middha, S.; Zehir, A.; Donoghue, M.T.A.; et al. Clinical Sequencing Defines the Genomic Landscape of Metastatic Colorectal Cancer. Cancer Cell 2018, 33, 125–136.e3. [Google Scholar] [CrossRef] [Green Version]
- Cerami, E.; Gao, J.; Dogrusoz, U.; Gross, B.E.; Sumer, S.O.; Aksoy, B.A.; Jacobsen, A.; Byrne, C.J.; Heuer, M.L.; Larsson, E.; et al. The cBio cancer genomics portal: An open platform for exploring multidimensional cancer genomics data. Cancer Discov. 2012, 2, 401–404. [Google Scholar] [CrossRef] [PubMed]
- Gao, J.; Aksoy, B.A.; Dogrusoz, U.; Dresdner, G.; Gross, B.E.; Sumer, S.O.; Sun, Y.; Jacobsen, A.; Sinha, R.; Larsson, E.; et al. Integrative Analysis of Complex Cancer Genomics and Clinical Profiles Using the cBioPortal. Sci. Signal. 2013, 6, pl1. [Google Scholar] [CrossRef]
- Cibulskis, K.; Lawrence, M.S.; Carter, S.L.; Sivachenko, A.; Jaffe, D.B.; Sougnez, C.; Gabriel, S.B.; Meyerson, M.L.; Lander, E.S.; Getz, G. Sensitive detection of somatic point mutations in impure and heterogeneous cancer samples. Nat. Biotechnol. 2013, 31, 213–219. [Google Scholar] [CrossRef] [PubMed]
- Carter, S.L.; Cibulskis, K.; Helman, E.; McKenna, A.; Shen, H.; Zack, T.; Laird, P.W.; Onofrio, R.C.; Winckler, W.; Weir, B.A.; et al. Absolute quantification of somatic DNA alterations in human cancer. Nat. Biotechnol. 2012, 30, 413–421. [Google Scholar] [CrossRef]
- Chakravarty, D.; Gao, J.; Phillips, S.; Kundra, R.; Zhang, H.; Wang, J.; Rudolph, J.E.; Yaeger, R.; Soumerai, T.; Nissan, M.H.; et al. OncoKB: A Precision Oncology Knowledge Base. JCO Precis. Oncol. 2017, 1, 1–16. [Google Scholar] [CrossRef] [PubMed]
- Tabernero, J.; Ros, J.; Élez, E. The Evolving Treatment Landscape in BRAF-V600E–Mutated Metastatic Colorectal Cancer. Am. Soc. Clin. Oncol. Educ. Book 2022, 42, 254–263. [Google Scholar] [CrossRef] [PubMed]
- Sahin, I.H.; Klostergaard, J. BRAF Mutations as Actionable Targets: A Paradigm Shift in the Management of Colorectal Cancer and Novel Avenues. JCO Oncol. Pract. 2021, 17, 723–730. [Google Scholar] [CrossRef]
- Parsons, M.T.; Buchanan, D.D.; Thompson, B.; Young, J.P.; Spurdle, A.B. Correlation of tumour BRAF mutations and MLH1 methylation with germline mismatch repair (MMR) gene mutation status: A literature review assessing utility of tumour features for MMR variant classification. J. Med. Genet. 2012, 49, 151–157. [Google Scholar] [CrossRef]
- Leclerc, J.; Vermaut, C.; Buisine, M.-P. Diagnosis of Lynch Syndrome and Strategies to Distinguish Lynch-Related Tumors from Sporadic MSI/dMMR Tumors. Cancers 2021, 13, 467. [Google Scholar] [CrossRef]
- Tong, K.; Kothari, O.A.; Haro, K.S.; Panda, A.; Bandari, M.M.; Carrick, J.N.; Hur, J.J.; Zhang, L.; Chan, C.S.; Xing, J.; et al. SMAD4 is critical in suppression of BRAF-V600E serrated tumorigenesis. Oncogene 2021, 40, 6034–6048. [Google Scholar] [CrossRef]
- Tong, K.; Pellón-Cárdenas, O.; Sirihorachai, V.R.; Warder, B.N.; Kothari, O.A.; Perekatt, A.O.; Fokas, E.E.; Fullem, R.L.; Zhou, A.; Thackray, J.K.; et al. Degree of Tissue Differentiation Dictates Susceptibility to BRAF-Driven Colorectal Cancer. Cell Rep. 2017, 21, 3833–3845. [Google Scholar] [CrossRef] [PubMed]
- Prossomariti, A.; Piazzi, G.; Alquati, C.; Ricciardiello, L. Are Wnt/β-Catenin and PI3K/AKT/mTORC1 Distinct Pathways in Colorectal Cancer? Cell. Mol. Gastroenterol. Hepatol. 2020, 10, 491–506. [Google Scholar] [CrossRef] [PubMed]
- Voutsadakis, I.A. The ubiquitin-proteasome system in colorectal cancer. Biochim. Biophys. Acta (BBA) Mol. Basis Dis. 2008, 1782, 800–808. [Google Scholar] [CrossRef] [PubMed]
- Boccaccino, A.; Borelli, B.; Intini, R.; Antista, M.; Bensi, M.; Rossini, D.; Passardi, A.; Tamberi, S.; Giampieri, R.; Antonuzzo, L.; et al. Encorafenib plus cetuximab with or without binimetinib in patients with BRAF V600E-mutated metastatic colorectal cancer: Real-life data from an Italian multicenter experience. ESMO Open 2022, 7, 100506. [Google Scholar] [CrossRef] [PubMed]
- Sinicrope, F.A.; Shi, Q.; Smyrk, T.C.; Thibodeau, S.N.; Dienstmann, R.; Guinney, J.; Bot, B.; Tejpar, S.; Delorenzi, M.; Goldberg, R.M.; et al. Molecular Markers Identify Subtypes of Stage III Colon Cancer Associated With Patient Outcomes. Gastroenterology 2015, 148, 88–99. [Google Scholar] [CrossRef]
- Venderbosch, S.; Nagtegaal, I.D.; Maughan, T.S.; Smith, C.G.; Cheadle, J.P.; Fisher, D.; Kaplan, R.; Quirke, P.; Seymour, M.T.; Richman, S.D.; et al. Mismatch Repair Status and BRAF Mutation Status in Metastatic Colorectal Cancer Patients: A Pooled Analysis of the CAIRO, CAIRO2, COIN, and FOCUS Studies. Clin. Cancer Res. 2014, 20, 5322–5330. [Google Scholar] [CrossRef]
- Taieb, J.; Le Malicot, K.; Shi, Q.; Penault-Llorca, F.; Bouché, O.; Tabernero, J.; Mini, E.; Goldberg, R.M.; Folprecht, G.; Van Laethem, J.L.; et al. Prognostic Value of BRAF and KRAS Mutations in MSI and MSS Stage III Colon Cancer. JNCI J. Natl. Cancer Inst. 2016, 109, djw272. [Google Scholar] [CrossRef]
- Barras, D.; Missiaglia, E.; Wirapati, P.; Sieber, O.M.; Jorissen, R.N.; Love, C.; Molloy, P.L.; Jones, I.T.; McLaughlin, S.; Gibbs, P.; et al. BRAF V600E Mutant Colorectal Cancer Subtypes Based on Gene Expression. Clin. Cancer Res. 2017, 23, 104–115. [Google Scholar] [CrossRef]
- Van Geel, R.M.; Tabernero, J.; Elez, E.; Bendell, J.C.; Spreafico, A.; Schuler, M.; Yoshino, T.; Delord, J.-P.; Yamada, Y.; Lolkema, M.P.; et al. A Phase Ib Dose-Escalation Study of Encorafenib and Cetuximab with or without Alpelisib in Metastatic BRAF-Mutant Colorectal Cancer. Cancer Discov. 2017, 7, 610–619. [Google Scholar] [CrossRef]
- Tan, E.S.; Fan, W.; Knepper, T.C.; Schell, M.J.; Sahin, I.H.; Fleming, J.B.; Xie, H. Prognostic and Predictive Value of PIK3CA Mutations in Metastatic Colorectal Cancer. Target. Oncol. 2022, 17, 483–492. [Google Scholar] [CrossRef]
- Randon, G.; Fucà, G.; Rossini, D.; Raimondi, A.; Pagani, F.; Perrone, F.; Tamborini, E.; Busico, A.; Peverelli, G.; Morano, F.; et al. Prognostic impact of ATM mutations in patients with metastatic colorectal cancer. Sci. Rep. 2019, 9, 2858. [Google Scholar] [CrossRef] [PubMed]
- Cleary, J.M.; Aguirre, A.J.; Shapiro, G.I.; D’Andrea, A.D. Biomarker-Guided Development of DNA Repair Inhibitors. Mol. Cell 2020, 78, 1070–1085. [Google Scholar] [CrossRef] [PubMed]
- Leichman, L.; Groshen, S.; O’Neil, B.H.; Messersmith, W.; Berlin, J.; Chan, E.; Leichman, C.G.; Cohen, S.J.; Cohen, D.; Lenz, H.-J.; et al. Phase II Study of Olaparib (AZD-2281) After Standard Systemic Therapies for Disseminated Colorectal Cancer. Oncologist 2016, 21, 172–177. [Google Scholar] [CrossRef] [PubMed]
- Chen, E.X.; Jonker, D.J.; Siu, L.L.; McKeever, K.; Keller, D.; Wells, J.; Hagerman, L.; Seymour, L. A Phase I study of olaparib and irinotecan in patients with colorectal cancer: Canadian Cancer Trials Group IND 187. Investig. New Drugs 2016, 34, 450–457. [Google Scholar] [CrossRef]
- Papageorgiou, G.I.; Fergadis, E.; Skouteris, N.; Christakos, E.; Tsakatikas, S.A.; Lianos, E.; Kosmas, C. Case Report: Combination of Olaparib With Chemotherapy in a Patient With ATM-Deficient Colorectal Cancer. Front. Oncol. 2021, 11, 788809. [Google Scholar] [CrossRef]
- Pickles, O.J.; Drozd, A.; Tee, L.; Beggs, A.D.; Middleton, G.W. Paradox breaker BRAF inhibitors have comparable potency and MAPK pathway reactivation to encorafenib in BRAF mutant colorectal cancer. Oncotarget 2020, 11, 3188–3197. [Google Scholar] [CrossRef]
Figure 1.
Prevalence of MSI in colorectal cancer biopsies from the primary tumor or from metastatic sites depending on the presence of BRAF V600E mutations. Data are from the MSKCC cohort in which all patients had metastatic colorectal cancer. Samples with non-V600E BRAF mutations were excluded from this analysis. MSI: Microsatellite Instability high; MSS: Microsatellite Stable.

Figure 2.
Prevalence of mutations in cancer-associated genes frequently mutated in colorectal cancer in colorectal cancer patients with or without BRAF and PIK3CA mutations. (A) TCGA cohort. (B) DFCI cohort.
Figure 2.
Prevalence of mutations in cancer-associated genes frequently mutated in colorectal cancer in colorectal cancer patients with or without BRAF and PIK3CA mutations. (A) TCGA cohort. (B) DFCI cohort.


Figure 3.
Prevalence of mutations in MMR-associated genes and in the genes encoding for proof-reading polymerases epsilon and delta in colorectal cancer patients with or without BRAF and PIK3CA mutations. (A) TCGA cohort. (B) DFCI cohort.
Figure 3.
Prevalence of mutations in MMR-associated genes and in the genes encoding for proof-reading polymerases epsilon and delta in colorectal cancer patients with or without BRAF and PIK3CA mutations. (A) TCGA cohort. (B) DFCI cohort.


Figure 4.
Overall Survival (OS) of patients in the colorectal cancer cohort of TCGA according to the mutational status of BRAF and PIK3CA genes. Group WTWT: both genes wild type; group WTMT: PIK3CA wild type/BRAF mutant; group MTWT: PIK3CA mutant/BRAF wild type; MTMT: both genes mutated.
Figure 4.
Overall Survival (OS) of patients in the colorectal cancer cohort of TCGA according to the mutational status of BRAF and PIK3CA genes. Group WTWT: both genes wild type; group WTMT: PIK3CA wild type/BRAF mutant; group MTWT: PIK3CA mutant/BRAF wild type; MTMT: both genes mutated.


Table 1.
Characteristics of colorectal cancers with and without PIK3CA and BRAF mutations in the TCGA cohort. Two patients are missing demographic data. Analysis for PIK3CA and BRAF mutations was performed in 534 patient samples. NA: not available. The p values presented in the last column refer to Fisher’s exact test except if stated otherwise. For each categorical characteristic, three comparisons are presented. The first includes all four groups (group with both PIK3CA and BRAF wild type, group with PIK3CA wild type and BRAF mutant, group with PIK3CA mutant and BRAF wild type, and group with both PIK3CA and BRAF mutant), the second comparison is between double mutant cancers and cancers with BRAF mutations and wild type PIK3CA. The third comparison is between double mutant cancers and cancers with PIK3CA mutated and BRAF wild type. For cancer stage comparisons in the four mutation groups, early stages (I and II) and advanced stages (III and IV) were grouped together in the statistical analysis. The comparisons of various characteristics of interest involving all four mutation groups were performed with the χ2 test. Comparisons involving two groups were performed with the Fisher’s exact test when the characteristic of interest had 2 categories and with the χ2 test when the characteristic of interest had more than 2 categories.
| Characteristic | Entire Cohort (n = 594) | PIK3CA and BRAF Wild Type (n = 347) | PIK3CA Wild Type/BRAF Mutant (n = 40) | PIK3CA Mutant/BRAF Wild Type (n = 125) | Both Mutant (n = 22) | p |
|---|---|---|---|---|---|---|
| Age (mean ± SD) | 66.1 ± 13.4 | 64.9 ± 12.9 | 70.4 ± 14.4 | 66 ± 12.3 | 69.7 ± 12.9 | 0.03 (ANOVA) |
| Age | ||||||
| ≤65 years old | 260 (43.9) | 161 (46.5) | 13 (32.5) | 60 (48.4) | 6 (27.3) | 0.1 (χ2) |
| >65 years old | 332 (56.1) | 185 (53.5) | 27 (67.5) | 64 (51.6) | 16 (72.7) | 0.7 |
| NA | 2 | 1 | 0 | 1 | 0 | 0.1 |
| Sex | ||||||
| Male | 312 (52.7) | 181 (52.3) | 17 (42.5) | 70 (56.5) | 9 (40.9) | 0.31 (χ2) |
| Female | 280 (47.3) | 165 (47.7) | 23 (57.5) | 54 (43.5) | 13 (59.1) | 1 |
| NA | 2 | 1 | 0 | 1 | 0 | 0.24 |
| Stage | ||||||
| I | 104 (17.9) | 65 (19.1) | 4 (10) | 19 (16.1) | 7 (31.8) | I–II versus III–IV |
| II | 220 (37.9) | 113 (33.2) | 23 (57.5) | 53 (44.9) | 12 (54.6) | 0.003 (χ2) |
| III | 170 (29.3) | 105 (30.9) | 10 (25) | 33 (28) | 3 (13.6) | 0.13 |
| IV | 86 (14.8) | 57 (16.8) | 3 (7.5) | 13 (11) | 0 | 0.02 |
| NA | 14 | 7 | 0 | 7 | 0 | |
| Location primary | ||||||
| Colon | 436 (74.1) | 229 (67) | 37 (92.5) | 105 (84.7) | 20 (90.9) | <0.0001 (χ2) |
| Rectal | 152 (25.9) | 113 (33) | 3 (7.5) | 19 (15.3) | 2 (9.1) | 1 |
| NA | 6 | 5 | 0 | 1 | 0 | 0.7 |
Table 2.
Characteristics of colorectal cancers with BRAF and PIK3CA mutations in the DFCI cohort. NA: not available. Right cancers include cecum to transverse column and left cancers include those located from the splenic flexure to rectum. The p values presented in the last column refer to Fisher’s exact test except if stated otherwise. For each categorical characteristic, three comparisons are presented. The first includes all four groups (group with both PIK3CA and BRAF wild type, group with PIK3CA wild type and BRAF mutant, group with PIK3CA mutant and BRAF wild type, and group with both PIK3CA and BRAF mutant), the second comparison is between double mutant cancers and cancers with BRAF mutations and wild type PIK3CA. The third comparison is between double mutant cancers and cancers with PIK3CA mutated and BRAF wild type. For cancer stage comparisons in the four mutation groups, early stages (I and II) and advanced stages (III and IV) were grouped together in the statistical analysis. For the primary tumor location comparisons in the four groups, right colon cancers (cecum and ascending to transverse) and left colon cancers (splenic flexure to sigmoid and rectal) were grouped together in the statistical analysis. The comparisons of various characteristics of interest involving all four mutation groups were performed with the χ2 test. Comparisons involving two groups were performed with the Fisher’s exact test when the characteristic of interest had 2 categories and with the χ2 test when the characteristic of interest had more than 2 categories.
| Characteristic | Entire Cohort (n = 619) | PIK3CA and BRAF Wild Type (n = 395) | PIK3CA Wild Type/BRAF Mutant (n = 92) | PIK3CA Mutant/BRAF Wild Type (n = 97) | Both Mutant (n = 35) | p |
|---|---|---|---|---|---|---|
| Age (mean ± SD) | 70.7 ± 8.6 | 70.3 ± 8.6 | 71.9 ± 7.5 | 71 ± 9.4 | 71.4 ± 7.8 | 0.29 (ANOVA) |
| Age | ||||||
| ≤65 years old | 160 (25.9) | 114 (28.9) | 17 (18.7) | 23 (23.7) | 6 (17.1) | 0.11 (χ2) |
| >65 years old | 457 (74.1) | 280 (71.1) | 74 (81.3) | 74 (76.3) | 29 (82.9) | 1 |
| NA | 2 | 1 | 1 | 0.48 | ||
| Sex | ||||||
| Male | 239 (38.6) | 160 (40.5) | 20 (21.7) | 44 (45.4) | 15 (42.9) | 0.003 (χ2) |
| Female | 380 (61.4) | 235 (59.5) | 72 (78.3) | 53 (54.6) | 20 (57.1) | 0.02 |
| Stage | 0.84 | |||||
| I | 152 (27) | 101 (28.5) | 18 (20.2) | 27 (32.2) | 6 (17.1) | I–II versus III–IV |
| II | 187 (33.2) | 98 (27.6) | 37 (41.6) | 33 (39.3) | 19 (54.3) | 0.03 (χ2) |
| III | 159 (28.2) | 114 (32.1) | 22 (24.7) | 17 (20.2) | 6 (17.1) | 0.4 |
| IV | 65 (11.6) | 42 (11.8) | 12 (13.5) | 7 (8.3) | 4 (11.4) | 1 |
| NA | 56 | 40 | 3 | 13 | ||
| Location primary | ||||||
| Cecum | 114 (18.4) | 65 (16.5) | 11 (12) | 27 (27.8) | 11 (31.4) | Right versus Left |
| Ascending to transverse | 201 (32.5) | 86 (21.8) | 65 (70.7) | 31 (32) | 19 (54.3) | <0.0001 (χ2) |
| Splenic flexure to sigmoid | 166 (26.9) | 121(30.7) | 12 (13) | 28 (28.9) | 5 (14.3) | 0.79 |
| Rectal | 137 (22.2) | 122 (31) | 4 (4.3) | 11 (11.3) | 0 | 0.006 |
| NA | 1 | 1 |
Table 3.
Prevalence of cases according to Tumor Mutation Burden (TMB), Aneuploidy Score (AS), and Fraction Genome Altered (FGA) in the groups with or without BRAF and PIK3CA mutations in TCGA. Analysis for PIK3CA and BRAF mutations was performed in 534 samples. GS: Genomic Stable; CIN: Chromosomal Instability; MSI: Microsatellite Instability; NA: not available. The p values presented in the last column refer to the χ2 test. For each categorical characteristic, three comparisons are presented. The first comparison includes all four groups (group with both PIK3CA and BRAF wild type, group with PIK3CA wild type and BRAF mutant, group with PIK3CA mutant and BRAF wild type, and group with both PIK3CA and BRAF mutant), the second comparison is between double mutant cancers and cancers with BRAF mutations and wild type PIK3CA. The third comparison is between double mutant cancers and cancers with PIK3CA mutated and BRAF wild type.
| Characteristic | Entire Cohort (n = 594) | PIK3CA and BRAF Wild Type (n = 347) | PIK3CA Wild Type/BRAF Mutant (n = 40) | PIK3CA Mutant/BRAF Wild Type (n = 125) | Both Mutant (n = 22) | p |
|---|---|---|---|---|---|---|
| Subtype | ||||||
| Colon GS | 49 (10.7) | 24 (8.2) | 3 (8.1) | 20 (18.7) | 2 (9.1) | GS vs. CIN vs. MSI |
| Colon CIN | 226 (49.2) | 159 (54.3) | 10 (27) | 56 (52.4) | 1 (4.5) | <0.0001 |
| Colon MSI | 60 (13.1) | 15 (5.1) | 21 (56.8) | 9 (8.4) | 15 (68.2) | 0.07 |
| Colon POLE | 6 (1.3) | 0 | 0 | 4 (3.7) | 2 (9.1) | <0.0001 |
| Rectal GS | 9 (2) | 6 (2) | 0 | 3 (2.8) | 0 | |
| Rectal CIN | 102 (22.2) | 87 (29.8) | 1 (2.7) | 14 (13.1) | 0 | |
| Rectal MSI | 3 (0.6) | 1 (0.3) | 1 (2.7) | 1 (0.9) | 0 | |
| Rectal POLE | 4 (0.9) | 1 (0.3) | 1 (2.7) | 0 | 2 (9.1) | |
| NA | 135 | 54 | 3 | 18 | 0 | |
| TMB | ||||||
| <100 | 243 (46) | 195 (57.2) | 3 (7.5) | 44 (35.2) | 1 (4.5) | <0.0001 |
| 100–200 | 192 (36.4) | 121 (35.5) | 9 (22.5) | 60 (48) | 2 (9.1) | 0.2 |
| >200 | 93 (17.6) | 25 (7.3) | 28 (70) | 21 (16.8) | 19 (86.4) | <0.0001 |
| NA | 66 | 6 | 0 | 0 | 0 | |
| AS | ||||||
| <4 | 108 (18.4) | 30 (8.8) | 21 (52.5) | 26 (21) | 17 (81) | <0.0001 |
| 4–24 | 427 (72.9) | 275 (79.9) | 19 (47.5) | 90 (72.6) | 4 (19) | 0.05 |
| >24 | 51 (8.7) | 39 (11.3) | 0 | 8 (6.4) | 0 | <0.0001 |
| NA | 8 | 3 | 0 | 1 | 1 | |
| FGA | ||||||
| <0.08 | 118 (20.2) | 36 (10.5) | 22 (56.4) | 28 (23.3) | 17 (77.3) | <0.0001 |
| 0.08–0.35 | 316 (54.2) | 207 (60.5) | 15 (38.5) | 67 (55.8) | 5 (22.7) | 0.16 |
| >0.35 | 149 (25.6) | 99 (29) | 2 (5.1) | 25 (20.8) | 0 | <0.0001 |
| NA | 11 | 5 | 1 | 5 | 0 |
Table 4.
MSI status, TMB, CIMP in the DFCI cohort. MSI: Microsatellite Instability; TMB: Tumor Mutation Burden; CIMP: CpG Island Methylator Phenotype; NA: not available. The p values presented in the last column refer to Fisher’s exact test except if stated otherwise. For each categorical characteristic, three comparisons are presented. The first comparison includes all four groups (group with both PIK3CA and BRAF wild type, group with PIK3CA wild type and BRAF mutant, group with PIK3CA mutant and BRAF wild type, and group with both PIK3CA and BRAF mutant), the second comparison is between double mutant cancers and cancers with BRAF mutations and wild type PIK3CA. The third comparison is between double mutant cancers and cancers with PIK3CA mutated and BRAF wild type.
| Characteristic | Entire Cohort (n = 619) | PIK3CA and BRAF Wild Type (n = 395) | PIK3CA Wild Type/BRAF Mutant (n = 92) | PIK3CA Mutant/BRAF Wild Type (n = 97) | Both Mutant (n = 35) | p |
|---|---|---|---|---|---|---|
| Subtype | ||||||
| MSI high | 91 (17.2) | 23 (6.7) | 33 (47.1) | 13 (15.9) | 22 (62.9) | <0.0001 (χ2) |
| MSS | 438 (82.8) | 319 (93.3) | 37 (52.9) | 69 (84.1) | 13 (37.1) | 0.15 |
| NA | 90 | 53 | 22 | 15 | <0.0001 | |
| TMB | ||||||
| <100 | 140 (22.6) | 117 (29.6) | 5 (5.4) | 15 (15.5) | 3 (8.6) | <0.0001 (χ2) |
| 100–200 | 285 (46) | 205 (51.9) | 27 (29.4) | 48 (49.5) | 5 (14.3) | 0.28 (χ2) |
| >200 | 194 (31.4) | 73 (18.5) | 60 (65.2) | 34 (35) | 27 (77.1) | <0.0001 (χ2) |
| CIMP | ||||||
| High | 95 (19) | 18 (5.6) | 46 (65.7) | 9 (11.7) | 22 (73.3) | <0.0001 (χ2) |
| 0—low | 405 (81) | 305 (94.4) | 24 (34.3) | 68 (88.3) | 8 (26.7) | 0.49 |
| NA | 119 | 72 | 22 | 20 | 5 | <0.0001 |
Table 5.
Prevalence of functionally annotated mutations as oncogenic/probably oncogenic in commonly mutated (more than 10% of cases in the whole cohort) cancer-associated genes in TCGA. The nominator in each case represents number of oncogenic or probably oncogenic mutations and the denominator represents the total number of mutations of each gene in each group.
| Mutation | Entire Cohort (n = 594) | PIK3CA and BRAF Wild Type (n = 347) | PIK3CA Wild Type/BRAF Mutant (n = 40) | PIK3CA Mutant/BRAF Wild Type (n = 125) | Both Mutant (n = 22) | p |
|---|---|---|---|---|---|---|
| TP53 | 329/332 (99.1%) | 243/244 (99.6%) | 18/18 (100%) | 59/59 (100%) | 9/11 (81.8%) | |
| APC | 573/639 (89.7%) | 377/400 (94.2%) | 18/26 (69.2%) | 157/178 (88.2%) | 21/35 (60%) | |
| KRAS | 220/223 (98.7%) | 132/134 (98.5%) | 3/4 (75%) | 82/82 (100%) | 3/3 (100%) | |
| FBXW7 | 90/107 (84.1%) | 42/49 (85.7%) | 11/16 (68.8%) | 27/31 (87.1%) | 10/11 (90.9%) | |
| ATM | 53/107 (49.5%) | 24/37 (64.7%) | 12/29 (41.4%) | 8/25 (32%) | 9/16 (56.3%) | |
| SMAD4 | 57/80 (71.3%) | 28/40 (70%) | 2/4 (50%) | 19/26 (73.1%) | 8/10 (80%) | |
| AMER1 | 52/72 (72.2%) | 26/31 (83.9%) | 4/10 (40%) | 17/22 (77.3%) | 5/9 (55.6%) | |
| SOX9 | 54/73 (74%) | 27/35 (77.1%) | 6/10 (60%) | 20/27 (74.1%) | 1/1 (100%) | |
| KMT2D | 32/90 (35.6%) | 10/23 (43.5%) | 12/21 (57.1%) | 5/27 (18.5%) | 5/19 (26.3%) | |
| ARID1A | 46/65 (70.8%) | 16/21 (76.2%) | 5/11 (45.5%) | 13/18 (72.2%) | 12/15 (80%) | |
| KMT2B | 24/74 (32.4) | 8/22 (36.4%) | 5/18 (27.8%) | 3/20 (15%) | 8/14 (57.1%) | |
| TCF7L2 | 40/67 (59.7%) | 23/34 (67.6%) | 2/3 (66.7%) | 13/26 (50%) | 2/4 (50%) | |
| FAT1 | 15/98 (15.3%) | 4/22 (18.2%) | 4/26 (15.4%) | 2/22 (9.1%) | 5/29 (17.2%) | |
| KMT2C | 23/84 (27.4%) | 7/25 (28%) | 7/20 (35%) | 5/21 (23.8%) | 4/18 (22.2%) | |
| Total | 486/918 (52.9%) | 215/339 (63.4%) | 70/168 (41.7%) | 132/265 (49.8%) | 69/146 (47.3%) | 0.001 (χ2) |
Table 6.
Prevalence of functionally annotated mutations as oncogenic/probably oncogenic in DFCI. The nominator in each case represents number of oncogenic or probably oncogenic mutations and the denominator represents the total number of mutations of each gene in each group.
Table 6.
Prevalence of functionally annotated mutations as oncogenic/probably oncogenic in DFCI. The nominator in each case represents number of oncogenic or probably oncogenic mutations and the denominator represents the total number of mutations of each gene in each group.
| Mutation | Entire Cohort (n = 619) | PIK3CA and BRAF Wild Type (n = 395) | PIK3CA Wild Type/BRAF Mutant (n = 92) | PIK3CA Mutant/BRAF Wild Type (n = 97) | Both Mutant (n = 35) | p |
|---|---|---|---|---|---|---|
| TP53 | 340/345 (98.6%) | 239/240 (99.6%) | 47/47 (100%) | 40/42 (95.2%) | 14/16 (87.5%) | 0.001 (χ2) |
| APC | 446/500 (89.2%) | 313/335 (93.5%) | 22/36 (61.1%) | 94/104 (90.4%) | 17/25 (68%) | <0.0001 (χ2) |
| KRAS | 172/177 (97.2%) | 126/128 (98.4%) | 1/4 (25%) | 43/43 (100%) | 2/2 (100%) | <0.0001 (χ2) |
| FBXW7 | 74/102 (72.5%) | 39/50 (78%) | 19/27 (70.4%) | 9/13 (69.2%) | 7/12 (58.3%) | |
| ATM | 43/81 (53.1%) | 12/25 (48%) | 19/35 (54.3%) | 8/9 (88.9%) | 4/12 (33.3%) | |
| SMAD4 | 56/82 (68.3%) | 35/49 (71.4%) | 8/14 (57.1%) | 12/16 (75%) | 1/3 (33.3%) | |
| AMER1 | 44/55 (80%) | 17/22 (77.3%) | 2/11 (18.2%) | 15/16 (93.7%) | 5/6 (83.3%) | |
| SOX9 | 53/70 (75.7%) | 34/37 (91.9%) | 10/18 (55.6%) | 8/12 (66.7%) | 2/3 (66.7%) | |
| KMT2D | 29/96 (30.2%) | 9/35 (25.7%) | 14/35 (40%) | 1/14 (7.1%) | 5/12 (41.7%) | |
| ARID1A | 45/79 (57%) | 14/25 (56%) | 10/20 (50%) | 8/17 (47.1%) | 13/17 (76.5%) | |
| KMT2B | 16/52 (30.8%) | 2/14 (14.3%) | 2/13 (15.4%) | 4/13 (30.8%) | 6/12 (50%) | |
| TCF7L2 | 20/46 (43.5%) | 13/25 (52%) | 2/8 (25%) | 3/6 (50%) | 2/7 (28.6%) | |
| FAT1 | 14/78 (17.9%) | 2/30 (6.7%) | 8/25 (32%) | 1/9 (11.1%) | 3/14 (21.4%) | |
| KMT2C | 28/109 (25.7%) | 13/46 (28.3%) | 4/24 (16.7%) | 7/24 (29.2%) | 4/15 (26.7%) | |
| Total | 422/850 (49.6%) | 190/353 (53.8%) | 98/230 (42.6%) | 76/148 (51.4%) | 52/113 (46%) | 0.051 (χ2) |
Table 7.
Prevalence of functionally annotated mutations as oncogenic/probably oncogenic in MMR and proof-reading polymerases associated genes in TCGA. The nominator in each case represents number of oncogenic or probably oncogenic mutations and the denominator represents the total number of mutations of each gene in each group.
| Mutation | Entire Cohort (n = 594) | PIK3CA and BRAF Wild Type (n = 347) | PIK3CA Wild Type/BRAF Mutant (n = 40) | PIK3CA Mutant/BRAF Wild Type (n = 125) | Both Mutant (n = 22) | p |
|---|---|---|---|---|---|---|
| MSH2 | 10/27 (37%) | 3/6 (50%) | 3/9 (33.3%) | 4/8 (50%) | 0/4 | |
| MSH6 | 9/29 (31%) | 3/6 (50%) | 3/8 (37.5%) | 3/8 (37.5%) | 0/7 | |
| PMS2 | 4/16 (25%) | 1/5 (20%) | 1/3 (33.3%) | 1/4 (25%) | 1/4 (25%) | |
| MLH1 | 13/24 (54.2%) | 4/8 (50%) | 2/5 (40%) | 4/5 (80%) | 3/6 (50%) | |
| POLE | 10/50 (20%) | 1/11 (9.1%) | 1/12 (8.3%) | 5/19 (26.3%) | 3/8 (37.5%) | |
| POLD1 | 0/32 | 0/10 | 0/9 | 0/7 | 0/6 | |
| Total | 46/178 (25.8%) | 12/46 (26.1%) | 10/46 (21.7%) | 17/51 (33.3%) | 7/35 (20%) | 0.47 (χ2) |
Table 8.
Prevalence of functionally annotated mutations as oncogenic/probably oncogenic of MMR and proof-reading polymerases associated genes in the DFCI cohort. The nominator in each case represents number of oncogenic or probably oncogenic mutations and the denominator represents the total number of mutations of each gene in each group.
| Mutation | Entire Cohort (n = 619) | PIK3CA and BRAF Wild Type (n = 395) | PIK3CA Wild Type/BRAF Mutant (n = 92) | PIK3CA Mutant/BRAF Wild Type (n = 97) | Both Mutant (n = 35) | p |
|---|---|---|---|---|---|---|
| MSH2 | 4/12 (33.3%) | 2/5 (40%) | 0/1 | 2/4 (50%) | 0/2 | |
| MSH6 | 12/29 (41.4%) | 3/10 (30%) | 4/10 (40%) | 1/1 (100%) | 4/8 (50%) | |
| PMS2 | 5/19 (26.3%) | 3/6 (50%) | 1/6 (16.7%) | 1/2 (50%) | 0/5 | |
| MLH1 | 13/25 (52%) | 4/10 (40%) | 3/8 (37.5%) | 3/4 (75%) | 3/3 (100%) | |
| POLE | 5/56 (8.9%) | 1/11 (9.1%) | 2/25 (8%) | 1/16 (6.2%) | 1/4 (25%) | |
| POLD1 | 0/37 | 0/16 | 0/10 | 0/2 | 0/9 | |
| Total | 39/178 (21.9%) | 13/58 (22.4%) | 10/60 (16.7%) | 8/29 (27.6%) | 8/31 (25.8%) | 0.61 (χ2) |
Publisher’s Note: MDPI stays neutral with regard to jurisdictional claims in published maps and institutional affiliations. |
© 2022 by the author. Licensee MDPI, Basel, Switzerland. This article is an open access article distributed under the terms and conditions of the Creative Commons Attribution (CC BY) license (https://creativecommons.org/licenses/by/4.0/).
Share and Cite
MDPI and ACS Style
Voutsadakis, I.A. The Genomic Environment of BRAF Mutated and BRAF/PIK3CA Double Mutated Colorectal Cancers. J. Clin. Med. 2022, 11, 5132. https://doi.org/10.3390/jcm11175132
AMA Style
Voutsadakis IA. The Genomic Environment of BRAF Mutated and BRAF/PIK3CA Double Mutated Colorectal Cancers. Journal of Clinical Medicine. 2022; 11(17):5132. https://doi.org/10.3390/jcm11175132
Chicago/Turabian StyleVoutsadakis, Ioannis A. 2022. "The Genomic Environment of BRAF Mutated and BRAF/PIK3CA Double Mutated Colorectal Cancers" Journal of Clinical Medicine 11, no. 17: 5132. https://doi.org/10.3390/jcm11175132
Note that from the first issue of 2016, this journal uses article numbers instead of page numbers. See further details here.