
Clinical Outcomes of Different Calcified Culprit Plaques in Patients with Acute Coronary Syndrome

 ,
,
Abstract
:1. Introduction
2. Methods
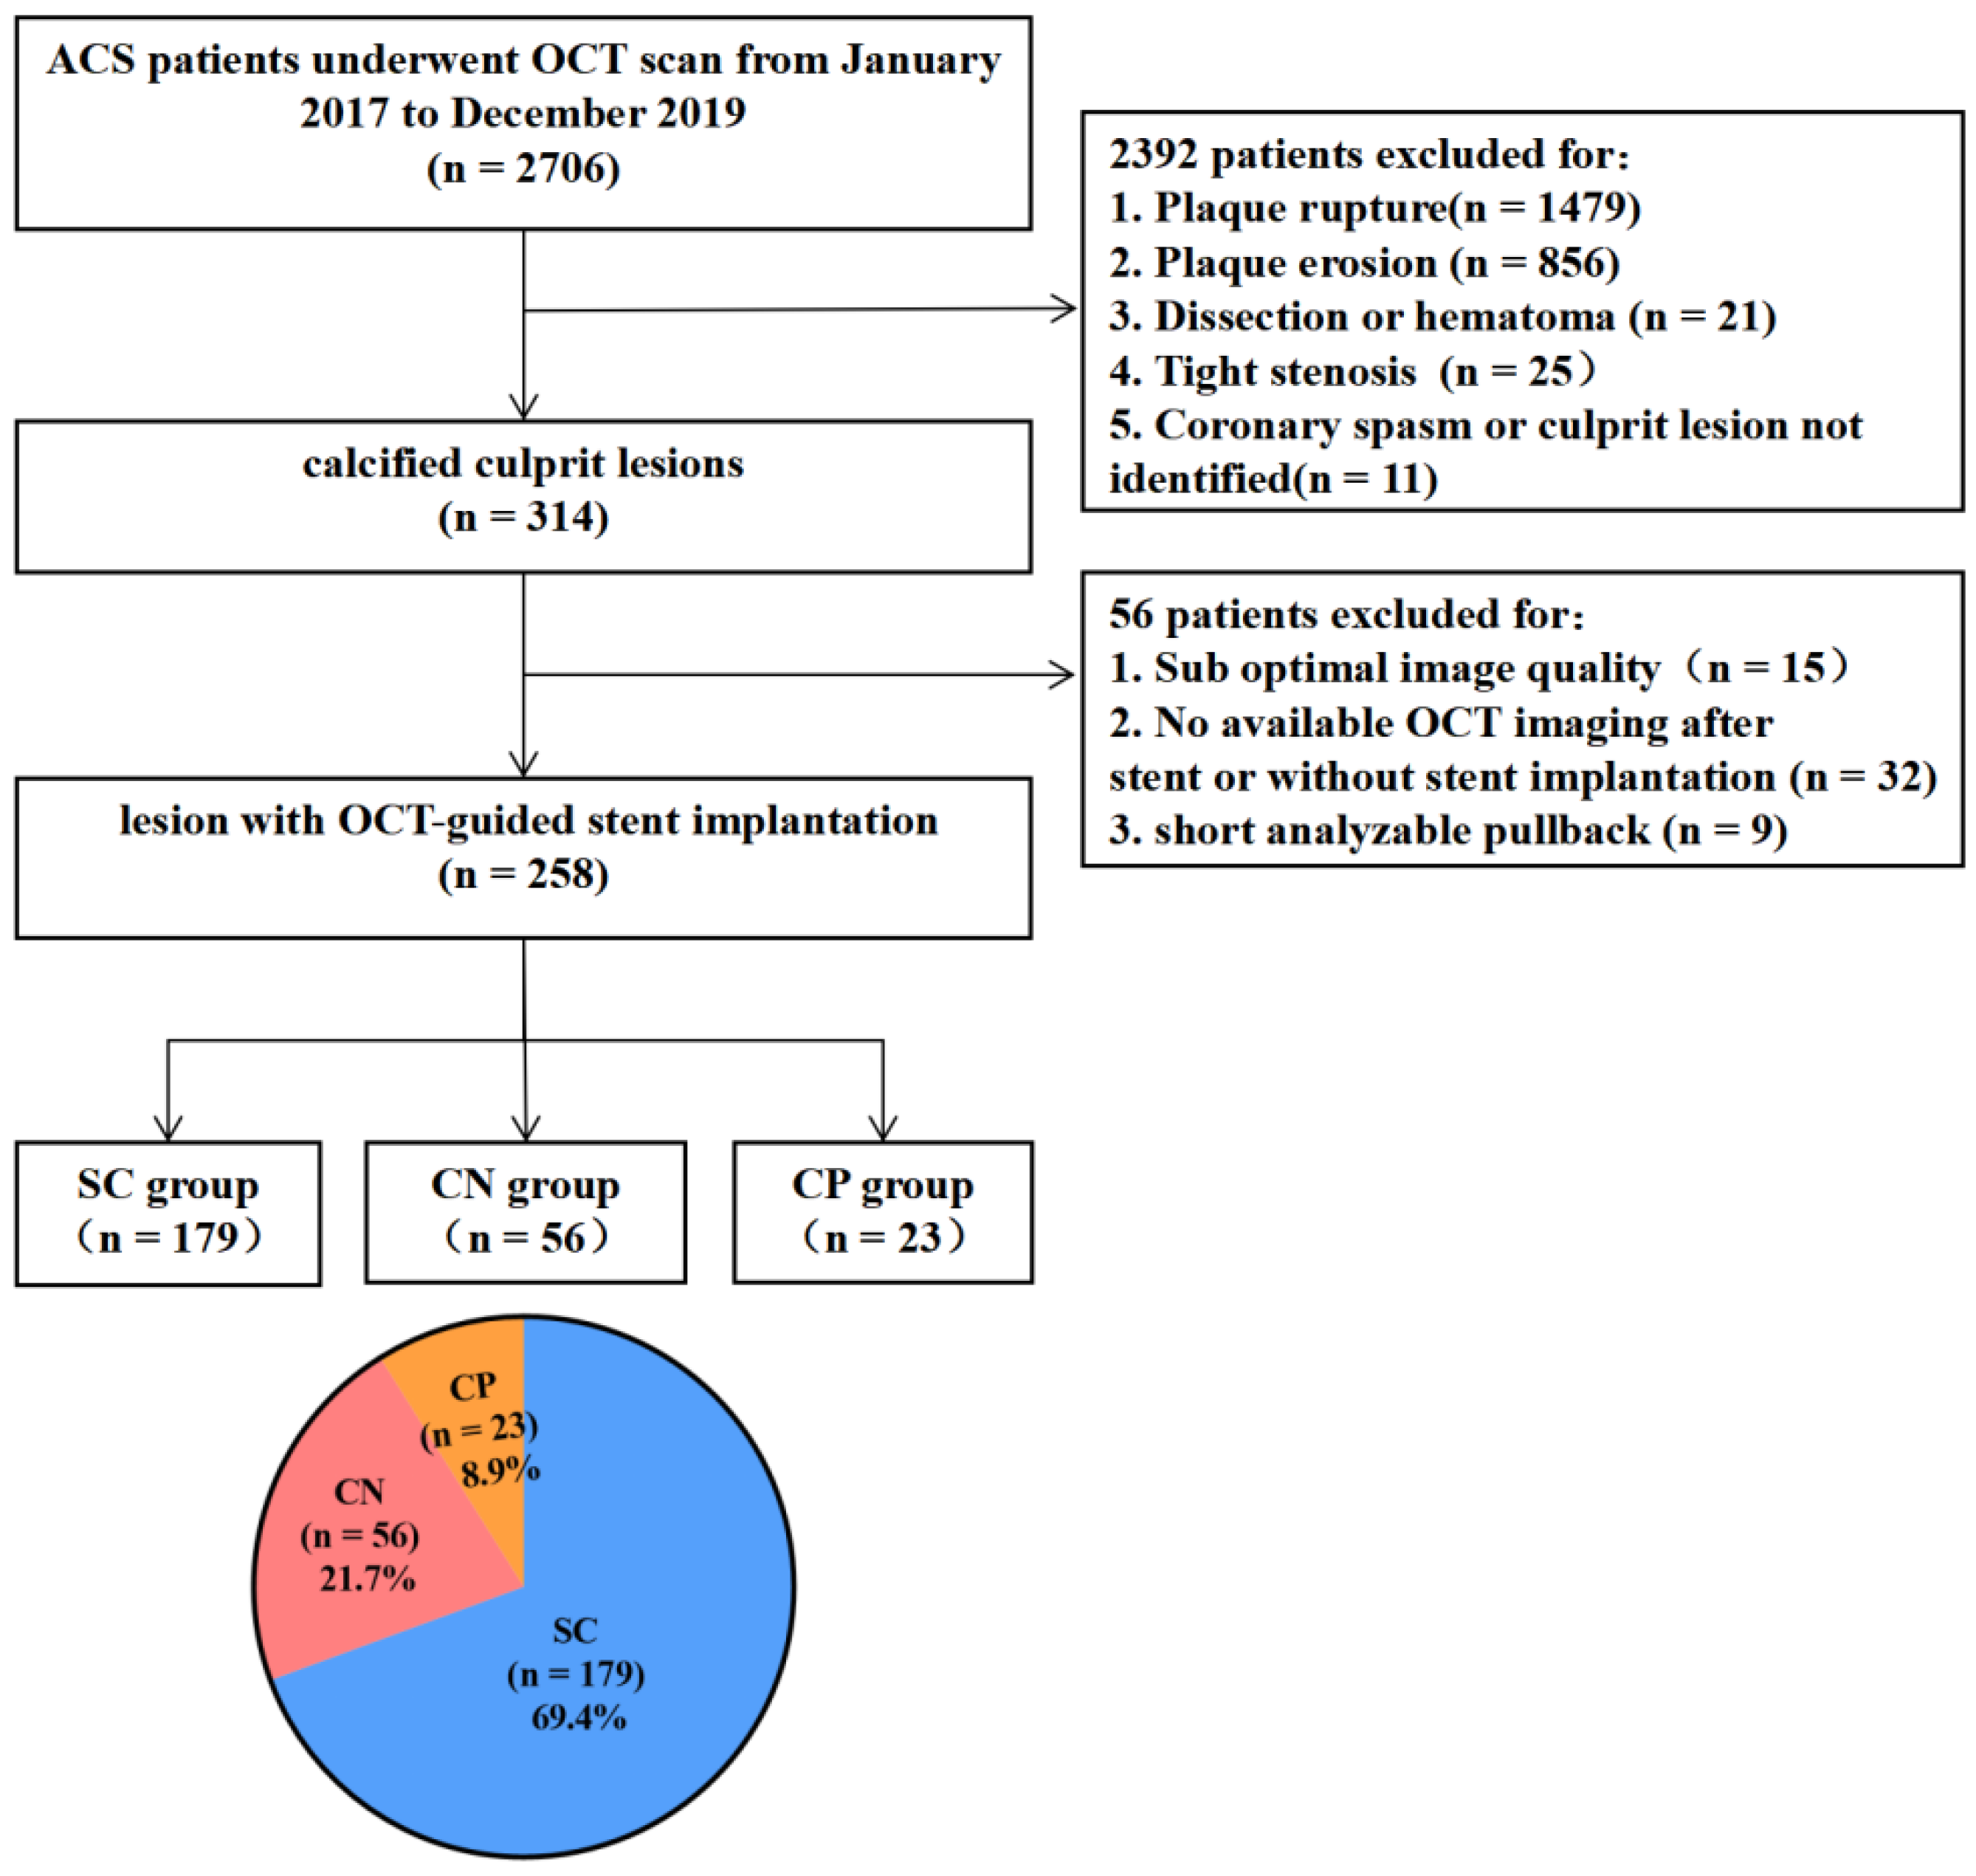
2.1. Study Population
2.2. Angiographic Analysis and Procedures
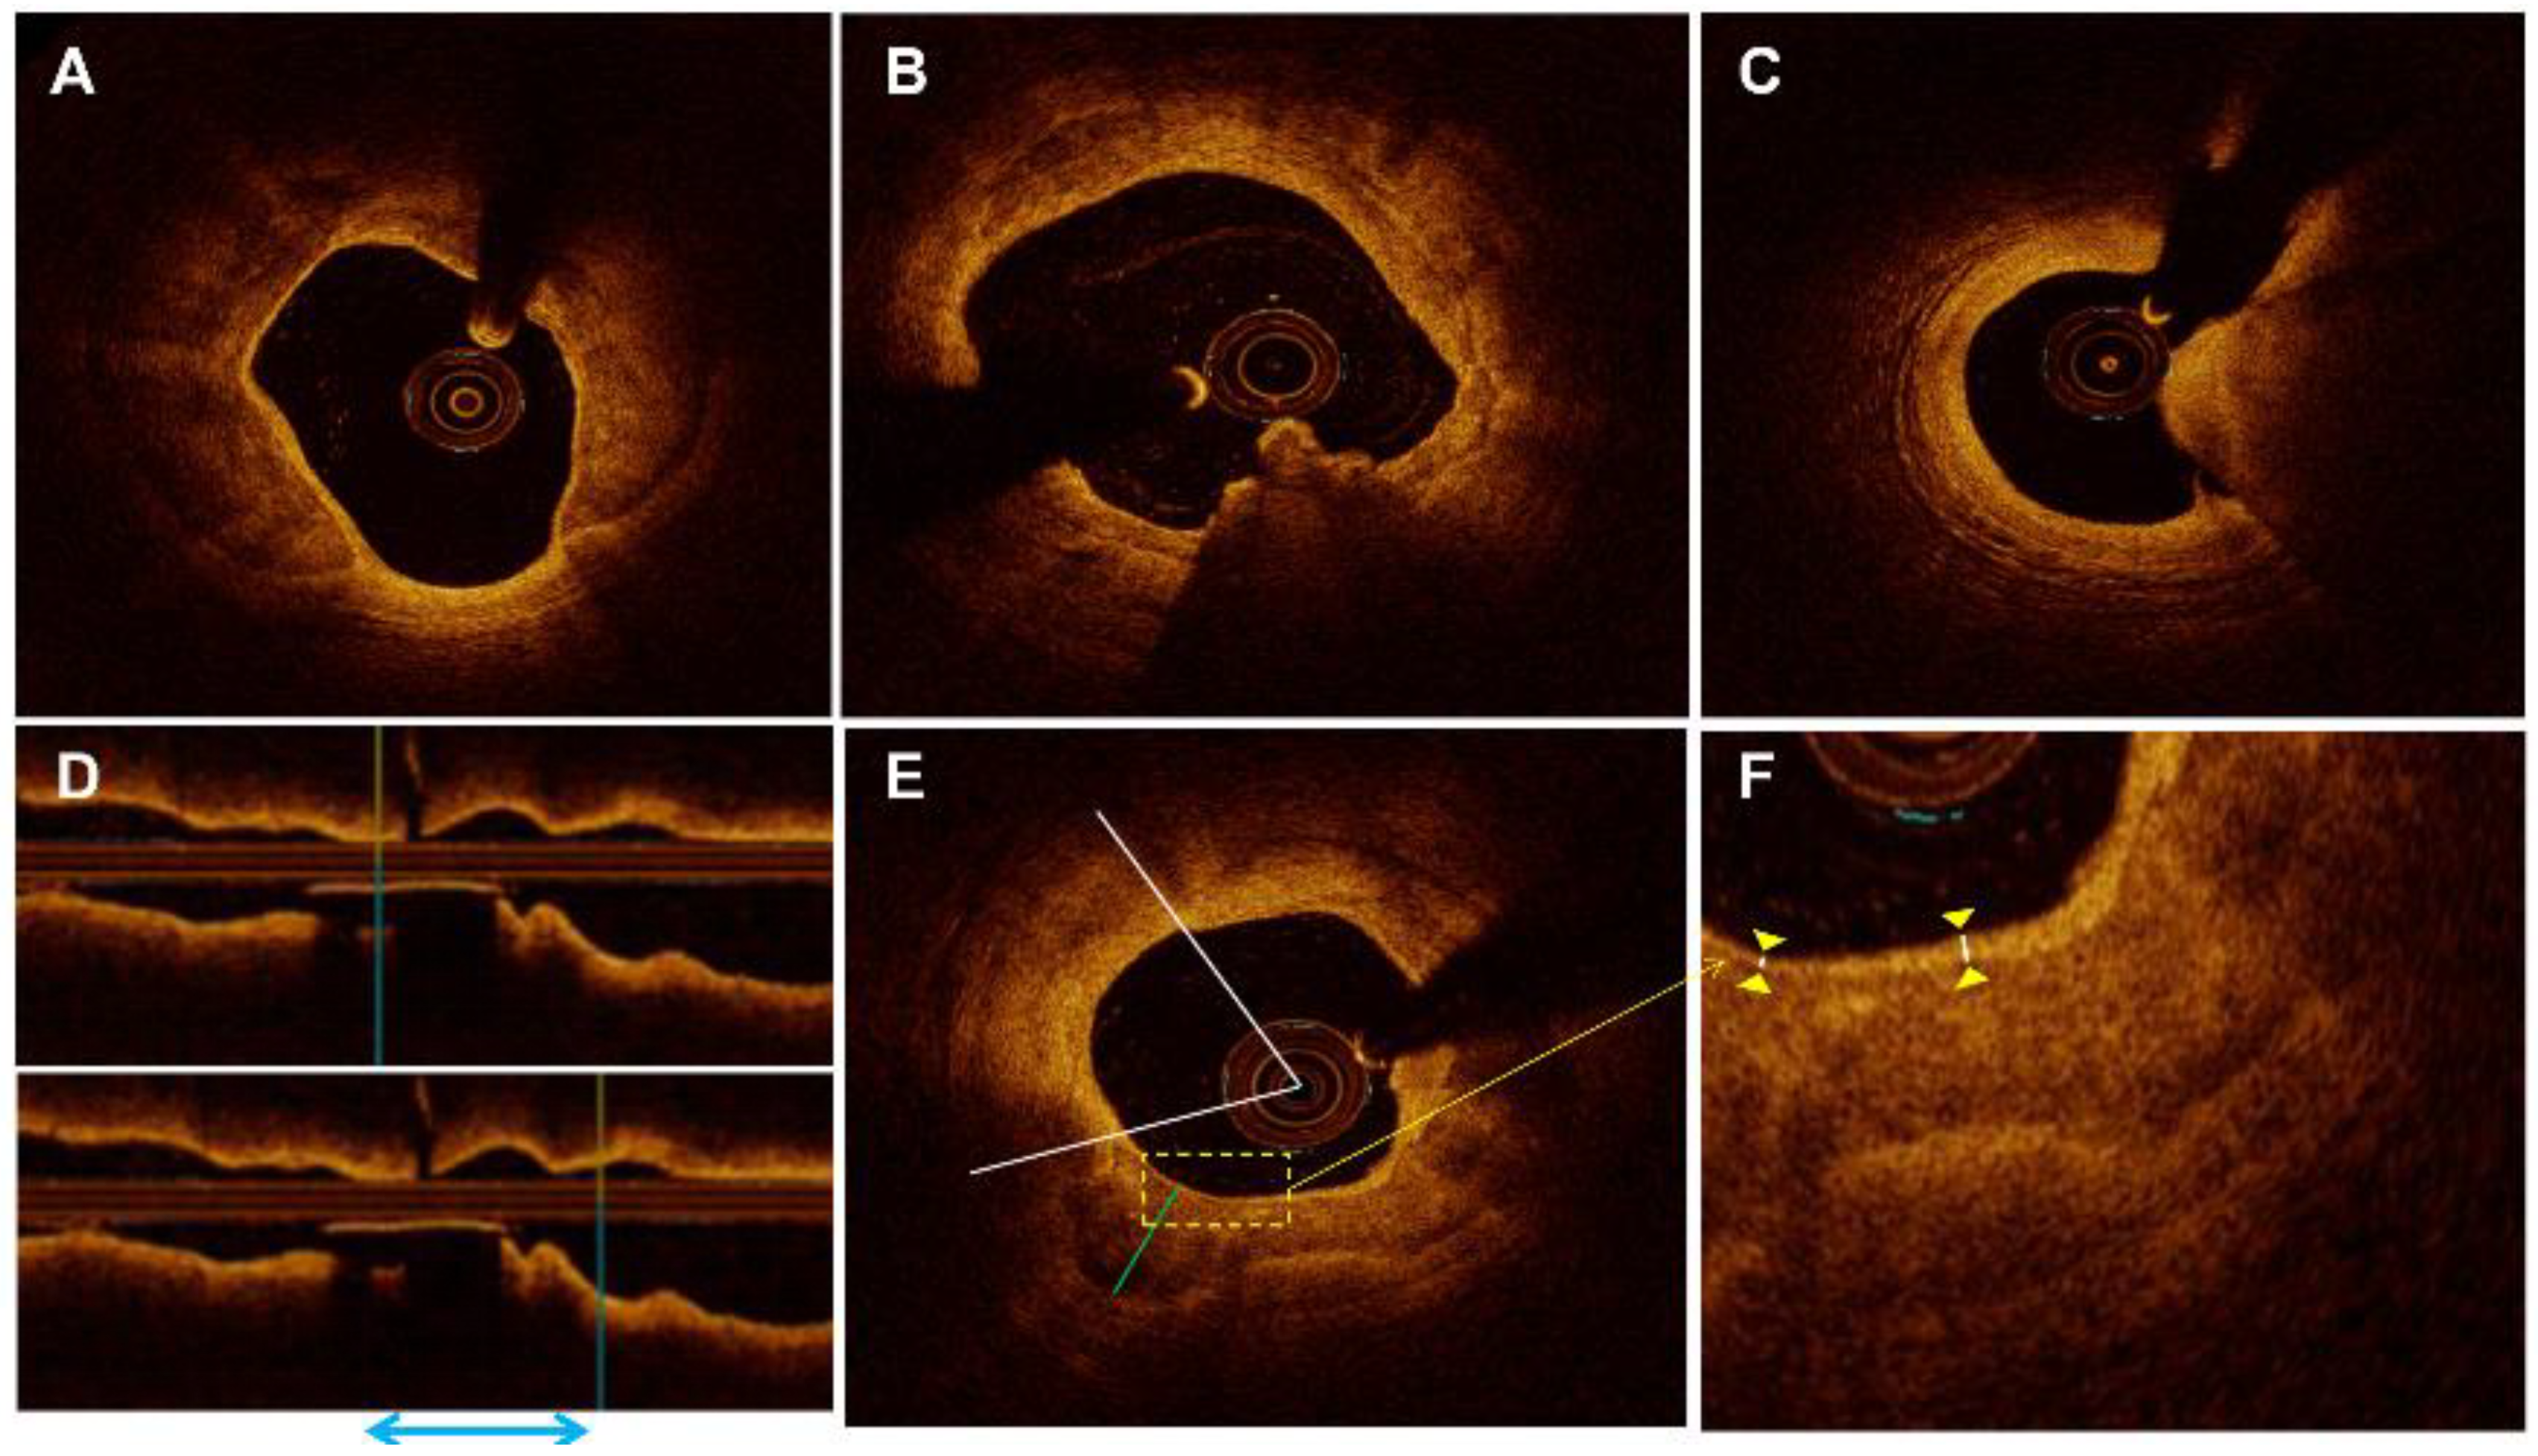
2.3. OCT Image Acquisition and Analysis
2.4. Clinical Follow-Up
2.5. Statistical Analysis
3. Results
3.1. Baseline Clinical Characteristics of Different Calcified Plaques
3.2. Angiographic Findings and Procedural Characteristics of Different Calcified Plaques
3.3. Morphological Characteristics of Different Calcified Plaques before and after Stent Implantation
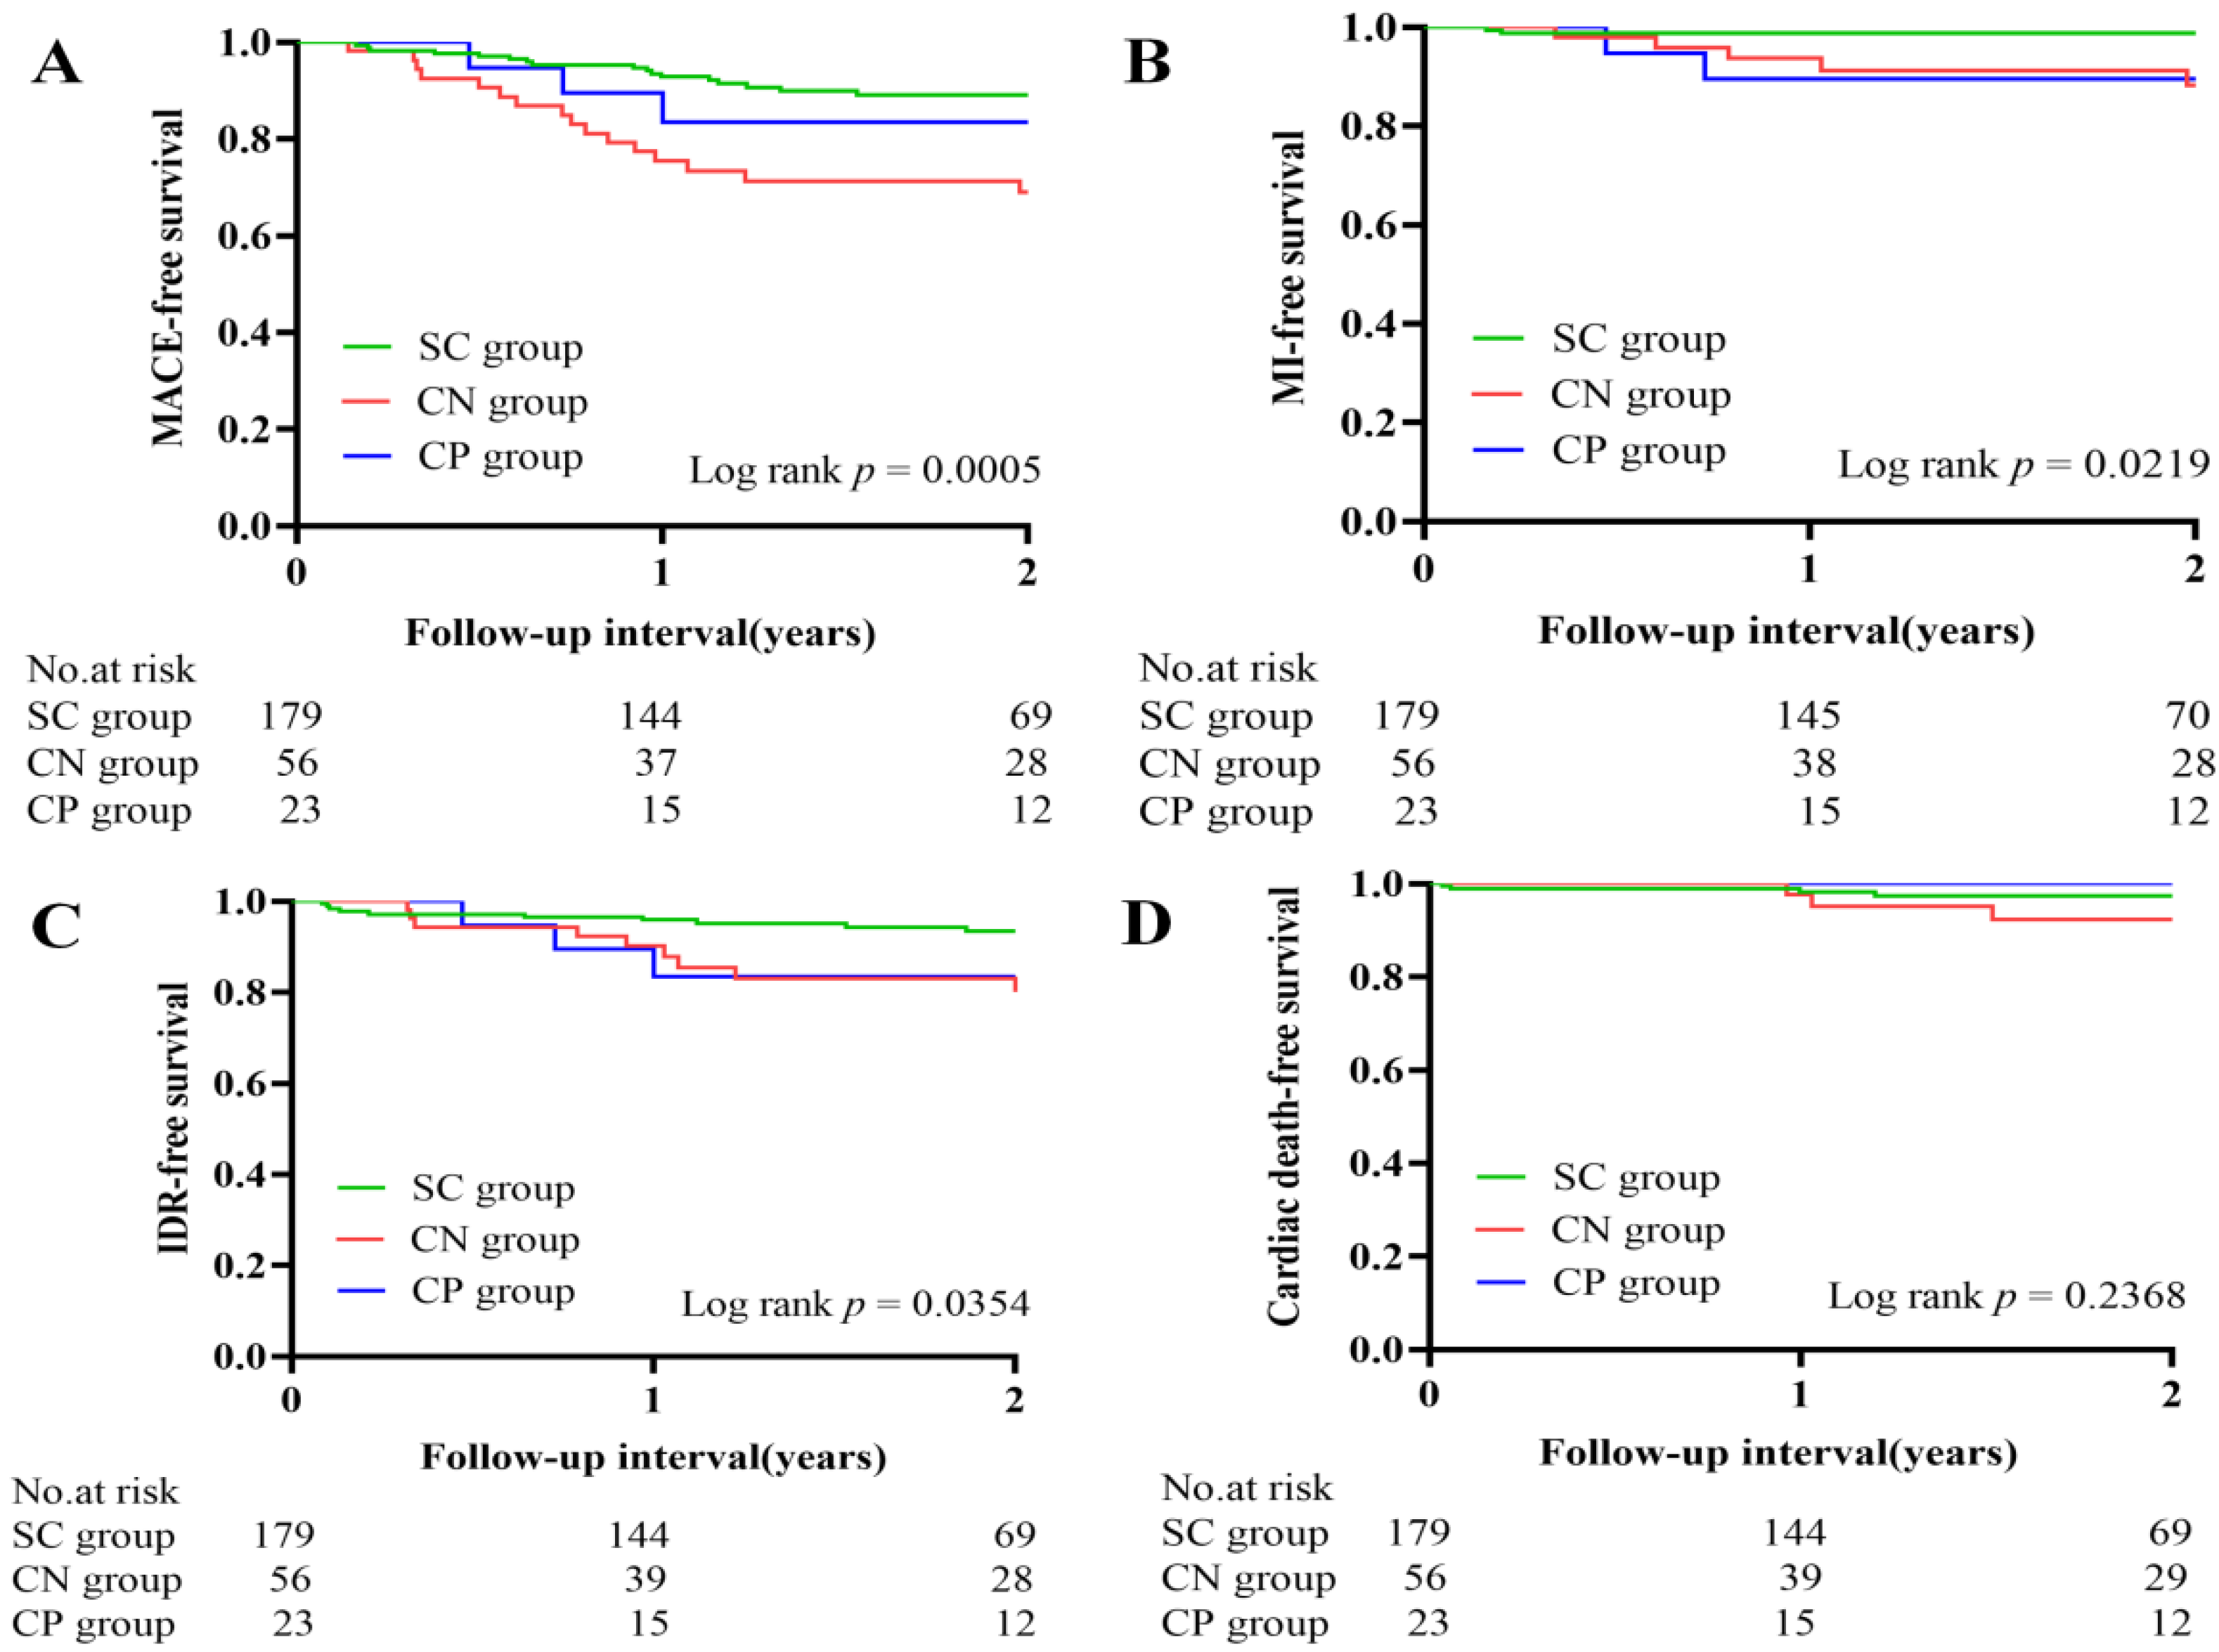
3.4. Clinical Outcomes
4. Discussion
4.1. Classification of Calcified Plaque and Baseline Characteristics of Patients
4.2. OCT Characteristics of Different Calcified Plaques before and after PCI
4.3. Clinical Outcomes and Calcification-Related Predictors
4.4. Clinical Significance
5. Limitations
6. Conclusions
Supplementary Materials
Author Contributions
Funding
Institutional Review Board Statement
Informed Consent Statement
Data Availability Statement
Acknowledgments
Conflicts of Interest
References
- Greenland, P.; LaBree, L.; Azen, S.P.; Doherty, T.M.; Detrano, R.C. Coronary artery calcium score combined with Framingham score for risk prediction in asymptomatic individuals. JAMA 2004, 291, 210–215. [Google Scholar] [CrossRef] [PubMed] [Green Version]
- Généreux, P.; Madhavan, M.V.; Mintz, G.S.; Maehara, A.; Palmerini, T.; LaSalle, L.; Xu, K.; McAndrew, T.; Kirtane, A.; Lansky, A.J.; et al. Ischemic outcomes after coronary intervention of calcified vessels in acute coronary syndromes. Pooled analysis from the HORIZONS-AMI (Harmonizing Outcomes with Revascularization and Stents in Acute Myocardial Infarction) and ACUITY (Acute Catheterization and Urgent Intervention Triage Strategy) TRIALS. J. Am. Coll. Cardiol. 2014, 63, 1845–1854. [Google Scholar] [PubMed] [Green Version]
- Madhavan, M.V.; Tarigopula, M.; Mintz, G.S.; Maehara, A.; Stone, G.W.; Généreux, P. Coronary artery calcification: Pathogenesis and prognostic implications. J. Am. Coll. Cardiol. 2014, 63, 1703–1714. [Google Scholar] [CrossRef] [PubMed] [Green Version]
- Jang, I.-K.; Bouma, B.E.; Kang, D.-H.; Park, S.-J.; Park, S.-W.; Seung, K.-B.; Choi, K.-B.; Shishkov, M.; Schlendorf, K.; Pomerantsev, E.; et al. Visualization of coronary atherosclerotic plaques in patients using optical coherence tomography: Comparison with intravascular ultrasound. J. Am. Coll. Cardiol. 2002, 39, 604–609. [Google Scholar] [CrossRef] [Green Version]
- Yabushita, H.; Bouma, B.E.; Houser, S.L.; Aretz, H.T.; Jang, I.-K.; Schlendorf, K.H.; Kauffman, C.R.; Shishkov, M.; Kang, D.-H.; Halpern, E.F.; et al. Characterization of human atherosclerosis by optical coherence tomography. Circulation 2002, 106, 1640–1645. [Google Scholar] [CrossRef]
- Sugiyama, T.; Yamamoto, E.; Fracassi, F.; Lee, H.; Yonetsu, T.; Kakuta, T.; Soeda, T.; Saito, Y.; Yan, B.P.; Kurihara, O.; et al. Calcified Plaques in Patients with Acute Coronary Syndromes. J. Am. Coll. Cardiol. Cardiovasc. Interv. 2019, 12, 531–540. [Google Scholar] [CrossRef]
- Nakajima, A.; Araki, M.; Kurihara, O.; Minami, Y.; Soeda, T.; Yonetsu, T.; Crea, F.; Takano, M.; Higuma, T.; Kakuta, T.; et al. Comparison of post-stent optical coherence tomography findings among three subtypes of calcified culprit plaques in patients with acute coronary syndrome. Catheter. Cardiovasc. Interv. 2021, 97, 634–645. [Google Scholar] [CrossRef]
- Serruys, P.W.; Foley, D.P.; de Feyter, P.J. Quantitative Coronary Angiography in Clinical Practice; Kluwer Academic: Dordrecht, The Netherlands, 1994. [Google Scholar]
- TIMI Study Group. The Thrombolysis in Myocardial Infarction (TIMI) trial. Phase I findings. N. Engl. J. Med. 1985, 312, 932–936. [Google Scholar] [CrossRef]
- Ellis, S.G.; Vandormael, M.G.; Cowley, M.J.; DiSciascio, G.; Deligonul, U.; Topol, E.J.; Bulle, T.M. Coronary morphologic and clinical determinants of procedural outcome with angioplasty for multivessel coronary disease. Implications for patient selection. Multivessel Angioplasty Prognosis Study Group. Circulation 1990, 82, 1193–1202. [Google Scholar] [CrossRef] [Green Version]
- Mintz, G.S.; Popma, J.J.; Pichard, A.D.; Kent, K.M.; Satler, L.F.; Chuang, Y.C.; Ditrano, C.J.; Leon, M.B. Patterns of calcification in coronary artery disease. A statistical analysis of intravascular ultrasound and coronary angiography in 1155 lesions. Circulation 1995, 91, 1959–1965. [Google Scholar] [CrossRef]
- Prati, F.; Regar, E.; Mintz, G.S.; Arbustini, E.; Di Mario, C.; Jang, I.-K.; Akasaka, T.; Costa, M.; Guagliumi, G.; Grube, E.; et al. Expert review document on methodology, terminology, and clinical applications of optical coherence tomography: Physical principles, methodology of image acquisition, and clinical application for assessment of coronary arteries and atherosclerosis. Eur. Heart J. 2010, 31, 401–415. [Google Scholar] [CrossRef]
- Lee, T.; Mintz, G.S.; Matsumura, M.; Zhang, W.; Cao, Y.; Usui, E.; Kanaji, Y.; Murai, T.; Yonetsu, T.; Kakuta, T.; et al. Prevalence, Predictors, and Clinical Presentation of a Calcified Nodule as Assessed by Optical Coherence Tomography. J. Am. Coll. Cardiol. Cardiovasc. Imaging 2017, 10, 883–891. [Google Scholar] [CrossRef]
- Falk, E.; Nakano, M.; Bentzon, J.F.; Finn, A.V.; Virmani, R. Update on acute coronary syndromes: The pathologists’ view. Eur. Heart J. 2013, 34, 719–728. [Google Scholar] [CrossRef] [PubMed] [Green Version]
- Chambers, J.; Behrens, A.; Martinsen, B. Atherectomy Devices for the Treatment of Calcified Coronary Lesions. Interv. Cardiol. Clin. 2016, 5, 143–151. [Google Scholar] [CrossRef] [PubMed]
- Khalifa, A.K.M.; Kubo, T.; Ino, Y.; Terada, K.; Emori, H.; Higashioka, D.; Katayama, Y.; Takahata, M.; Shimamura, K.; Shiono, Y.; et al. Optical Coherence Tomography Comparison of Percutaneous Coronary Intervention Among Plaque Rupture, Erosion, and Calcified Nodule in Acute Myocardial Infarction. Circ. J. 2020, 84, 911–916. [Google Scholar] [CrossRef] [Green Version]
- Kobayashi, N.; Takano, M.; Tsurumi, M.; Shibata, Y.; Nishigoori, S.; Uchiyama, S.; Okazaki, H.; Shirakabe, A.; Seino, Y.; Hata, N.; et al. Features and Outcomes of Patients with Calcified Nodules at Culprit Lesions of Acute Coronary Syndrome: An Optical Coherence Tomography Study. Cardiology 2018, 139, 90–100. [Google Scholar] [CrossRef]
- Guedeney, P.; Claessen, B.E.; Mehran, R.; Mintz, G.S.; Liu, M.; Sorrentino, S.; Giustino, G.; Farhan, S.; Leon, M.B.; Serruys, P.W.; et al. Coronary Calcification and Long-Term Outcomes According to Drug-Eluting Stent Generation. J. Am. Coll. Cardiol. Cardiovasc. Interv. 2020, 13, 1417–1428. [Google Scholar] [CrossRef] [PubMed]
- Mosseri, M.; Satler, L.F.; Pichard, A.D.; Waksman, R. Impact of vessel calcification on outcomes after coronary stenting. Cardiovasc. Revasc. Med. 2005, 6, 147–153. [Google Scholar] [CrossRef] [PubMed]
- Kume, T.; Okura, H.; Miyamoto, Y.; Yamada, R.; Saito, K.; Tamada, T.; Koyama, T.; Neishi, Y.; Hayashida, A.; Kawamoto, T.; et al. Natural history of stent edge dissection, tissue protrusion and incomplete stent apposition detectable only on optical coherence tomography after stent implantation—Preliminary observation. Circ. J. 2012, 76, 698–703. [Google Scholar] [CrossRef] [PubMed] [Green Version]
- Hoffmann, R.; Mintz, G.S.; Popma, J.J.; Satler, L.F.; Kent, K.M.; Pichard, A.D.; Leon, M.B. Treatment of calcified coronary lesions with Palmaz-Schatz stents. An intravascular ultrasound study. Eur. Heart J. 1998, 19, 1224–1231. [Google Scholar] [CrossRef] [PubMed] [Green Version]
- Nesbitt, W.S.; Westein, E.; Tovar-Lopez, F.J.; Tolouei, E.; Mitchell, A.; Fu, J.; Carberry, J.; Fouras, A.; Jackson, S.P. A shear gradient-dependent platelet aggregation mechanism drives thrombus formation. Nat. Med. 2009, 15, 665–673. [Google Scholar] [CrossRef] [PubMed]
- Malek, A.M.; Alper, S.L.; Izumo, S. Hemodynamic shear stress and its role in atherosclerosis. JAMA 1999, 282, 2035–2042. [Google Scholar] [CrossRef] [PubMed]
- Burke, A.P.; Farb, A.; Malcom, G.; Virmani, R. Effect of menopause on plaque morphologic characteristics in coronary atherosclerosis. Am. Heart J. 2001, 141, S58–S62. [Google Scholar] [CrossRef]
- Sangiorgi, G.; Rumberger, J.A.; Severson, A.; Edwards, W.D.; Gregoire, J.; Fitzpatrick, L.A.; Schwartz, R.S. Arterial calcification and not lumen stenosis is highly correlated with atherosclerotic plaque burden in humans: A histologic study of 723 coronary artery segments using nondecalcifying methodology. J. Am. Coll. Cardiol. 1998, 31, 126–133. [Google Scholar] [CrossRef] [Green Version]
- Bourantas, C.V.; Zhang, Y.-J.; Garg, S.; Mack, M.; Dawkins, K.D.; Kappetein, A.P.; Mohr, F.W.; Colombo, A.; Holmes, D.R.; Ståhle, E.; et al. Prognostic implications of severe coronary calcification in patients undergoing coronary artery bypass surgery: An analysis of the SYNTAX study. Catheter. Cardiovasc. Interv. 2015, 85, 199–206. [Google Scholar] [CrossRef]
- Généreux, P.; Redfors, B.; Witzenbichler, B.; Arsenault, M.-P.; Weisz, G.; Stuckey, T.D.; Rinaldi, M.J.; Neumann, F.-J.; Metzger, D.C.; Henry, T.D.; et al. Two-year outcomes after percutaneous coronary intervention of calcified lesions with drug-eluting stents. Int. J. Cardiol. 2017, 231, 61–67. [Google Scholar] [CrossRef]
- Arbab-Zadeh, A.; Fuster, V. From Detecting the Vulnerable Plaque to Managing the Vulnerable Patient: JACC State-of-the-Art Review. J. Am. Coll. Cardiol. 2019, 74, 1582–1593. [Google Scholar] [CrossRef]
- O’gara, P.T.; Kushner, F.G.; Ascheim, D.D.; Casey, D.E.; Chung, M.K.; De Lemos, J.A.; Ettinger, S.M.; Fang, J.C.; Fesmire, F.M.; Franklin, B.A.; et al. 2013 ACCF/AHA Guideline for the Management of ST-Elevation Myocardial Infarction: Executive Summary: A Report of the American College of Cardiology Foundation/American Heart Association Task Force on Practice Guidelines. Am. Coll. Cardiol. 2013, 61, e78–e140. [Google Scholar] [CrossRef] [Green Version]
- Amsterdam, E.A.; Wenger, N.K.; Brindis, R.G.; Casey, D.E.; Ganiats, T.G.; Holmes, D.R.; Jaffe, A.S.; Jneid, H.; Kelly, R.F.; Kontos, M.C.; et al. 2014 AHA/ACC guideline for the management of patients with non-ST-elevation acute coronary syndromes: A report of the American College of Cardiology/American Heart Association Task Force on Practice Guidelines. Circulation 2014, 130, e344–e426. [Google Scholar]
- Wang, X.; Matsumura, M.; Mintz, G.S.; Lee, T.; Zhang, W.; Cao, Y.; Fujino, A.; Lin, Y.; Usui, E.; Kanaji, Y.; et al. In Vivo Calcium Detection by Comparing Optical Coherence Tomography, Intravascular Ultrasound, and Angiography. JACC Cardiovasc. Imaging 2017, 10, 869–879. [Google Scholar] [CrossRef]
- Soeda, T.; Uemura, S.; Park, S.J.; Jang, Y.; Lee, S.; Cho, J.M.; Kim, S.J.; Vergallo, R.; Minami, Y.; Ong, D.S.; et al. Incidence and Clinical Significance of Poststent Optical Coherence Tomography Findings: One-Year Follow-Up Study From a Multicenter Registry. Circulation 2015, 132, 1020–1029. [Google Scholar] [CrossRef] [PubMed]
- Thygesen, K.; Alpert, J.S.; Jaffe, A.S.; Chaitman, B.R.; Bax, J.J.; Morrow, D.A.; White, H.D.; Executive Group on behalf of the Joint European Society of Cardiology (ESC)/American College of Cardiology (ACC)/American Heart Association (AHA)/World Heart Federation (WHF) Task Force for the Universal Definition of Myocardial Infarction. Fourth Universal Definition of Myocardial Infarction. J. Am. Coll. Cardiol. 2018, 72, 2231–2264. [Google Scholar] [CrossRef] [PubMed]
- Hicks, K.A.; Mahaffey, K.W.; Mehran, R.; Nissen, S.E.; Wiviott, S.D.; Dunn, B.; Solomon, S.D.; Marler, J.R.; Teerlink, J.R.; Farb, A.; et al. 2017 Cardiovascular and Stroke Endpoint Definitions for Clinical Trials. J. Am. Coll. Cardiol. 2018, 71, 1021–1034. [Google Scholar] [CrossRef] [PubMed]


| Variables | SC Group (n = 179) | CN Group (n = 56) | CP Group (n = 23) | p Value | p * Value | ||
|---|---|---|---|---|---|---|---|
| SC vs. CN vs. CP | SC vs. CN | SC vs. CP | CN vs. CP | ||||
| Age, years | 65.0 ± 9.3 | 65.9 ± 9.5 | 65.2 ± 7.9 | 0.809 | NA | NA | NA |
| Sex | 0.995 | NA | NA | NA | |||
| Male, n (%) | 117 (65.4) | 37 (66.1) | 15 (65.2) | ||||
| Female, n (%) | 62 (34.6) | 19 (33.9) | 8 (34.8) | ||||
| Clinical presentation | 0.919 | NA | NA | NA | |||
| STEMI, n (%) | 89 (49.7) | 25 (44.6) | 10 (43.5) | ||||
| NSTEMI, n (%) | 21 (11.7) | 6 (10.7) | 3 (13.0) | ||||
| UAP, n (%) | 69 (38.5) | 25 (44.6) | 10 (43.5) | ||||
| Risk factors | |||||||
| Hypertension, n (%) | 103 (57.5) | 42 (75.0) | 14 (60.9) | 0.064 | NA | NA | NA |
| Diabetes mellitus, n (%) | 43 (24.0) | 22 (39.3) | 6 (26.1) | 0.082 | NA | NA | NA |
| Dyslipidemia, n (%) | 103 (57.5) | 30 (53.6) | 14 (60.9) | 0.806 | NA | NA | NA |
| Smoking status | 0.139 | NA | NA | NA | |||
| Never | 107 (59.8) | 30 (53.6) | 12 (52.2) | ||||
| Former | 16 (8.9) | 12 (21.4) | 2 (8.7) | ||||
| Current | 56 (31.3) | 14 (25.0) | 9 (39.1) | ||||
| Clinical history | |||||||
| CKD, n (%) | 1 (0.6) | 5 (8.9) | 2 (8.7) | 0.001 | 0.003 | 0.035 | 1.000 |
| Previous MI, n (%) | 15 (8.4) | 11 (19.6) | 9 (39.1) | <0.001 | 0.036 | <0.001 | 0.127 |
| Previous PCI, n (%) | 17 (9.5) | 10 (17.9) | 8 (34.8) | 0.002 | 0.141 | 0.002 | 0.182 |
| Previous CABG, n (%) | 1 (0.6) | 1 (1.8) | 0 (0) | 0.519 | NA | NA | NA |
| Laboratory data | |||||||
| TC, mg/dL | 168.9 ± 48.7 | 169.5 ± 44.9 | 152.3 ± 39.9 | 0.286 | NA | NA | NA |
| TG, mg/dL | 117.0 (85.1, 169.2) | 137.3 (88.2, 209.1) | 136.4 (98.8, 154.6) | 0.486 | NA | NA | NA |
| LDL-C, mg/dL | 101.7 ± 39.1 | 99.9 ± 37.9 | 83.4 ± 29.9 | 0.108 | NA | NA | NA |
| HDL-C, mg/dL | 49.7 ± 16.9 | 46.4 ± 12.9 | 45.3 ± 11.8 | 0.243 | NA | NA | NA |
| CK-MB, ug/L | 2.3 (0.8, 20.7) | 1.8 (0.6, 7.2) | 1.2 (0.5, 22.2) | 0.253 | NA | NA | NA |
| cTnI, ug/L | 0.30 (0.02, 5.24) | 0.15 (0.02, 1.52) | 0.28 (0.02, 3.04) | 0.290 | NA | NA | NA |
| HbA1c, % | 6.3 ± 1.5 | 6.4 ± 1.2 | 6.2 ± 1.3 | 0.782 | NA | NA | NA |
| hs-CRP, mg/L | 3.2 (1.2, 9.4) | 2.5 (1.0, 5.9) | 2.5 (0.9, 10.8) | 0.744 | NA | NA | NA |
| LVEF, % | 58.2 ± 7.2 | 57.7 ± 7.8 | 57.3 ± 7.8 | 0.834 | 0.661 | 0.633 | 0.872 |
| Medication at discharge | |||||||
| Aspirin, n (%) | 177 (98.9) | 56 (100) | 23 (100) | 0.641 | NA | NA | NA |
| Clopidogrel/Tigrillo, n (%) | 178 (99.4) | 55 (98.2) | 23 (100) | 0.597 | NA | NA | NA |
| Statin, n (%) | 176 (98.3) | 56 (100) | 23 (100) | 0.512 | NA | NA | NA |
| ACEI/ARB, n (%) | 89 (49.7) | 31 (55.4) | 15 (65.2) | 0.329 | NA | NA | NA |
| β–blockers, n (%) | 113 (63.1) | 36 (64.3) | 15 (65.2) | 0.973 | NA | NA | NA |
| CCB, n (%) | 27 (15.1) | 11 (19.6) | 3 (13.0) | 0.705 | NA | NA | NA |
| Variables | SC Group (n = 179) | CN Group (n = 56) | CP Group (n = 23) | p Value | p * Value | ||
|---|---|---|---|---|---|---|---|
| SC vs. CN vs. CP | SC vs. CN | SC vs. CP | CN vs. CP | ||||
| Culprit vessel | 0.013 | 0.130 | 0.009 | 0.093 | |||
| Left anterior descending artery | 128 (71.5) | 32 (57.1) | 13 (56.5) | ||||
| Left circumflex artery | 14 (7.8) | 7 (12.5) | 7 (30.4) | ||||
| Right coronary artery | 37 (20.7) | 17 (30.4) | 3 (13.0) | ||||
| TIMI flow grade 0–1 | 56 (31.3) | 12 (21.4) | 7 (30.4) | 0.362 | NA | NA | NA |
| Multivessel disease | 156 (87.2) | 54 (96.4) | 22 (95.7) | 0.081 | NA | NA | NA |
| Quantitative coronary angiography analysis | |||||||
| Lesion length, mm | 31.3 ± 10.7 | 33.4 ± 12.6 | 28.6 ± 10.5 | 0.186 | NA | NA | NA |
| Minimal lumen diameter, mm | 0.65 ± 0.32 | 0.63 ± 0.33 | 0.60 ± 0.29 | 0.766 | NA | NA | NA |
| Reference vessel diameter, mm | 3.12 ± 0.62 | 3.18 ± 0.62 | 3.06 ± 0.64 | 0.670 | NA | NA | NA |
| Diameter stenosis, % | 78.7 ± 10.7 | 79.6 ± 10.8 | 79.4 ±9.2 | 0.844 | NA | NA | NA |
| Procedural characteristics | |||||||
| Number of stents, n | 1.3 ± 0.5 | 1.5 ± 0.6 | 1.3 ± 0.4 | 0.072 | NA | NA | NA |
| Multiple stents, n (%) | 52 (29.1) | 25 (44.6) | 6 (26.1) | 0.075 | NA | NA | NA |
| Stent length, mm | 35.9 ± 12.3 | 40.7 ± 13.2 | 34.0 ± 14.3 | 0.027 | 0.014 | 0.496 | 0.034 |
| Stent diameter, mm | 3.14 ± 0.36 | 3.16 ± 0.36 | 3.05 ± 0.49 | 0.673 | NA | NA | NA |
| Rotational atherectomy, n (%) | 9 (5.0) | 12 (21.4) | 1 (4.3) | 0.001 | <0.001 | 1.000 | 0.094 |
| Thrombectomy, n (%) | 7 (3.9) | 3 (5.4) | 0 (0) | 0.764 | NA | NA | NA |
| Pre-dilation, n (%) | 173 (96.6) | 53 (94.6) | 22 (95.7) | 0.574 | NA | NA | NA |
| Post-dilation, n (%) | 165 (92.2) | 51 (91.1) | 22 (95.7) | 0.867 | NA | NA | NA |
| Pressure of pre-dilation, atm | 13.4 ± 3.7 | 15.5 ± 3.3 | 13.8 ± 4.3 | 0.004 | 0.001 | 0.742 | 0.101 |
| Pressure of post-dilation, atm | 20.5 ± 3.6 | 20.2 ± 3.3 | 20.4 ± 3.0 | 0.929 | NA | NA | NA |
| Thrombus aspiration | 68 (38.0) | 18 (32.1) | 7 (30.4) | 0.613 | NA | NA | NA |
| Variables | SC Group (n = 179) | CN Group (n = 56) | CP Group (n = 23) | p Value | P * Value | ||
|---|---|---|---|---|---|---|---|
| SC vs. CN vs. CP | SC vs. CN | SC vs. CP | CN vs. CP | ||||
| Preprocedural optical coherence tomography analysis | |||||||
| Reference lumen area, mm2 | 6.32 ± 2.06 | 6.70 ± 2.92 | 4.96 ±1.91 | 0.008 | 0.278 | 0.007 | 0.002 |
| Minimal lumen area, mm2 | 1.45 ± 0.53 | 1.63 ± 0.71 | 1.58 ± 0.74 | 0.117 | 0.049 | 0.338 | 0.717 |
| Area stenosis, % | 76.8 ± 10.2 | 75.7 ± 8.9 | 70.5 ± 14.1 | 0.023 | 0.483 | 0.006 | 0.043 |
| Calcification length, mm | 15.5 ± 7.3 | 22.2 ± 9.5 | 9.9 ± 4.3 | <0.001 | <0.001 | 0.001 | <0.001 |
| Mean calcification arc, ° | 149.6 ± 37.7 | 194.4 ± 44.2 | 90.3 ± 19.4 | <0.001 | <0.001 | <0.001 | <0.001 |
| Maximal calcification arc, ° | 249.8 ± 70.6 | 320.9 ± 50.0 | 137.3 ± 44.1 | <0.001 | <0.001 | <0.001 | <0.001 |
| Mean calcification depth, μm | 90.0 (60.0, 130.0) | 50.0 (30.0, 70.0) | 120.0 (87.5, 170.0) | <0.001 | <0.001 | 0.007 | <0.001 |
| Minimal calcification depth, μm | 10.0 (10.0, 20.0) | 0.0 (0.0, 10.0) | 30.0 (20.0, 50.0) | <0.001 | <0.001 | 0.002 | <0.001 |
| Mean calcification thickness, μm | 758.1 ± 156.3 | 789.3 ± 146.2 | 854.4 ± 207.3 | 0.018 | 0.202 | 0.007 | 0.100 |
| Maximal calcification thickness, μm | 1134.5 ± 241.2 | 1242.7 ± 257.3 | 1198.7 ± 251.6 | 0.013 | 0.004 | 0.239 | 0.470 |
| Calcification index | 2002.2 (1402.5, 2981.9) | 3888.6 (2963.6, 5561.7) | 878.0 (615.1, 1187.0) | <0.001 | <0.001 | <0.001 | <0.001 |
| Layered plaque, n (%) | 141 (78.8) | 35 (62.5) | 13 (56.5) | 0.009 | 0.023 | 0.036 | 0.810 |
| Macrophage, n (%) | 162 (90.5) | 55 (98.2) | 16 (69.6) | 0.001 | 0.081 | 0.010 | 0.001 |
| Microchannel, n (%) | 36 (20.1) | 7 (12.5) | 3 (13.0) | 0.376 | 0.277 | 0.578 | 1.000 |
| Cholesterol crystal, n (%) | 51 (28.5) | 16 (28.6) | 8 (34.8) | 0.819 | 1.000 | 0.703 | 0.782 |
| Thrombus | 94 (52.5) | 54 (96.4) | 11 (47.8) | <0.001 | <0.001 | 0.840 | <0.001 |
| Red | 12 (6.7) | 31 (55.4) | 4 (17.4) | ||||
| White | 73 (40.8) | 15 (26.8) | 7 (30.4) | ||||
| Mixed | 9 (5.0) | 8 (14.3) | 0 (0) | ||||
| Postprocedural optical coherence tomography analysis | |||||||
| Reference lumen area, mm2 | 7.91 ± 2.05 | 8.23 ± 2.83 | 6.99 ± 1.87 | 0.081 | 0.352 | 0.063 | 0.025 |
| Minimal stent area, mm2 | 4.26 ± 1.41 | 4.46 ± 1.53 | 4.40 ± 1.88 | 0.656 | 0.385 | 0.665 | 0.880 |
| Stent edge dissection, n (%) | 77 (43.0) | 41 (73.2) | 7 (30.4) | <0.001 | <0.001 | 0.354 | 0.001 |
| Proximal edge dissection, n (%) | 6 (3.4) | 2 (3.6) | 0 (0) | 1.000 | 1.000 | 1.000 | 1.000 |
| Distal edge dissection, n (%) | 8 (4.5) | 1 (1.8) | 0 (0) | 0.635 | 0.690 | 0.601 | 1.000 |
| In-stent dissection, n (%) | 67 (37.4) | 39 (69.6) | 7 (30.4) | <0.001 | <0.001 | 0.670 | 0.003 |
| ISA, n (%) | 56 (31.3) | 35 (62.5) | 8 (34.8) | <0.001 | <0.001 | 0.919 | 0.046 |
| Maximal ISA distance, μm | 0.37 ± 0.15 | 0.39 ± 0.19 | 0.40 ± 0.13 | 0.905 | 0.747 | 0.712 | 0.858 |
| In-stent tissue protrusion, n (%) | 133 (74.3) | 40 (71.4) | 19 (82.6) | 0.609 | 0.801 | 0.540 | 0.451 |
| Smooth protrusion, n (%) | 55 (30.7) | 12 (21.4) | 10 (43.5) | 0.135 | 0.240 | 0.320 | 0.087 |
| Disrupted fibrous tissue protrusion, n (%) | 33 (18.4) | 11 (19.6) | 5 (21.7) | 0.921 | 0.995 | 0.922 | 1.000 |
| Irregular protrusion, n (%) | 52 (29.1) | 21 (37.5) | 4 (17.4) | 0.202 | 0.304 | 0.325 | 0.111 |
| Thrombus | 66 (36.9) | 21 (37.5) | 6 (26.1) | 0.579 | 1.000 | 0.432 | 0.477 |
| White | 20 (11.2) | 9 (16.1) | 3 (13.0) | ||||
| Red | 39 (21.8) | 10 (17.9) | 3 (13.0) | ||||
| Mixed | 7 (3.9) | 2 (3.6) | 0 (0) | ||||
| Stent expansion ratio | 0.547 ± 0.137 | 0.554 ± 0.122 | 0.620 ± 0.147 | 0.051 | 0.712 | 0.015 | 0.051 |
| Stent under-expansion, n (%) | 172 (96.1) | 55 (98.2) | 21 (91.3) | 0.301 | 0.684 | 0.273 | 0.202 |
| Stent eccentricity | 0.346 ± 0.117 | 0.402 ± 0.104 | 0.333 ± 0.108 | 0.003 | 0.001 | 0.624 | 0.015 |
| Calcium fracture, n (%) | 77 (43.0) | 42 (75.0) | 1 (4.3) | <0.001 | <0.001 | <0.001 | <0.001 |
| Variables | SC Group (n = 179) | CN Group (n = 56) | CP Group (n = 23) | p Value | p * Value | ||
|---|---|---|---|---|---|---|---|
| SC vs. CN vs. CP | SC vs. CN | SC vs. CP | CN vs. CP | ||||
| MACE | 18 (10.1) | 18 (32.1) | 3 (13.0) | 0.001 | 0.007 | 0.691 | 0.234 |
| Cardiac death | 5 (2.8) | 4 (7.1) | 0 (0.0) | 0.265 | 0.171 | 0.427 | 0.229 |
| TVMI | 3 (1.7) | 5 (8.9) | 2 (8.7) | 0.016 | 0.011 | 0.033 | 0.985 |
| IDR | 10 (5.6) | 9 (16.1) | 3 (13.0) | 0.029 | 0.012 | 0.136 | 0.776 |
| Stroke | 7 (3.9) | 3 (5.4) | 1 (4.3) | 0.884 | 0.647 | 0.854 | 0.920 |
| Rehospitalization | 23 (12.8) | 13 (23.2) | 4 (17.4) | 0.157 | 0.075 | 0.502 | 0.644 |
| Bleeding | 3 (1.7) | 0 (0) | 1 (4.3) | 0.343 | 0.347 | 0.349 | 0.131 |
| Univariate Analysis | Multivariable Analysis | |||
|---|---|---|---|---|
| HR (95% CI) | p Value | HR (95% CI) | p Value | |
| Eruptive calcified nodules | 3.26 (1.74, 6.13) | <0.001 | 3.14(1.64, 6.02) | 0.001 |
| Sex | 1.46 (0.78, 2.76) | 0.238 | ||
| Age | 1.05 (1.02, 1.09) | 0.004 | 1.05(1.01, 1.09) | 0.009 |
| Hypertension | 1.39 (0.71, 2.75) | 0.341 | ||
| Diabetes mellitus | 1.58 (0.82, 3.05) | 0.170 | ||
| Dyslipidemia | 0.89 (0.47, 1.67) | 0.720 | ||
| Chronic kidney disease | 5.23 (1.84, 14.82) | 0.002 | ||
| Previous MI | 1.13 (0.47, 2.70) | 0.781 | ||
| Previous PCI | 1.01 (0.39, 2.58) | 0.986 | ||
| LDL-C | 1.01 (0.99, 1.01) | 0.187 | ||
| hs-CRP | 1.06 (1.00, 1.13) | 0.049 | ||
| LVEF | 1.00 (0.95, 1.04) | 0.915 | ||
| Stent length | 1.00 (0.97, 1.02) | 0.744 | ||
| Rotational atherectomy | 0.95 (0.29, 3.08) | 0.931 | ||
| Pressure of predilation | 1.06 (0.97, 1.16) | 0.166 | ||
| Area stenosis | 1.00 (0.97, 1.03) | 0.844 | ||
| Calcification length | 1.01 (0.98, 1.05) | 0.477 | ||
| Mean calcification arc | 1.00 (0.99, 1.01) | 0.110 | ||
| Maximal calcification arc | 1.01 (1.00, 1.01) | 0.017 | ||
| Mean calcification depth | 0.99 (0.99, 1.00) | 0.069 | ||
| Minimal calcification depth | 1.00 (0.98, 1.01) | 0.674 | ||
| Mean calcification thickness | 1.00 (0.99, 1.00) | 0.443 | ||
| Maximal calcification thickness | 1.00 (0.99, 1.00) | 0.488 | ||
| Thrombus | 3.10 (1.37, 7.03) | 0.007 | ||
| Macrophage | 2.29 (0.55, 9.56) | 0.256 | ||
| Layered plaque | 2.41 (1.28, 4.54) | 0.006 | ||
| Stent eccentricity | 4.27 (0.30, 60.92) | 0.284 | ||
| Stent edge dissection | 1.13 (0.60, 2.11) | 0.710 | ||
| Incomplete stent apposition | 1.24 (0.64, 2.42) | 0.521 | ||
| Calcium fracture | 1.43 (0.76, 2.70) | 0.266 | ||
Publisher’s Note: MDPI stays neutral with regard to jurisdictional claims in published maps and institutional affiliations. |
© 2022 by the authors. Licensee MDPI, Basel, Switzerland. This article is an open access article distributed under the terms and conditions of the Creative Commons Attribution (CC BY) license (https://creativecommons.org/licenses/by/4.0/).
Share and Cite
Lei, F.; Yin, Y.; Liu, X.; Fang, C.; Jiang, S.; Xu, X.; Sun, S.; Pei, X.; Jia, R.; Tang, C.; et al. Clinical Outcomes of Different Calcified Culprit Plaques in Patients with Acute Coronary Syndrome. J. Clin. Med. 2022, 11, 4018. https://doi.org/10.3390/jcm11144018
Lei F, Yin Y, Liu X, Fang C, Jiang S, Xu X, Sun S, Pei X, Jia R, Tang C, et al. Clinical Outcomes of Different Calcified Culprit Plaques in Patients with Acute Coronary Syndrome. Journal of Clinical Medicine. 2022; 11(14):4018. https://doi.org/10.3390/jcm11144018
Chicago/Turabian StyleLei, Fangmeng, Yanwei Yin, Xiaohui Liu, Chao Fang, Senqing Jiang, Xueming Xu, Sibo Sun, Xueying Pei, Ruyi Jia, Caiying Tang, and et al. 2022. "Clinical Outcomes of Different Calcified Culprit Plaques in Patients with Acute Coronary Syndrome" Journal of Clinical Medicine 11, no. 14: 4018. https://doi.org/10.3390/jcm11144018