
Potential Biochemical Markers and Radiomorphometric Indices as Predictors of Reduced Bone Mass in Patients with Congenital Hemophilia

 , , and
Abstract
:1. Introduction
2. Materials and Methods
2.1. Study Participants
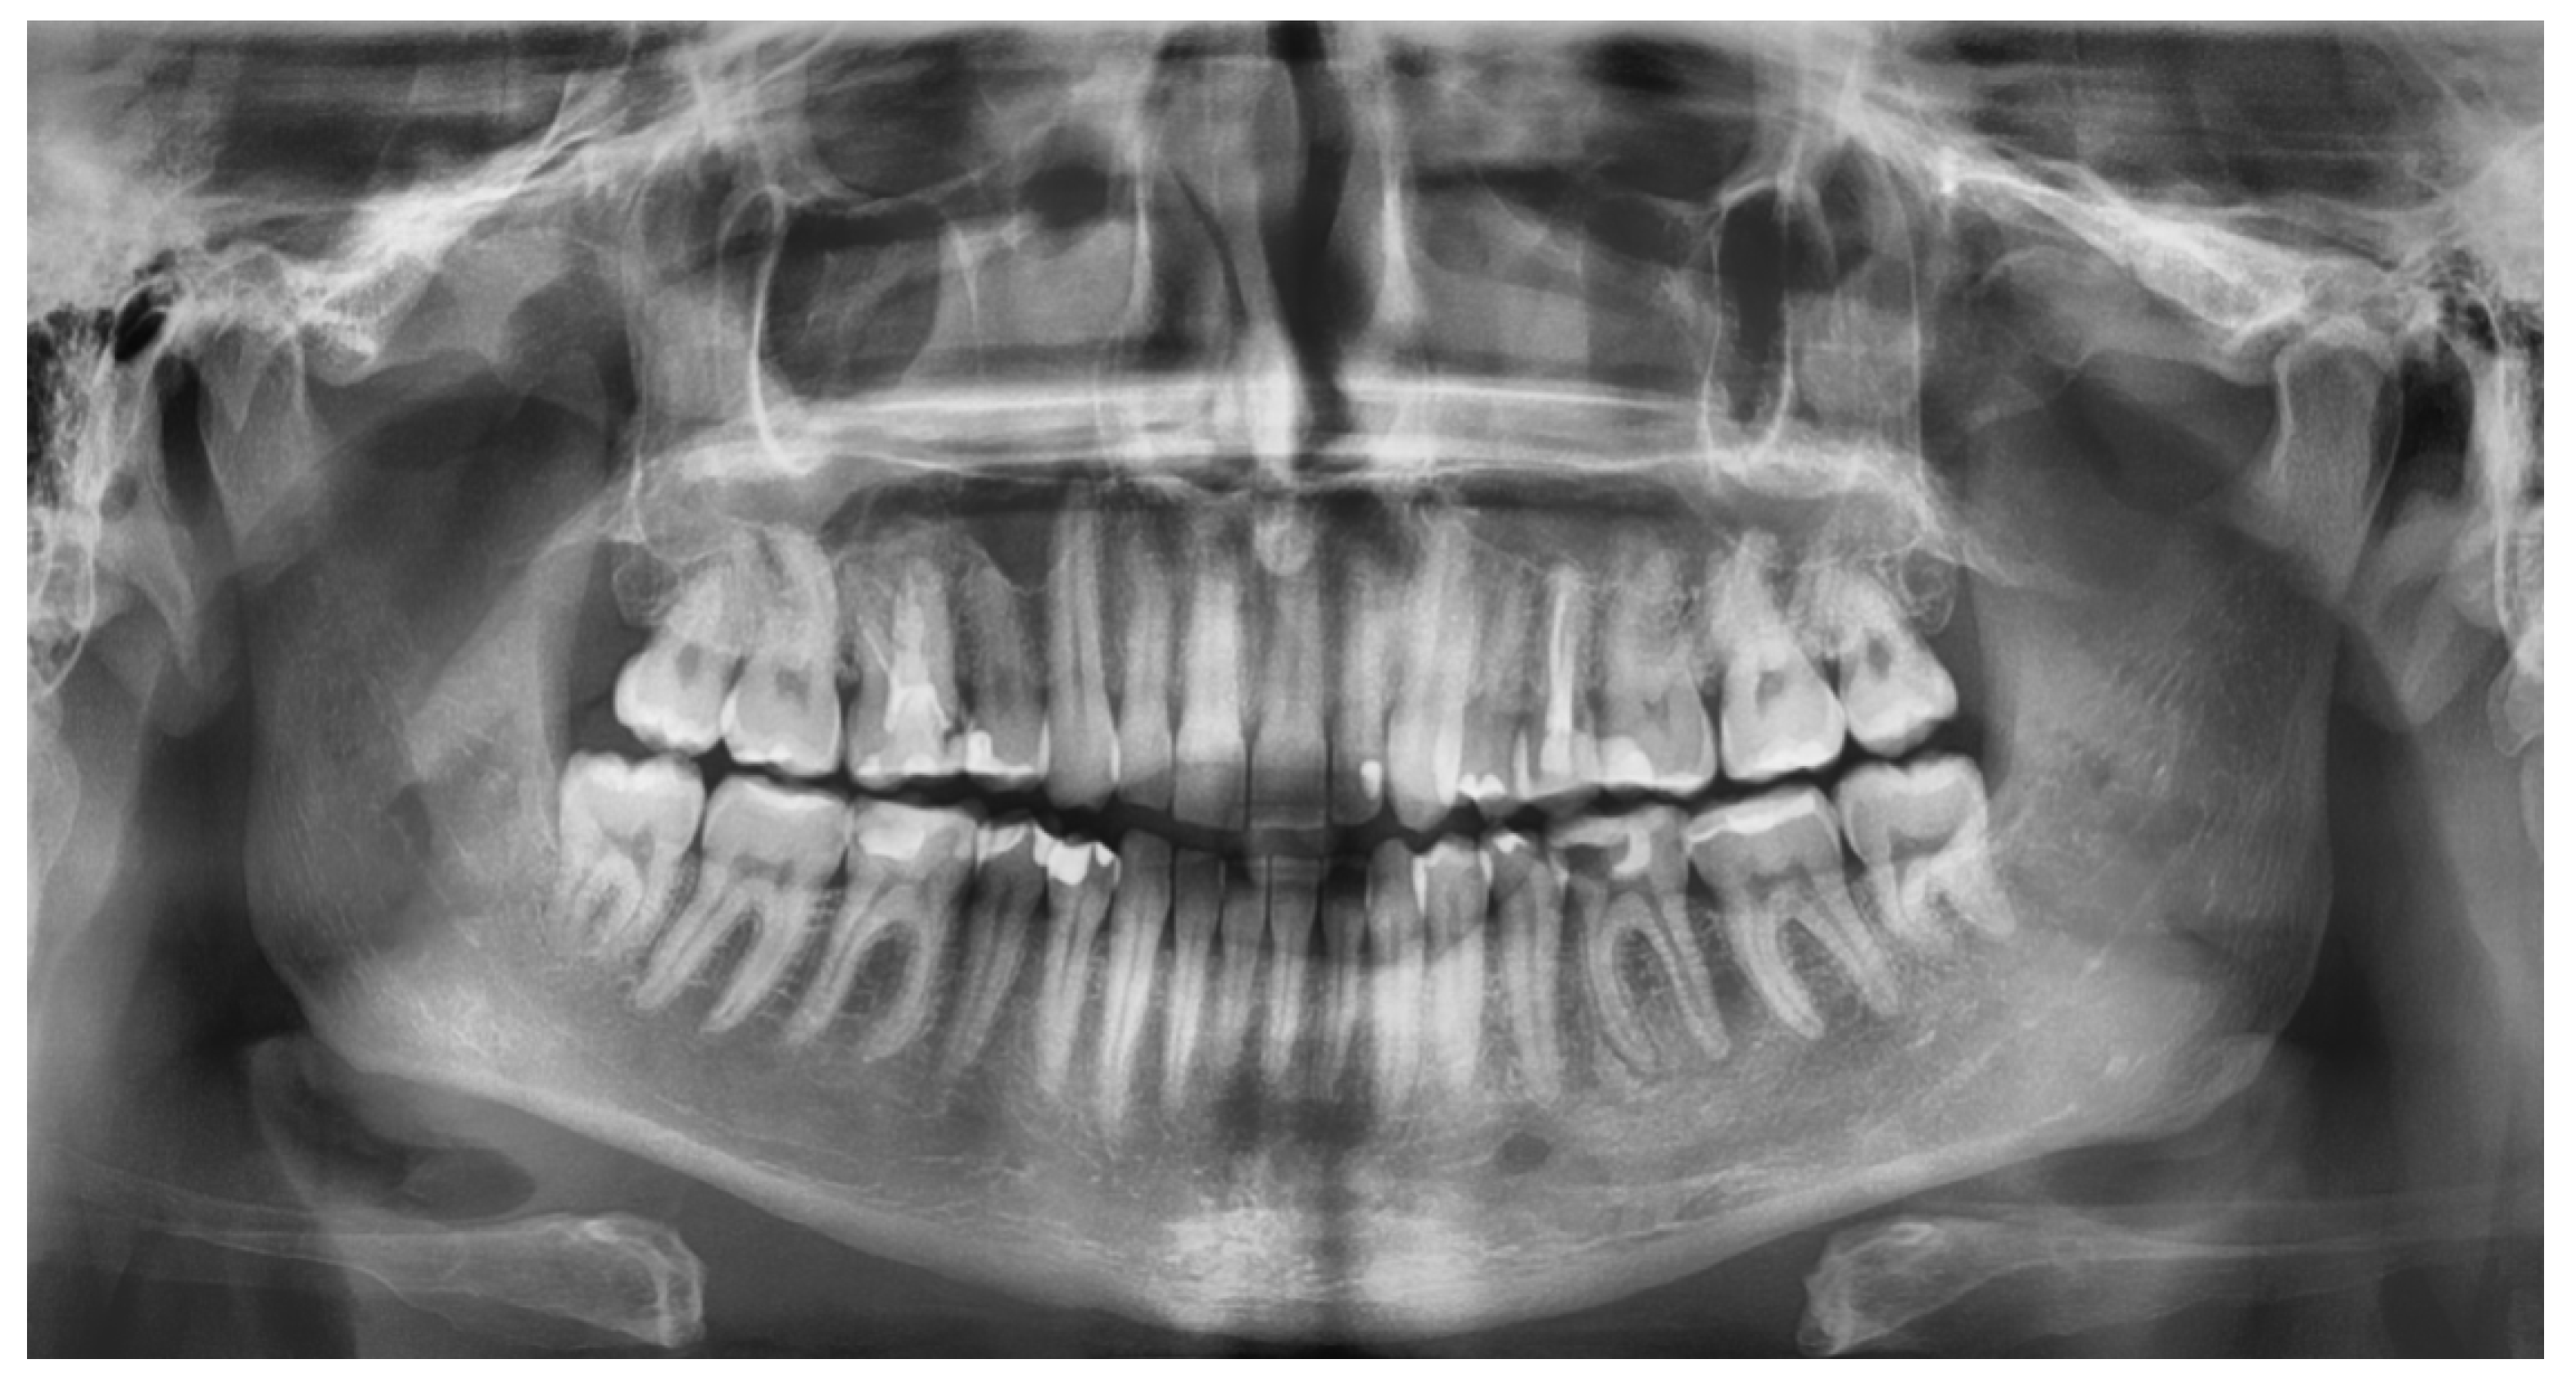
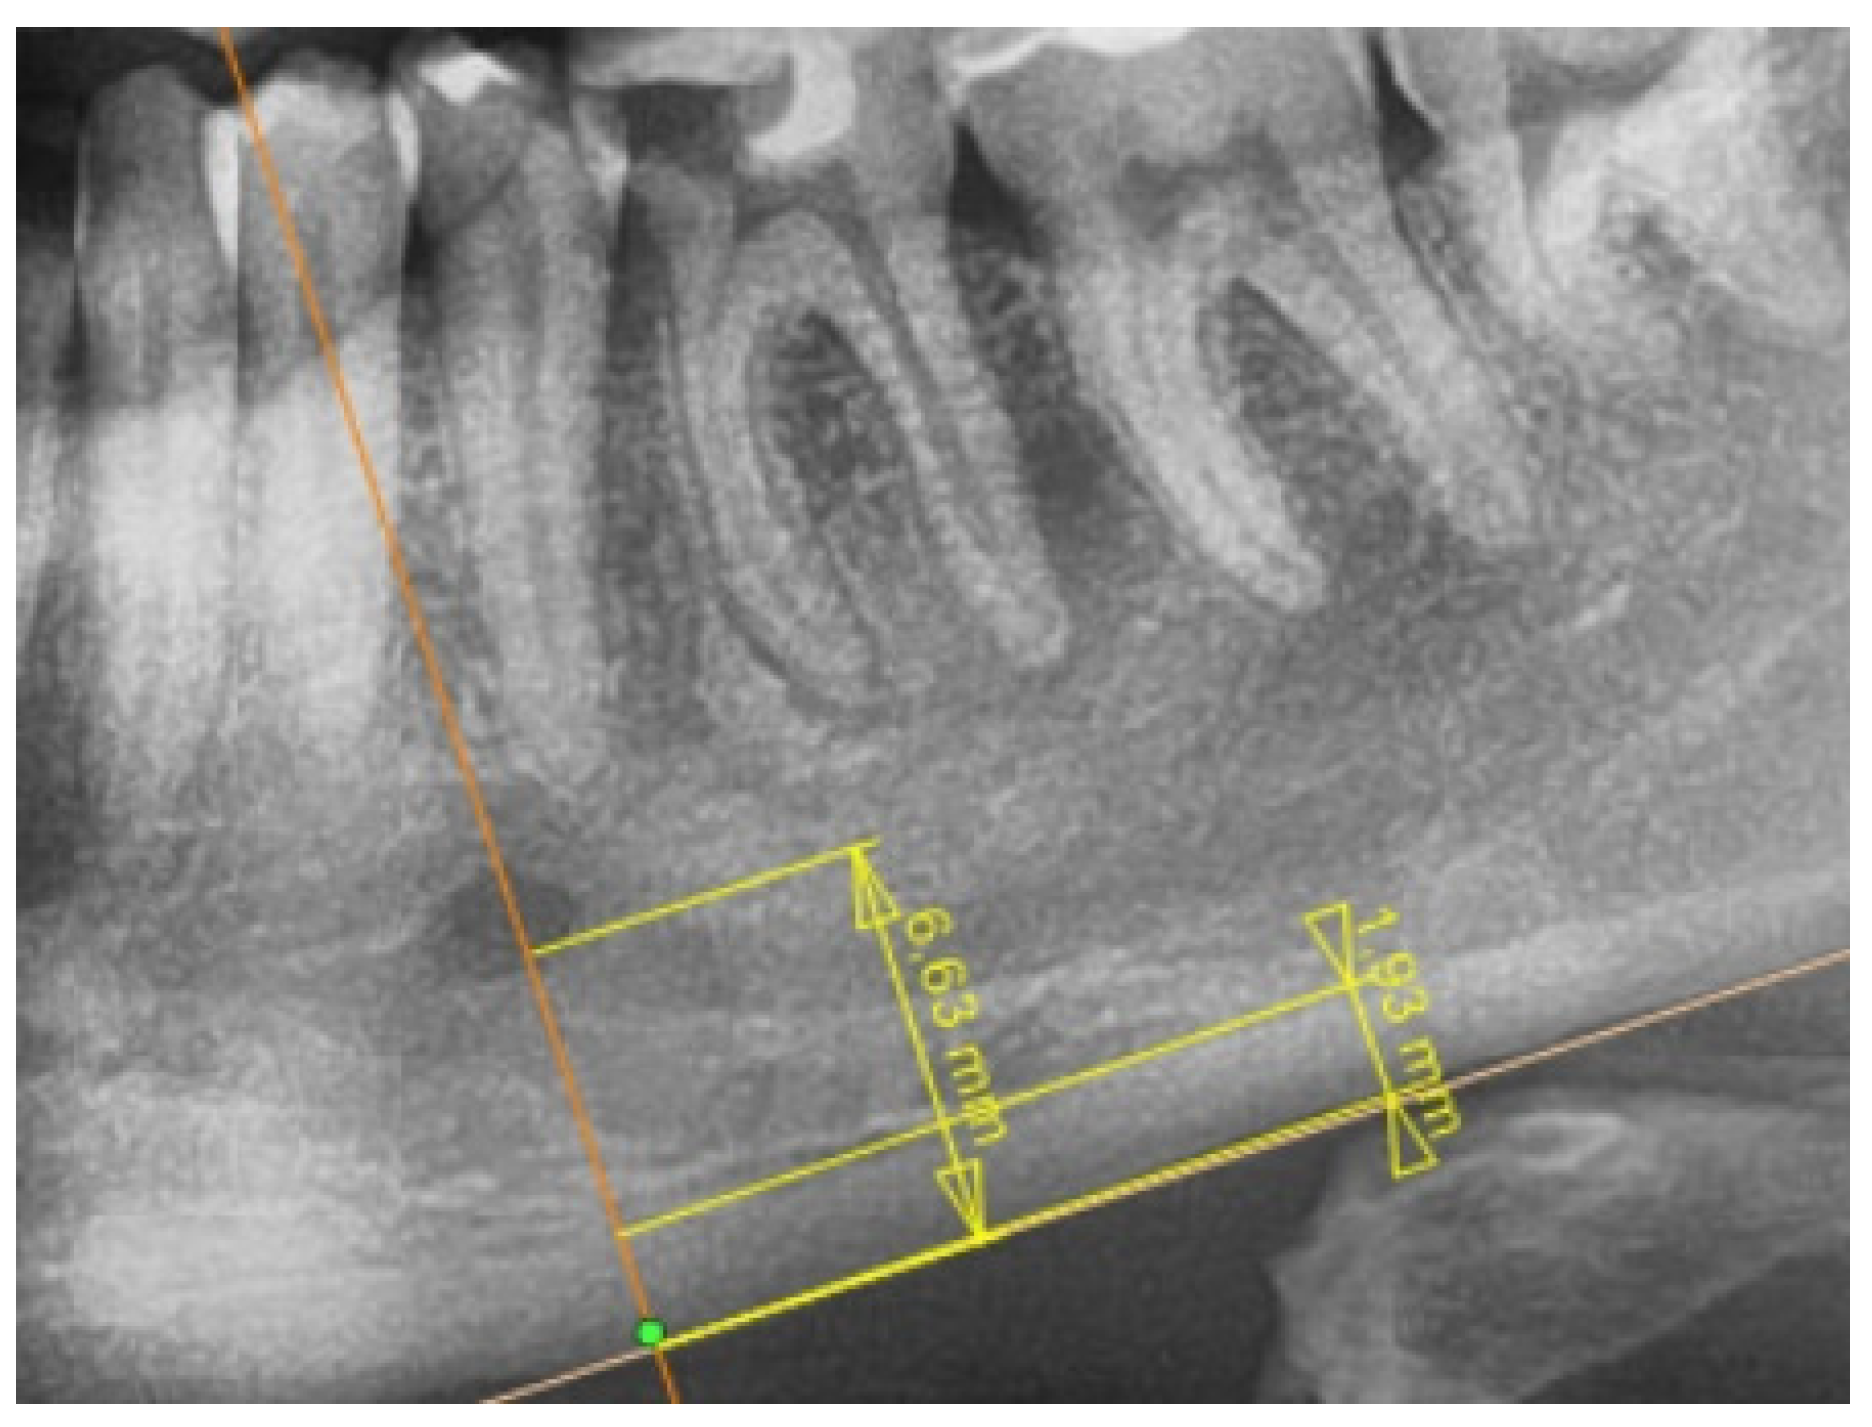
2.2. Radiological Study Protocol
2.3. Biochemical Study Protocol
2.4. Medical Documentation
2.5. Study Assumptions
2.6. Statistical Analysis
3. Results
3.1. Sample Characteristics
3.2. Biochemical and Radiological Analysis
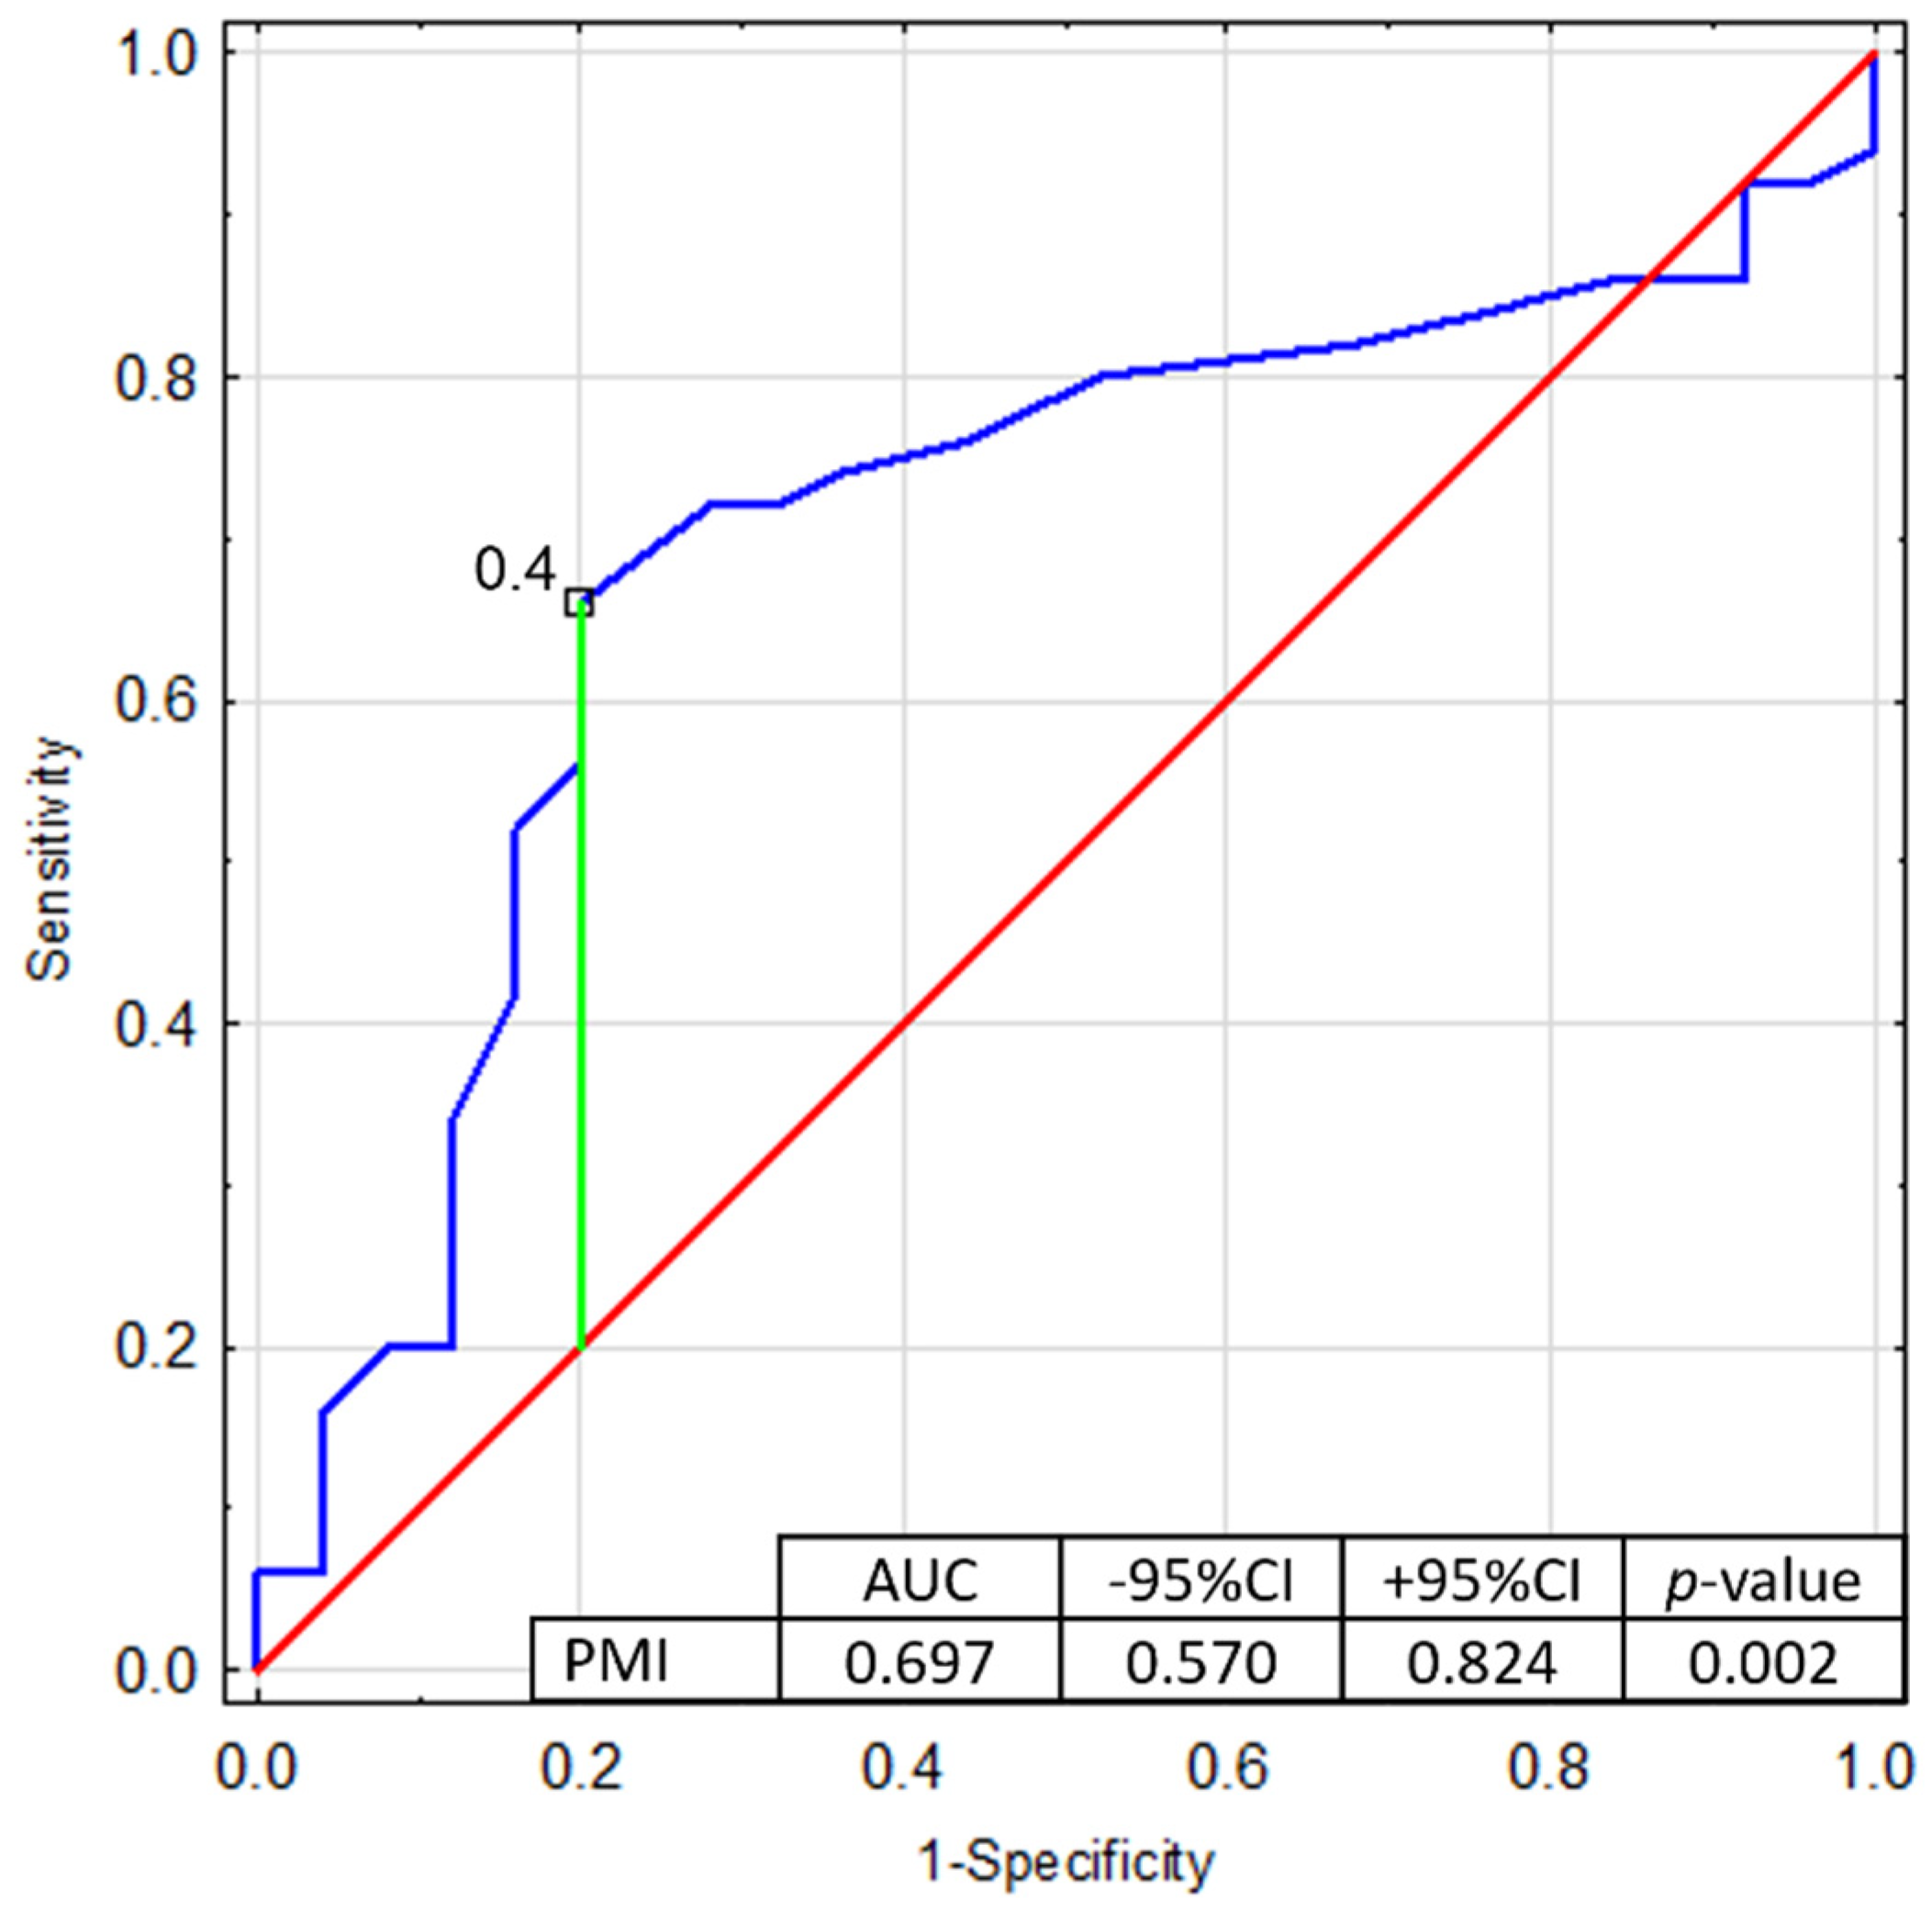
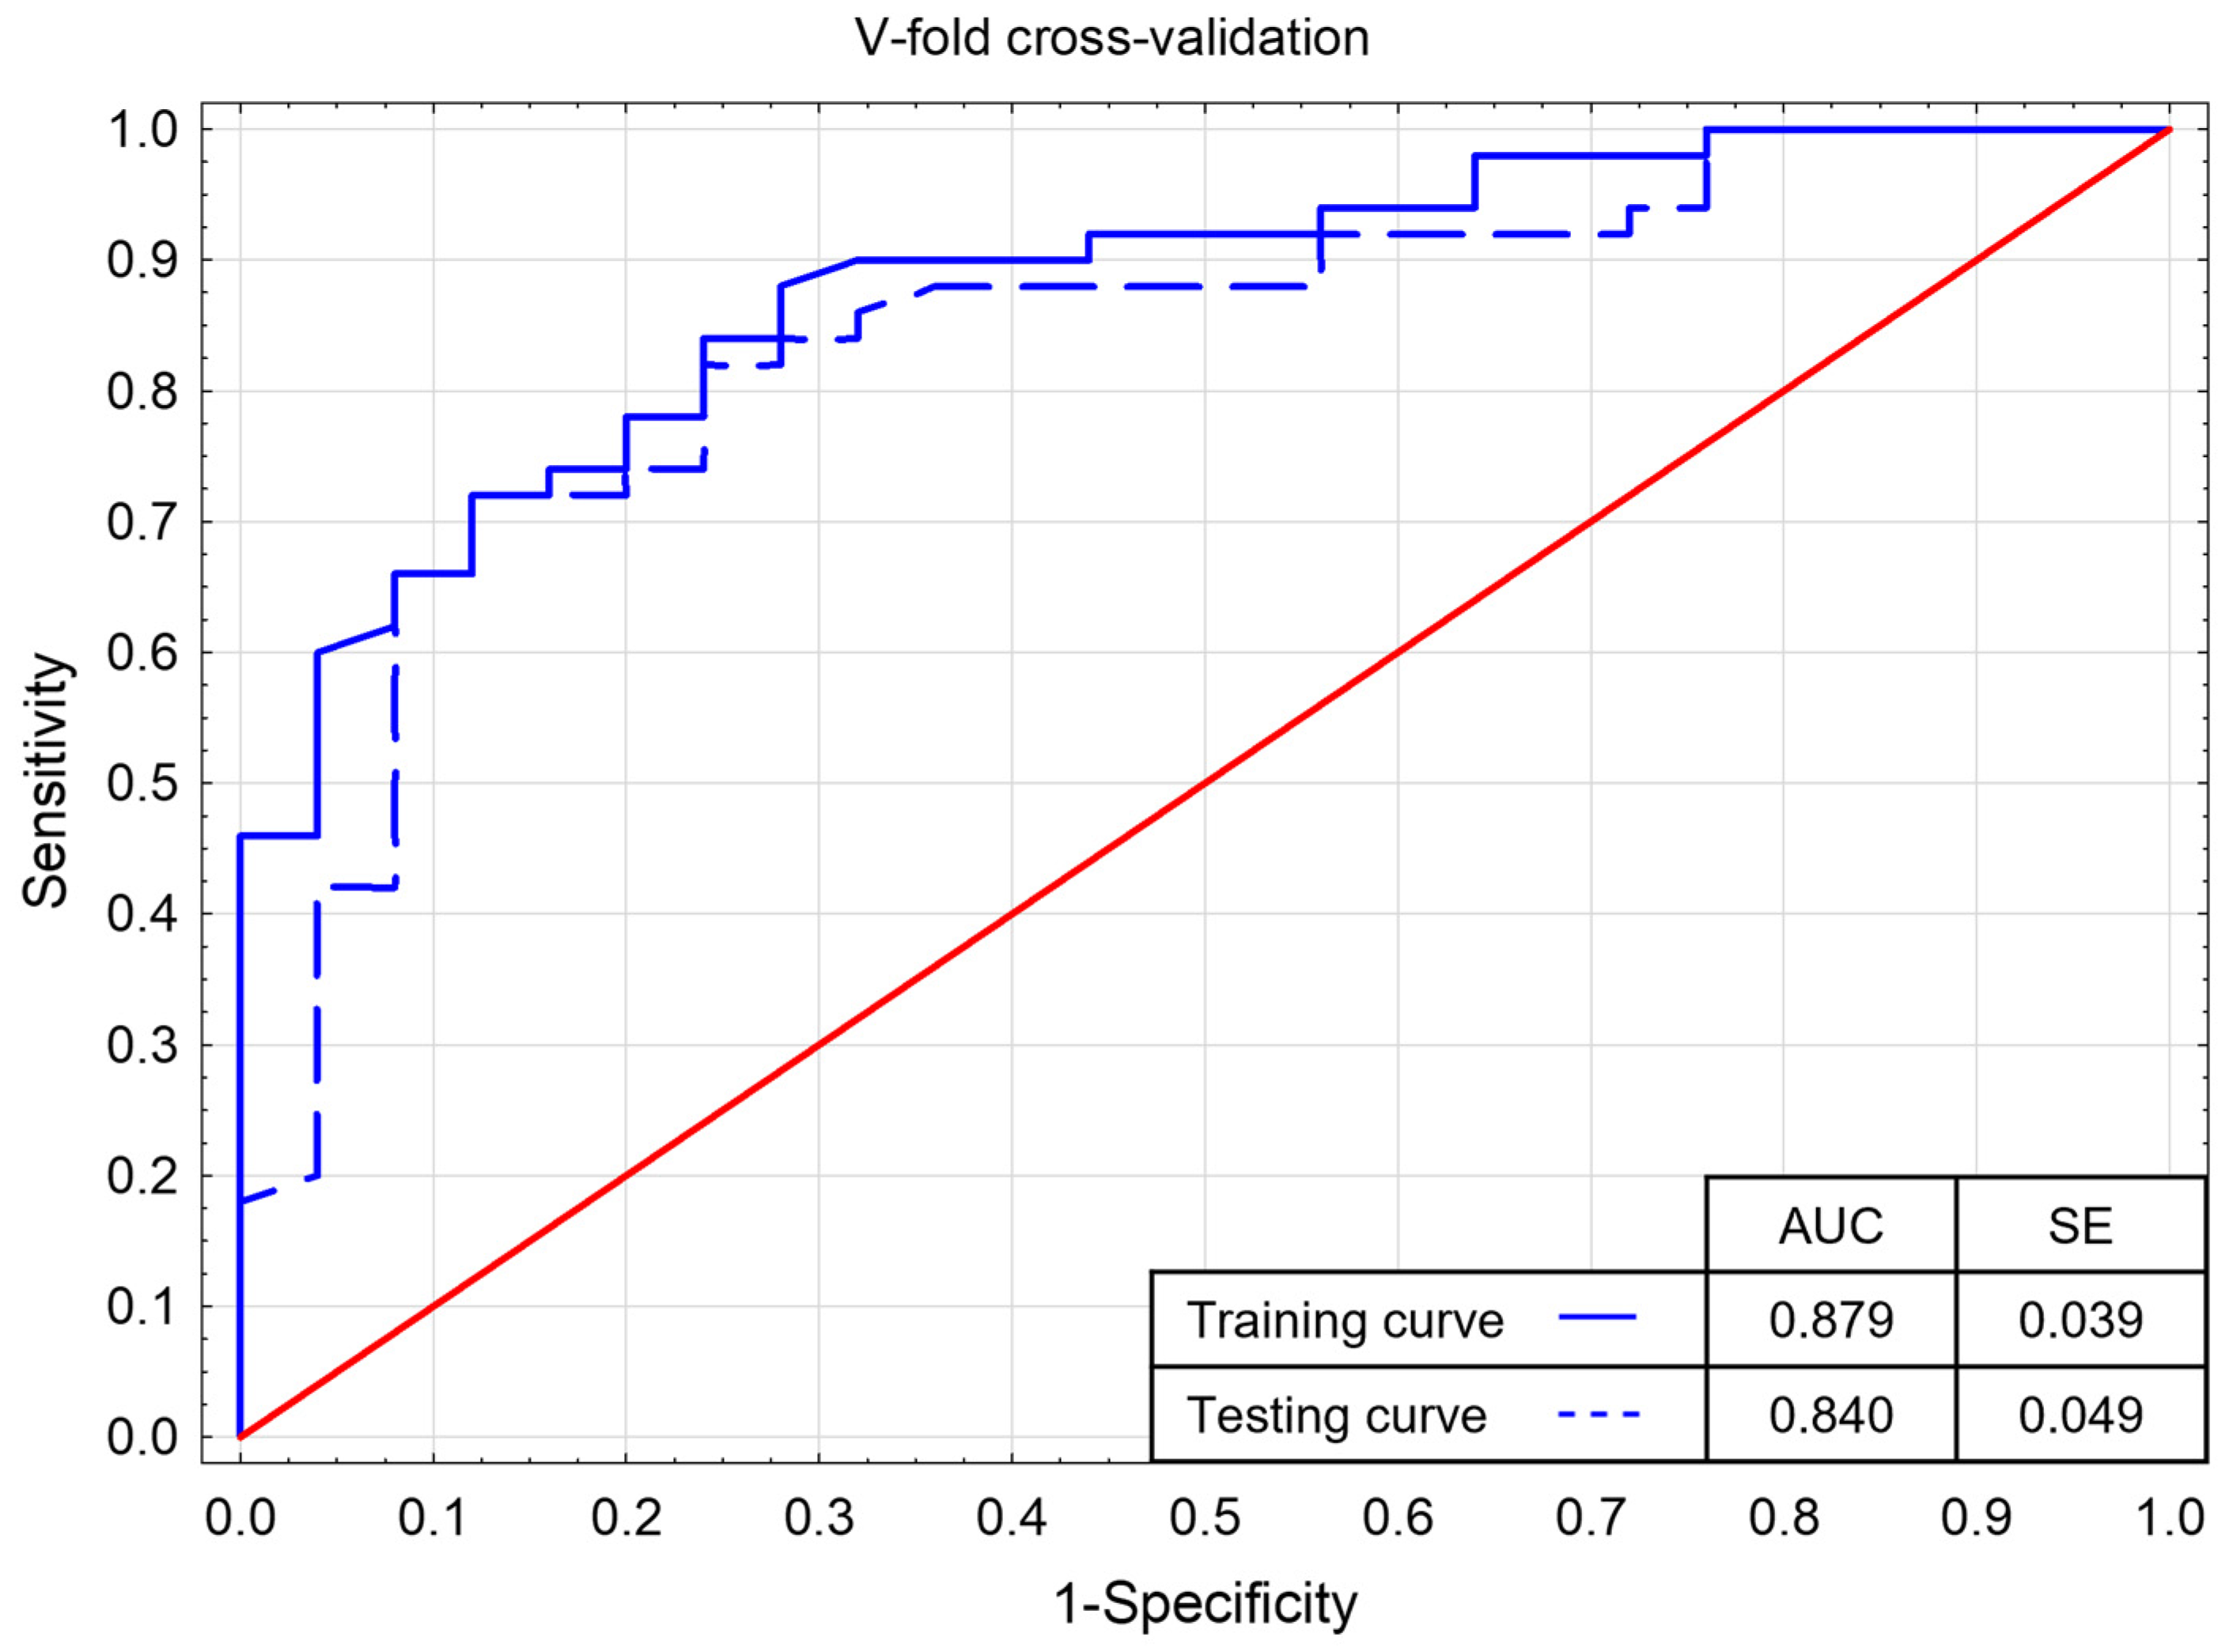
3.3. Multivariate Logistic Regression Analysis
4. Discussion
5. Conclusions
Author Contributions
Funding
Institutional Review Board Statement
Informed Consent Statement
Data Availability Statement
Conflicts of Interest
References
- Miller, C.H.; Bean, C.J. Genetic causes of haemophilia in women and girls. Haemophilia 2021, 27, e164–e179. [Google Scholar] [CrossRef] [PubMed]
- Peyvandi, F.; Garagiola, I.; Young, G. The past and future of haemophilia: Diagnosis, treatments, and its complications. Lancet 2016, 388, 187–197. [Google Scholar] [CrossRef]
- Johnsen, J.M.; Fletcher, S.N.; Huston, H.; Roberge, S.; Martin, B.K.; Kircher, M.; Josephson, N.C.; Shendure, J.; Ruuska, S.; Koerper, M.A.; et al. Novel approach to genetic analysis and results in 3000 hemophilia patients enrolled in the My Life, Our Future initiative. Blood Adv. 2017, 1, 824–834. [Google Scholar] [CrossRef] [PubMed] [Green Version]
- Shen, G.; Gao, M.; Cao, Q.; Li, W. The Molecular Basis of FIX Deficiency in Hemophilia B. Int. J. Mol. Sci. 2022, 23, 2762. [Google Scholar] [CrossRef]
- Wallny, T.A.; Scholz, D.T.; Oldenburg, J.; Nicolay, C.; Ezziddin, S.; Pennekamp, P.H.; Stoffel-Wagner, B.; Kraft, C.N. Osteoporosis in haemophilia—An underestimated comorbidity? Haemophilia 2007, 13, 79–84. [Google Scholar] [CrossRef] [PubMed]
- Mansouritorghabeh, H.; Rezaieyazdi, Z.; Saadati, N.; Saghafi, M.; Mirfeizi, Z.; Rezai, J. Reduced bone density in individuals with severe hemophilia B. Int. J. Rheum. Dis. 2009, 12, 125–129. [Google Scholar] [CrossRef] [PubMed]
- Mansouritorghabeh, H.; Rezaieyazdi, Z.; Badiei, Z. Are individuals with severe haemophilia A prone to reduced bone density? Rheumatol. Int. 2008, 28, 1079–1083. [Google Scholar] [CrossRef]
- Weitzmann, M.N.; Roser-Page, S.; Vikulina, T.; Weiss, D.; Hao, L.; Baldwin, W.H.; Yu, K.; del Mazo Arbona, N.; McGee-Lawrence, M.E.; Meeks, S.L.; et al. Reduced bone formation in males and increased bone resorption in females drive bone loss in hemophilia A mice. Blood Adv. 2019, 3, 288–300. [Google Scholar] [CrossRef]
- Forsyth, A.L.; Quon, D.V.; Konkle, B.A. Role of exercise and physical activity on haemophilic arthropathy, fall prevention and osteoporosis. Haemophilia 2011, 17, e870–e876. [Google Scholar] [CrossRef]
- Gebetsberger, J.; Schirmer, M.; Wurzer, W.J.; Streif, W. Low Bone Mineral Density in Hemophiliacs. Front. Med. 2022, 9, 794456. [Google Scholar] [CrossRef]
- Rodriguez-Merchan, E.C. Serological biomarkers in hemophilic arthropathy: Can they be used to monitor bleeding and ongoing progression of blood-induced joint disease in patients with hemophilia? Blood Rev. 2020, 41, 100642. [Google Scholar] [CrossRef] [PubMed]
- Czajkowska, S.; Rupa-Matysek, J.; Gil, L.; Surdacka, A. Assessment of Oral Health and Healthy Habits in Adult Patients with Congenital Hemophilia. Eur. J. Dent. 2022. [Google Scholar] [CrossRef] [PubMed]
- Dagistan, S.; Bilge, O. Comparison of antegonial index, mental index, panoramic mandibular index and mandibular cortical index values in the panoramic radiographs of normal males and male patients with osteoporosis. Dentomaxillofac. Radiol. 2010, 39, 290–294. [Google Scholar] [CrossRef]
- Balto, K.A.; Gomaa, M.M.; Feteih, R.M.; AlAmoudi, N.M.; Elsamanoudy, A.Z.; Hassanien, M.A.; Ardawi, M.S. Dental Panoramic Radiographic Indices as a Predictor of Osteoporosis in Postmenopausal Saudi Women. J. Bone Metab. 2018, 25, 165–173. [Google Scholar] [CrossRef] [PubMed]
- Hwang, J.J.; Lee, J.-H.; Han, S.-S.; Kim, Y.H.; Jeong, H.-G.; Choi, Y.J.; Park, W. Strut analysis for osteoporosis detection model using dental panoramic radiography. Dentomaxillofac. Radiol. 2017, 46, 20170006. [Google Scholar] [CrossRef] [Green Version]
- Cakur, B.; Sahin, A.; Dagistan, S.; Altun, O.; Caglayan, F.; Miloglu, O.; Harorli, A. Dental panoramic radiography in the diagnosis of osteoporosis. J. Int. Med. Res. 2008, 36, 792–799. [Google Scholar] [CrossRef] [Green Version]
- Pallagatti, S.; Parnami, P.; Sheikh, S.; Gupta, D. Efficacy of Panoramic Radiography in the Detection of Osteoporosis in Post-Menopausal Women When Compared to Dual Energy X-ray Absorptiometry. Open Dent. J. 2017, 11, 350–359. [Google Scholar] [CrossRef] [Green Version]
- Christoforidis, A.; Economou, M.; Farmaki, E.; Tzimouli, V.; Gombakis, N.; Athanassiou-Metaxa, M. Increased osteoclastic activity as shown by increased sRANK-L/OPG ratio in boys with hemophilia. Ann. Hematol. 2010, 89, 837–838. [Google Scholar] [CrossRef] [Green Version]
- Christoforidis, A.; Economou, M.; Papadopoulou, E.; Kazantzidou, E.; Farmaki, E.; Tzimouli, V.; Tsatra, I.; Gompakis, N.; Athanassiou-Metaxa, M. Comparative study of dual energy X-ray absorptiometry and quantitative ultrasonography with the use of biochemical markers of bone turnover in boys with haemophilia. Haemophilia 2011, 17, e217–e222. [Google Scholar] [CrossRef]
- Kaminski, T.W.; Brzoska, T.; Tutuncuoglu, E.; Ragni, M.V.; Sundd, P. Neutrophil Extracellular Traps Promote Joint Injury in Hemophilia. Blood 2020, 136, 43. [Google Scholar] [CrossRef]
- Benson, B.W.; Prihoda, T.J.; Glass, B.J. Variations in adult cortical bone mass as measured by a panoramic mandibular index. Oral Surg. Oral Med. Oral Pathol. 1991, 71, 349–356. [Google Scholar] [CrossRef]
- Shapiro, S.; Makris, M. Haemophilia and ageing. Br. J. Haematol. 2019, 184, 712–720. [Google Scholar] [CrossRef] [PubMed]
- Gerstner, G.; Damiano, M.L.; Tom, A.; Worman, C.; Schultz, W.; Recht, M.; Stopeeck, A.T. Prevalence and risk factors associated with decreased bone mineral density in patients with haemophilia. Haemophilia 2009, 15, 559–565. [Google Scholar] [CrossRef] [PubMed]
- Iorio, A.; Fabbriciani, G.; Marcucci, M.; Brozzetti, M.; Filipponi, P. Bone mineral density in haemophilia patients. Thromb. Haemost. 2010, 103, 596–603. [Google Scholar] [CrossRef]
- KiperUnal, H.D.; ComertOzkan, M.; Atilla, F.D.; Demirci, Z.; Soyer, N.; Yildirim Simsir, I.; Omur, O.; Capaci, K.; Saydam, G.; Sahin, F. Evaluation of bone mineral density and related parameters in patients with haemophilia: A single center cross-sectional study. Am. J. Blood Res. 2017, 7, 59–66. [Google Scholar]
- Ekinci, O.; Demircioglu, S.; Dogan, A.; Merter, M.; Yildiz, S.; Demir, C. Decreased bone mineral density and associated factors in severe haemophilia A patients: A case-control study. Haemophilia 2019, 25, e315–e321. [Google Scholar] [CrossRef]
- Sahin, S.; Sadri, S.; Baslar, Z.; Ar, M.C. Osteoporosis in Patients with Hemophilia: Single-Center Results from a Middle-Income Country. Clin. Appl. Thromb. Hemost. 2019, 25, 1076029619861689. [Google Scholar] [CrossRef]
- Kempton, C.L.; Antun, A.; Antoniucci, D.M.; Carpenter, W.; Ribeiro, M.; Stein, S.; Slovenskly, L.; Elon, L. Bone Density in Haemophilia: A Single Institutional Cross-sectional Study. Haemophilia 2014, 20, 121–128. [Google Scholar] [CrossRef] [Green Version]
- Rodriguez-Merchan, E.C.; Valentino, L.A. Increased bone resorption in hemophilia. Blood Rev. 2019, 33, 6–10. [Google Scholar] [CrossRef]
- Groen, J.J.; Duyvensz, F.; Halsted, J.A. Diffuse alveolar atrophy of the jaw (non-inflammatory form of paradental disease) and pre-senile osteoporosis. Gerontol. Clin. 1960, 2, 68–86. [Google Scholar] [CrossRef]
- Hildebolt, C.F. Osteoporosis and oral bone loss. Dentomaxillofac. Radiol. 1997, 26, 3–15. [Google Scholar] [CrossRef] [PubMed]
- Wical, K.E.; Swoope, C.C. Studies of residual ridge resorption. Part II. The relationship of dietary calcium and phosphorus to residual ridge resorption. J. Prosthet. Dent. 1974, 32, 13–22. [Google Scholar] [CrossRef]
- Khaitan, T.; Shukla, A.K.; Gupta, P.; Naik, S.R. Is panoramic mandibular index a reliable marker in the evaluation of bone mineral density and sexual dimorphism? J. Forensic Dent. Sci. 2019, 11, 133–136. [Google Scholar] [CrossRef] [PubMed]
- Tounta, T.S. Diagnosis of osteoporosis in dental patients. J. Frailty Sarcopenia Falls 2017, 2, 21–27. [Google Scholar] [CrossRef] [Green Version]
- Stagraczyński, M.; Kulczyk, T.; Podfigurna, A.; Męczekalski, B. Ocenastanukościżuchwyigęstościmineralnejkości w odcinkulędźwiowymkręgosłupa u kobiet pomenopauzie. Pol. Merk. Lek. 2016, 41, 79–83. [Google Scholar]
- Maćkowiak, P.; Kaczmarek, E.; Kulczyk, T. Cortical width measurement based on panoramic radiographs using computer-aided system. In Bio-Informatic Systems, Processing and Applications; Abginya, J., Custovic, E., Whittingen, J., Eds.; River Publishers: Aalborg, Denmark, 2013; Volume 2.1, pp. 169–190. [Google Scholar]
- Devlin, H.; Karayianni, K.; Mitsea, A.; Jacobs, R.; Lindh, C.; van derStelt, P.; Marjanovic, E.; Adams, J.; Pavitt, S.; Horner, K. Diagnosing osteoporosis by using dental panoramic radiographs: The OSTEODENT project. Oral Surg. Oral Med. Oral Pathol. Oral Radiol. Endodontol. 2007, 104, 821–828. [Google Scholar] [CrossRef]
- Devlin, H.; Allen, P.; Graham, J.; Jacobs, R.; Nicopoulou-Karayianni, K.; Lindh, C.; Marjanovic, E.; Adams, J.; Pavitt, S.; van der Stelt, P.; et al. The role of the dental surgeon in detecting osteoporosis: The OSTEODENT study. Br. Dent. J. 2008, 204, E16; discussion 560–561. [Google Scholar] [CrossRef] [Green Version]
- Nicopoulou-Karayianni, K.; Tzoutzoukos, P.; Mitsea, A.; Karayiannis, A.; Tsiklakis, K.; Jacobs, R.; Lindh, C.; van der Stelt, P.; Allen, P.; Graham, J.; et al. Tooth loss and osteoporosis: The OSTEODENT Study. J. Clin. Periodontol. 2009, 36, 190–197. [Google Scholar] [CrossRef]
- Karayianni, K.; Horner, K.; Mitsea, A.; Berkas, L.; Mastoris, M.; Jacobs, R.; Linfh, C.; van der Stelt, P.; Harrison, E.; Adams, J.E.; et al. Accuracy in osteoporosis diagnosis of a combination of mandibular cortical width measurement on dental panoramic radiographs and a clinical risk index (OSIRIS): The OSTEODENT project. Bone 2007, 40, 223–229. [Google Scholar] [CrossRef]
- Horner, K.; Karayianni, K.; Mitsea, A.; Berkas, L.; Mastoris, M.; Jacobs, R.; Lindh, C.; van der Stelt, P.; Marjanovic, E.; Adams, J.; et al. The mandibular cortex on radiographs as a tool for osteoporosis risk assessment: The OSTEODENT Project. J. Clin. Densitom. 2007, 10, 138–146. [Google Scholar] [CrossRef]
- Horner, K.; Allen, P.; Graham, J.; Jacobs, R.; Boonen, S.; Pavitt, S.; Nackaerts, O.; Marjanovic, E.; Adams, J.; Karayianni, K.; et al. The relationship between the OSTEODENT index and hip fracture risk assessment using FRAX. Oral Surg. Oral Med. Oral Pathol. Oral Radiol. Endodontol. 2010, 110, 243–249. [Google Scholar] [CrossRef] [PubMed]
- Khojastehpour, L.; Shahidi, S.; Barghan, S.; Aflaki, E. Efficacy of Panoramic Mandibular Index in Diagnosing Osteoporosis in Women. J. Dent. Tehran Univ. Med. Sci. 2009, 6, 11–15. [Google Scholar]


| n (%) | Age (Range) | ||
|---|---|---|---|
| Control Group | 25 | 28 (21–63) | |
| Study Group | 50 | 36.5 (19–65) | |
| Type of hemophilia | A | 40 (80%) | 36.0 (19–65) |
| B | 10 (20%) | 41.5 (26–56) | |
| Routine management | On demand | 22 (44% | 33.5 (20–65) |
| Secondary prophylactic | 28 (56%) | 38.5 (19–62) | |
| Severity of hemophilia | Severe | 35 (70%) | 40.0 (19–62) |
| Moderate | 7 (14%) | 32.0 (26–56) | |
| Mild | 8 (16%) | 24.5 (20–65) | |
| Study Group n = 50 | Control Group n = 25 | p-Value | |||
|---|---|---|---|---|---|
| M [Q1–Q3] | Min–Max | M [Q1–Q3] | Min–Max | ||
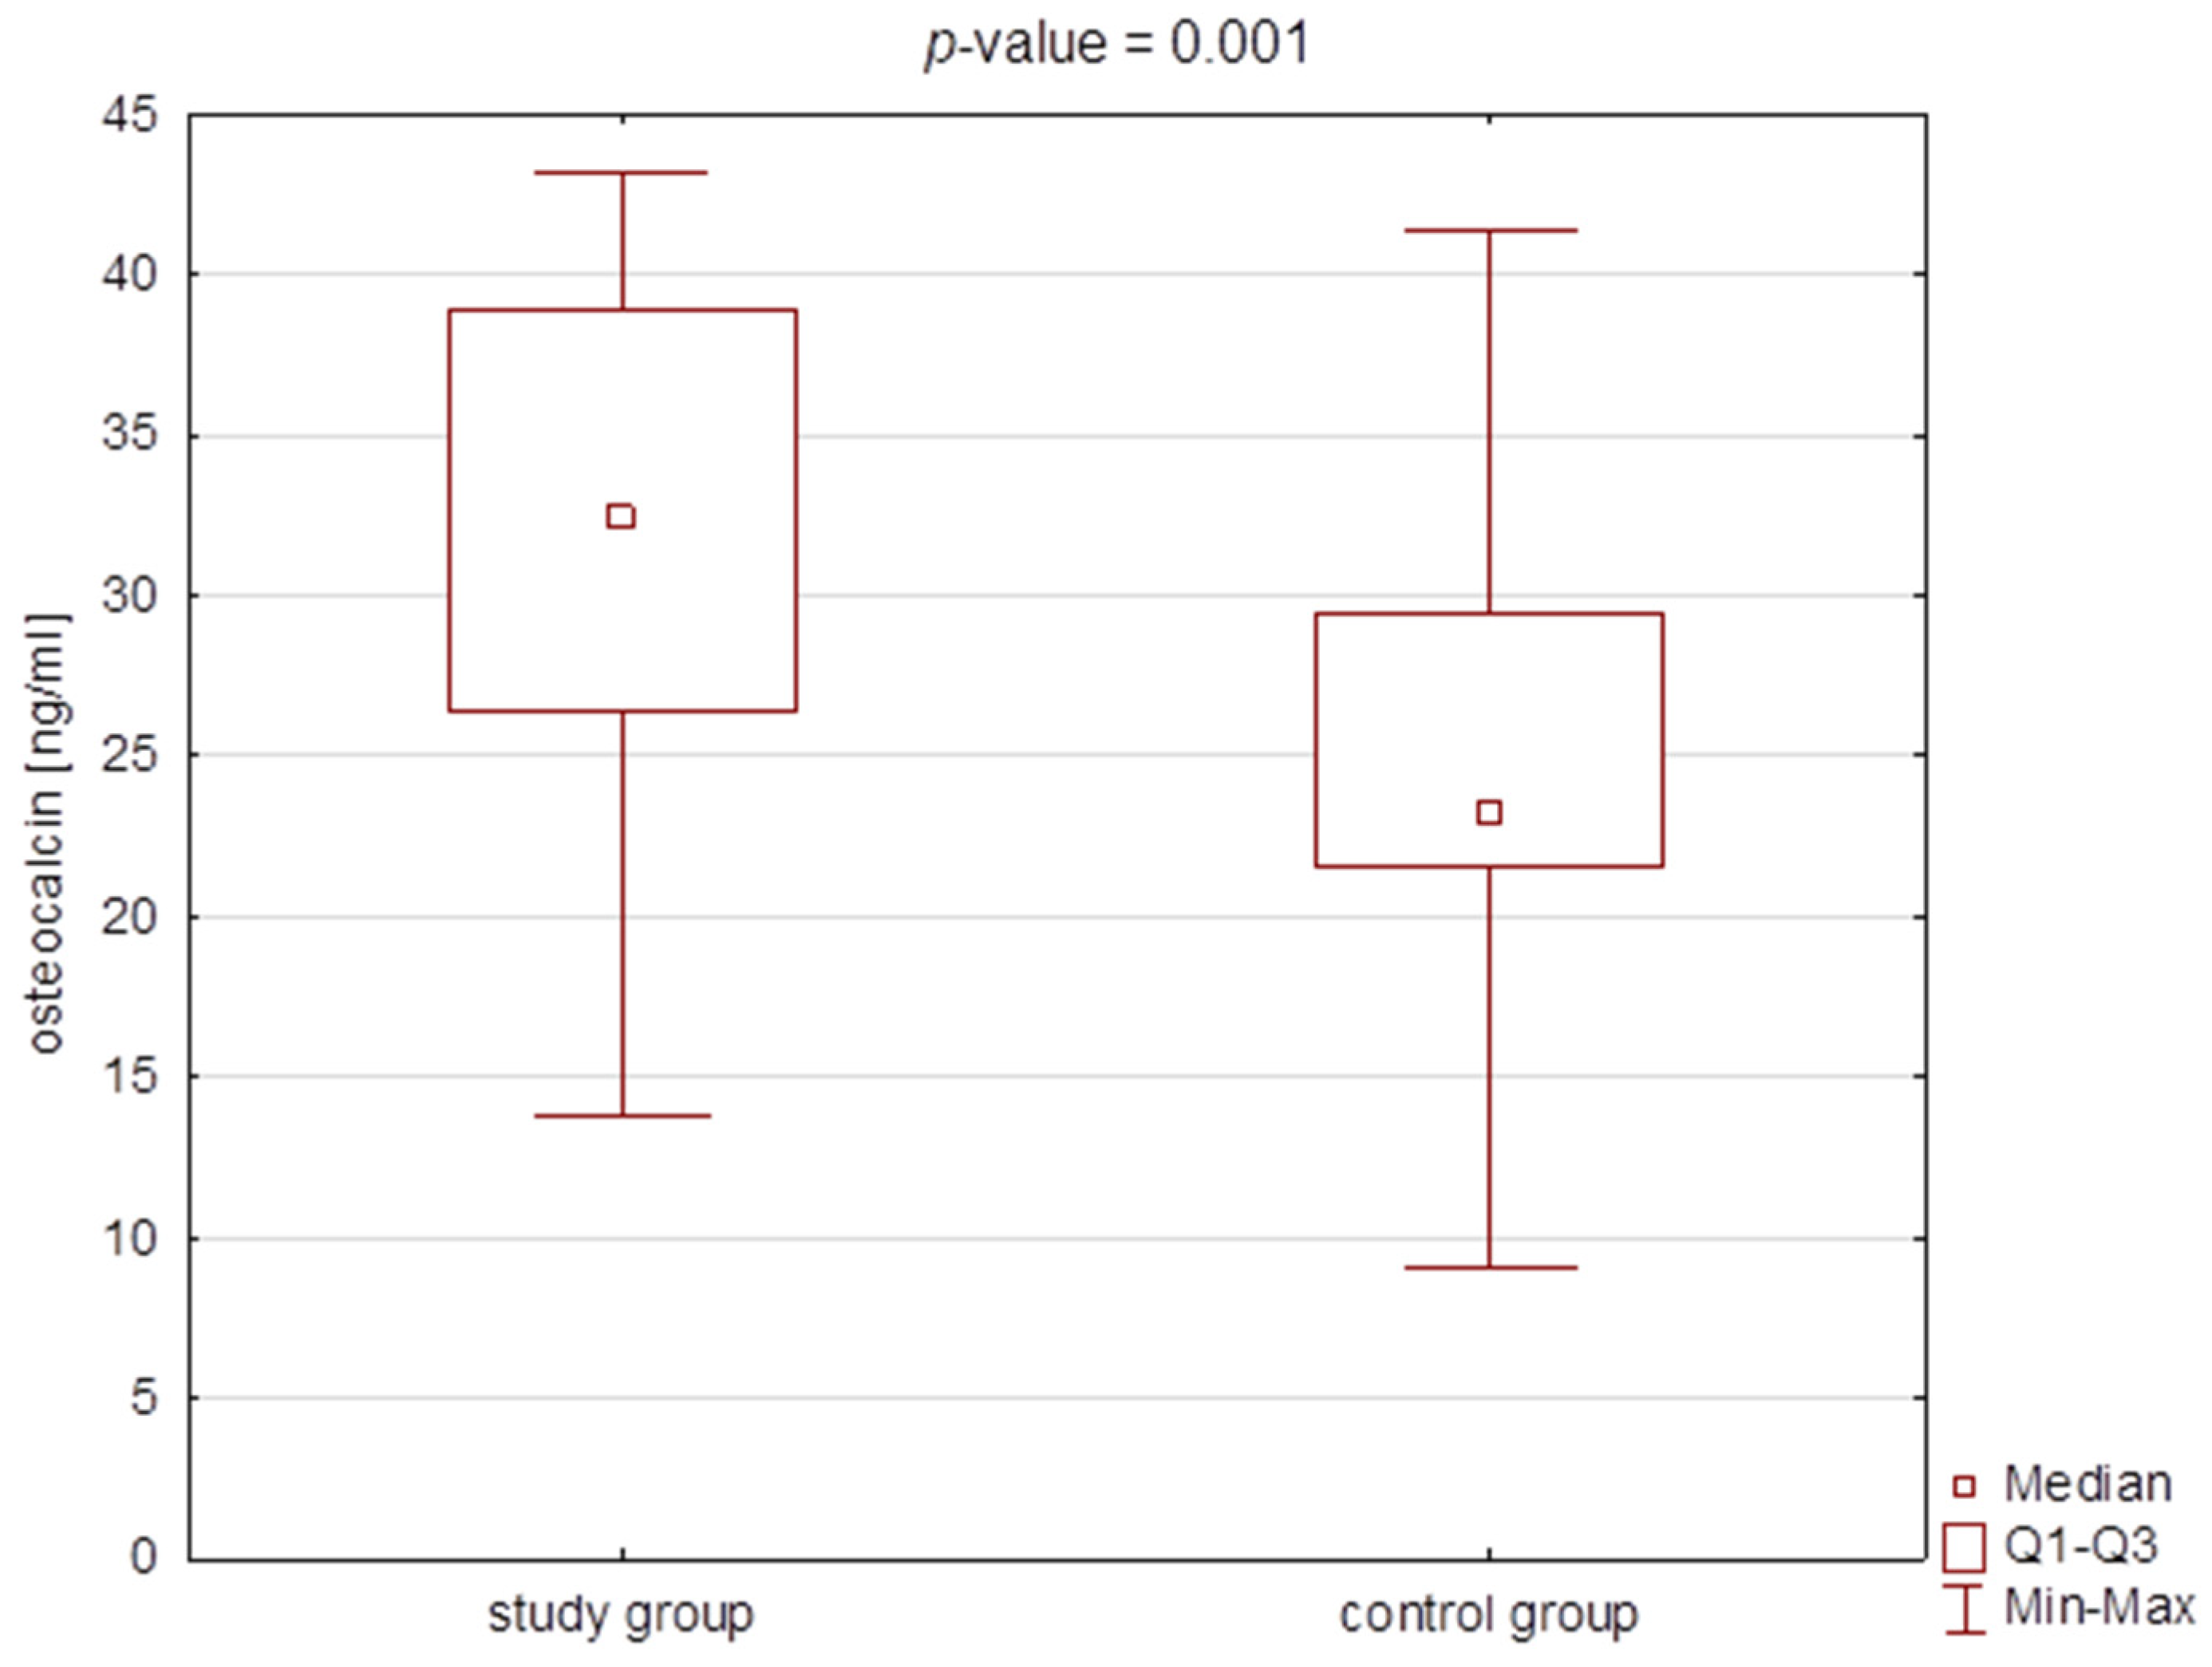
| BGLAP [ng/mL] | 32.46 [26.41–38.85] | 9.03–41.33 | 23.25 [21.54–29.44] | 13.83–43.21 | 0.001 * |
| CH3 [pg/mL] | 987.3 [909.2–1101.3] | 468.0–1064.8 | 863.6 [803.2–917.8] | 687.5–1203.9 | <0.001 * |
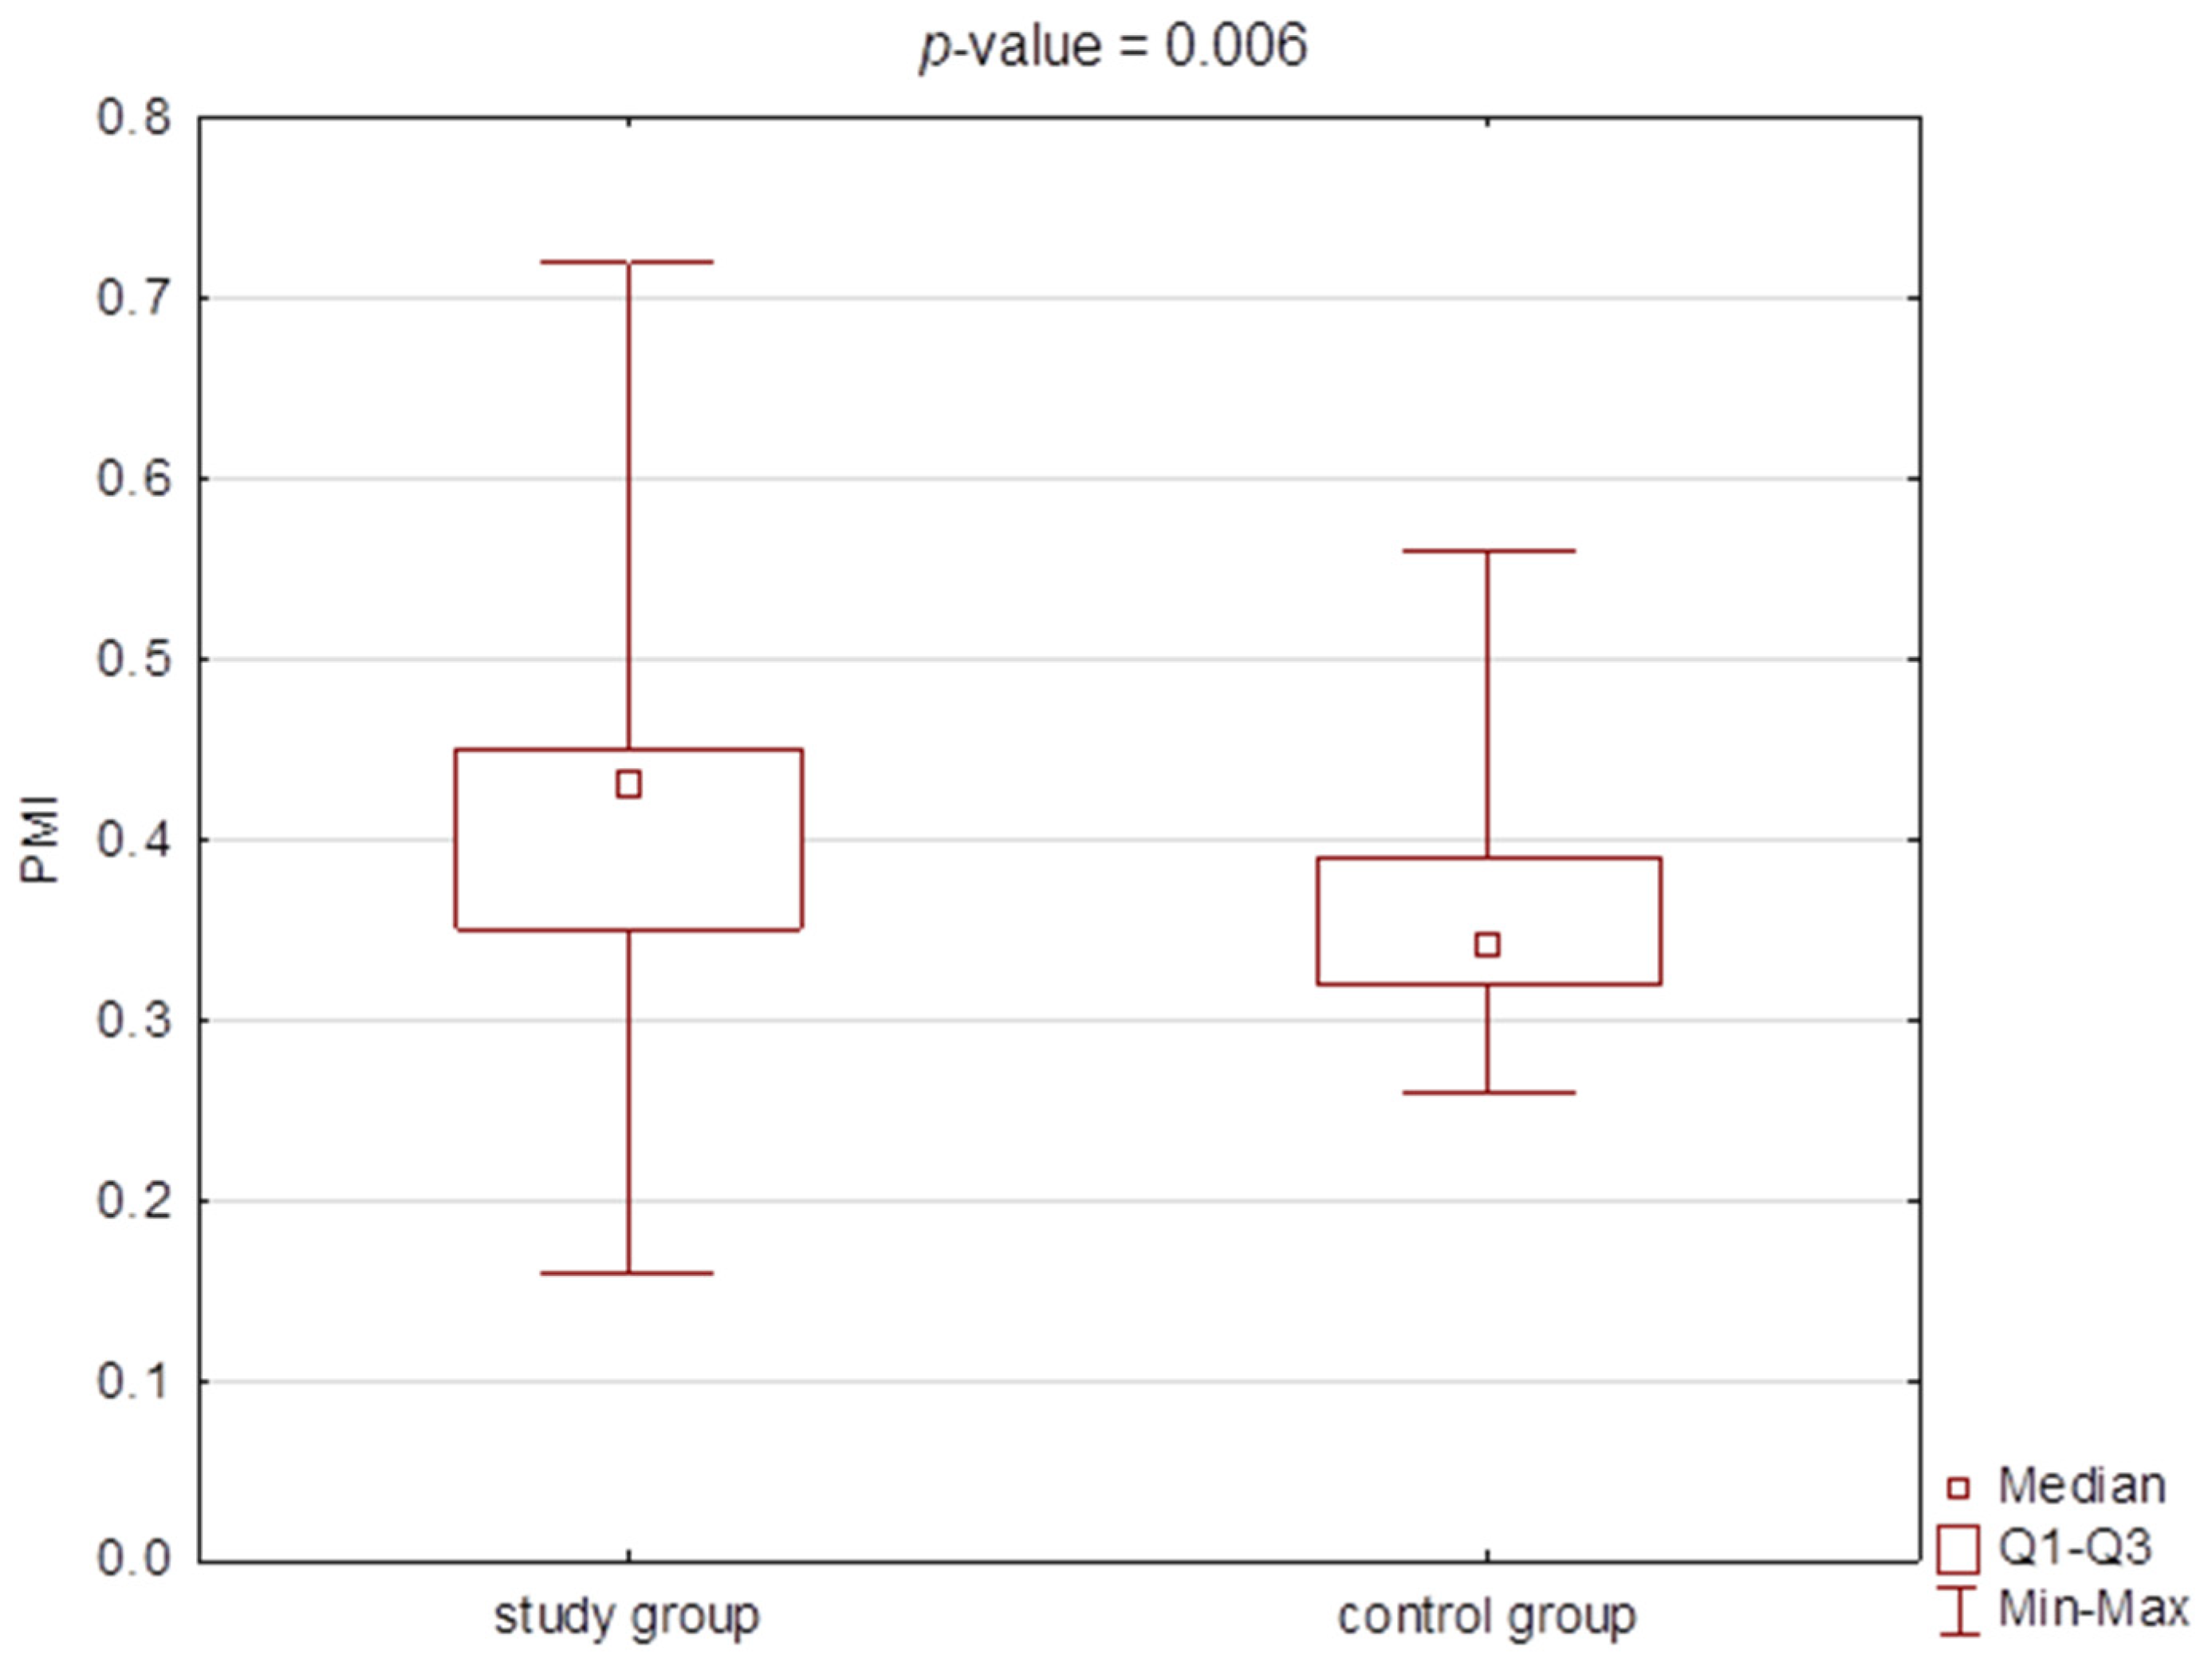
| PMI | 0.43 [0.35–0.45] | 0.16–0.72 | 0.34 [0.32–0.39] | 0.26–0.56 | 0.006 * |
| MI | 2.48 [2.28–2.69] | 1.32–3.68 | 2.37 [2.03–2.59] | 1.77–2.93 | 0.167 |
| Β | SE | Wald Stat. | p-Value | Odds Ratio | Confidence OR −95% | Confidence OR 95% | |
|---|---|---|---|---|---|---|---|
| Intercept | −16.947 | 4.365 | 15.077 | <0.001 * | |||
| CH3 [pg/mL] | 0.012 | 0.004 | 10.602 | 0.001 * | 1.012 | 1.005 | 1.020 |
| BGLAP [ng/mL] | 0.130 | 0.045 | 8.469 | 0.004 * | 1.139 | 1.043 | 1.243 |
| PMI | 6.988 | 3.471 | 4.054 | 0.044 * | 1083.675 | 1.204 | 975,220.994 |
Publisher’s Note: MDPI stays neutral with regard to jurisdictional claims in published maps and institutional affiliations. |
© 2022 by the authors. Licensee MDPI, Basel, Switzerland. This article is an open access article distributed under the terms and conditions of the Creative Commons Attribution (CC BY) license (https://creativecommons.org/licenses/by/4.0/).
Share and Cite
Czajkowska, S.; Rupa-Matysek, J.; Wojtasińska, E.; Nijakowski, K.; Gil, L.; Surdacka, A.; Kulczyk, T. Potential Biochemical Markers and Radiomorphometric Indices as Predictors of Reduced Bone Mass in Patients with Congenital Hemophilia. J. Clin. Med. 2022, 11, 3391. https://doi.org/10.3390/jcm11123391
Czajkowska S, Rupa-Matysek J, Wojtasińska E, Nijakowski K, Gil L, Surdacka A, Kulczyk T. Potential Biochemical Markers and Radiomorphometric Indices as Predictors of Reduced Bone Mass in Patients with Congenital Hemophilia. Journal of Clinical Medicine. 2022; 11(12):3391. https://doi.org/10.3390/jcm11123391
Chicago/Turabian StyleCzajkowska, Sylwia, Joanna Rupa-Matysek, Ewelina Wojtasińska, Kacper Nijakowski, Lidia Gil, Anna Surdacka, and Tomasz Kulczyk. 2022. "Potential Biochemical Markers and Radiomorphometric Indices as Predictors of Reduced Bone Mass in Patients with Congenital Hemophilia" Journal of Clinical Medicine 11, no. 12: 3391. https://doi.org/10.3390/jcm11123391