
Step Detection Accuracy and Energy Expenditure Estimation at Different Speeds by Three Accelerometers in a Controlled Environment in Overweight/Obese Subjects

 ,
,
Abstract
:1. Introduction
2. Materials and Methods
3. Results
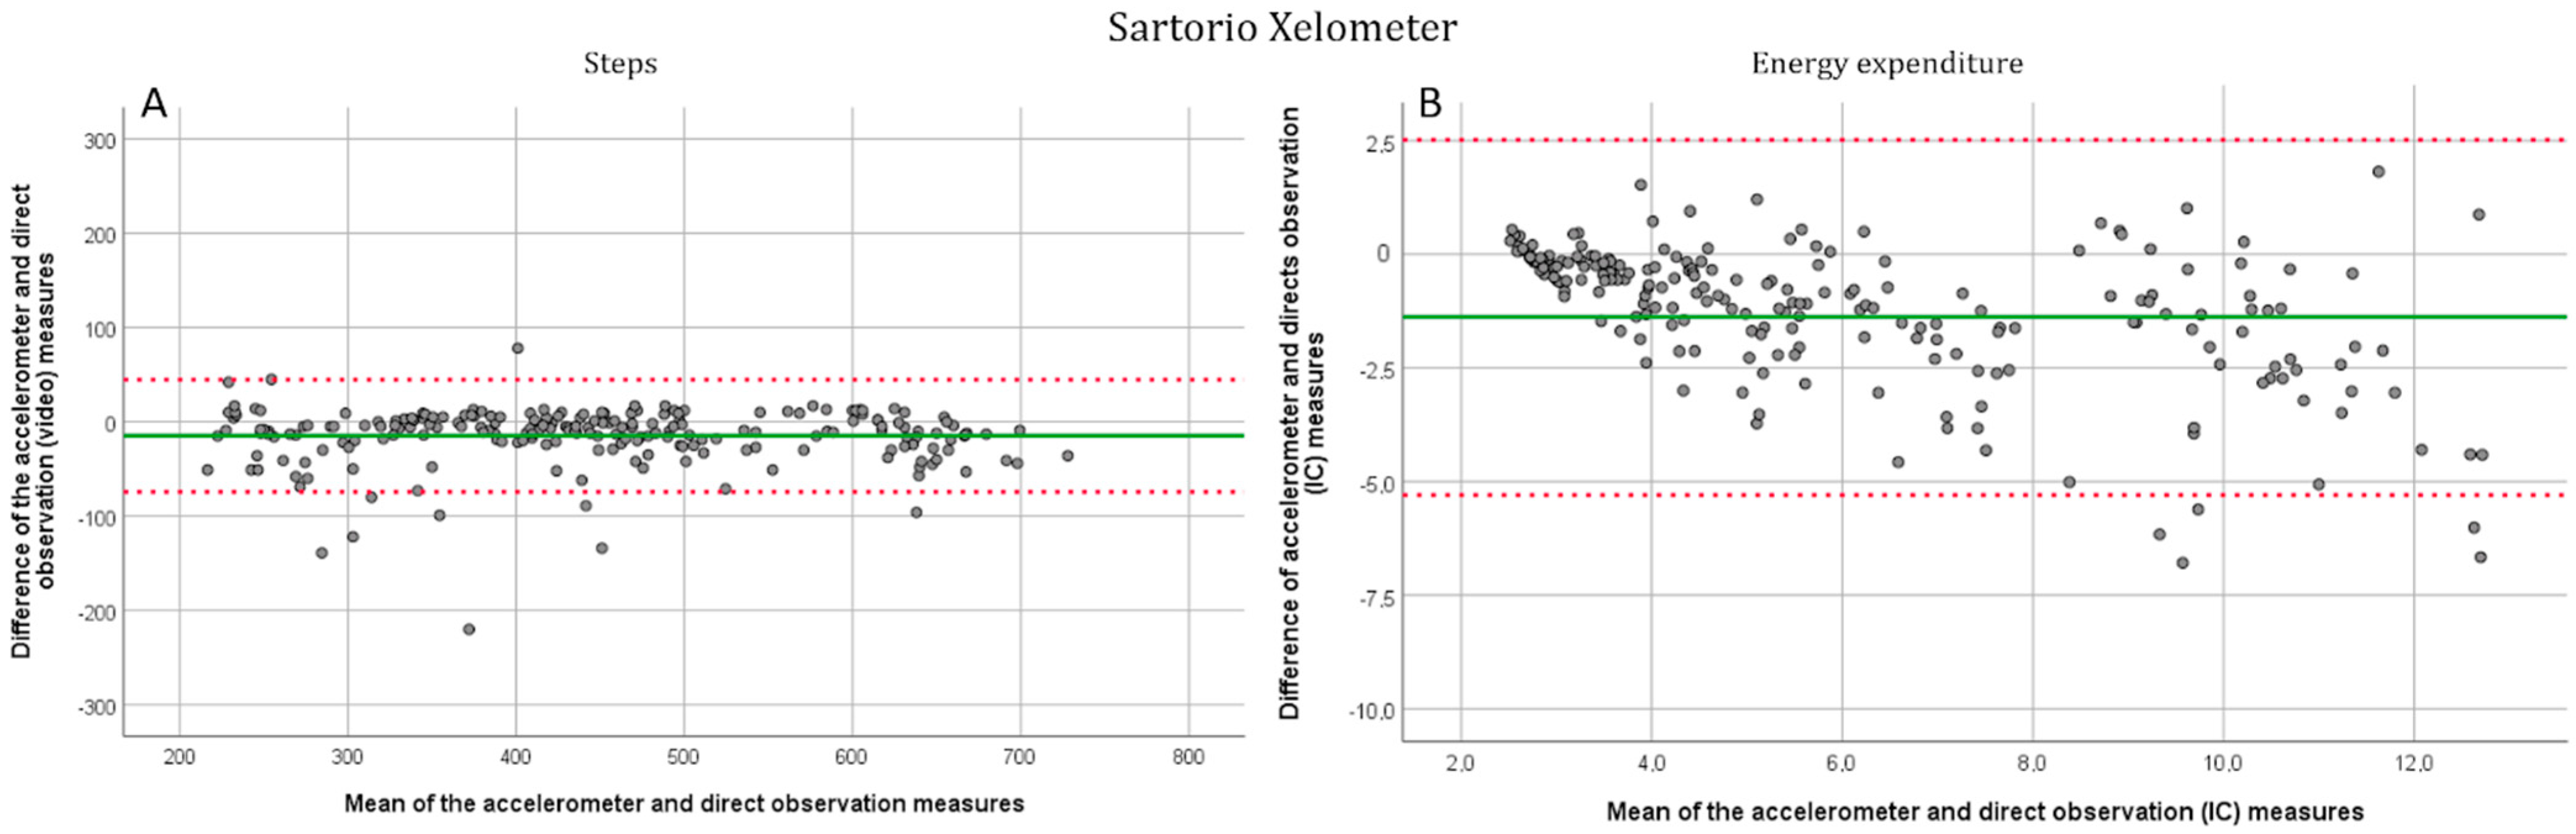
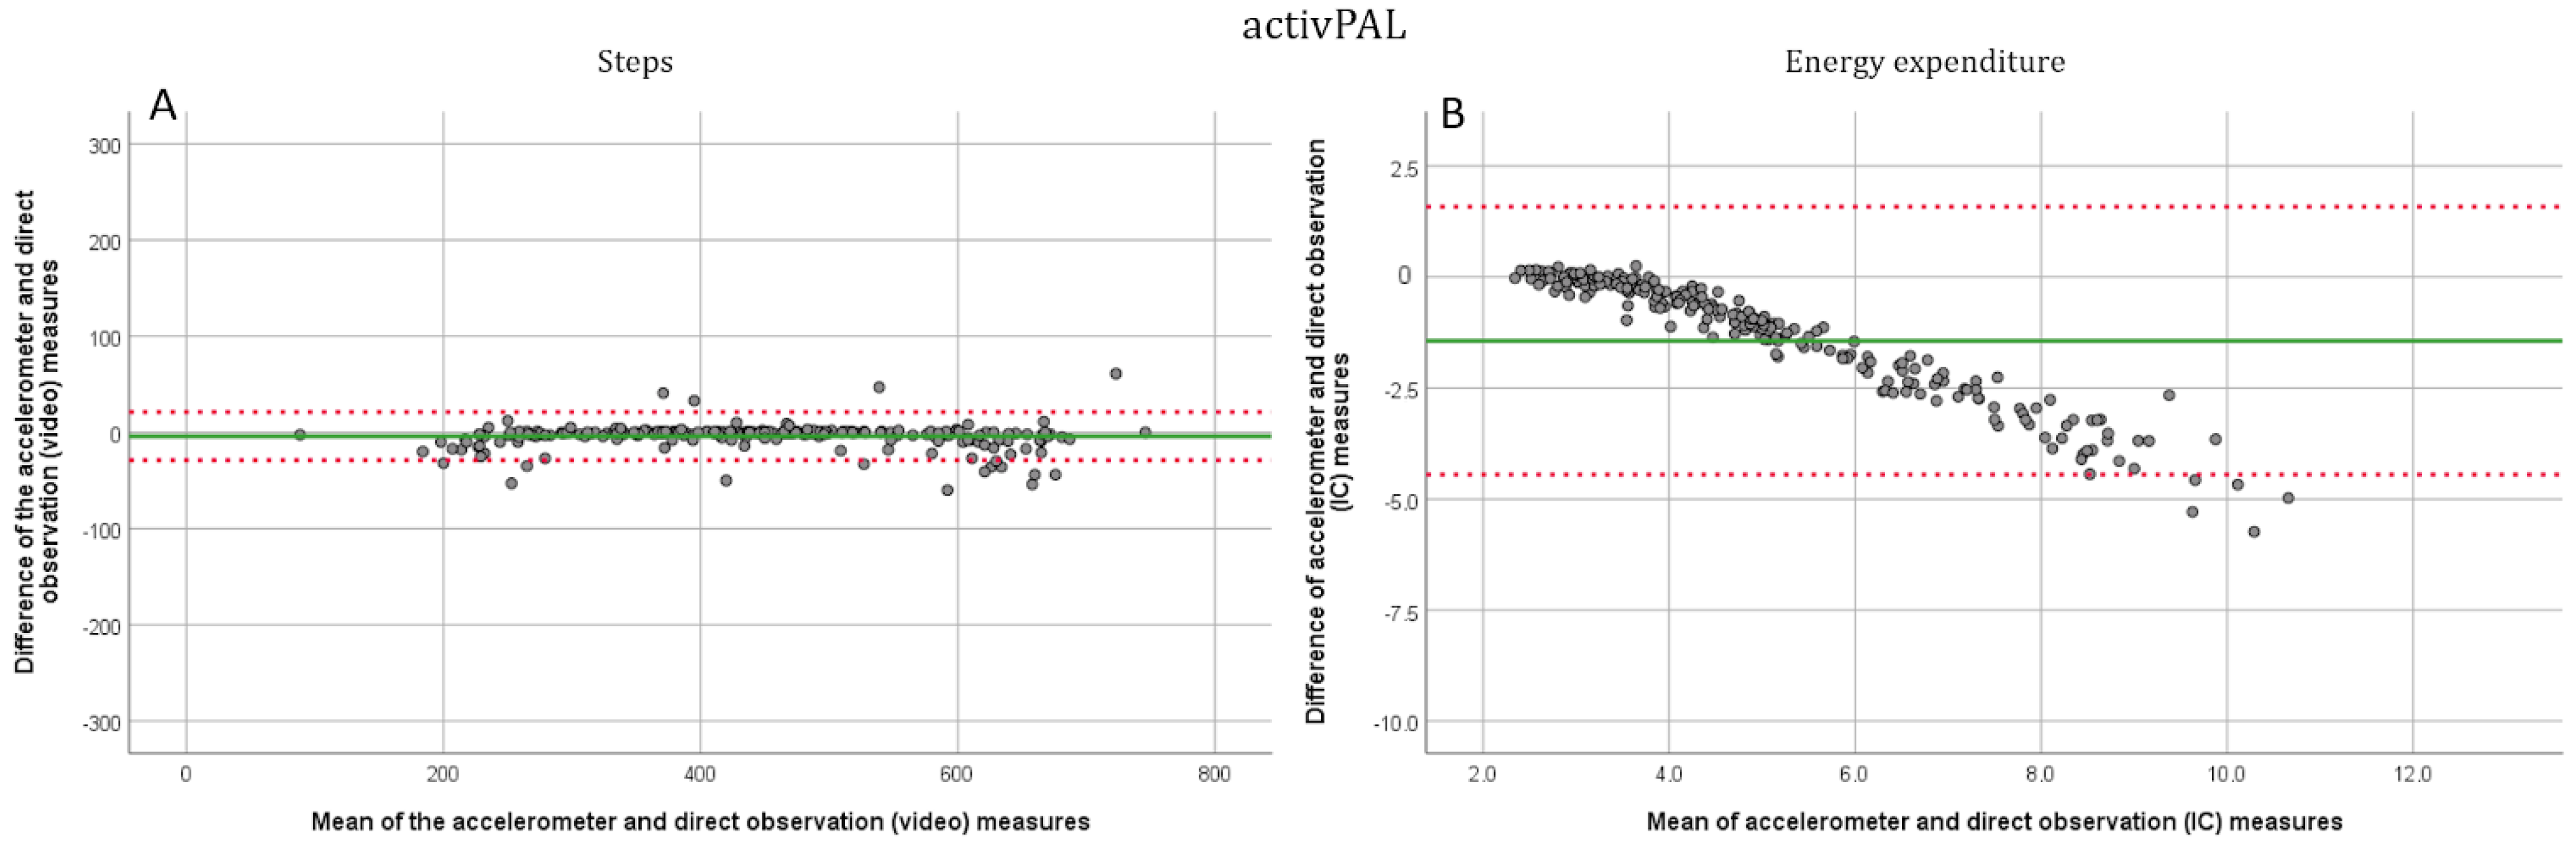
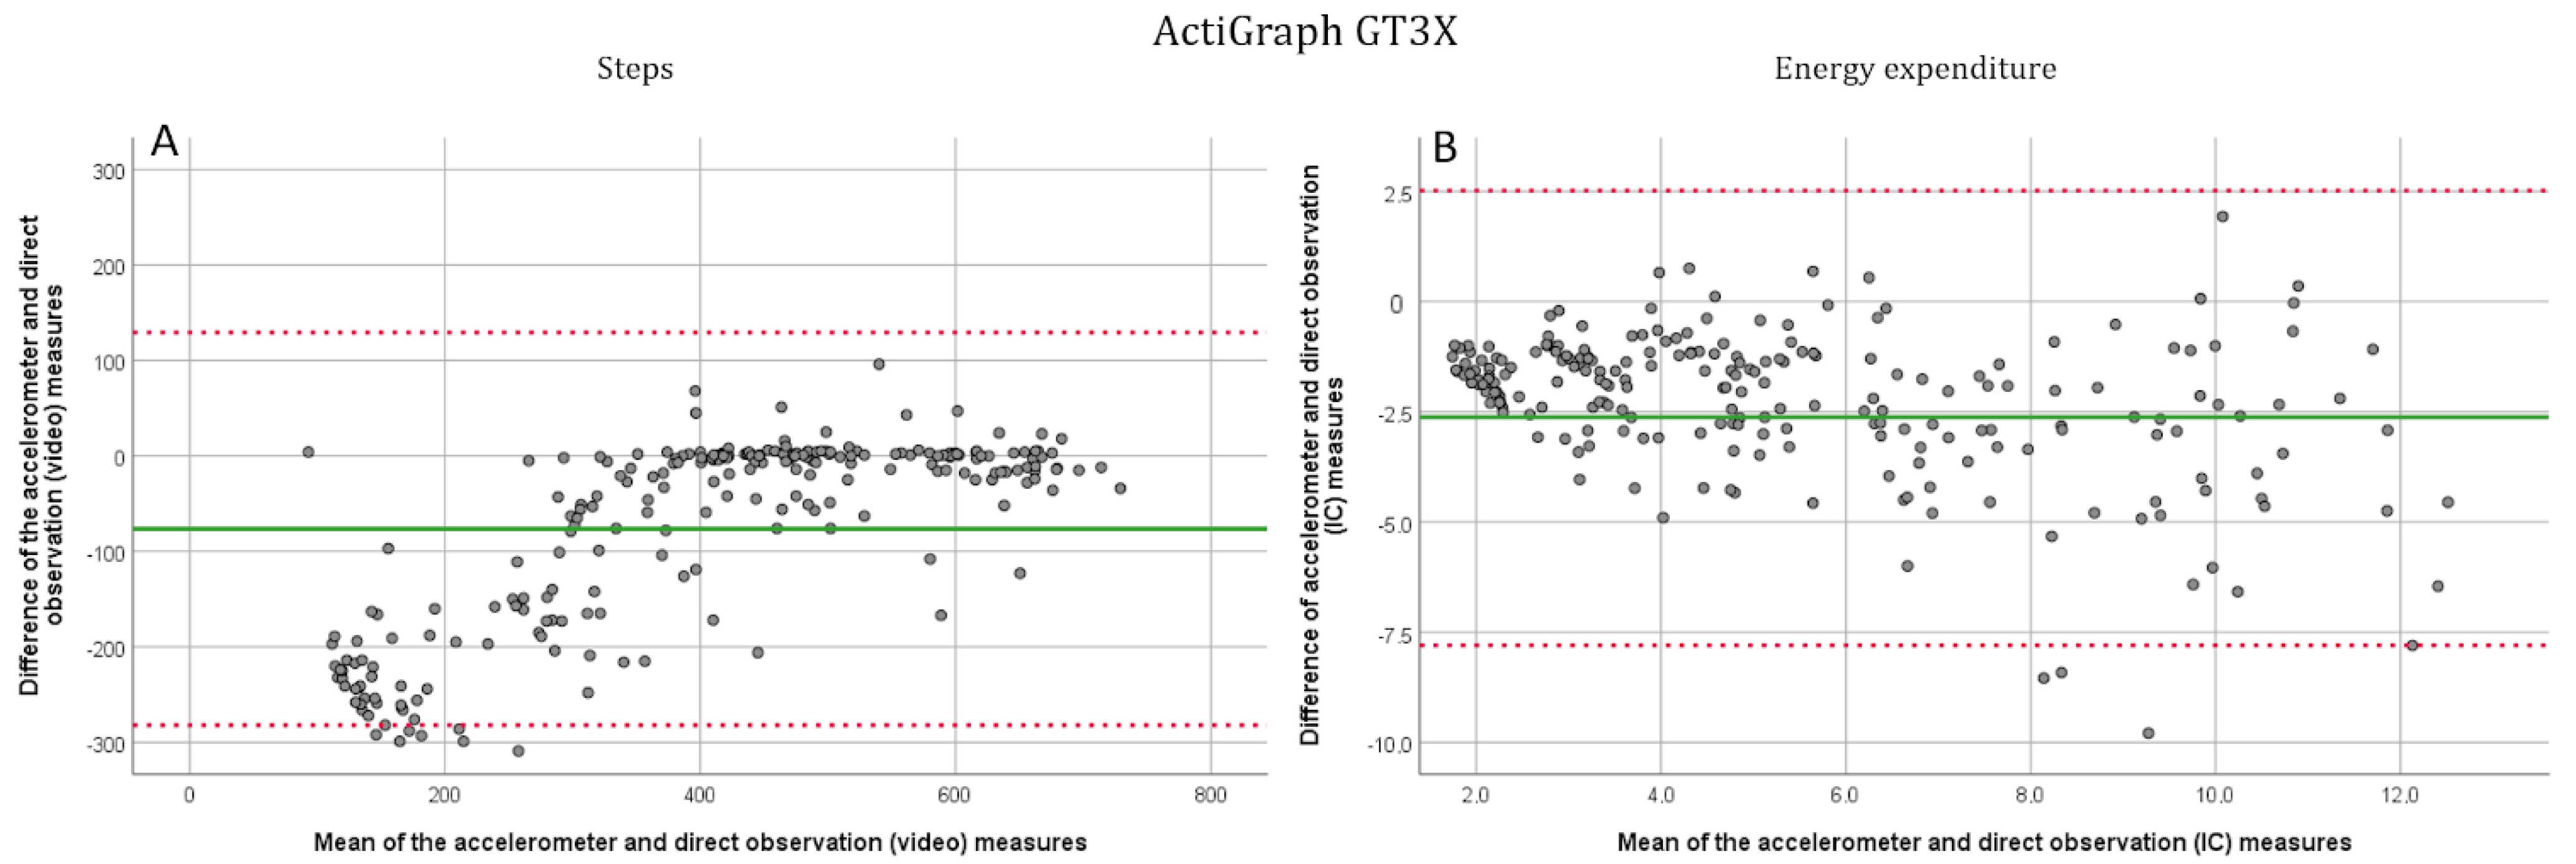
3.1. Step Detection
3.2. Energy Expenditure Estimation
4. Discussion
Supplementary Materials
Author Contributions
Funding
Institutional Review Board Statement
Informed Consent Statement
Acknowledgments
Conflicts of Interest
References
- WHO. Factsheet: Obesity and Overweight. Available online: https://www.who.int/news-room/fact-sheets/detail/obesity-and-overweight (accessed on 12 April 2022).
- Pi-Sunyer, X. The Medical Risks of Obesity. Postgrad. Med. 2009, 121, 21–33. [Google Scholar] [CrossRef]
- Waters, H.; Graf, M. America’s Obesity Crisis. The Health and Economic Costs of Excess Weight; Milken Institute: Santa Monica, CA, USA, 2018; Available online: https://milkeninstitute.org/sites/default/files/reports-pdf/Mi-Americas-Obesity-Crisis-WEB.pdf (accessed on 12 April 2022).
- Effertz, T.; Engel, S.; Verheyen, F.; Linder, R. The Costs and Consequences of Obesity in Germany: A New Approach from a Prevalence and Life-Cycle Perspective. Eur. J. Health Econ. 2016, 17, 1141–1158. [Google Scholar] [CrossRef]
- Wang, Y.C.; McPherson, K.; Marsh, T.; Gortmaker, S.L.; Brown, M. Health and Economic Burden of the Projected Obesity Trends in the USA and the UK. Lancet 2011, 378, 815–825. [Google Scholar] [CrossRef]
- Bull, F.C.; Al-Ansari, S.S.; Biddle, S.; Borodulin, K.; Buman, M.P.; Cardon, G.; Carty, C.; Chaput, J.-P.; Chastin, S.; Chou, R.; et al. World Health Organization 2020 Guidelines on Physical Activity and Sedentary Behaviour. Br. J. Sports Med. 2020, 54, 1451–1462. [Google Scholar] [CrossRef] [PubMed]
- Chow, J.J.; Thom, J.M.; Wewege, M.A.; Ward, R.E.; Parmenter, B.J. Accuracy of Step Count Measured by Physical Activity Monitors: The Effect of Gait Speed and Anatomical Placement Site. Gait Posture 2017, 57, 199–203. [Google Scholar] [CrossRef] [Green Version]
- Migueles, J.H.; Cadenas-Sanchez, C.; Ekelund, U.; Delisle Nyström, C.; Mora-Gonzalez, J.; Löf, M.; Labayen, I.; Ruiz, J.R.; Ortega, F.B. Accelerometer Data Collection and Processing Criteria to Assess Physical Activity and Other Outcomes: A Systematic Review and Practical Considerations. Sports Med. 2017, 47, 1821–1845. [Google Scholar] [CrossRef] [PubMed]
- Leinonen, A.-M.; Ahola, R.; Kulmala, J.; Hakonen, H.; Vähä-Ypyä, H.; Herzig, K.-H.; Auvinen, J.; Keinänen-Kiukaanniemi, S.; Sievänen, H.; Tammelin, T.H.; et al. Measuring Physical Activity in Free-Living Conditions-Comparison of Three Accelerometry-Based Methods. Front. Physiol. 2017, 7. [Google Scholar] [CrossRef] [PubMed] [Green Version]
- Lai, P.P.K.; Leung, A.K.L.; Li, A.N.M.; Zhang, M. Three-Dimensional Gait Analysis of Obese Adults. Clin. Biomech. 2008, 23, S2–S6. [Google Scholar] [CrossRef]
- Ling, C.; Kelechi, T.; Mueller, M.; Brotherton, S.; Smith, S. Gait and Function in Class III Obesity. J. Obes. 2012, 2012. [Google Scholar] [CrossRef] [Green Version]
- Mendes, J.; Borges, N.; Santos, A.; Padrão, P.; Moreira, P.; Afonso, C.; Negrão, R.; Amaral, T.F. Nutritional Status and Gait Speed in a Nationwide Population-Based Sample of Older Adults. Sci. Rep. 2018, 8, 1–8. [Google Scholar] [CrossRef]
- Ko, S.-U.; Stenholm, S.; Ferrucci, L. Characteristic Gait Patterns in Older Adults with Obesity-Results from the Baltimore Longitudinal Study of Aging. J. Biomech. 2010, 43, 1104–1110. [Google Scholar] [CrossRef] [Green Version]
- Ainslie, P.N.; Reilly, T.; Westerterp, K.R. Estimating Human Energy Expenditure. Sport. Med. 2003, 33, 683–698. [Google Scholar] [CrossRef]
- Ocobock, C.; Soppela, P.; Turunen, M.; Stenbäck, V.; Herzig, K.-H.; Rimbach, R.; Pontzer, H. Reindeer Herders from Subarctic Finland Exhibit High Total Energy Expenditure and Low Energy Intake during the Autumn Herd Roundup. Am. J. Hum. Biol. 2022, 34, e23676. [Google Scholar] [CrossRef]
- Pisanu, S.; Deledda, A.; Loviselli, A.; Huybrechts, I.; Velluzzi, F. Validity of Accelerometers for the Evaluation of Energy Expenditure in Obese and Overweight Individuals: A Systematic Review. J. Nutr. Metab. 2020, 2020. [Google Scholar] [CrossRef] [PubMed]
- Imboden, M.T.; Nelson, M.B.; Kaminsky, L.A.; Montoye, A.H. Comparison of Four Fitbit and Jawbone Activity Monitors with a Research-Grade ActiGraph Accelerometer for Estimating Physical Activity and Energy Expenditure. Br. J. Sports Med. 2018, 52, 844–850. [Google Scholar] [CrossRef] [Green Version]
- Stenbäck, V.; Leppäluoto, J.; Leskelä, N.; Viitala, L.; Vihriälä, E.; Gagnon, D.; Tulppo, M.; Herzig, K.-H. Step Detection and Energy Expenditure at Different Speeds by Three Accelerometers in a Controlled Environment. Sci. Rep. 2021, 11, 1–10. [Google Scholar] [CrossRef]
- Herzig, K.-H.; Ahola, R.; Leppäluoto, J.; Jokelainen, J.; Jämsä, T.; Keinänen-Kiukaanniemi, S. Light Physical Activity Determined by a Motion Sensor Decreases Insulin Resistance, Improves Lipid Homeostasis and Reduces Visceral Fat in High Risk Subjects. Int. J. Obes. (Lond.) 2014, 38, 1089–1096. [Google Scholar] [CrossRef] [PubMed] [Green Version]
- Feito, Y.; Bassett, D.R.; Thompson, D.L.; Tyo, B.M. Effects of Body Mass Index on Step Count Accuracy of Physical Activity Monitors. J. Phys. Act. Health 2012, 9, 594–600. [Google Scholar] [CrossRef]
- Howe, C.C.F.; Moir, H.J.; Easton, C. Classification of Physical Activity Cut-Points and the Estimation of Energy Expenditure During Walking Using the GT3X+ Accelerometer in Overweight and Obese Adults. Meas. Phys. Educ. Exerc. Sci. 2017, 21, 127–133. [Google Scholar] [CrossRef] [Green Version]
- Sushames, A.; Edwards, A.; Thompson, F.; McDermott, R.; Gebel, K. Validity and Reliability of Fitbit Flex for Step Count, Moderate to Vigorous Physical Activity and Activity Energy Expenditure. PLoS ONE 2016, 11, e0161224. [Google Scholar] [CrossRef] [PubMed]
- Diniz-Sousa, F.; Veras, L.; Ribeiro, J.C.; Boppre, G.; Devezas, V.; Santos-Sousa, H.; Preto, J.; Machado, L.; Vilas-Boas, J.P.; Oliveira, J.; et al. Accelerometry Calibration in People with Class II-III Obesity: Energy Expenditure Prediction and Physical Activity Intensity Identification. Gait Posture 2020, 76, 104–109. [Google Scholar] [CrossRef] [PubMed]
- Lee, J.A.; Williams, S.M.; Brown, D.D.; Laurson, K.R. Concurrent Validation of the Actigraph Gt3x+, Polar Active Accelerometer, Omron HJ-720 and Yamax Digiwalker SW-701 Pedometer Step Counts in Lab-Based and Free-Living Settings. J. Sports Sci. 2015, 33, 991–1000. [Google Scholar] [CrossRef] [PubMed]
- Feito, Y.; Hornbuckle, L.M.; Reid, L.A.; Crouter, S.E. Effect of ActiGraph’s Low Frequency Extension for Estimating Steps and Physical Activity Intensity. PLoS ONE 2017, 12, e0188242. [Google Scholar] [CrossRef] [Green Version]
- Wallén, M.B.; Nero, H.; Franzén, E.; Hagströmer, M. Comparison of Two Accelerometer Filter Settings in Individuals with Parkinson’s Disease. Physiol. Meas. 2014, 35, 2287–2296. [Google Scholar] [CrossRef] [PubMed]


| Sex | 24 Male, 24 Female | Min.–Max. |
| Age (years) | 37.4 ± 14.1 | 21–74 |
| Height (cm) | 173.6 ± 10.3 | 153.5–194.0 |
| Weight (kg) | 94.8 ± 15.5 | 70.2–142.5 |
| BMI | 31.4 ± 3.8 | 26.5–39.7 |
| SMM-% (impedance) | 36.9 ± 6.2 | 27.3–51.1 |
| Fat-% (impedance) | 34.4 ± 10.1 | 12.2–50.9 |
| Waist circumference (cm) | 99.2 ± 12.0 | 82.0–133.0 |
| STEPS | Paired Samples t-Test | 95% Confidence Interval of the Difference | ICC | 95% Confidence Interval | F Test | ||||||
|---|---|---|---|---|---|---|---|---|---|---|---|
| Sartorio | Speed (km/h) | MAPE-% ± Std. Dev. | Mean ± Std. Dev. | Lower | Upper | Sig. (2-Tailed) | Lower | Upper | Value | Sig. | |
| 1.5 | 9.73 ± 7.82 | 19.68 ± 32.10 | 9.55 | 29.81 | 0.000 * | 0.61 | 0.27 | 0.79 | 2.56 | 0.002 * | |
| 3 | 3.97 ± 7.48 | 10.05 ± 30.41 | 0.45 | 19.65 | 0.041 * | 0.84 | 0.71 | 0.92 | 6.39 | 0.000 * | |
| 4.5 | 2.91 ± 3.35 | 2.59 ± 17.56 | −2.96 | 8.13 | 0.351 | 0.93 | 0.86 | 0.96 | 13.85 | 0.000 * | |
| 6 | 6.28 ± 8.02 | 28.87 ± 41.85 | 15.49 | 42.26 | 0.000 * | 0.79 | 0.59 | 0.89 | 4.67 | 0.000 * | |
| Run1 | 2.26 ± 1.46 | 4.43 ± 16.02 | −1.070 | 9.93 | 0.111 | 0.99 | 0.97 | 0.99 | 74.43 | 0.000 * | |
| Run2 | 4.47 ± 3.08 | 26.54 ± 24.35 | 16.26 | 36.82 | 0.000 * | 0.98 | 0.96 | 0.99 | 62.47 | 0.000 * | |
| Total | 3.48 ± 3.03 | 82.02 ± 75.94 | 58.05 | 105.99 | 0.000 * | 0.90 | 0.81 | 0.94 | 9.81 | 0.000 * | |
| activPAL | |||||||||||
| 1.5 | 6.39 ± 8.10 | 14.90 ± 23.79 | 7.74 | 22.04 | 0.000 * | 0.94 | 0.88 | 0.96 | 15.65 | 0.000 * | |
| 3 | 0.95 ± 1.59 | 1.60 ± 7.17 | −0.55 | 3.75 | 0.141 | 0.99 | 0.99 | 1.00 | 135.88 | 0.000 * | |
| 4.5 | 0.99 ± 2.75 | −0.29 ± 10.94 | −3.58 | 3.00 | 0.860 | 0.98 | 0.96 | 0.99 | 41.68 | 0.000 * | |
| 6 | 2.44 ± 5.45 | −1.42 ± 22.75 | −8.26 | 5.41 | 0.677 | 0.98 | 0.97 | 0.99 | 62.54 | 0.000 * | |
| Run1 | 3.99 ± 5.25 | 22.68 ± 33.36 | 11.55 | 33.80 | 0.000 * | 0.94 | 0.88 | 0.97 | 16.19 | 0.000 * | |
| Run2 | 5.18 ± 4.60 | 17.39 ± 43.05 | −1.22 | 36.00 | 0.066 | 0.91 | 0.8 | 0.96 | 11.68 | 0.000 * | |
| Total | 4.37 ± 10.53 | 42.27 ± 213.67 | −21.93 | 106.46 | 0.191 | 0.95 | 0.91 | 0.97 | 19.49 | 0.000 * | |
| ActiGraph | |||||||||||
| 1.5 | 88.69 ± 10.93 | 242.35 ± 47.32 | 228.30 | 256.40 | 0.000 * | 0.44 | −0.018 | 0.69 | 1.77 | 0.029 * | |
| 3 | 31.50 ± 18.87 | 119.85 ± 82.36 | 95.39 | 144.31 | 0.000 * | −0.12 | −1.02 | 0.38 | 0.89 | 0.646 | |
| 4.5 | 4.25 ± 9.11 | 13.37 ± 45.19 | −0.05 | 26.79 | 0.051 | 0.58 | 0.25 | 0.77 | 2.40 | 0.002 * | |
| 6 | 5.23 ± 9.35 | 11.59 ± 43.62 | −1.37 | 24.54 | 0.078 | 0.94 | 0.89 | 0.97 | 17.14 | 0.000 * | |
| Run1 | 4.43 ± 10.3 | 19.50 ± 68.82 | −3.12 | 42.12 | 0.089 | 0.80 | 0.61 | 0.89 | 4.91 | 0.000 * | |
| Run2 | 2.63 ± 1.56 | 12.72 ± 16.28 | 6.00 | 19.44 | 0.000 * | 0.99 | 0.98 | 1.00 | 142.15 | 0.000 * | |
| Total | 17.80 ± 9.48 | 381.35 ± 221.25 | 315.65 | 447.05 | 0.000 * | 0.95 | 0.92 | 0.97 | 21.61 | 0.000 * | |
| MET | Paired Samples t-Test | 95% Confidence Interval of the Difference | ICC | 95% Confidence Interval | F Test | ||||||
|---|---|---|---|---|---|---|---|---|---|---|---|
| Sartorio | Speed (km/h) | MAPE-% ± Std. Dev. | Mean ± Std. Dev. | Lower | Upper | Sig. (2-Tailed) | Lower | Upper | Value | Sig. | |
| 1.5 | 15.15 ± 13.72 | 0.37 ± 0.81 | 0.11 | 0.62 | 0.005 * | 0.11 | −0.67 | 0.53 | 1.12 | 0.353 | |
| 3 | 17.60 ± 13.16 | 0.73 ± 0.96 | 0.42 | 1.04 | 0.000 * | 0.21 | −0.47 | 0.58 | 1.27 | 0.223 | |
| 4.5 | 19.02 ± 11.75 | 1.04 ± 1.05 | 0.71 | 1.38 | 0.000 * | 0.23 | −0.43 | 0.59 | 1.31 | 0.199 | |
| 6 | 21.41 ± 12.92 | 1.74 ± 1.59 | 1.21 | 2.25 | 0.000 * | 0.21 | −0.51 | 0.58 | 1.26 | 0.237 | |
| Run1 | 18.03 ± 12.21 | 1.83 ± 2.07 | 1.09 | 2.57 | 0.000 * | 0.18 | −0.64 | 0.59 | 1.22 | 0.282 | |
| Run2 | 19.74 ± 11.89 | 2.59 ± 2.11 | 1.64 | 3.52 | 0.000 * | 0.08 | −1.19 | 0.62 | 1.09 | 0.417 | |
| Total | 18.43 ± 13.59 | 1.31 ± 1.37 | 0.86 | 1.74 | 0.000 * | 0.28 | −0.34 | 0.62 | 1.40 | 0.146 | |
| activPAL | |||||||||||
| 1.5 | 12.36 ± 11.20 | 0.30 ± 0.68 | 0.09 | 0.51 | 0.005 * | 0.37 | −0.16 | 0.65 | 1.58 | 0.068 | |
| 3 | 16.29 ± 12.65 | 0.74 ± 0.81 | 0.49 | 0.99 | 0.000 * | 0.29 | −0.3 | 0.61 | 1.41 | 0.134 | |
| 4.5 | 27.82 ± 11.92 | 1.60 ± 0.97 | 1.30 | 1.90 | 0.000 * | 0.17 | −0.51 | 0.55 | 1.21 | 0.264 | |
| 6 | 43.82 ± 10.70 | 3.48 ± 1.61 | 2.95 | 3.99 | 0.000 * | 0.05 | −0.79 | 0.50 | 1.06 | 0.425 | |
| Run1 | 56.10 ± 7.43 | 6.18 ± 1.93 | 5.48 | 6.87 | 0.000 * | −0.03 | −1.12 | 0.49 | 0.96 | 0.538 | |
| Run2 | 57.38 ± 6.40 | 7.39 ± 1.91 | 6.49 | 8.28 | 0.000 * | 0.13 | −1.18 | 0.65 | 1.15 | 0.378 | |
| Total | 49.62 ± 11.21 | 3.37 ± 1.25 | 2.97 | 3.75 | 0.000 * | 0.49 | 0.07 | 0.72 | 1.99 | 0.013 * | |
| ActiGraph | |||||||||||
| 1.5 | 59.45 ± 9.40 | 1.95 ± 0.74 | 1.72 | 2.17 | 0.000 * | 0.15 | −0.55 | 0.53 | 1.17 | 0.295 | |
| 3 | 40.67 ± 14.07 | 1.82 ± 1.00 | 1.51 | 2.12 | 0.000 * | −0.10 | −1.03 | 0.39 | 0.90 | 0.631 | |
| 4.5 | 28.92 ± 13.17 | 1.61 ± 1.13 | 1.26 | 1.95 | 0.000 * | 0.17 | −0.5 | 0.55 | 1.21 | 0.260 | |
| 6 | 29.88 ± 15.19 | 2.37 ± 1.66 | 1.84 | 2.89 | 0.000 * | 0.30 | −0.29 | 0.63 | 1.44 | 0.124 | |
| Run1 | 29.61 ± 17.13 | 3.16 ± 2.51 | 2.25 | 4.06 | 0.000 * | 0.27 | −0.49 | 0.64 | 1.37 | 0.190 | |
| Run2 | 32.09 ± 16.50 | 4.20 ± 2.69 | 3.00 | 5.39 | 0.000 * | −0.34 | −2.23 | 0.44 | 0.74 | 0.746 | |
| Total | 36.16 ± 15.06 | 2.42 ± 1.41 | 1.98 | 2.84 | 0.000 * | 0.43 | −0.03 | 0.69 | 1.77 | 0.031 * | |
Publisher’s Note: MDPI stays neutral with regard to jurisdictional claims in published maps and institutional affiliations. |
© 2022 by the authors. Licensee MDPI, Basel, Switzerland. This article is an open access article distributed under the terms and conditions of the Creative Commons Attribution (CC BY) license (https://creativecommons.org/licenses/by/4.0/).
Share and Cite
Stenbäck, V.; Leppäluoto, J.; Juustila, R.; Niiranen, L.; Gagnon, D.; Tulppo, M.; Herzig, K.-H. Step Detection Accuracy and Energy Expenditure Estimation at Different Speeds by Three Accelerometers in a Controlled Environment in Overweight/Obese Subjects. J. Clin. Med. 2022, 11, 3267. https://doi.org/10.3390/jcm11123267
Stenbäck V, Leppäluoto J, Juustila R, Niiranen L, Gagnon D, Tulppo M, Herzig K-H. Step Detection Accuracy and Energy Expenditure Estimation at Different Speeds by Three Accelerometers in a Controlled Environment in Overweight/Obese Subjects. Journal of Clinical Medicine. 2022; 11(12):3267. https://doi.org/10.3390/jcm11123267
Chicago/Turabian StyleStenbäck, Ville, Juhani Leppäluoto, Rosanna Juustila, Laura Niiranen, Dominique Gagnon, Mikko Tulppo, and Karl-Heinz Herzig. 2022. "Step Detection Accuracy and Energy Expenditure Estimation at Different Speeds by Three Accelerometers in a Controlled Environment in Overweight/Obese Subjects" Journal of Clinical Medicine 11, no. 12: 3267. https://doi.org/10.3390/jcm11123267