
Impaired Cardiac Sympathetic Innervation Increases the Risk of Cardiac Events in Heart Failure Patients with Left Ventricular Hypertrophy and Mechanical Dyssynchrony

 ,
,
Abstract
:1. Introduction
2. Methods
2.1. Study Patients
2.2. Two-Dimensional Echocardiographic Assessment
2.3. Assessment of LVMD and Left Ventricular Mass Index
2.4. Cardiac 123I-MIBG Imaging
2.5. Follow-Up Protocol
2.6. Statistical Analysis
3. Results
4. Discussion
4.1. Assessment of LVMI and LVMD
4.2. Assessment of Cardiac Sympathetic Innervation
4.3. Clinical Implications
4.4. Study Limitations
5. Conclusions
Supplementary Materials
Author Contributions
Funding
Institutional Review Board Statement
Informed Consent Statement
Data Availability Statement
Acknowledgments
Conflicts of Interest
References
- Dharmarajan, K.; Rich, M.W.D. Epidemiology, Pathophysiology, and Prognosis of Heart Failure in Older Adults. Heart Fail. Clin. 2017, 13, 417–426. [Google Scholar] [CrossRef] [Green Version]
- Lesyuk, W.; Kriza, C.; Kolominsky-Rabas, P. Cost-of-illness studies in heart failure: A systematic review 2004–2016. BMC Cardiovasc. Disord. 2018, 18, 1–11. [Google Scholar] [CrossRef] [Green Version]
- Loehr, L.R.; Rosamond, W.D.; Chang, P.P.; Folsom, A.R.; Chambless, L.E. Heart failure incidence and survival (from the Atherosclerosis Risk in Communities study). Am. J. Cardiol. 2008, 101, 1016–1022. [Google Scholar] [CrossRef]
- Yancy, C.W.; Jessup, M.; Bozkurt, B.; Butler, J.; Casey, D.E., Jr.; Colvin, M.M.; Drazner, M.H.; Filippatos, G.S.; Fonarow, G.C.; Givertz, M.M.; et al. 2017 ACC/AHA/HFSA Focused Update of the 2013 ACCF/AHA Guideline for the Management of Heart Failure: A Report of the American College of Cardiology/American Heart Association Task Force on Clinical Practice Guidelines and the Heart Failure Society of America. Circulation 2017, 136, e137–e161. [Google Scholar] [CrossRef]
- Murphy, S.P.; Ibrahim, N.E.; Januzzi, J.L., Jr. Heart Failure With Reduced Ejection Fraction: A Review. JAMA 2020, 324, 488–504. [Google Scholar] [CrossRef]
- Abraham, W.T.; Fisher, W.G.; Smith, A.L.; Delurgio, D.B.; Leon, A.R.; Loh, E.; Kocovic, D.Z.; Packer, M.; Clavell, A.L.; Hayes, D.L.; et al. Cardiac Resynchronization in Chronic Heart Failure. N. Engl. J. Med. 2002, 346, 1845–1853. [Google Scholar] [CrossRef] [Green Version]
- Epstein, A.E.; DiMarco, J.P.; Ellenbogen, K.A.; Estes, N.M., III; Freedman, R.A.; Gettes, L.S.; Gillinov, A.M.; Gregoratos, G.; Hammill, S.C.; Hayes, D.L.; et al. American College of Cardiology Foundation; American Heart Association Task Force on Practice Guidelines; Heart Rhythm Society. 2012 ACCF/AHA/HRS Focused Update Incorporated Into the ACCF/AHA/HRS 2008 Guidelines for Device-Based Therapy of Cardiac Rhythm Abnormalities. J. Am. Coll. Cardiol. 2013, 61, e6–e75. [Google Scholar]
- Ponikowski, P.; Voors, A.A.; Anker, S.D.; Bueno, H.; Cleland, J.G.F.; Coats, A.J.S.; Falk, V.; González-Juanatey, J.R.; Harjola, V.-P.; Jankowska, E.A.; et al. 2016 ESC Guidelines for the diagnosis and treatment of acute and chronic heart failure: The Task Force for the diagnosis and treatment of acute and chronic heart failure of the European Society of Cardiology (ESC) Developed with the special contribution of the Heart Failure Association (HFA) of the ESC. Eur. Heart J. 2016, 37, 2129–2200. [Google Scholar] [CrossRef]
- Hawkins, N.M.; Petrie, M.C.; Burgess, M.I.; McMurray, J.J. Selecting Patients for Cardiac Resynchronization Therapy. The Fallacy of Echocardiographic Dyssynchrony. J. Am. Coll. Cardiol. 2009, 53, 1944–1959. [Google Scholar] [CrossRef] [Green Version]
- Tada, T.; Osuda, K.; Nakata, T.; Muranaka, I.; Himeno, M.; Muratsubaki, S.; Murase, H.; Sato, K.; Hirose, M.; Fukuma, T. A novel approach to the selection of an appropriate pacing position for optimal cardiac resynchronization therapy using CT coronary venography and myocardial perfusion imaging: FIVE STaR method (fusion image using CT coronary venography and perfusion SPECT applied for cardiac resynchronization therapy). J. Nucl. Cardiol. 2021, 28, 1438–1445, Online ahead of print. [Google Scholar] [CrossRef] [Green Version]
- Doi, T.; Nakata, T.; Yuda, S.; Hashimoto, A. Synergistic prognostication of left ventricular hypertrophy and three-dimensional mechanical dyssynchrony in heart failure. ESC Heart Fail. 2020, 7, 361–370. [Google Scholar] [CrossRef]
- Doi, T.; Nakata, T.; Noto, T.; Mita, T.; Yuda, S.; Hashimoto, A. Improved risk-stratification in heart failure patients with mid-range to severe abnormalities of QRS duration and systolic function using mechanical dyssynchrony assessed by myocardial perfusion-gated SPECT. J. Nucl. Cardiol. 2021, 1–15. [Google Scholar] [CrossRef]
- Doi, T.; Nakata, T.; Yuda, S.; Hashimoto, A. Synergistic prognostic implications of left ventricular mechanical dyssynchrony and impaired cardiac sympathetic nerve activity in heart failure patients with reduced left ventricular ejection fraction. Eur. Hear. J.-Cardiovasc. Imaging 2018, 19, 74–83. [Google Scholar] [CrossRef] [Green Version]
- Zipes, D.P. Sympathetic Stimulation and Arrhythmias. N. Engl. J. Med. 1991, 325, 656–657. [Google Scholar] [CrossRef]
- Kaye, D.M.; Lefkovits, J.; Jennings, G.; Bergin, P.; Broughton, A.; Esler, M.D. Adverse consequences of high sympathetic nervous activity in the failing human heart. J. Am. Coll. Cardiol. 1995, 26, 1257–1263. [Google Scholar] [CrossRef] [Green Version]
- Nakata, T.; Hashimoto, A.; Sugawara, H. Cardiac Metaiodobenzylguanidine Imaging and Heart Failure. Curr. Heart Fail. Rep. 2013, 10, 359–364. [Google Scholar] [CrossRef]
- Nakajima, K.; Nakata, T. Cardiac 123I-MIBG Imaging for Clinical Decision Making: 22-Year Experience in Japan. J. Nucl. Med. 2015, 56, 11S–19S. [Google Scholar] [CrossRef] [Green Version]
- Nakata, T.; Nakajima, K.; Yamashina, S.; Yamada, T.; Momose, M.; Kasama, S.; Matsui, T.; Matsuo, S.; Travin, M.I.; Jacobson, A.F. A pooled analysis of multicenter cohort studies of (123)I-mIBG imaging of sympathetic innervation for assessment of long-term prognosis in heart failure. J. Am. Coll. Cardiol. Cardiovasc. Imaging 2013, 6, 772–784. [Google Scholar] [CrossRef] [Green Version]
- Jacobson, A.F.; Senior, R.; Cerqueira, M.D.; Wong, N.D.; Thomas, G.S.; Lopez, V.A.; Agostini, D.; Weiland, F.; Chandna, H.; Narula, J. Myocardial Iodine-123 Meta-Iodobenzylguanidine Imaging and Cardiac Events in Heart Failure: Results of the Prospective ADMIRE-HF (AdreView Myocardial Imaging for Risk Evaluation in Heart Failure) Study. J. Am. Coll. Cardiol. 2010, 55, 2212–2221. [Google Scholar] [CrossRef] [Green Version]
- Verschure, D.O.; Veltman, C.E.; Manrique, A.; Somsen, G.A.; Koutelou, M.; Katsikis, A.; Agostini, D.; Gerson, M.C.; van Eck-Smit, B.L.; Scholte, A.J.; et al. For what endpoint does myocardial 123I-MIBG scintigraphy have the greatest prognostic value in patients with chronic heart failure? Results of a pooled individual patient data meta-analysis. Eur. Heart J.-Cardiovasc. Imaging 2014, 15, 996–1003. [Google Scholar] [CrossRef] [Green Version]
- Nakajima, K.; Verschure, D.O.; Okuda, K.; Verberne, H.J. Standardization of 123I-meta-iodobenzylguanidine myocardial sympathetic activity imaging: Phantom calibration and clinical applications. Clin. Transl. Imaging 2017, 5, 255–263. [Google Scholar] [CrossRef] [Green Version]
- Travin, M.I. Cardiac autonomic imaging with SPECT tracers. J. Nucl. Cardiol. 2012, 20, 128–143. [Google Scholar] [CrossRef] [Green Version]
- Nakajima, K.; Nakata, T.; Doi, T.; Tada, H.; Maruyama, K. Machine learning-based risk model using 123I-metaiodobenzylguanidine to differentially predict modes of cardiac death in heart failure. J. Nucl. Cardiol. 2020, 1–12, online ahead of print. [Google Scholar] [CrossRef]
- Doi, T.; Nakata, T.; Hashimoto, A.; Yuda, S.; Wakabayashi, T.; Kouzu, H.; Kaneko, N.; Hase, M.; Tsuchihashi, K.; Miura, T. Synergistic prognostic values of cardiac sympathetic innervation with left ventricular hypertrophy and left atrial size in heart failure patients without reduced left ventricular ejection fraction: A cohort study. BMJ Open 2012, 2, e001015. [Google Scholar] [CrossRef]
- Annapureddy, A.R.; Henien, S.; Wang, Y.; Minges, K.E.; Ross, J.S.; Spatz, E.S.; Desai, N.R.; Peterson, P.N.; Masoudi, F.A.; Curtis, J.P. Association Between Industry Payments to Physicians and Device Selection in ICD Implantation. JAMA 2020, 324, 1755–1764. [Google Scholar] [CrossRef]
- Kadoya, Y.; Zen, K.; Tamaki, N.; Yashige, M.; Takamatsu, K.; Ito, N.; Kuwabara, K.; Yamano, M.; Yamano, T.; Nakamura, T.; et al. Prognostic value of cardiac 123 I-metaiodobenzylguanidine imaging for predicting cardiac events after transcatheter aortic valve replacement. ESC Heart Fail. 2021, 8, 1109–1116. [Google Scholar]
- Fukuda, K.; Hasegawa, S.; Kawamura, T.; Waratani, N.; Hirata, K.; Higashimori, A.; Yokoi, Y. Changes in cardiac sympathetic nerve activity on 123I-metaiodobenzylguanidine scintigraphy after MitraClip therapy. ESC Heart Fail. 2021, 8, 1590–1595. [Google Scholar] [CrossRef]
- Anavekar, N.S.; Skali, H.; Bourgoun, M.; Ghali, J.K.; Kober, L.; Maggioni, A.P.; Mcmurray, J.; Velazquez, E.; Califf, R.; Pfeffer, M.A.; et al. Usefulness of Right Ventricular Fractional Area Change to Predict Death, Heart Failure, and Stroke Following Myocardial Infarction (from the VALIANT ECHO Study). Am. J. Cardiol. 2008, 101, 607–612. [Google Scholar] [CrossRef]
- Zornoff, L.; Skali, H.; Pfeffer, M.A.; Sutton, M.S.J.; Rouleau, J.L.; Lamas, G.A.; Plappert, T.; Rouleau, J.R.; Moyé, L.A.; Lewis, S.J.; et al. Right ventricular dysfunction and risk of heart failure and mortality after myocardial infarction. J. Am. Coll. Cardiol. 2002, 39, 1450–1455. [Google Scholar] [CrossRef] [Green Version]


| Cardiac Events Group (n = 246) | Non-Cardiac Events Group (n = 459) | p-Value | |
|---|---|---|---|
| Age (years) | 70.8 ± 11.4 | 65.1 ± 12.2 | p < 0.0001 |
| Gender (male/female) | 189/57 | 328/131 | ns |
| NYHA (I/II/III/IV) | 85/76/74/11 | 410/38/6/5 | p < 0.0001 |
| Past history | |||
| Hypertension | 127 (51.6%) | 224 (48.8%) | ns |
| Diabetes mellitus | 86 (34.9%) | 167 (36.3%) | ns |
| Dyslipidemia | 87 (35.3%) | 191 (41.6%) | ns |
| Atrial fibrillation | 88 (35.7%) | 127 (27.6%) | ns |
| Ventriculartachycardia/ventricular fibrillation | 59 (23.6%) | 64 (13.9%) | p = 0.0406 |
| Hemodialysis | 56 (22.6%) | 58 (12.6%) | p = 0.0259 |
| Etiology | |||
| Ischemic | 125 (50.8%) | 204 (44.4%) | ns |
| Previous MI | 97 (39.4%) | 157 (34.2%) | ns |
| Post PCI | 98 (39.8%) | 164 (35.7%) | ns |
| Post CABG | 51 (20.7%) | 54 (11.7%) | p = 0.0020 |
| Device implantation | |||
| ICD implantation | 29 (11.7%) | 48 (10.4%) | ns |
| CRT implantation | 21 (8.5%) | 37 (8.1%) | ns |
| Laboratory data | |||
| Hemoglobin (g/dL) | 11.6 ± 2.1 | 12.2 ± 2.2 | p < 0.0001 |
| eGFR (mL/min/1.73 m2) | 35.6 ± 26.4 | 50.0 ± 27.9 | p < 0.0001 |
| Sodium (mmol/L) | 139.0 ± 4.3 | 139.8 ± 3.6 | p = 0.0139 |
| BNP/NTproBNP staging (I/II/III/IV) | 6/11/17/212 | 30/54/78/297 | p < 0.0001 |
| Medication | |||
| ACE-I/ARB | 138 (56.1%) | 274 (59.6%) | ns |
| β-blockers | 226 (91.8%) | 424 (92.3%) | ns |
| Loop diuretics | 185 (75.2%) | 358 (77.9%) | ns |
| Mineralocorticoid receptor antagonist | 71 (28.8%) | 139 (30.2%) | ns |
| Anti-vasopresin agents | 50 (20.3%) | 53 (11.5%) | p = 0.0027 |
| Calcium channel blockers | 55 (22.3%) | 133 (28.9%) | ns |
| Nitrates | 38 (15.4%) | 53 (11.5%) | ns |
| Amiodarone | 97 (39.4%) | 102 (22.2%) | p < 0.0001 |
| Statins | 72 (29.2%) | 195 (42.4%) | p = 0.0005 |
| Cardiac Events Group (n = 246) | Non-Cardiac Events Group (n = 459) | p-Value | |
|---|---|---|---|
| M-mode | |||
| LVDd (mm) | 56.2 ± 11.4 | 55.1 ± 8.9 | ns |
| LVDs (mm) | 47.1 ± 12.4 | 44.6 ± 9.8 | p = 0.0042 |
| LAD (mm) | 44.0 ± 8.0 | 40.8 ± 6.8 | p < 0.0001 |
| Modified Simpson method | |||
| LVEF (%) | 33.0 ± 11.8 | 36.7 ± 9.8 | p = 0.0016 |
| EDV (ml) | 163.4 ± 74.5 | 152.0 ± 54.8 | p = 0.0244 |
| ESV (ml) | 112.3 ± 67.3 | 96.4 ± 48.4 | p = 0.0004 |
| Doppler method | |||
| E wave velocity (m/sec) | 0.87 ± 0.28 | 0.81 ± 0.28 | p = 0.0108 |
| Dct (msec) | 188.6 ± 96.8 | 194.8 ± 76.4 | ns |
| Tissue Doppler method | |||
| Septal E/e′ | 20.2 ± 8.0 | 17.2 ± 6.7 | p < 0.0001 |
| The findings of 12-lead electrocardiogram | |||
| QRS complex duration (msec) | 126 ± 30 | 120 ± 29 | p = 0.0033 |
| LBBB (%) | 15 (6.1%) | 20 (4.3%) | ns |
| RBBB (%) | 28 (11.3%) | 30 (6.5%) | ns |
| Biventricular pacing (%) | 21 (8.5%) | 37 (8.1%) | ns |
| The findings of Rest 99mTc | |||
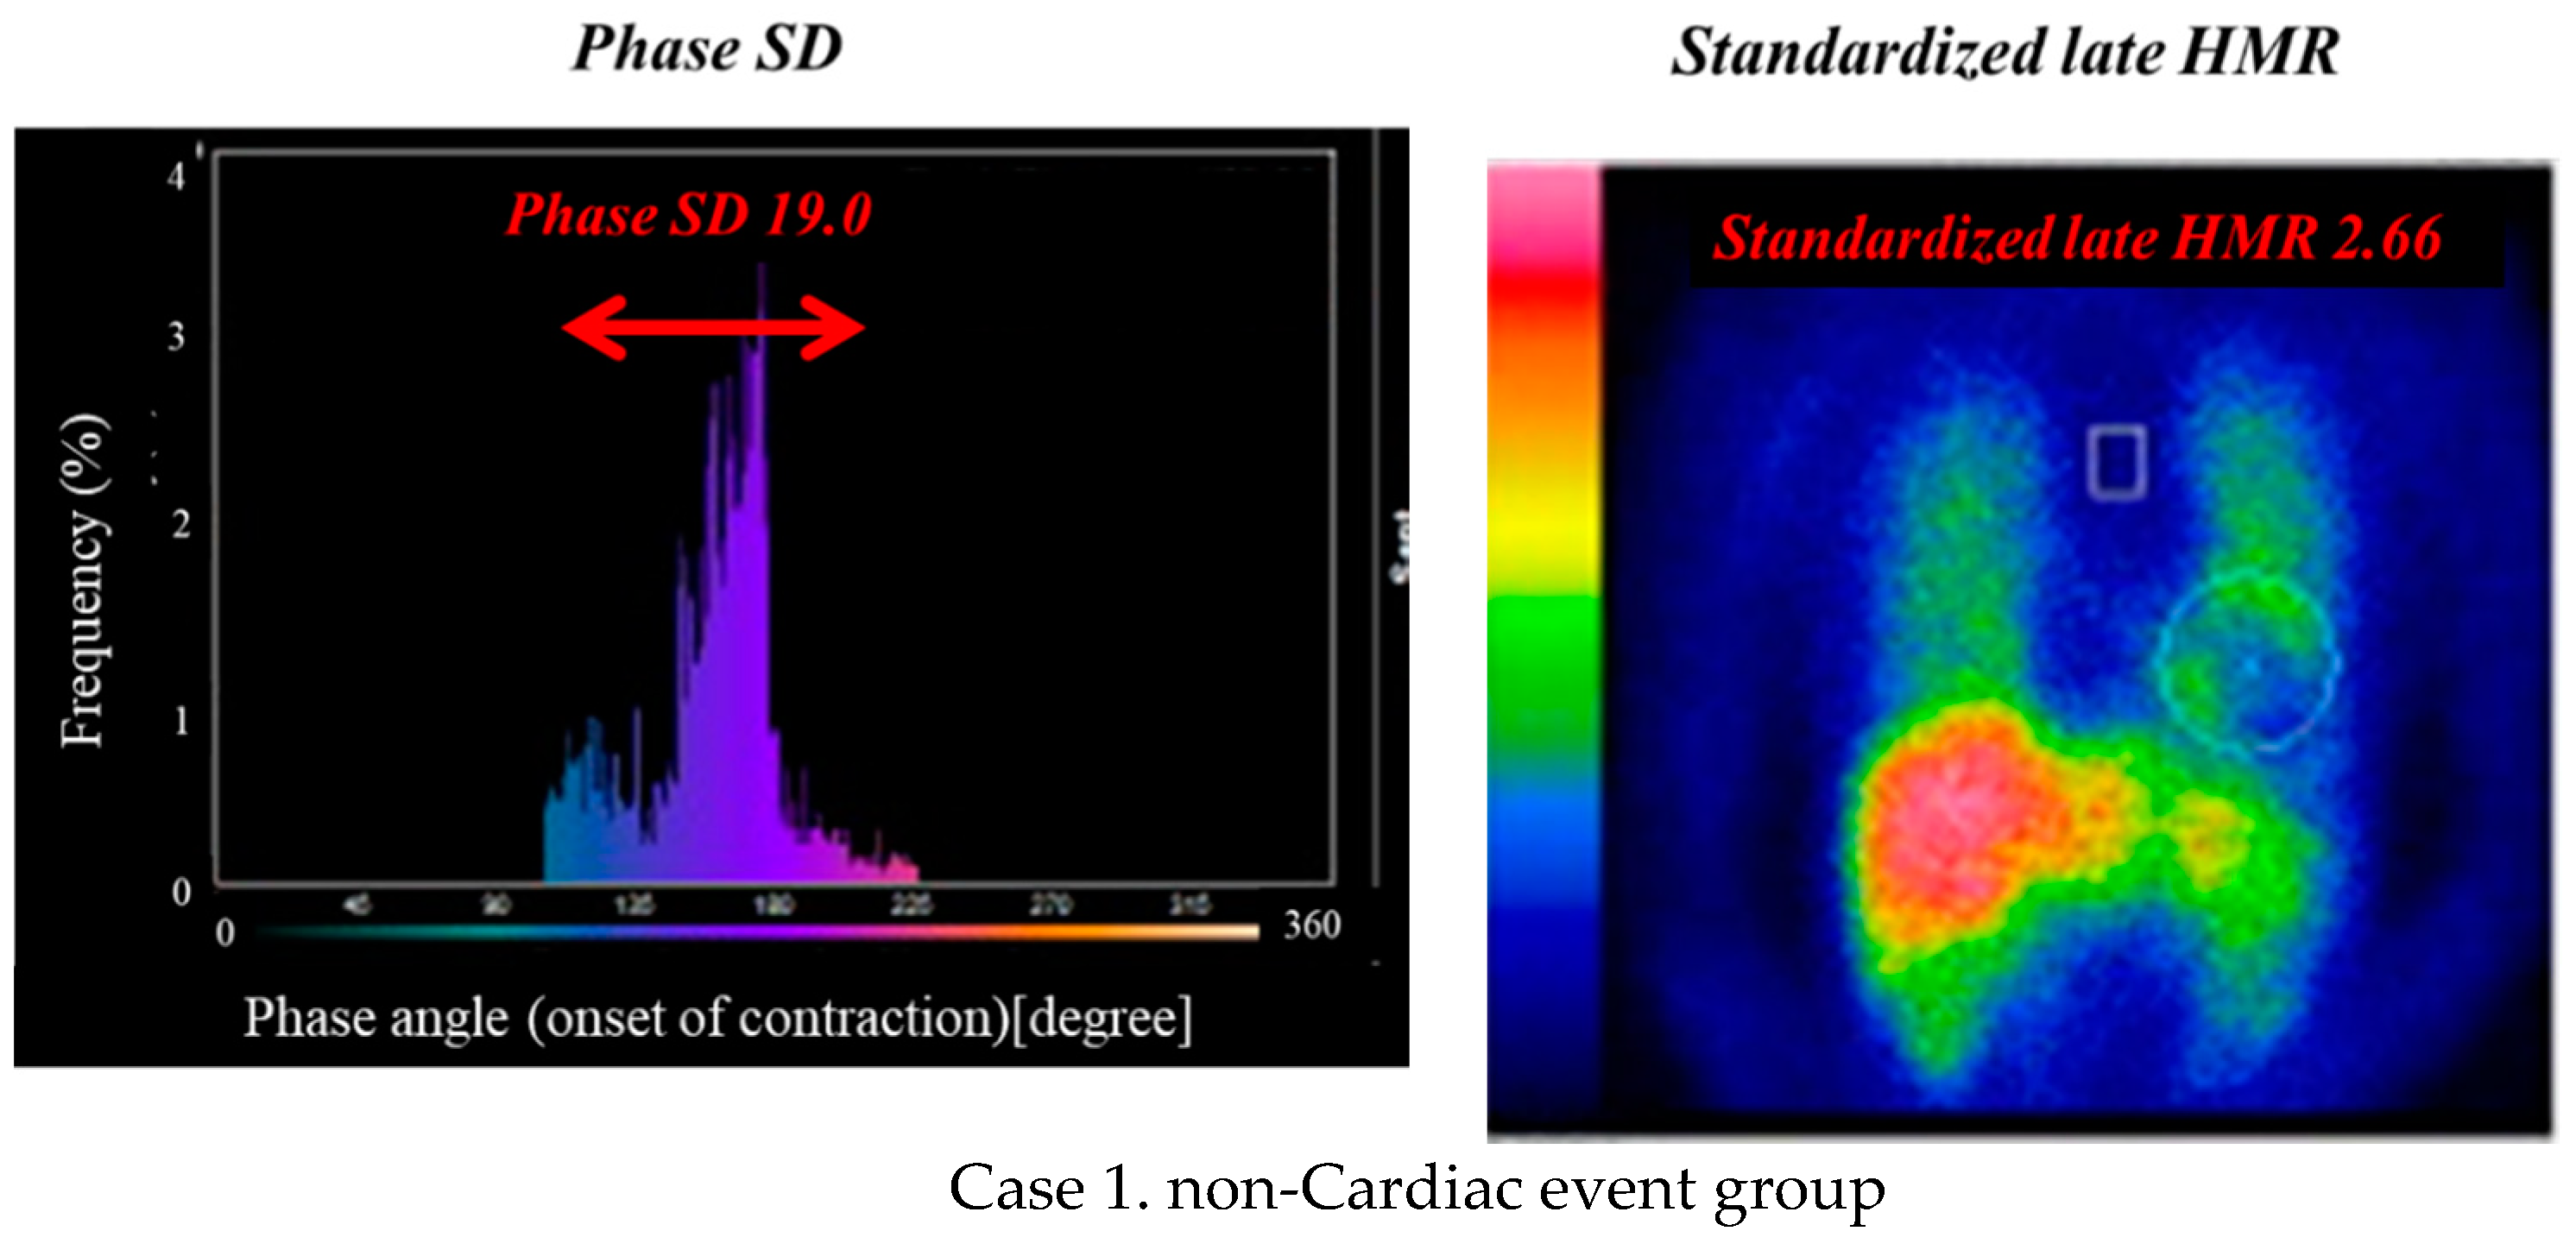
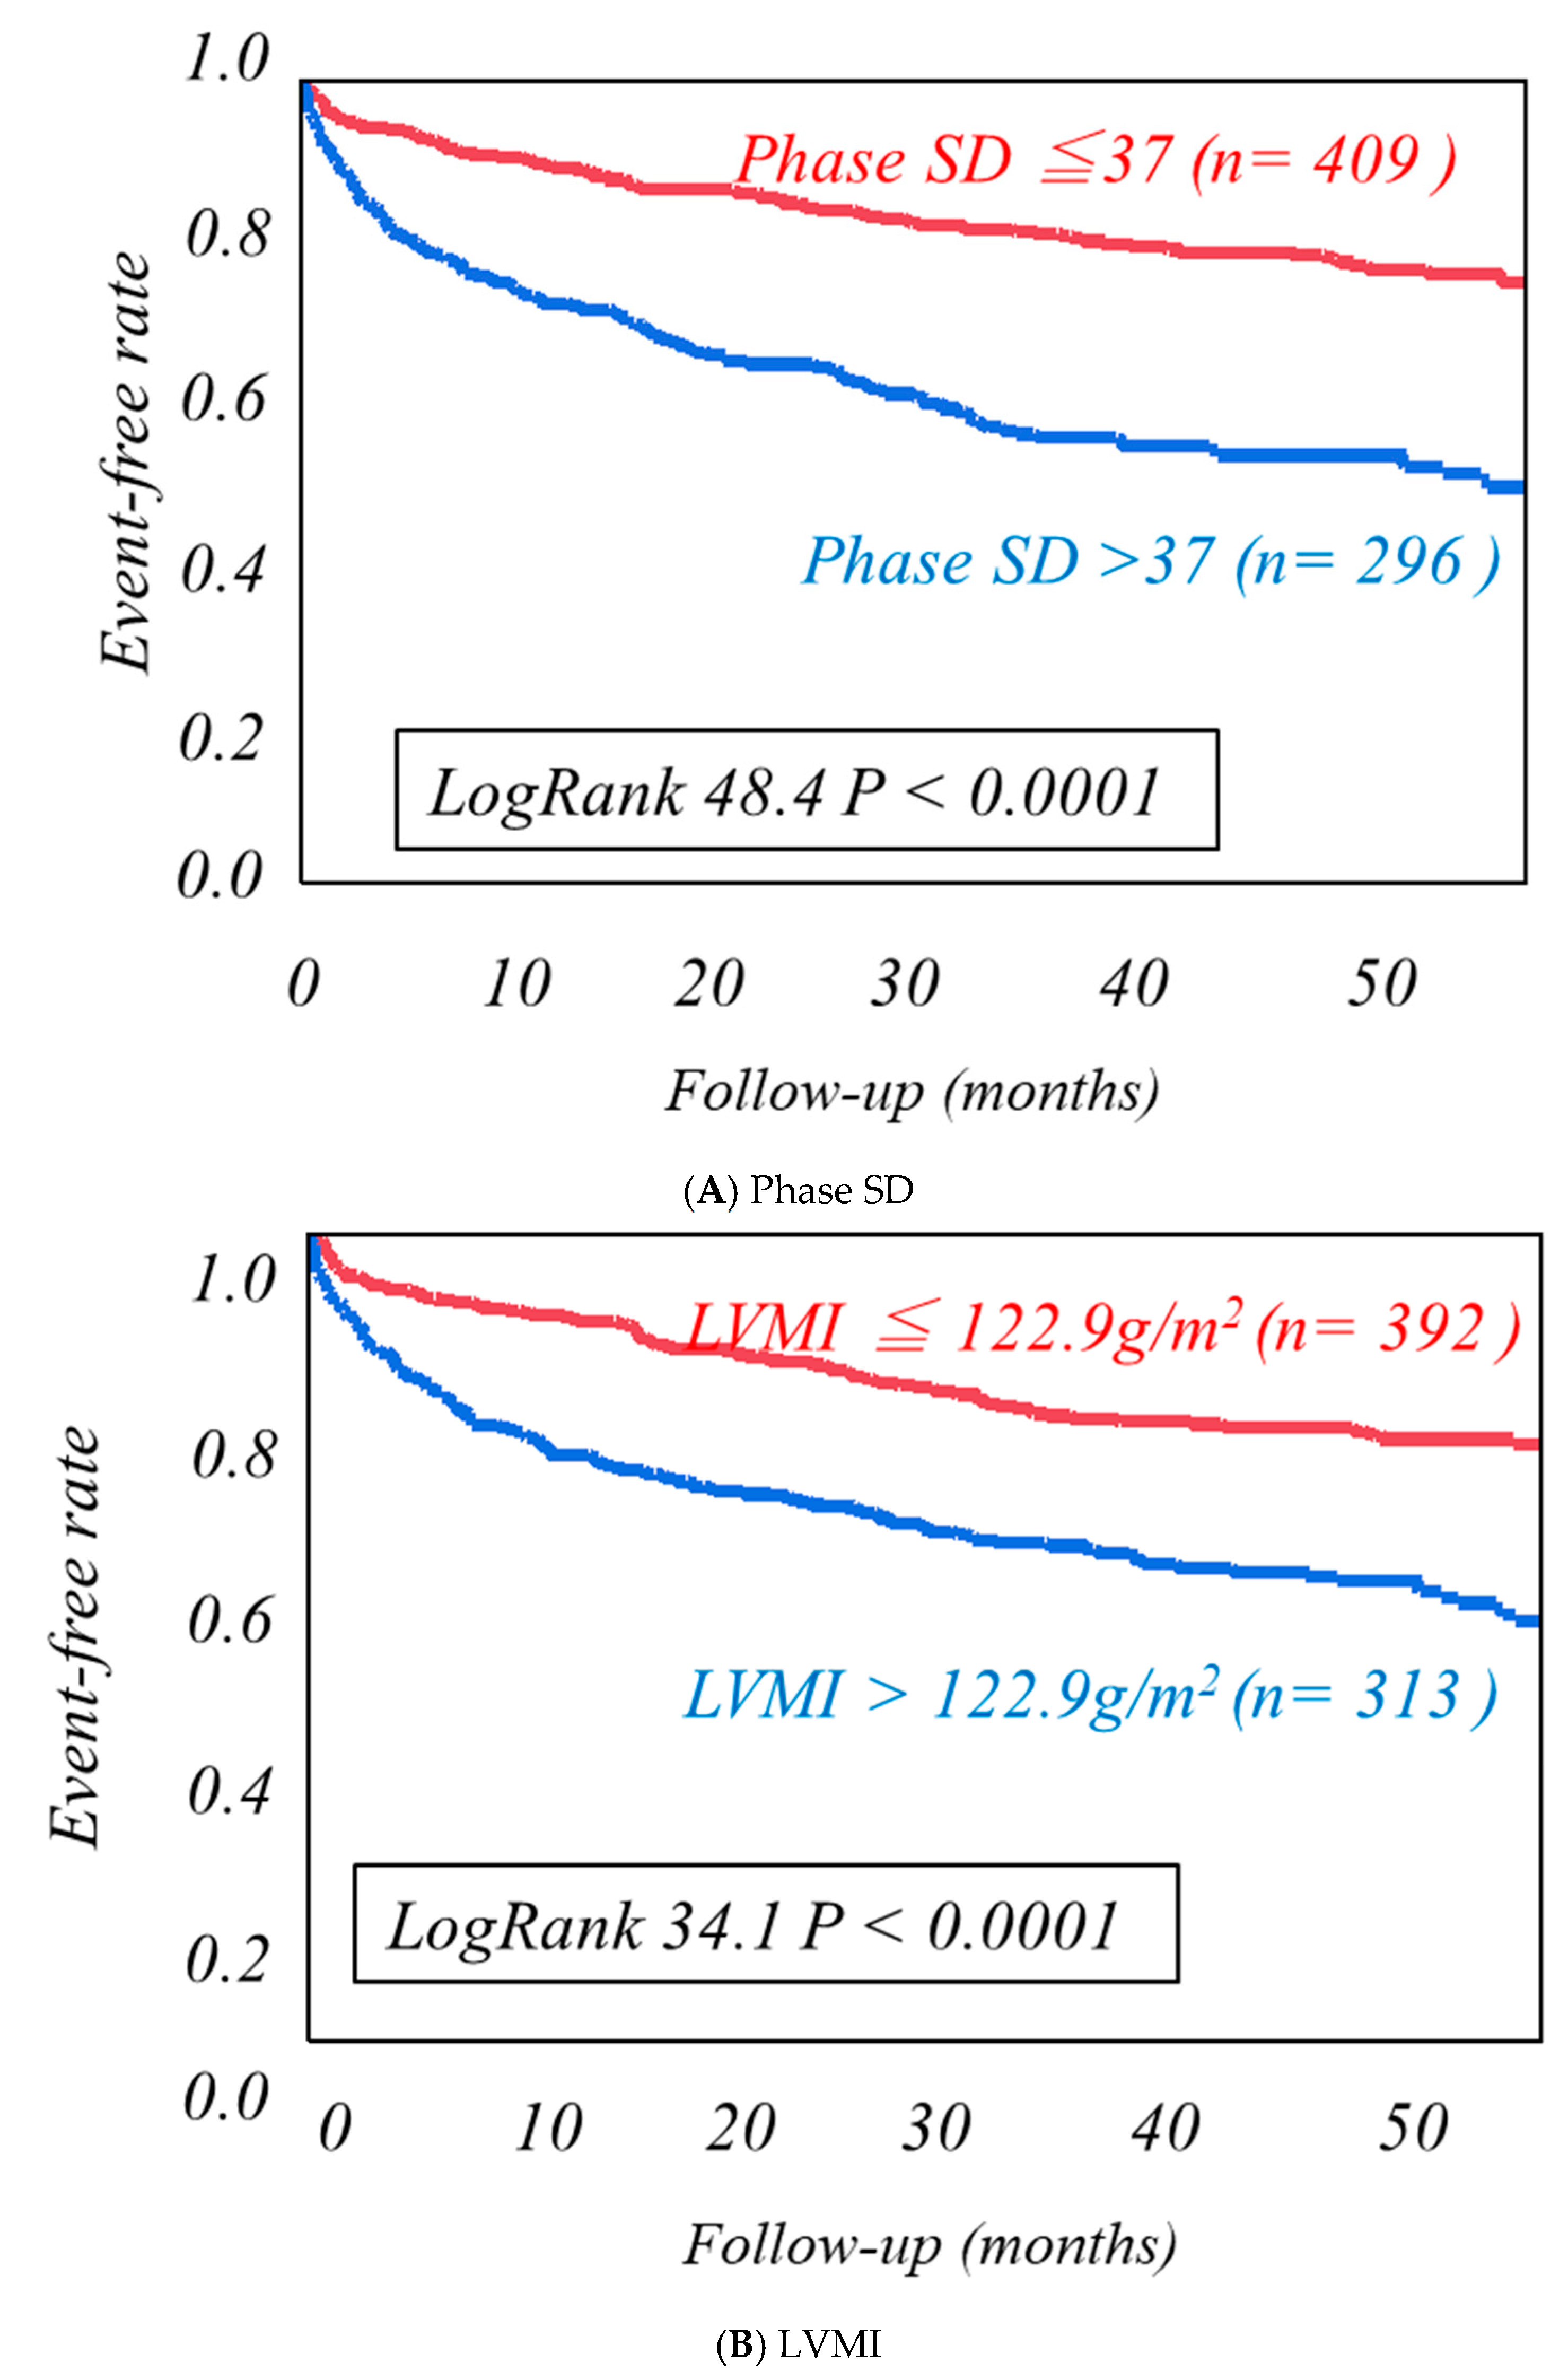
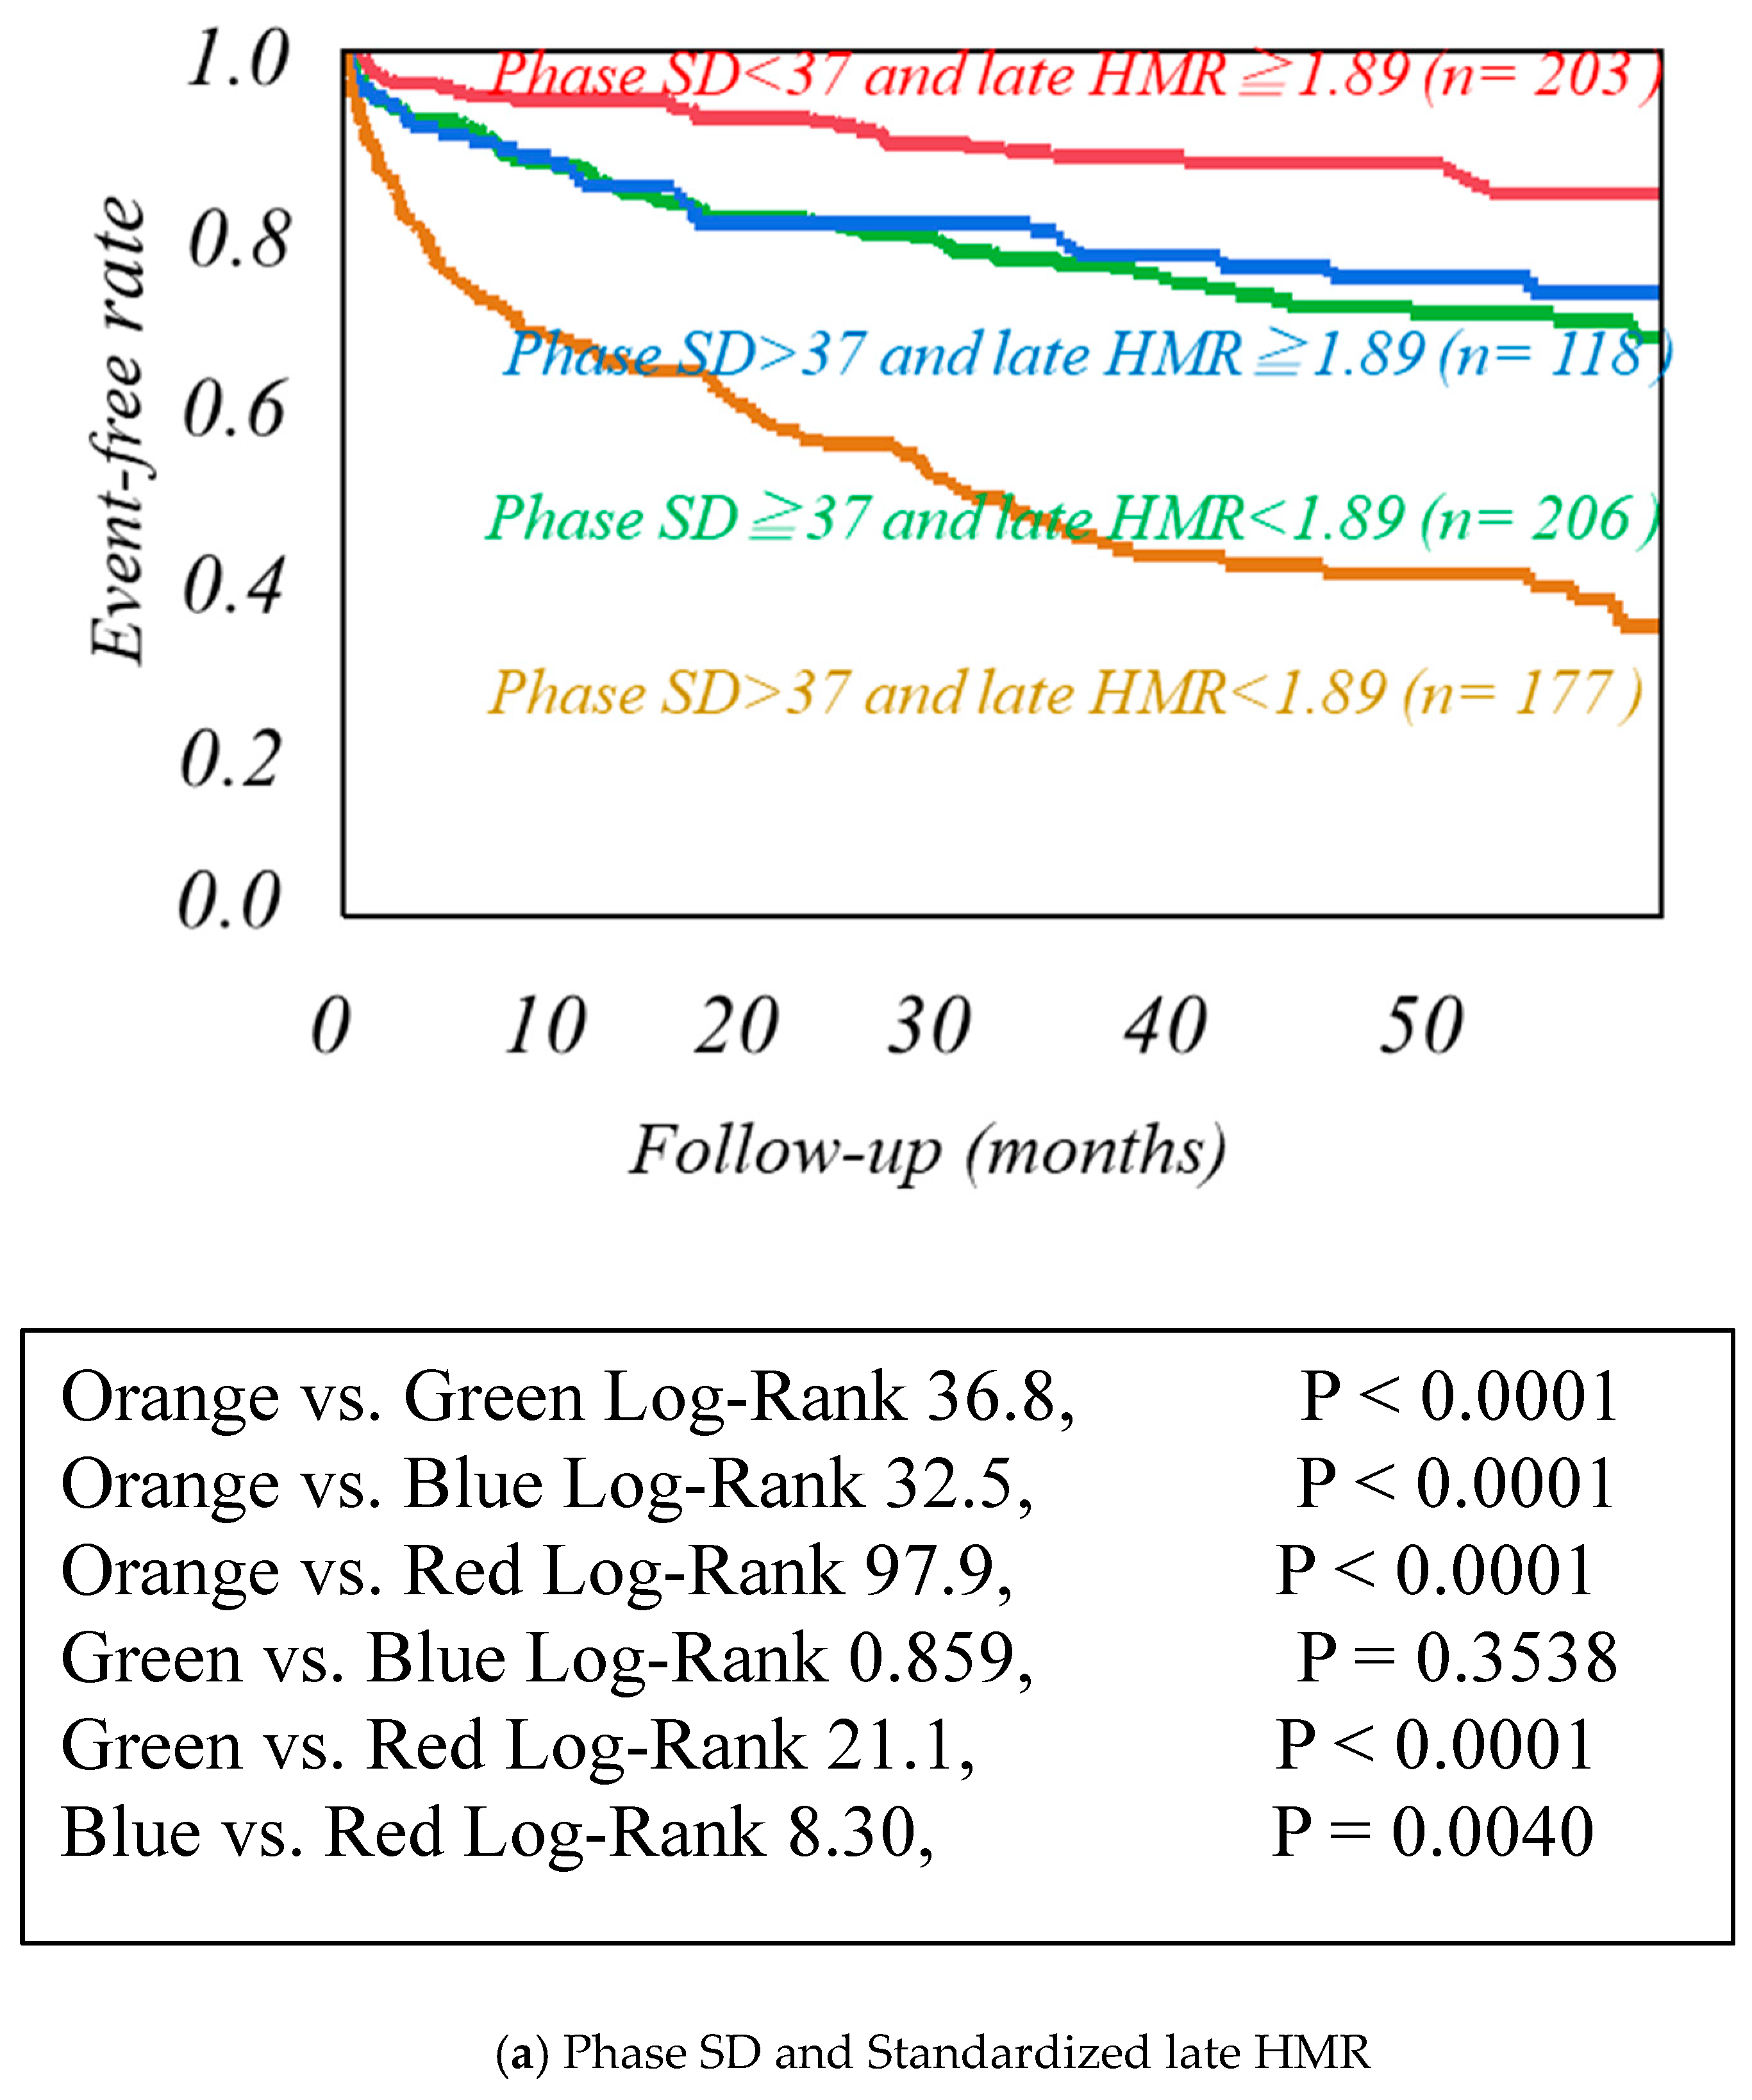
| Phase SD | 37.4 ± 10.8 | 33.1 ± 9.9 | p < 0.0001 |
| Left ventricular weight(g) | 204.6 ± 51.4 | 189.9 ± 42.2 | p < 0.0001 |
| Left ventricular mass index (LVMI)(g/m2) | 129.3 ± 35.7 | 117.9 ± 28.7 | p < 0.0001 |
| The findings of MIBG imaging | |||
| Washout Ratio | 29.3 ± 9.9 | 27.5 ± 9.8 | p = 0.0294 |
| Standardized early HMR | 2.03 ± 0.45 | 2.19 ± 0.44 | p < 0.0001 |
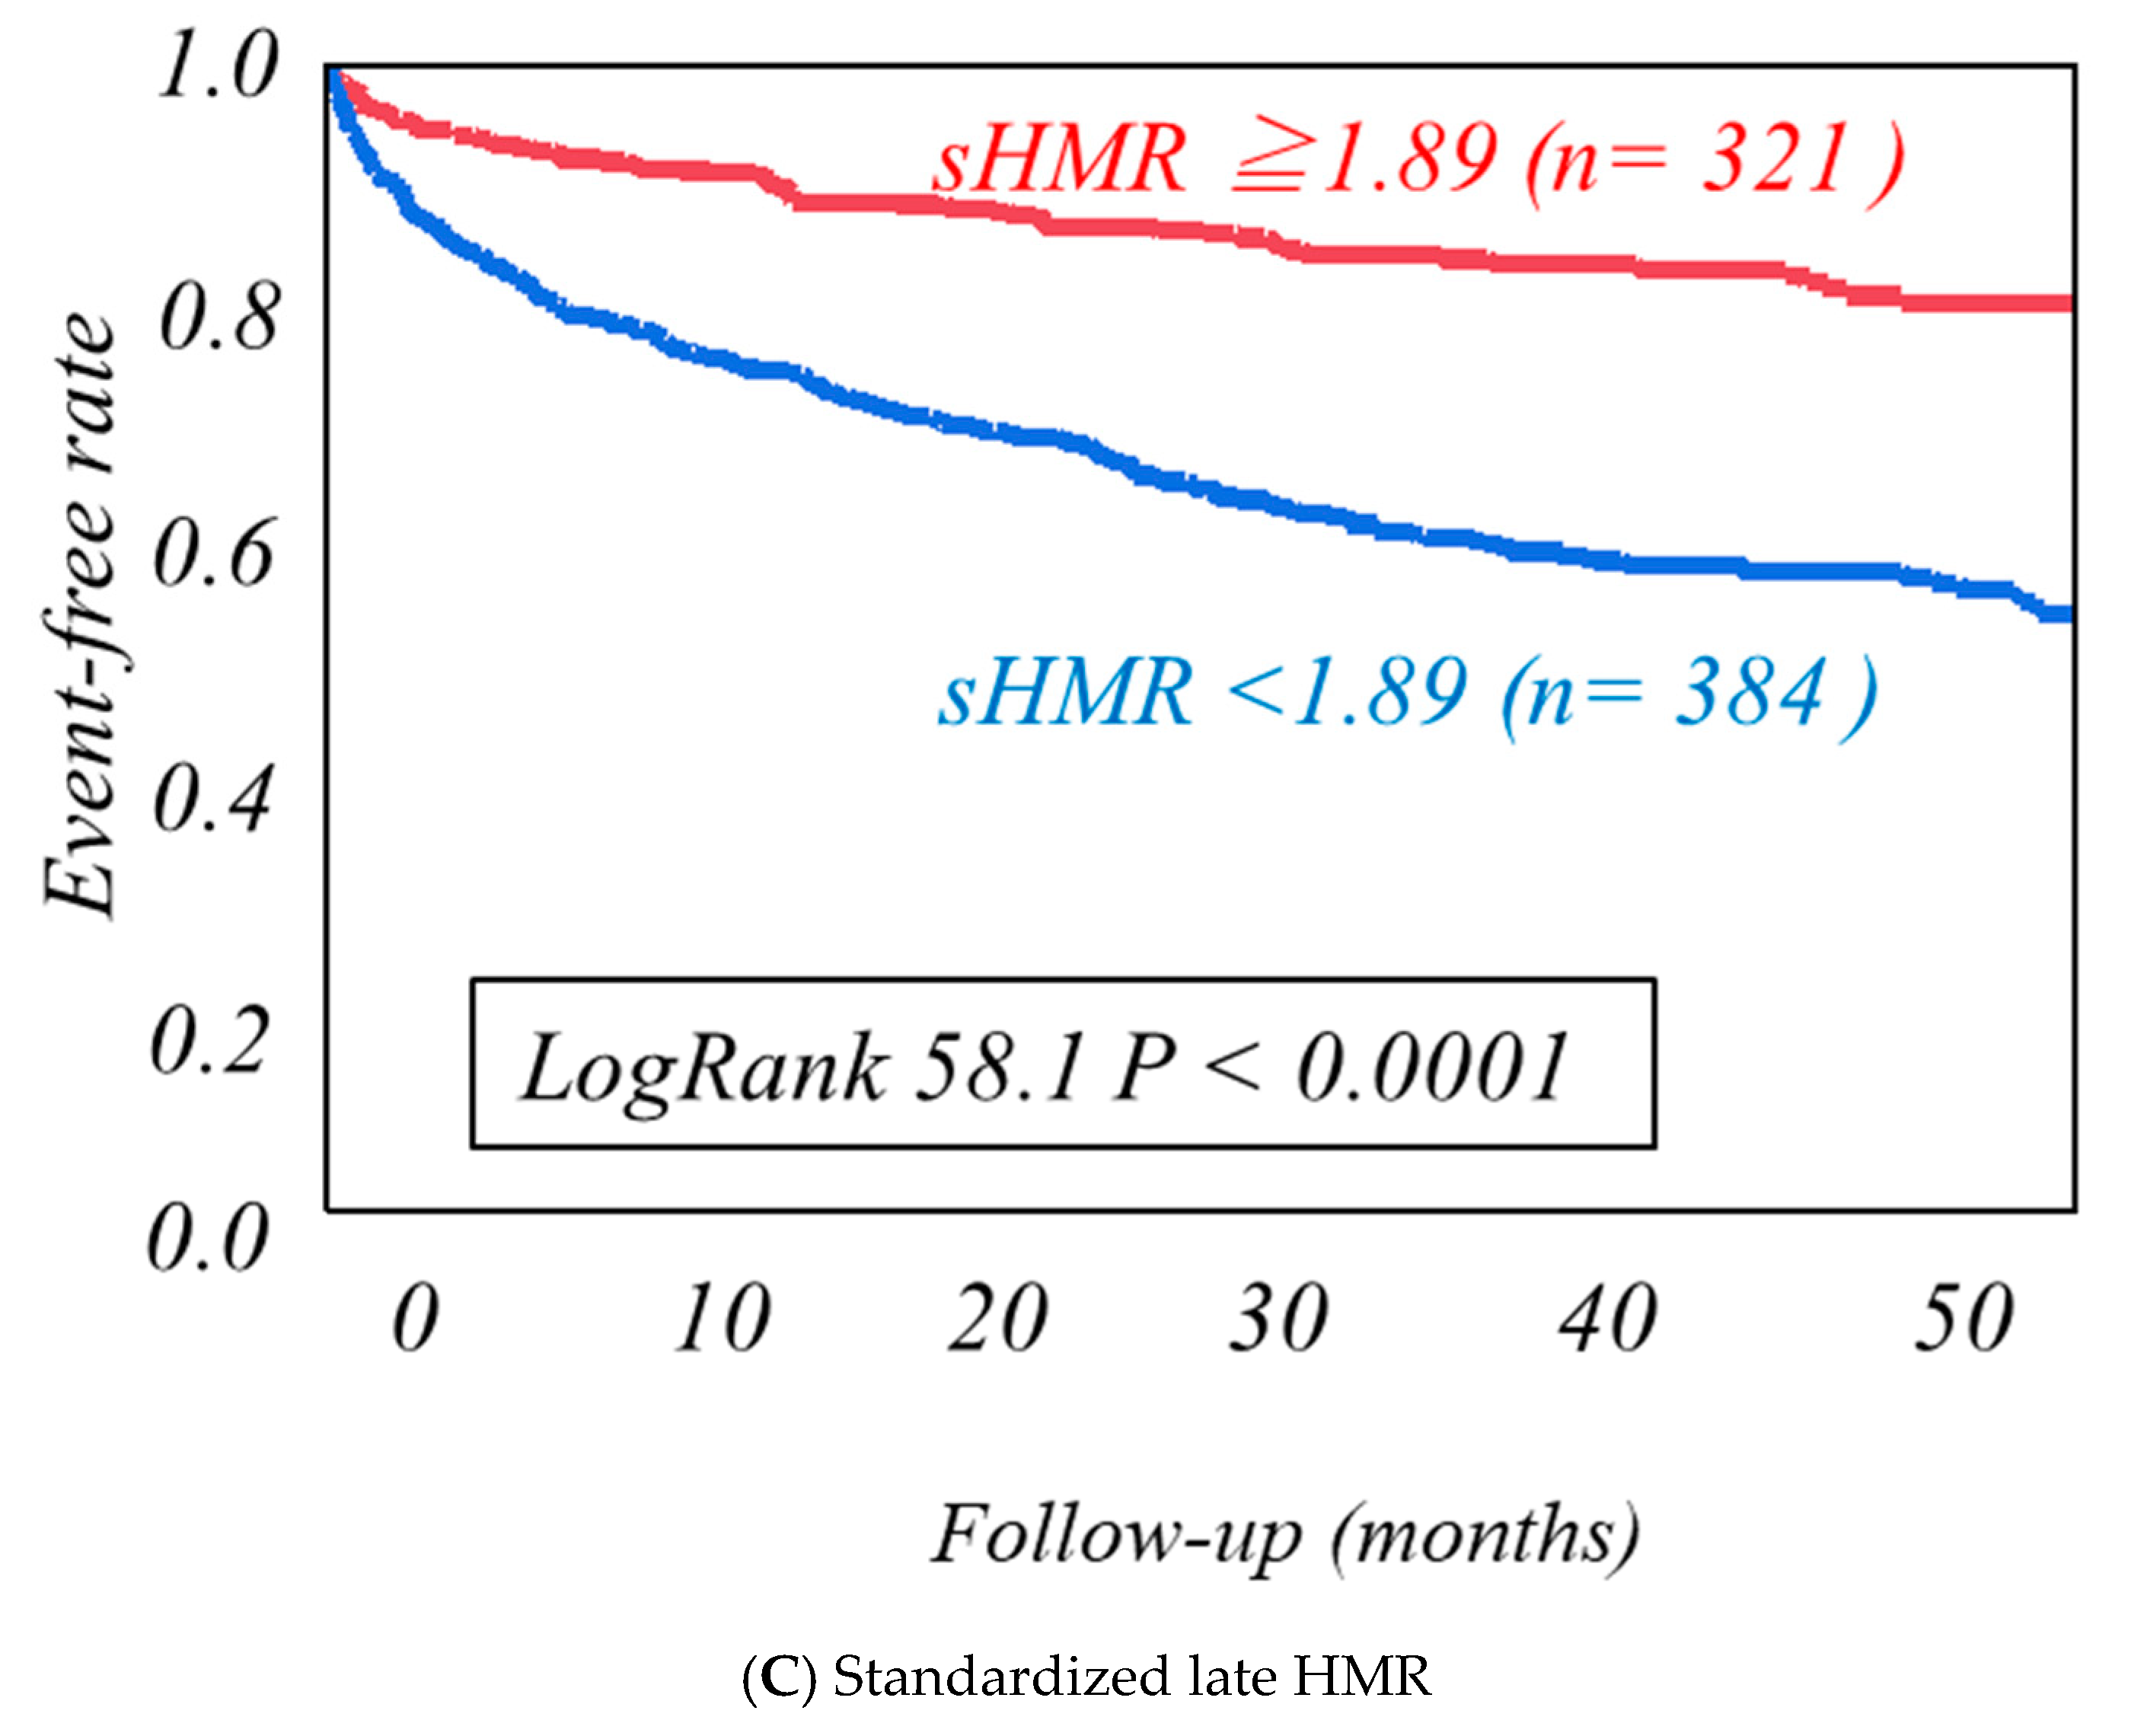
| Standardized late HMR | 1.71 ± 0.39 | 1.99 ± 0.48 | p < 0.0001 |
| Univariate Analysis | |||||
| 95% CI | |||||
| χ2 | Hazard ratio | Lower | Upper | p-value | |
| Age | 35.1 | 1.033 | 1.012 | 1.046 | <0.0001 |
| NYHA functional class | 216 | 2.715 | 2.412 | 3.049 | <0.0001 |
| Hemoglobin | 16.7 | 0.888 | 0.840 | 0.940 | <0.0001 |
| Estimated GFR | 46.2 | 0.983 | 0.979 | 0.988 | 0.0001 |
| BNP/NTproBNP staging | 35.6 | 1.683 | 1.5555 | 2.559 | <0.0001 |
| Amiodarone | 30.8 | 2.130 | 1.648 | 2.751 | <0.0001 |
| Statins | 10.1 | 0.647 | 0.489 | 0.848 | 0.0015 |
| LAD | 33.6 | 1.054 | 1.035 | 1.073 | <0.0001 |
| ESV | 16.9 | 1.004 | 1.002 | 1.006 | <0.0001 |
| Septal E/e’ | 23.4 | 1.041 | 1.025 | 1.056 | <0.0001 |
| Phase SD | 34.6 | 1.036 | 1.024 | 1.048 | <0.0001 |
| LVMI | 25.6 | 1.010 | 1.006 | 1.014 | <0.0001 |
| Standardized late HMR | 58.1 | 0.324 | 1.023 | 1.048 | <0.0001 |
| Multivariate Cox Proportional-Hazards Model Analysis | |||||
| 95% CI | |||||
| χ2 | Hazard ratio | Lower | Upper | p-value | |
| Age | 4.83 | 1.013 | 1.001 | 1.026 | 0.0280 |
| NYHA functional class | 89.1 | 2.104 | 1.817 | 2.428 | <0.0001 |
| Hemoglobin | 1.88 | 0.954 | 0.893 | 1.019 | 0.1694 |
| Estimated GFR | 33.5 | 0.984 | 0.978 | 0.989 | <0.0001 |
| BNP/NTproBNP staging | 14.5 | 1.334 | 1.110 | 1.824 | <0.0001 |
| Amiodarone | 13.2 | 1.587 | 1.278 | 2.218 | 0.0002 |
| Statins | |||||
| LAD | 4.59 | 1.020 | 1.001 | 1.040 | 0.0320 |
| ESV | 7.72 | 1.003 | 1.001 | 1.006 | 0.0054 |
| Septal E/e’ | 2.29 | 1.001 | 0.995 | 1.030 | 0.1354 |
| Phase SD | 42.5 | 1.039 | 1.003 | 1.054 | <0.0001 |
| LVMI | 9.37 | 1.006 | 1.002 | 1.010 | 0.0018 |
| Standardized late HMR | 36.9 | 0.397 | 0.291 | 0.539 | <0.0001 |
Publisher’s Note: MDPI stays neutral with regard to jurisdictional claims in published maps and institutional affiliations. |
© 2021 by the authors. Licensee MDPI, Basel, Switzerland. This article is an open access article distributed under the terms and conditions of the Creative Commons Attribution (CC BY) license (https://creativecommons.org/licenses/by/4.0/).
Share and Cite
Doi, T.; Nakata, T.; Noto, T.; Mita, T.; Nagahara, D.; Yuda, S.; Hashimoto, A. Impaired Cardiac Sympathetic Innervation Increases the Risk of Cardiac Events in Heart Failure Patients with Left Ventricular Hypertrophy and Mechanical Dyssynchrony. J. Clin. Med. 2021, 10, 5047. https://doi.org/10.3390/jcm10215047
Doi T, Nakata T, Noto T, Mita T, Nagahara D, Yuda S, Hashimoto A. Impaired Cardiac Sympathetic Innervation Increases the Risk of Cardiac Events in Heart Failure Patients with Left Ventricular Hypertrophy and Mechanical Dyssynchrony. Journal of Clinical Medicine. 2021; 10(21):5047. https://doi.org/10.3390/jcm10215047
Chicago/Turabian StyleDoi, Takahiro, Tomoaki Nakata, Takahiro Noto, Tomohiro Mita, Daigo Nagahara, Satoshi Yuda, and Akiyoshi Hashimoto. 2021. "Impaired Cardiac Sympathetic Innervation Increases the Risk of Cardiac Events in Heart Failure Patients with Left Ventricular Hypertrophy and Mechanical Dyssynchrony" Journal of Clinical Medicine 10, no. 21: 5047. https://doi.org/10.3390/jcm10215047