Article

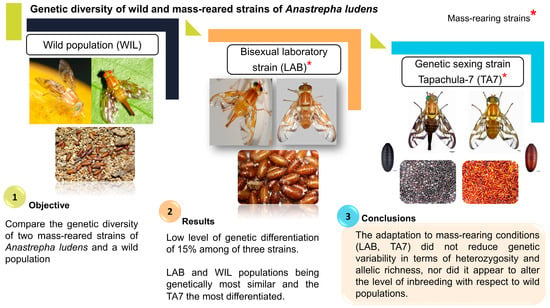
Mass-Rearing Conditions Do Not Always Reduce Genetic Diversity: The Case of the Mexican Fruit Fly, Anastrepha ludens (Diptera: Tephritidae)

by
Lorena Ruiz-Montoya
1,*,
Mayren Sánchez-Rosario
2,
Emiliano López-Gómez
3,
Maricela Garcia-Bautista
1,
Anahí Canedo-Texón
1,*,
David Haymer
4 and
Pablo Liedo
2
1
El Colegio de la Frontera Sur (ECOSUR), Carretera Panamericana y Periférico Sur, Barrio María Auxiliadora, San Cristóbal de las Casas 29290, Chiapas, Mexico
2
El Colegio de la Frontera Sur (ECOSUR), Carretera Antiguo Aeropuerto, Tapachula 30700, Chiapas, Mexico
3
Instituto de Biociencias, Universidad Autónoma de Chiapas, Boulevard Príncipe Akishino Sin Número Colonia Solidaridad 2000, Tapachula 30798, Chiapas, Mexico
4
Department of Cell and Molecular Biology, University of Hawaii, 1960 East-West Rd, Biomed T511, Honolulu, HI 96822, USA
*
Authors to whom correspondence should be addressed.
Insects 2024, 15(1), 56; https://doi.org/10.3390/insects15010056
Submission received: 20 November 2023 / Revised: 21 December 2023 / Accepted: 11 January 2024 / Published: 12 January 2024
(This article belongs to the Special Issue Genetics and Ecological Evolution of Dipteran Pest Species)

Abstract

:

Simple Summary

It is generally accepted that the process of insect mass-rearing, used to apply the sterile insect technique, promotes adaptation to the captive environment and a reduction in the genetic diversity of the population. Here, we compare the genetic diversity of two mass-reared strains of the Mexican fruit fly (Anastrepha ludens) and a wild population, using nuclear DNA. In this study, we found similar values of heterozygosity, allelic richness, and level of inbreeding among strains. These results indicate that mass-rearing conditions do not always reduce genetic diversity. Our findings contribute to understanding the genetic make-up resulting from adaptation to mass-rearing conditions.

Abstract

The application of the sterile insect technique (SIT) requires the adaptation of insects to mass-rearing conditions. It is generally accepted that this adaptation may include a reduction in genetic diversity and an associated loss of desirable characteristics for the effective performance of sterile insects in the field. Here, we compare the genetic diversity of two mass-reared strains of the Mexican fruit fly, Anastrepha ludens, and a wild (WIL) population collected near Tapachula, Mexico, using seven DNA microsatellites as molecular genetic markers. The mass-reared strains were a bisexual laboratory strain (LAB) with approximately 130 generations under mass-rearing and a genetic sexing strain, Tapachula-7 (TA7), also under mass-rearing for 100 generations. Our results revealed an overall low level of genetic differentiation (approximately 15%) among the three strains, with the LAB and WIL populations being genetically most similar and TA7 most genetically differentiated. Although there were some differences in allele frequencies between strains, our results show that overall, the adaptation to mass-rearing conditions did not reduce genetic variability compared to the wild sample in terms of heterozygosity or allelic richness, nor did it appear to alter the level of inbreeding with respect to the wild populations. These results are contrary to the general idea that mass-rearing always results in a reduction in genetic diversity. Overall, our findings can contribute to a better understanding of the impact that adaptation to mass-rearing conditions may have on the genetic make-up of strains.

Graphical Abstract

1. Introduction

The Mexican fruit fly, Anastrepha ludens (Loew) (Diptera: Tephritidae), is one of the most important agricultural pests in Mexico and Central America, particularly in fruit species of economic interest such as mango (Mangifera indica L.) and Citrus spp. fruits [1,2,3]. In 1992, the Mexican federal government established the National Campaign of Fruit Flies, and since then, the application of the sterile insect technique (SIT) has been a component of the integrated pest management strategy [4,5]. The SIT consists of the mass-rearing, sterilization, and release of millions of insects of the target pest species with the aim that sterile males will mate with wild females to induce sterility and thereby suppress the population of the pest species [6].
Two strains of A. ludens are mass-reared for release and control of this insect fruit pest [7]. Initial releases for the A. ludens SIT program consisted of both sterile males and females (from the “laboratory” strain). However, since the success of SIT depends on mating success of the sterile males, ideally, this technology will only employ the release of males as the release of sterile females is unnecessary and represents an additional cost for operational programs [8,9,10]. Accordingly, male-only releases have clearly been shown to have greater efficacy in inducing sterility in wild populations [11,12,13]. Consequently, genetic sexing strains (GSSs) have been developed where it is possible to separate the sexes at critical stages in the mass-rearing process, facilitating the release of only sterilized males [14,15].
The A. ludens (TA7) GSS uses alleles of a pupal color gene to distinguish males and females during the rearing process. Here, in males, the wild-type allele leading to brown pupae has been linked to the Y chromosome by a translocation. Females are homozygous for a mutant allele producing black-colored pupae, and this allows for the sexes to be sorted based on pupal color phenotype. However, as is true for genetic sexing strains from other species, the chromosomal rearrangements of the Tapachula-7 GSS are often unstable, and breakdown must be avoided to maintain the pupal color difference to separate the sexes [15,16]. For this, a “mother” colony is maintained to provide replacements via a filter rearing system, as described in [17].
Besides the use of such chromosomal rearrangements, the mass-rearing processes themselves are known to generate selection pressures (intentional and unintentional) with possible adverse effects on desirable traits, such as success in sexual competitiveness, as a byproduct of adaptation to the laboratory environment [18,19,20,21,22]. Because of this, understanding the genetic changes occurring during the mass-rearing processes can be very useful to improve colony management of strains used for SIT [23]. Hence, it is relevant to quantify the level of genetic changes associated with adaptation to a laboratory-based, constant mass-rearing environment with standardized temperature, relative humidity and a consistent light/dark photoperiod along with a high density of captive flies, to assess how much genetic diversity is lost relative to wild populations along with the degree of inbreeding promoted in captive and/or mass-reared populations.
In addition, under mass-rearing conditions such as those used for the Tapachula-7 strain (see Orozco-Davila et al. [7]), there may be greater possibilities for inbreeding and genetic drift to play important roles compared to wild populations, where selection and gene flow can be the main determining processes impacting the levels of genetic diversity [24,25]. For example, Bush et al. (1976) [26] demonstrated changes in the frequencies of two alleles of the enzyme alpha-glycerol phosphatase dehydrogenase (a-GDH) gene during colonization and mass-rearing of the screwworm Cochliomya hominivorax. They observed fixation (in the oldest lines), which they described as a direct result of the selection for an allelic form that works well under a mass-rearing environment. Loukas et al. (1985) [27] observed profound changes in the frequencies of two enzyme loci during the first six generations of a laboratory colony of Bactrocera [Dacus] oleae (Gmelin) (olive fruit fly) as a result of adaptation to laboratory conditions. Using nine microsatellite loci, Gilchrist et al. (2012) [20] found similar patterns in a strain of Bactrocera tryoni during the first ten generations of adaptation to mass-rearing conditions. In addition, a study by Simões et al. (2008) [28] clearly documented that genetic drift was a major force responsible for the loss of genetic variation in the adaptation of Drosophila subobscura collections to the laboratory environment. Many other examples have shown how colonization and adaptations to laboratory-based mass-rearing conditions have impacted genetic differentiation between domesticated and wild populations specifically for Tephritid fruit flies [20,22,27,29,30,31].
Given all of this, it is reasonable to expect that during adaptation of A. ludens to mass-rearing conditions for SIT application, a similar loss in genetic diversity may occur. In that context, our objective here was to compare the genetic makeup of two populations of mass-reared A. ludens to each other and to a wild population (WIL) without any management. For this, we used two mass-reared strains (LAB and TA7) that are maintained under different colony management strategies and a third strain of wild origin. Our expectation was that the WIL population would have greater genetic diversity than either the mass-reared LAB or TA7 strain. Our results, however, were contrary to our expectations. Here, the mass-rearing conditions appear not to have reduced the level of genetic variability compared to the wild population. We discuss the implications of this result for future management of mass-reared colonies.

2. Materials and Methods

2.1. Strains

Anastrepha ludens flies from three different populations were used. Flies used to establish the wild strain (WIL) were obtained as larvae from infested fruit collections of sour oranges (Citrus aurantium) from backyard trees scattered over an area of approximately 3 km2 within the surroundings of Tapachula, Chiapas, Mexico. The infested fruits were taken to the laboratory where they remained until completion of larval development. The third instar were placed in containers with vermiculite at 60% humidity to induce pupation and subsequently the emergence of adult flies.
The mass-reared bisexual laboratory strain (LAB) and the genetic sexing strain (TA7) were provided by the Planta de Cría y Esterilización de Moscas de la Fruta (Moscafrut) facility (Metapa de Domínguez, Chiapas, Mexico). Individuals from both populations were obtained at the pupal stage 48 h before adult emergence. The pupae of each strain were placed in 30 × 30 × 30 cm cages with water and a standard diet of sugar and yeast hydrolysate (MP Biomedicals, Irvine, CA, USA) in a 3:1 ratio.
The LAB strain was started approximately 13 years ago (approximately 130 generations) with individuals collected in six states of Mexico using a relatively small number of flies as founders of a new colony to replace the old colony reared at that time at the Moscafrut facility in Metapa, Chiapas. This newly established colony was refreshed only one time 9 years ago (approximately 90 generations) with approximately 4000 pupae collected in Chiapas [32]. The TA7 strain was created from a black pupal mutant seen in the LAB strain after screening approximately 7.7 million pupae. After crossing with lab-bred males, offspring were irradiated to generate chromosomal translocations linking the wild-type allele to the Y chromosome [15]. By the time of this work, the TA7 strain had approximately 100 generations under mass-rearing conditions. Approximately once a year, the TA7 strain has been subjected to further selection through the use of the “filter rearing” system [17,33] developed to eliminate translocation breakdown products that might otherwise threaten the use of this strain for genetic sexing.
For the molecular analysis, from each strain (LAB, TA7, and WIL), 30 adults (15 males and 15 females) at 15 d old were randomly collected and preserved individually in 1.5 mL vials with 95% ethanol. These were transferred to the genetics laboratory for further analysis.

2.2. Extraction and Amplification of Nuclear DNA

DNA extraction was performed using the 2× CTAB method [34], with some modifications. Fly heads were macerated in 1.5 mL microtubes containing 500 µL of 2× CTAB buffer. These were incubated in a water bath at 60 °C for 1 h. For DNA purification, chloroform-octanol (24:1) and isopropanol were used for precipitation. The visualization of DNA we extracted was performed using 1% agarose gel electrophoresis in 1× TAE buffer. Aliquots of 3 µL of DNA and 1.5 µL of 6× blue (loading stain) were taken and loaded into horizontal chambers. After running with a constant voltage of 90 V, the gel images were documented with a Kodak EDAS 290® camera connected by an interface to a computer and stored using Id Imagen Analysis software. The analysis of diversity and genetic differentiation of A. ludens populations was carried out using microsatellites developed originally for A. suspensa [35]. Nine microsatellites (or VTR, SSR) were tested: Asus 1-H1, Asus1-2B, Asus1-2F, Asus1-3C, Asus 1-4H, Asus1-5E, Asus1-6C, Asus1-8D, and Asus1-9A (Table 1), of which only seven produced recognizable DNA fragments in A. ludens with the QIAxcel Advanced capillary electrophoresis system. Table 1 shows the primers used and the size ranges of products recovered at each locus.
Amplification was carried out using a T100™ Thermal Cycler BIO-RAD gradient thermocycler. PCR conditions were 94 °C for 3 min, followed by 32 cycles of 1 min at 94 °C and 30 s for primer annealing followed by 1 min at 72 °C. A final 10 min for extension at 72 °C was also added. The PCR products were visualized on 2% agarose gels. A 100 base pair (bp) molecular weight marker (ladder) was used.
The size of the amplified products was determined using the QIAXcel Advanced system for automated capillary electrophoresis, using the QIAXcel DNA High Resolution Gel Cartridge and the QIAXcel ScreenGel software version 1.6.0 (QIAGEN brand), with the QX Size Marker 25–500 bp as a reference. A total volume of 10 μL (5 μL of PCR product and 5 μL of loading buffer) was used.
Genotyping was carried out by reviewing the results obtained from the analysis of the capillary electrophoresis. This consisted of locating the peaks close to the approximate size of the product in base pairs, as reported in the literature. Positive and negative controls were used to avoid genotyping errors. For comparisons between samples, fragment sizes determined in QIAxcel were normalized and standardized using posterior analyses in the program Allelogram v. 2.2, as previously described [36].

2.3. Data Analyses

The genetic diversity of each sample was determined using conventional parameters including the number of alleles (Na), number of effective alleles (Ne), observed heterozygosity (Ho), unbiased expected heterozygosity (uHe), and fixation index (F) for each locus and averaged across loci. The extent of polymorphism was calculated by strain. We obtained all these parameters in GenAlEx 6.4 [37]. We tested for allelic frequency heterogeneity among strains through G-test heterogeneity (G) [38]. Significance differences among strains in terms of Ho and uHe were tested through ANOVA, where the Ho and uHe values were transformed by arcsen(H)1/2. Biases of average F values from zero were also tested by χ2 = F2N(k − 1), with k(k − 1) degrees of freedom [39], and we used GenAlEx 6.4 software to test for the Hardy–Weinberg equilibrium (HWE) per locus per strain.
Assessments of levels of genetic differentiation between strains were obtained from AMOVA results as well as PCA and UPGMA using GenAlEx 6.4 software [37]. The AMOVA was carried out in a hierarchical manner considering values within as well as between pairs of loci. In each case, we used 999 permutations. The θST probability as p (random ≥ data) was determined based on standard permutations across the full dataset [37].
A Bayesian model was implemented in the software DIYABC v2.0 [40]. This program uses massive simulation to estimate genetic parameters. Using the DIYABC program, we tested two scenarios: (1) major differentiation between the LAB and WILD samples, and (2) between the LAB and TA7 samples. The posterior probabilities of different models were determined from the similarity between the observed dataset and the large number of simulations [41]. This allows for the estimation of genetic parameters including the mean number of alleles and the extent of differentiation as reflected in the Fst values [40]. For the simulations, we used the simplest Generalized Stepwise Mutation model [42] for all microsatellite loci and constant effective size populations for all cases. Results were obtained using 100,000 iterations.

3. Results

A total of 90 individuals from each of the three strains were genetically analyzed using seven microsatellites (Table S1). We found 46 alleles in total, and the allele frequencies per locus were not homogenous across the strains (Figure 1). The G-test identified significant heterogeneity for three loci (ASUS1-2F, ASUS1-4H, ASUS1-8D). Eleven private alleles were observed in the LAB strain at six loci. These comprised five private alleles at two loci in the TA7 strain along with six private alleles at five loci in the WIL strain (shown in Figure 1).
We found 100% of the loci to be polymorphic in both LAB and TA7 strains, while in the WIL strain, 85.71% were polymorphic. The highest mean number of alleles (Na) was found in the LAB (4.429 ± 0.429) strain, followed by the WIL (4.143 ± 0.829) strain and finally the TA7 (3.857 ± 0.738) strain (Figure 2A). For the number of effective alleles (Ne), the highest average value was observed in TA7 (2.23 ± 0.328), followed by the WIL (2.04 ± 0.289) and LAB (1.91 ± 0.241) strains (Figure 2A).
The average values of observed heterozygosity were 0.216, 0.271, and 0.238 for the LAB, TA7, and WIL strains, respectively. These values were 2× lower than expected for heterozygosity under EHW (Figure 2B). The ANOVA did not detect significant differences in Ho or uHe among populations. We found average F values above 0.40 for the populations, all of which were significantly different from zero (Figure 2B). All loci, with the exception of the ASUS1-6C locus in the LAB and TA7 strains, were shown to not be in Hardy–Weinberg equilibrium (Table 2).
According to the AMOVA, based on genetic Nei distances (Table 3), 85% of the genetic variation was within the strains compared to 15% among strains. The global θST was 0.146. These results are consistent with the idea that there is a low level of genetic differentiation between the strains.
We observed low and high θST values across loci in both overall and pairwise comparisons (Table 4). The θST values of four loci (ASUS1-2B, ASUS1-2F, ASUS1-4H, ASUS1-8D) were significantly different from zero in the overall comparisons, indicating more substantial genetic differences, but not all loci showed significant genetic differences between all of the strains (Table 4). For example, ASUS1-1H displayed genetic differences only between LAB and WIL, and ASUS1-3B showed differences between TA7 and WIL (Table 4).
The PCA showed no obvious clustering overall. The TA7 samples tended to be biased to low values of PC1 and PC2, while the WIL and LAB samples showed negative values on PC1 but positives on PC2 (Figure 3A). The UPGMA cluster analyses indicated closer genetic similarity between the WIL and LAB strains, while the TA7 strain was more genetically distinct (Figure 3B).
Of the scenarios developed for the DIYABC analyses, our results indicate that Scenario 2, in which TA7 and LAB are the most differentiated, is the most probable, because LAB and WILD are less differentiated (Figure 4A). This conclusion is based on values of Fst for the different scenarios generated within the simulations, along with probability values, as shown in Figure 4B.

4. Discussion

In this study, we found generally low, but in some cases significant, genetic differentiation among two mass-reared colonies and a wild collected population (WIL) of A. ludens flies from Southern Mexico. One of the mass-reared strains was a standard laboratory strain (LAB) and the other was a genetic sexing strain Tapachula-7 (TA7). The TA7 strain was the most genetically differentiated, while LAB and WIL populations were genetically more similar. Overall, we found that the LAB and TA7 mass-reared strains did not show significantly reduced genetic diversity in terms of heterozygosity and allelic richness compared to the wild strain, nor did they appear to show increased levels of inbreeding compared to the wild population as measured by the parameters evaluated here.
This result contrasts with many examples of genetic differentiation between cases of wild vs. laboratory-adapted populations, characterized, in general, by loss of genetic variability upon domestication, as reported in several instances in both Tephritid and other species [29,43]. In these cases, through different mechanisms such as the founder effect, bottlenecks, inbreeding, drift, and selection pressures, colonization and artificial rearing systems are generally regarded as promoting loss of genetic diversity and genetic differentiation between mass-reared and wild strains of fruit flies [22,27,28,29,31,43,44].
Consequently, for the A. ludens populations considered here, we initially expected similar results. In our study, however, we found minimal genetic differences between colonized strains and wild samples. Values for some parameters such as genetic diversity (He) were slightly lower in colonized strains than wild ones, but the difference were not significant. We also found slightly more genetic similarity between the LAB and WIL strains than between the two mass-reared strains. This might reflect the common origin of the wild collection used in the establishment of the mass-reared strains, which subsequently might have been followed by the favoring of some differences found in the captive environment. Historically, the genetic sexing strain, TA7, was started from a mutant individual recovered from the LAB strain. The TA7 strain, the population undergoes repeated bottlenecks due to the use of the filter rearing system to avoid recombination, and this no doubt contributes to some genetic differentiation because these bottlenecks can be catalysts for genetic differentiation resulting from decreased genetic variation and increased inbreeding or more complex genetic interactions [45].
Consistent with all of this is the fact that our results showed that the wild samples, along with the mass-reared samples, were almost uniformly out of Hardy–Weinberg equilibrium. This was contrary to our expectation because wild populations should normally experience gene flow and other factors, processes that should not happen in the LAB and TA7 captive strains. Also, a reduction in Ho or uHe may be expected here because under laboratory conditions, artificial rearing induces intense selection pressures on a large fraction of available genetic polymorphisms. In other cases, this has led to rapid genetic differentiation between populations [27]. However, it is important note that the lack of agreement with Hardy–Weinberg expectations seen here might have resulted from the reduction in heterozygosity due to null alleles not being accounted for in our analysis [41].
Our results did show that allele frequencies of a few loci were heterogeneous among samples from all three strains, including the occurrence of significant changes in allele frequencies in at least three loci. However, this did not produce significant changes in the overall levels of genetic diversity. At least some of these frequency changes could result from processes inherent in the mass-rearing environment, including the artificial selection process, similar to changes in Adh (alcohol dehydrogenase) allele frequencies seen because of selective pressures in artificial rearing, as demonstrated in another Tephritid species, Bactrocera oleae [46].
We also found nearly double the number of private alleles in the LAB strain for six loci compared with TA7 or WIL. This was possibly the result of new mutations arising in populations maintained long-term (in this case, over 130 generations) even in captive conditions. Another possibility is that these private alleles could also occur at low, undetectable frequencies in the WIL strain, and that these alleles are selected for in mass-rearing conditions but not in the field [26]. Overall, other genetic diversity parameters including allele richness, effective number of alleles, and the F-fixation index were similar between the two mass-reared colonies. This may have been due, at least in part, to the common origin of both of these strains as well as the similarities in rearing environments in terms of light cycles, feeding substrates, etc.
All three samples also showed high levels of homozygosity, suggesting high levels of inbreeding. This may be unique to A. ludens because previous studies with wild populations reported that A. ludens showed high values of F-fixation [47,48,49], possibly reflecting limited dispersal of these populations and the tendency of this species to mate with related individuals, even in the field. Genetic drift may also be a relevant factor for the high levels of homozygosity since most of the samples used here were not in Hardy–Weinberg equilibrium. All three cluster analyses (PCA, UPGM, and DIYAB) also showed low levels of genetic differences among strains. Alternatively, their similarity may be understandable since the TA7 strain was derived from the LAB strain, and the LAB strain, in turn, was made up of wild collections from different regions of Mexico, including the region where the WIL strain originated from. Additionally, the diversity of wild populations may reflect founder effects if they were established by small numbers of individuals of limited genetic diversity.

5. Conclusions

We found that mass-rearing conditions did not result in substantially lower levels of genetic variability in terms of heterozygosity and allelic richness in comparisons of the wild and laboratory-reared strains of A. ludens compared here. These unexpected results are contrary to the general idea that laboratory adaptation and mass-rearing reduces overall genetic diversity compared to that seen in wild strains. It could be that many factors, including the high fecundity rate of laboratory-adapted populations, together with various selective pressures such as genetic drift, bottlenecks, and founder effects resulted in this outcome. Regardless, our findings contribute to understanding how different colony management processes may impact the genetic composition of fruit fly strains, offering useful insights that may inform colony management methods.

Supplementary Materials

The following supporting information can be downloaded at: https://www.mdpi.com/article/10.3390/insects15010056/s1, Table S1. Original data set of genotypes with nuclear DNA fragments of seven microsatellites of samples Anastrapheba ludens Loew from field and mass-reared conditions. LAB = laboratory strain; TA7 = Tapachula-7 strain; WIL = wild strain. Each line corresponds to an individual, and by column are given its diploid genotype per microsatellite.

Author Contributions

Conceptualization, P.L., L.R.-M. and M.S.-R.; methodology, E.L.-G., P.L., L.R.-M. and M.G.-B.; formal analysis, L.R.-M., D.H. and A.C.-T.; data curation, A.C.-T. and L.R.-M.; writing—original draft preparation, M.S.-R. and L.R.-M.; writing—review and editing, P.L. and D.H.; supervision, L.R.-M., P.L. and M.S.-R.; project administration, P.L., M.S.-R. and M.G.-B.; funding acquisition, P.L. All authors have read and agreed to the published version of the manuscript.

Funding

This project was funded by IAEA research contract no. 22676 and CONAHCYT project CB-2016-01-284668.

Data Availability Statement

The data presented in this study are openly available as Supplementary materials: Table S1. Original data set of genotypes with nuclear DNA fragments of seven microsatellites of samples Anastrapheba ludens Loew from field and mass-reared conditions.

Acknowledgments

We thank Salvador Meza and the MOSCAFRUT (SENASICA) mass-rearing facility for providing the biological material. We also thank Dina Orozco for helping us reconstruct the history of the LAB and TA7 strains.

Conflicts of Interest

The authors declare no conflicts of interest.

References

  1. Hernández-Ortíz, V.; Aluja, M. Listado de especies del género Neotropical Anastrepha (Diptera: Tephritidae) con notas sobre su distribución y plantas hospederas. Folia Entomol. Mex. 1993, 88, 89–105. [Google Scholar]
  2. Dias, N.P.; Zotti, M.J.; Montoya, P.; Carvalho, I.R.; Nava, D.E. Fruit fly management research: A systematic review of monitoring and control tactics in the world. Crop Prot. 2018, 112, 187–200. [Google Scholar] [CrossRef]
  3. APHIS. Anastrepha ludens, Mexican Fruit Fly Host List. Available online: https://www.aphis.usda.gov/plant_health/plant_pest_info/fruit_flies/downloads/host-lists/mexfly-host-list.pdf (accessed on 22 February 2023).
  4. Reyes, J.; Santiago, G.; Hernández, P. The Mexican fruit fly eradication programme. In Area-Wide Control of Fruit Flies and Other Insect Pests; Tan, K.H., Ed.; Penerbit Universiti Sains Malaysia: Penang, Malaysia, 2000; pp. 377–380. [Google Scholar]
  5. Gutiérrez, J.M. El programa Moscas de la Fruta en México. In Moscas de la Fruta: Fundamentos y Procedimientos Para su Manejo; Montoya, P., Toledo, J., Hernández, E., Eds.; S y G Editores: Coyoacán, México, 2010; pp. 3–9. [Google Scholar]
  6. Knipling, E.F. Possibilities of insect control or eradication through the use of sexually sterile males. J. Econ. Entomol. 1955, 48, 459–462. [Google Scholar] [CrossRef]
  7. Orozco-Dávila, D.; Quintero, L.; Hernández, E.; Solís, E.; Artiaga, T.; Hernández, R.; Ortega, C.; Montoya, P. Mass rearing and sterile insect releases for the control of Anastrepha spp. pests in Mexico—A review. Entomol. Exp. App. 2017, 164, 176–187. [Google Scholar] [CrossRef]
  8. Hendrichs, J.; Franz, G.; Rendon, P. Increased effectiveness and applicability of the sterile insect technique through male-only releases for control of Mediterranean fruit flies during fruiting seasons. J. Appl. Entomol. 1995, 119, 371–377. [Google Scholar] [CrossRef]
  9. Caceres, C.; Cayol, J.P.; Enkerlin, W.R.; Franz, G.; Hendrichs, J.; Robinson, A.S. Comparison of Mediterranean fruit fly (Ceratitis capitata) (Tephritidae) bisexual and genetic sexing strains: Development, evaluation and economics In Proceedings, Symposium: 6th International Symposium on Fruit Flies of Economic Importance; Barnes, B.N., Ed.; Isteg Scientific Publications: Irene, South Africa, 2004; pp. 367–381. [Google Scholar]
  10. Orozco, D.; Hernández, M.R.; Meza, J.S.; Quintero, J.L. Do sterile females affect the sexual performance of sterile males of Anastrepha ludens (Diptera: Tephritidae)? J. Appl. Entomol. 2013, 137, 321–326. [Google Scholar] [CrossRef]
  11. Mclnnis, D.O.; Tarn, S.; Grace, C.; Miyashita, D. Population suppression and sterility rates induced by variable sex ratio, sterile insect releases of Ceratitis capitata (Diptera: Tephritidae) in Hawaii. Ann. Entomol. Soc. Am. 1994, 87, 231–240. [Google Scholar] [CrossRef]
  12. Rendón, P.; McInnis, D.; Lance, D.; Stewart, J. Comparison of Medfly male-only and bisexual releases in large scale field trials. In Area-Wide Control of Fruit Flies and Other Insect Pests; Tan, K.H., Ed.; Penerbit Universiti Sains Malaysia: Penang, Malaysia, 2000; pp. 517–525. [Google Scholar]
  13. Quintero-Fong, L.; Luis, J.H.; Montoya, P.; Orozco-Dávila, D. In situ sexual competition between sterile males of the genetic sexing Tapachula-7 strain and wild Anastrepha ludens flies. Crop Prot. 2018, 106, 1–5. [Google Scholar] [CrossRef]
  14. Orozco, D.; Meza, J.S.; Zepeda, S.; Solís, E.; Quintero-Fong, J.L. Tapachula-7, a new genetic sexing strain of the Mexican fruit fly (Diptera: Tephritidae): Sexual compatibility and competitiveness. J. Econ. Entomol. 2013, 106, 735–741. [Google Scholar] [CrossRef]
  15. Zepeda-Cisneros, C.S.; Meza Hernández, J.S.; García-Martínez, V.; Ibañez Palacios, J.; Zacharopoulou, A.; Franz, G. Development, genetic and cytogenetic analyses of genetic sexing strains of the Mexican fruit fly, Anastrepha ludens Loew (Diptera: Tephritidae). BMC Genet. Data 2014, 15 (Suppl. S2), S1. [Google Scholar] [CrossRef]
  16. Franz, G.; Gencheva, E.; Kerremans, P.H. Improved stability of genetic sex separation strains for the Mediterranean fruit fly, Ceratitis capitata. Genome 1994, 37, 72–82. [Google Scholar] [CrossRef] [PubMed]
  17. Fisher, K.; Caceres, C. A filter rearing system for mass reared sexing strains of Mediterranean fruit fly (Diptera: Tephritidae). In Area-Wide Control of Fruit Flies and Other Pests; Tan, K.H., Ed.; Penerbit Universiti Sains Malaysia: Penang, Malaysia, 2000; pp. 543–550. [Google Scholar]
  18. Woodworth, L.M.; Montgomery, M.E.; Briscoe, D.A.; Frankham, R. Rapid genetic deterioration in captive populations: Causes and conservation implications. Conserv. Genet. 2002, 3, 277–288. [Google Scholar] [CrossRef]
  19. Frankham, R. Genetic adaptation to captivity in species conservation programs. Mol. Ecol. 2008, 17, 325–333. [Google Scholar] [CrossRef] [PubMed]
  20. Gilchrist, A.S.; Cameron, E.C.; Sved, J.A.; Meats, A.W. Genetic consequences of domestication and mass rearing of pest fruit fly Bactrocera tryoni (Diptera: Tephritidae). J. Econ. Entomol. 2012, 105, 1051–1056. [Google Scholar] [CrossRef]
  21. Meza, J.S.; Arredondo, J.; Orozco, D.; Pérez-Staples, D. Disparity in sexual behaviour between wild and mass-reared Mexican fruit flies. Physiol. Entomol. 2014, 39, 263–270. [Google Scholar] [CrossRef]
  22. Parreño, M.A.; Scannapieco, A.C.; Remis, M.I.; Juri, M.; Vera, M.T.; Segura, D.F.; Cladera, J.L.; Lanzavecchia, S.B. Dynamics of genetic variability in Anastrepha fraterculus (Diptera: Tephritidae) during adaptation to laboratory rearing conditions. BMC Genet. Data 2014, 15, S14. [Google Scholar] [CrossRef] [PubMed]
  23. Krafsur, E.S.; Ouma, J.O. Role of population genetics in the sterile insect technique. In Sterile insect Technique: Principles and Practice in Area-Wide Integrated Pest Management, 2nd ed.; Dick, V.A., Hendrichs, J., Robinson, A.S., Eds.; CRC Press: Boca Raton, FL, USA, 2021; pp. 529–548. [Google Scholar]
  24. Romiguier, J.; Gayral, P.; Ballenghien, M.; Bernard, A.; Cahais, V.; Chenuil, A.; Chiari, Y.; Dernat, R.; Duret, L.; Faivre, N.; et al. Comparative population genomics in animals uncovers the determinants of genetic diversity. Nature 2014, 515, 261–263. [Google Scholar] [CrossRef] [PubMed]
  25. Ellegren, H.; Galtier, N. Determinants of genetic diversity. Nat. Rev. Genet. 2016, 17, 422–433. [Google Scholar] [CrossRef]
  26. Bush, G.L.; Neck, R.W.; Kitto, B.G. Screwworm eradicaction: Inadvertent selection for noncompetitive ecotypes during mass rearing. Science 1976, 193, 492–493. [Google Scholar] [CrossRef]
  27. Loukas, M.; Economopoulos, A.P.; Zouros, E.; Vergini, Y. Genetic changes in artificially reared colonies of the olive fruit fly (Diptera: Tephritidae). Ann. Entomol. Soc. Am. 1985, 78, 159–165. [Google Scholar] [CrossRef]
  28. Simões, P.; Pascual, M.; Santos, J.; Rose, R.M.; Matos, M. Evolutionary dynamics of molecular markers during local adaptation: A case study in Drosophila subobscura. BMC Evol. Biol. 2008, 8, 66. [Google Scholar] [CrossRef] [PubMed]
  29. Tsakas, S.C.; Zouros, E. Genetic differences among natural and laboratory reared populations of the olive-fruit fly Dacus oleae (Diptera: Tephritidae). Entomol. Exp. Appl. 1980, 28, 268–276. [Google Scholar] [CrossRef]
  30. Economopoulos, A.P.; Loukas, M. ADH allele frequency changes in olive fruit flies shift from olives to artificial larval food and vice versa, effect of temperature. Entomol. Exp. Appl. 1986, 40, 215–221. [Google Scholar] [CrossRef]
  31. Zygouridis, N.E.; Argov, Y.; Nemny-Lavy, E.; Augustinos, A.A.; Nestel, D.; Mathiopoulos, K.D. Genetic changes during laboratory domestication of an olive fly SIT strain. J. Appl. Entomol. 2014, 138, 423–432. [Google Scholar] [CrossRef]
  32. Orozco-Dávila, D.; Hernández, R.; Meza, S.; Domínguez, J. Sexual competitiveness and compatibility between mass-reared sterile flies and wild populations of Anastrepha ludens (Diptera: Tephritidae) from different regions in Mexico. Fla. Entomol. 2007, 90, 19–26. [Google Scholar] [CrossRef]
  33. Caceres, C. Mass rearing of temperature sensitive genetic sexing strains in the Mediterranean fruit fly (Ceratitis capitata). Genetica 2002, 116, 107–116. [Google Scholar] [CrossRef] [PubMed]
  34. Doyle, J.J. Isolation of plant DNA from fresh tissue. Focus 1990, 12, 13–15. [Google Scholar]
  35. Fritz, A.H.; Schable, N. Microsatellite loci from the Caribbean Fruit Fly, Anastrepha suspensa (Diptera: Tephritidae). Mol. Ecol. Notes 2004, 4, 443–445. [Google Scholar] [CrossRef]
  36. Morin, P.A.; Manaster, C.; Mesnick, S.L.; Holland, R. Normalization and binning of historical and multi-source microsatellite data: Overcoming the problems of allele size shift with allelogram. Mol. Ecol. Resour. 2009, 9, 1451–1455. [Google Scholar] [CrossRef]
  37. Peakall, R.; Smouse, P.E. GENALEX 6: Genetic analysis in Excel. Population genetics software for teaching and research. Mol. Ecol. 2006, 6, 288–295. [Google Scholar] [CrossRef]
  38. Sokal, R.R.; Rohlf, F.J. Biometrics, 2nd ed.; Freeman and Company: New York, NY, USA, 1995; p. 794. [Google Scholar]
  39. Nei, M. Genetic distance between populations. Am. Nat. 1972, 106, 283–292. [Google Scholar] [CrossRef]
  40. Cornuet, J.M.; Pudlo, P.; Veyssier, J.; Dehne-Garcia, A.; Gautier, M.; Leblois, R.; Marin, J.M.; Estoup, A. DYABC v2.0: A software to make approximate Bayesian computation inferences about population history using single nucleotide polymorphism, DNA sequence and microsatellite data. Bioinformatics 2014, 30, 1187–1189. [Google Scholar] [CrossRef] [PubMed]
  41. Beaumont, M.A.; Zhang, W.; Balding, D.J. Approximate Bayesian computation in population genetics. Genetics 2002, 162, 2025–2035. [Google Scholar] [CrossRef]
  42. Estoup, A.; Lombaert, E.; Marin, J.M.; Guillemaud, T.; Pudlo, P.; Robert, C.P.; Cornuet, J.M. Estimation of demo-genetic model probabilities with approximates Bayesian computation using linear discriminant analysis on summary statistics. Mol. Ecol. Resour. 2012, 12, 846–855. [Google Scholar] [CrossRef] [PubMed]
  43. Haymer, D.S. Genetic analysis of laboratory and wild strains of the Melon fly (Diptera: Tephritidae) using random amplified polymorphic DNA–polymerase chain reaction. Ann. Entomol. Soc. Am. 1995, 88, 705–710. [Google Scholar] [CrossRef]
  44. Hernández, E.; Toledo, J.; Artiaga-López, T.; Flores, S. Demographic changes in Anastrepha obliqua (Diptera: Tephritidae) throughout the laboratory colonization process. J. Econ. Entomol. 2009, 102, 542–551. [Google Scholar] [CrossRef] [PubMed]
  45. Bryant, E.H.; McCommas, S.A.; Combs, L.M. The effect of an experimental bottleneck upon quantitative genetic variation in the Housefly. Genetics 1986, 114, 1191–1211. [Google Scholar] [CrossRef]
  46. Zouros, E.; Loukas, M.; Economopoulos, A.; Mazomenos, B. Selection at the alcohol dehydrogenase locus of the olive fruit fly Dacus oleae under artificial rearing. Heredity 1982, 48, 169–185. [Google Scholar] [CrossRef]
  47. Molina-Nery, M.C.; Ruiz-Montoya, L.; Zepeda-Cisneros, C.S.; Liedo, P. Genetic structure of populations of Anastrepha ludens (Diptera: Tephritidae) in Mexico. Fla. Entomol. 2014, 97, 1648–1661. [Google Scholar] [CrossRef]
  48. Ruiz-Montoya, L.; Verónica-Vallejo, R.; Haymer, D.; Liedo, P. Genetic and ecological relationships of Anastrepha ludens (Diptera: Tephritidae) populations in souther Mexico. Insects 2020, 11, 815. [Google Scholar] [CrossRef]
  49. Gálvez-Reyes, N.G.; Salvador-Figueroa, M.; Santini, N.S.; Mastretta-Yanes, A.; Núñez-Farfán, J.; Piñero, D. Nuclear genetic diversity and structure of Anastrepha ludens wild populations evidenced by microsatellite markers. Front. Ecol. Evol. 2022, 10, 948640. [Google Scholar] [CrossRef]
Figure 1. Allele frequencies of seven microsatellite loci in three strains of Anastrepha ludens Loew. Significant results of a G-test for heterogeneity (G) and the number of private alleles by number of loci are presented. LAB = laboratory strain; TA7 = Tapachula-7 strain; WIL = wild strain. The squares next to the pie diagrams indicate the private alleles.
Insects 15 00056 g001
Figure 2. Average genetic diversity estimators for three strains of Anastrepha ludens Loew. (A) Number of alleles observed and effective. (B) Heterozygosity observed and unbiased expected by Hardy-Weinberg equilibrium and Fixation index. N = Average sample size, Na = observed number of alleles, Ne = effective number of alleles, uHe = unbiased expected heterozygosity, Ho = observed heterozygosity, uHe = unbiased expected heterozygosity, F = fixation index; LAB = laboratory strain, TA7 = Tapachula-7 strain, WIL = wild strain. F values from the analysis of variance (ANOVA) are presented over respective columns. An asterisk over the F bar indicates a significant result (p < 0.001) from the χ2 = F2N(k − 1) analysis.
Insects 15 00056 g002
Figure 3. Principal component analyses (A) and UPGMA cluster (B) of genetic data of seven microsatellites in three strains of Anastrepha ludens Loew. LAB = laboratory strain; TA7 = Tapachula-7 strain; WIL = wild strain.
Insects 15 00056 g003
Figure 4. Scenarios (upper panels) of genetic differentiation of strains of Anastrepha ludens Loew (A), and probability values of logistic regression for each scenario evaluated simultaneously in DIYABC program (B). Time (t) is not to scale and indicates hypothetical sequences of differentiation over generations from the simulated data.
Insects 15 00056 g004
Table 1. Microsatellites used in the study of Anastrepha ludens from Fritz and Schable [35].
MarkersPrimer Sequence (5′-3′)Size (bp)Temp (°C)
Asus1-1H1HF- TGG TAG TCA GGC ATC AA208–23054
1HR- CAG TAT ATC TTG GGC AAT AA
Asus1-2B2BF- CAG CAG CGT ATG TAT GT129–13254
2BR- CTT CGG TGT TGT TTA CTT A
Asus1-2F2FF- GCC ACT GGT TTA TTA CTC T262–28652
2FR- ACG CCA GAC ATT TTA GTT
Asus1-3B3BF- CGT TCA GCA TTA CTT TGA107–12354
3BR- CTT ATT TGG AAG TGA CTGA
Asus1-4H4HF- TGC CAT GTC TTG CTA GT158–20452
4HR- TTA CCC TGA CTG ATT GTT AT
Asus1-5E5EF- CAA CCC GAT TCA GAT TA235–27552
5ER- CGA AAA ATC CAA ATA TCT TA
Asus1-6C6CF- AAA TCG TGG TAA ATA AAG TAA C333–37754
6CR- CGC TGC TCA ATT TAA TAC T
Asus1-8D8DF- GTT AAG CCA TTC CTG TTC215–25453
8DR- CTG ACA GGG CAA AGT TAC
Asus1-9A9AF- AAA CCA TAC TTG AGA AAA AC278–32949
9AR- TTG GAA CGA GAA TAA AAC
Table 2. Chi-squared results to test Hardy–Weinberg equilibrium in strains of Anastrepha ludens Loew. LAB = laboratory strain; TA7 = Tapachula strain; WIL = wild strain.
StrainLocusDFChiSqp
LABASUS1-1H360.000<0.01
ASUS1-2B1075.820<0.01
ASUS1-2F1573.972<0.01
ASUS1-3B656.000<0.01
ASUS1-4H1090.015<0.01
ASUS1-6C311.4220.010
ASUS1-8D1052.095<0.01
TA7ASUS1-1H330.267<0.01
ASUS1-2B631.516<0.01
ASUS1-2F321.250<0.01
ASUS1-3B130.000<0.01
ASUS1-4H115.648<0.01
ASUS1-6C1512.9900.603
ASUS1-8D2158.409<0.01
WILASUS1-1HMonomorphic
ASUS1-2B1044.689<0.01
ASUS1-2F1051.854<0.01
ASUS1-3B332.543<0.01
ASUS1-4H341.785<0.01
ASUS1-6C28115.403<0.01
ASUS1-8D674.851<0.01
Table 3. AMOVA of genetic data for the three strains of Anastrepha ludens Loew and the θST estimator of genetic differentiation. The calculated θST probability corresponds to a p-value (random ≥ data), based on standard permutations across the full dataset [35].
SourcedfSSMSEst. Var.%θST
Among strains263.97831.9890.89315%0.146 (p = 0.001)
Within strains87453.3335.2115.21185%
Total89517.311 6.103100%
Table 4. θST values from the pairwise comparisons between strains of Anastrepha ludens Loew. The values were obtained through AMOVA per locus. LAB = laboratory strain; TA7 = Tapachula-7 strain; WIL = wild strain. The probability value (p) associated with θST is based on the use of standard permutations across the full dataset.
LocusLAB-TA7LAB-WILLTA7-WILLOverall
ASUS1-1H0.015 ns0.017 *0.115 ns0.043 ns
ASUS1-2B0.033 ns0.00.105 *0.049 *
ASUS1-1F0.239 **0.41 ns0.103 **0.158 **
ASUS1-3B0.004 ns0.028 ns0.084 *0.044 ns
ASUS1-4H0.359 **0.389 **0.00.275 **
ASUS1-6C0.030 *0.0430.00.015 ns
ASUS1-8D0.297 **0.0060.264 *0.049 **
ns, not significant, p > 0.05; *, p < 0.05; **, p < 0.01.
Disclaimer/Publisher’s Note: The statements, opinions and data contained in all publications are solely those of the individual author(s) and contributor(s) and not of MDPI and/or the editor(s). MDPI and/or the editor(s) disclaim responsibility for any injury to people or property resulting from any ideas, methods, instructions or products referred to in the content.

