Smart MRI Agents for Detecting Extracellular Events In Vivo: Progress and Challenges


1
Department of Radiology, UT Southwestern Medical Center, Dallas, TX 75390, USA
2
Department of Chemistry, University of Texas at Dallas, Dallas, TX 75080, USA
3
Werner Siemens Imaging Center, Eberhard Karls University Tuebingen, 72076 Tuebingen, Germany
*
Author to whom correspondence should be addressed.
Inorganics 2019, 7(2), 18; https://doi.org/10.3390/inorganics7020018
Submission received: 3 January 2019
/
Revised: 25 January 2019
/
Accepted: 29 January 2019
/
Published: 9 February 2019
(This article belongs to the Special Issue MRI Contrast Agents)
Abstract
:Many elegant inorganic designs have been developed to aid medical imaging. We know better now how to improve imaging due to the enormous efforts made by scientists in probe design and other fundamental sciences, including inorganic chemistry, physiochemistry, analytical chemistry, and biomedical engineering. However, despite several years being invested in the development of diagnostic probes, only a few examples have shown applicability in MRI in vivo. In this short review, we aim to show the reader the latest advances in the application of inorganic agents in preclinical MRI.

1. Introduction
Magnetic resonance imaging (MRI) has become one of the most powerful tools in clinical medicine, largely because it offers exquisite high-resolution anatomical images of soft tissues. Since its advent in the early 1980s, there has been an explosion in the number of exams performed in the United States; there are now millions performed each year. Early in the development of the MRI, the utility of contrast agents (CAs) to enhance image quality and increase diagnostic accuracy was recognized; in fact, clinical trials for the first agent began in 1982, with final approval being granted in 1988 to Magnevist [1]. MRI CAs produce contrast-enhanced images between normal and pathologic tissues, increasing diagnostic accuracy and vastly expanding the utility of MRI [2]. Most clinically available agents contain a lanthanide chelated within a macrocyclic or linear aminopolycarboxylate, and are tissue non-specific or relatively insensitive. Recent developments in contrast agent development have focused on ligand modification of the side chains of the macrocyclic ring, to allow tuning and physiologic targeting of the CAs.
There are several classes of CAs, including T1, T2, T2ex, and chemical exchange saturation transfer (CEST) (Figure 1). The most common clinically available agents are T1 and T2. T1 and T2 agents shorten both longitudinal and transverse relaxation times (T1 and T2) of protons in tissue water, thereby increasing signal intensity in T1-weighted images (positive enhancement) or reducing signal intensity in T2-weighted images (negative enhancement). The extent to which these agents influence the relaxation rate (1/T1 or 1/T2) of tissue water is defined as relaxivity (r1 or r2, respectively). The r1 relaxivity depends on many factors, including the relaxation time of the paramagnetic metal base (e.g., Gd3+ has a relatively long electronic relaxation times), the relatively fast water exchange between water from bulk solvent and water molecules reaching the inner sphere of the lanthanide ion, and the molecular motion, typically governed by the rotational correlation time (τR) [3,4,5,6,7]. High relaxivity allows lower concentration targets to be detected efficiently, as high relaxivity leads to increased signal generation [4]. T1-agents, which comprise almost all of the current clinically approved CAs, utilize paramagnetic metal ions and mostly contain the lanthanide metal gadolinium (Gd3+) due to it is optimal paramagnetic and physical properties that yield high relaxivities [8]. The human body is composed of approximately 60% water; therefore, T1-weighted images give excellent anatomical details that can be boosted with the application of the Gd3+-based contrast agents (CAs) [9,10]. However, these CAs are mainly non-specific, with no tissue preference, and no dynamic response to changes in physiology. One of the main goals in recent years has been to develop newer types of agents for measuring important physiological parameters, such as tissue pH, metabolic product and ion concentration, hypoxia, or enzyme activity. For example, the recent discovery of a Zn2+-responsive Gd complex has allowed monitoring of insulin secretion from pancreatic β-cells and Zn2+ secretion from prostate, both in response to glucose-induced zinc secretion [7,11,12].
While T1 and T2 agents comprise the majority of clinically available CAs, there are additional mechanisms under exploration that may eventually translate into clinical use. One is T2-exchange agents (T2ex), which is a group that has received little discussion. The T2-exchange mechanism relies on intermediate water exchange rates between bulk water and agent. Intermediate exchange rates mean that optimum T2ex agents lie between faster T1/T2-agents and slower CEST agents [13,14]. These agents shorten water T2 by a chemical exchange process rather than a relaxation process. Regulating this physical exchange of protons between T2ex agents and bulk water improves the specificity for detecting intended biomarkers, similar to CEST agents [13,14]. CEST agents are a class of CAs that produce image contrast in a fundamentally different way than T1/T2-agents, relying on slow–intermediate chemical exchange processes between two or more magnetically nonequivalent pools of protons (∆ω ≥ kex). Saturation of proton spins in the contrast agent followed by a chemical exchange of those spins into bulk water results in a decrease of bulk water signal intensity, thereby creating negative image contrast [15,16,17]. As the chemical exchange can be quite sensitive to the environment of a contrast agent, paraCEST agents (macrocyclic ligands containing paramagnetic metal ions) have attracted interest as potential smart MRI agents. The chemical shift difference between the two exchanging pools can be much larger for paraCEST agents which allow selective saturation of one of the exchanging pools without partial saturation of the bulk water pool. Another advantage of CEST is that the contrast can be turned on and off at will, which offers another advantage of administering multiple ParaCEST agents simultaneously, and each could be activated separately by an appropriate choice of saturation frequency [16,17,18]. For these reasons, the paraCEST mechanism has created remarkable opportunities for designing responsive MRI agents.
Designing responsive MRI agents (“smart” agents) for the early detection of cancer and other diseases remains the essential, although challenging, goal. Over the past few years, various approaches have been taken to improve the specificity of MRI agents, including modification of ligand chemistry to make the agents more sensitive to their chemical environment (e.g., pH, temperature, enzymes, metal ion), and designing new agents with optimal water exchange rate and high relaxivity (T1-agents) or paraCEST agents with much slower water exchange to be effective in vivo [19]. Although many responsive agent designs have been presented, translation into clinical diagnostic medicine has been very slow [20]. This mini-review article will mainly focus on recent developments in the design of macrocyclic responsive T1, T2ex, and CEST agents for in vivo applications, and what the potential clinical applications of these agents may be. In this review, several recent advances to improve agent efficiency and sensitivity through structural modifications, and steps taken to target these agents to specific tissues or specific biological processes, will be addressed.
2. T1 Contrast Agents
2.1. Clinically Available Contrast Agents
2.1.1. Extracellular Fluid Agents
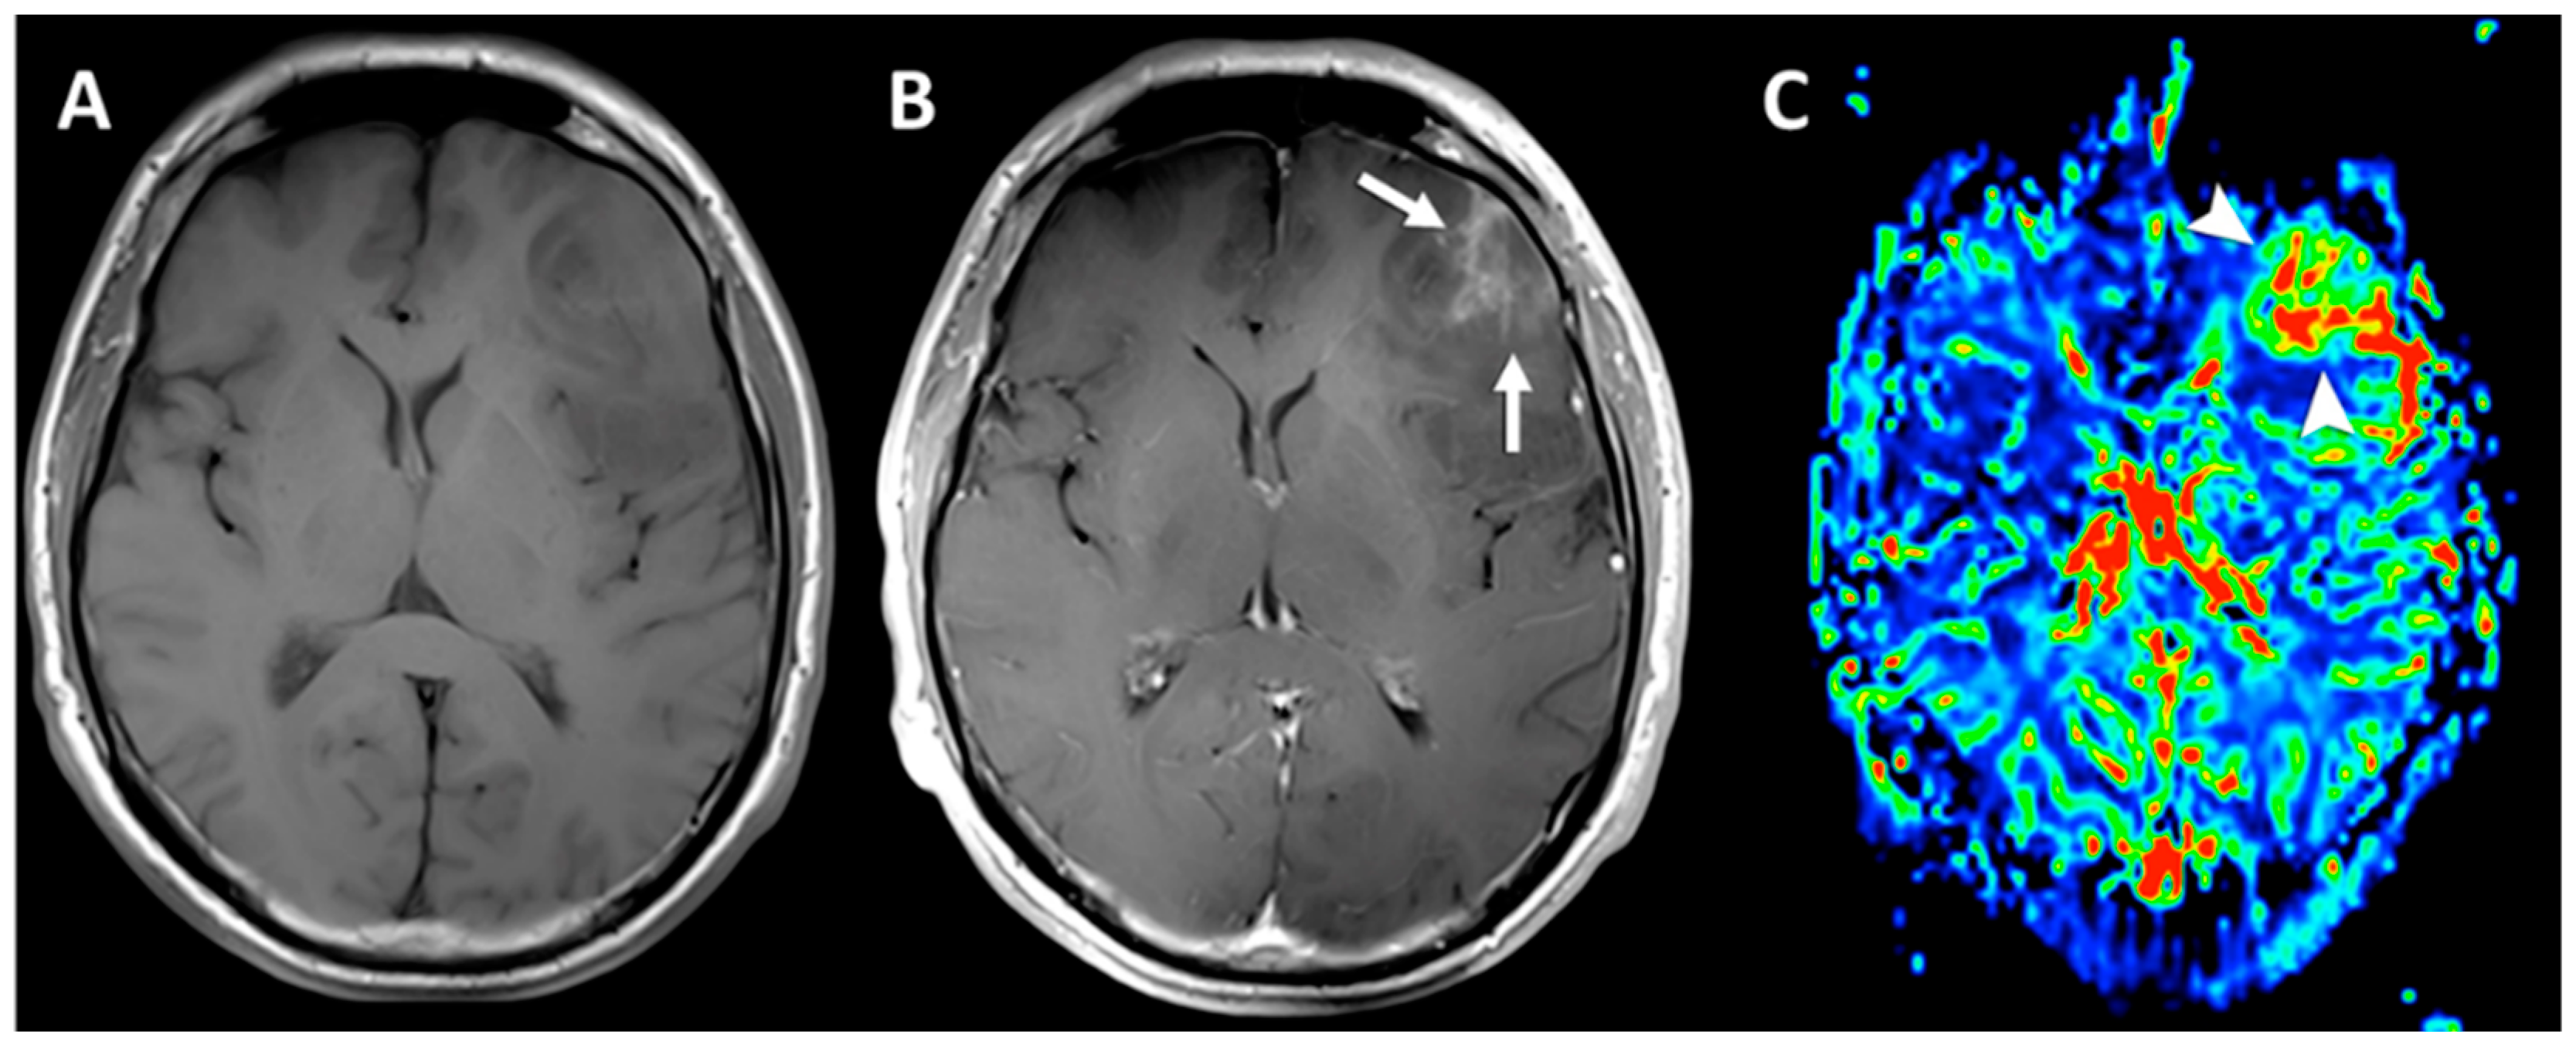
Most T1-based agents currently on the market are classified as extracellular fluid (ECF) agents. This means the agents themselves exert their effects within the ECF, ubiquitous throughout the human body, and do not target a specific organ per se, although the argument can be made that because all of these agents are excreted through renal glomeruli, they preferentially target and accrue in the kidneys [21,22,23]. Regardless, CAs increase T1 relaxation times (R1 = 1/T1) within the extracellular fluid by increasing the relaxivity of water surrounding the gadolinium ion, increasing T1-weighted signal and leading to bright enhancement on imaging. Any pathophysiologic process that causes increased blood flow, fluid extravasation into the interstitial space or breakdown of otherwise impermeable biologic barriers, is prone to abnormal enhancement in response to CA-guided MRI imaging [22,24]. The initial clinical indication for contrast agents was to enhance imaging of the central nervous system [2]. Many tumors, including glioblastoma multiforme, an extremely aggressive form of brain cancer, cause regional breakdowns of the blood–brain barrier; this allows CAs to pass into the brain parenchyma, which otherwise would have been prevented by the impermeable blood–brain barrier (Figure 2). The result is abnormal T1 enhancement on MRI, and increased diagnostic sensitivity [25]. Other clinically relevant examples involving ECF agents include CA-enhanced breast examinations, for the detection of breast cancer, and CA-enhanced prostate examinations, also for the detection of cancer [24].
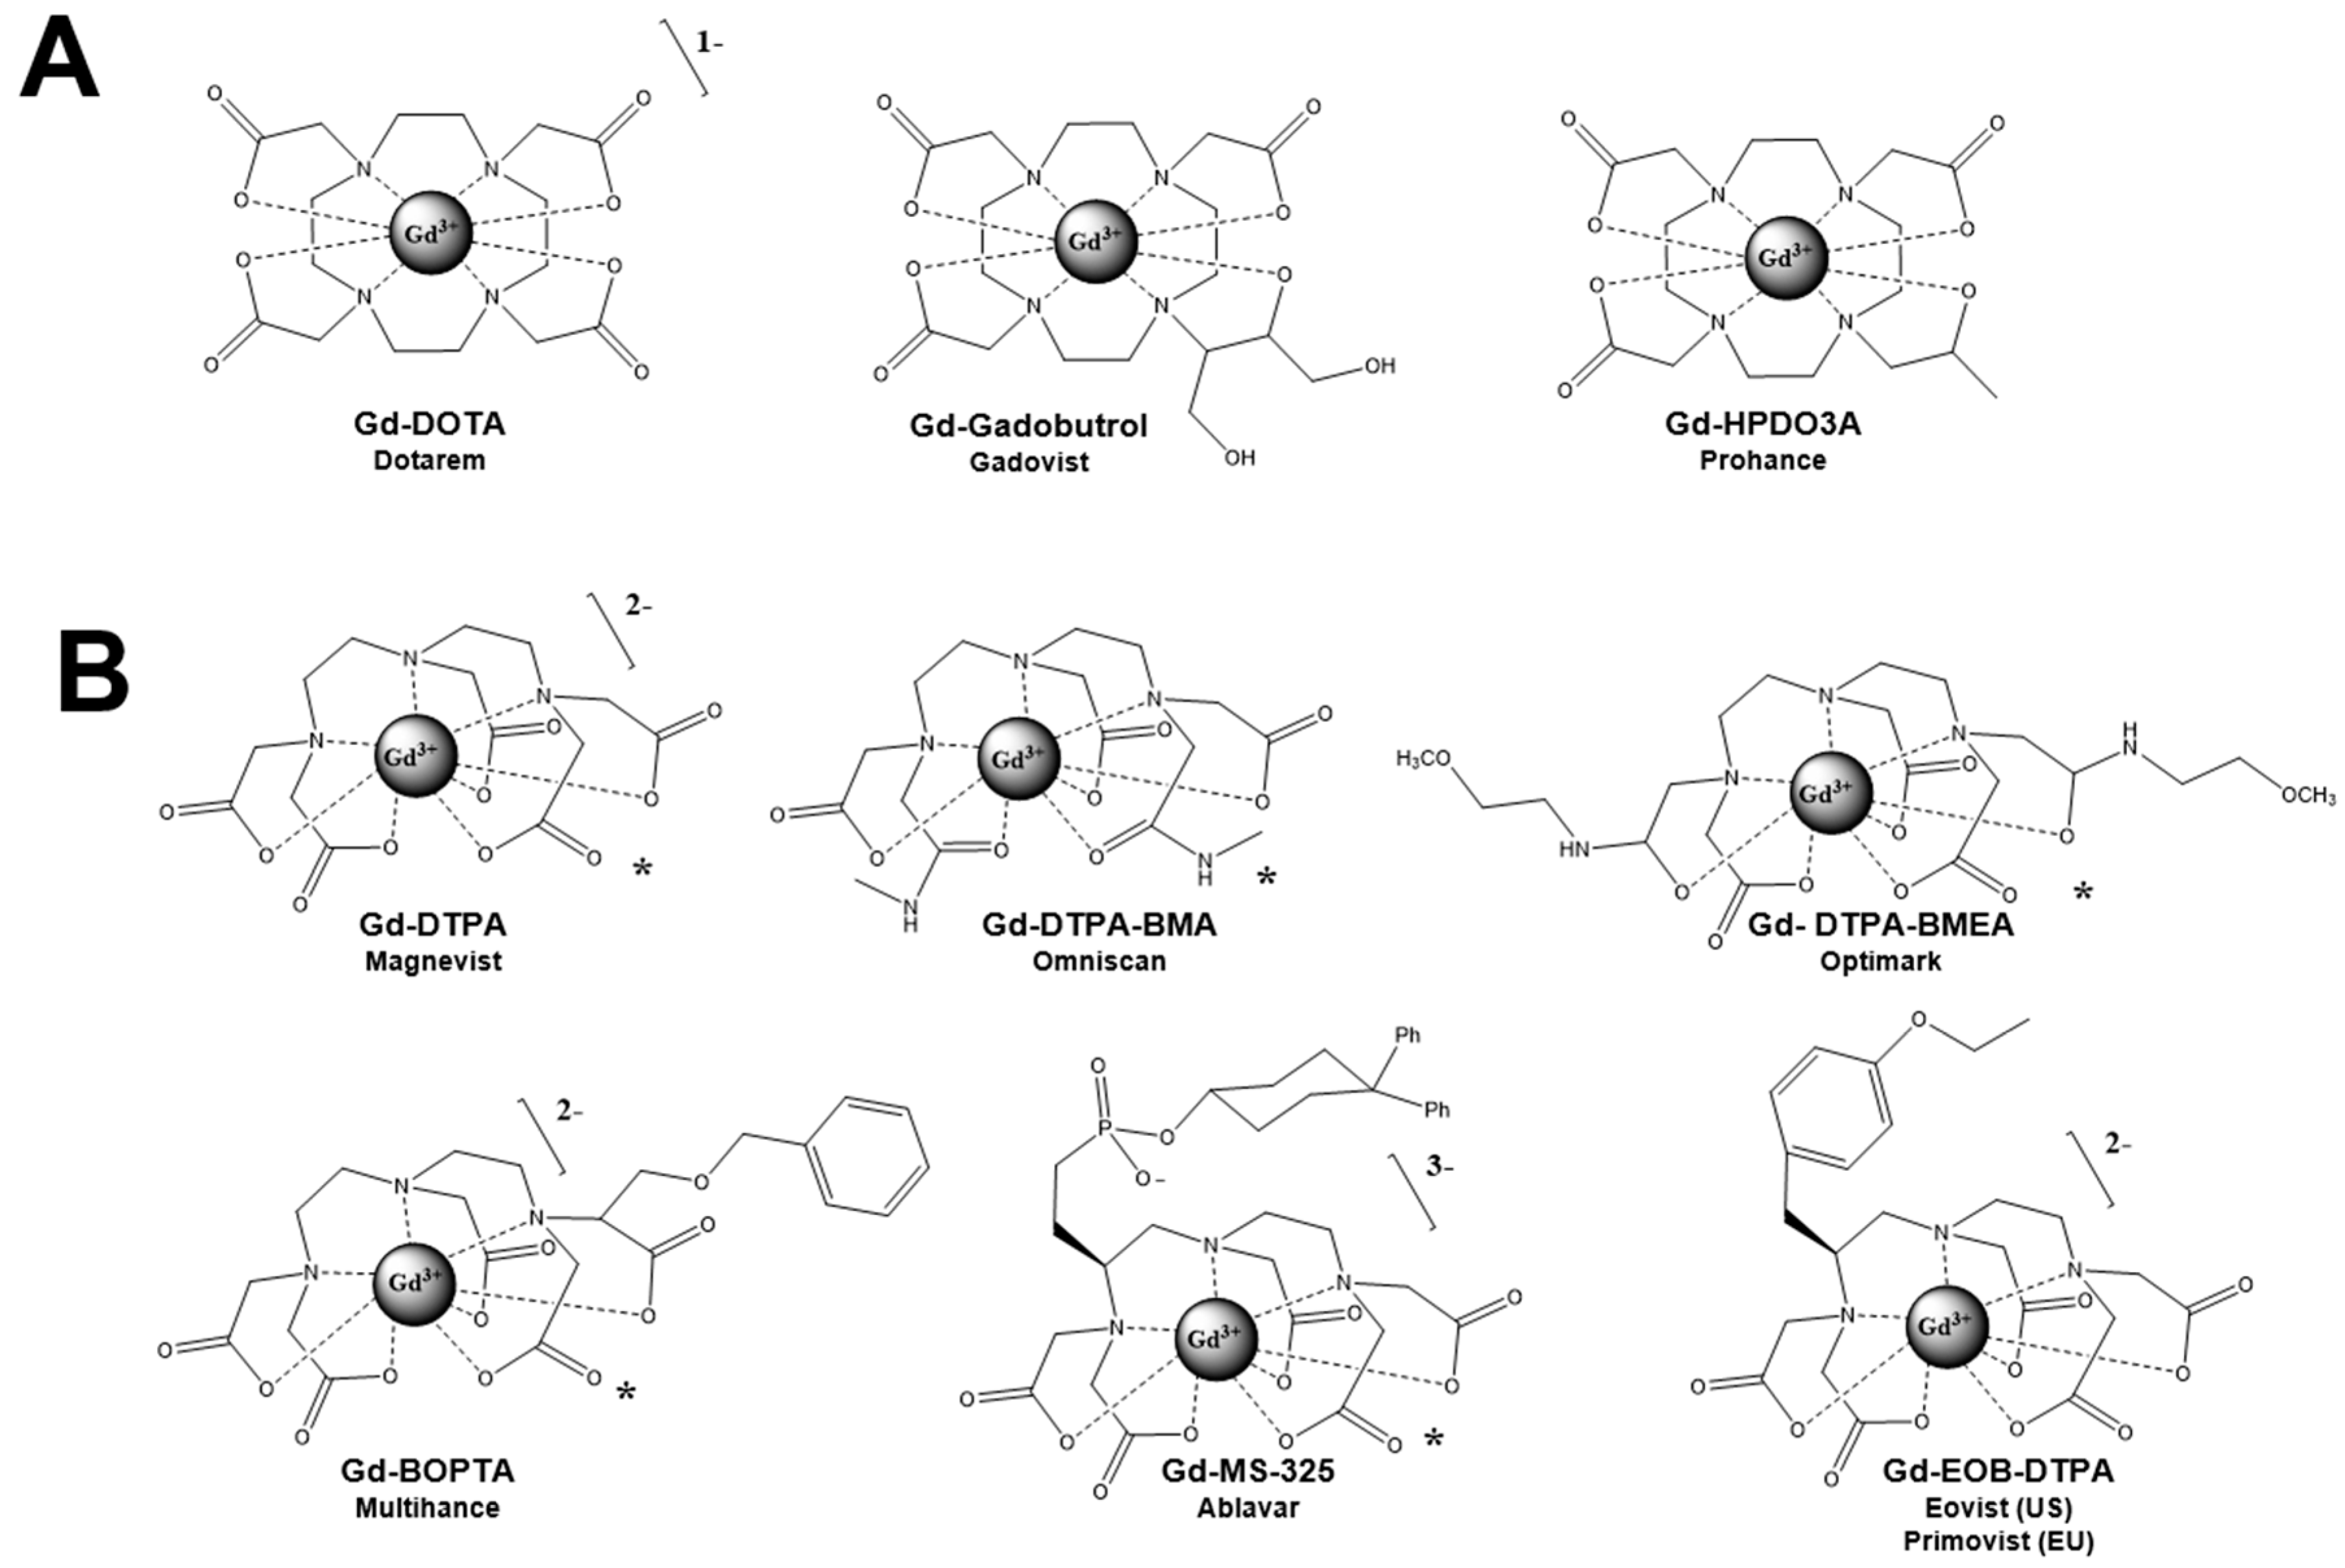
Unchelated gadolinium is a toxic metal that interferes with calcium channels due to its similarity in size and charge to calcium; therefore, to limit toxicity to a clinically acceptable level, ECF agents chelate gadolinium, either within a linear superstructure or a macrocyclic ring (Figure 3) [26,27]. Typically, the linear or macrocyclic backbone is a derivative of an aminopolycarboxylate ligand; intermolecular forces between unpaired electrons on the ligand and gadolinium effectively hold gadolinium in place within the compound. Formation kinetics between gadolinium and its chelating ligand are excellent; many of the macrocyclic compounds have constants in the range of days to weeks [27,28]. In addition to the structure of the chelating backbone, ECF agents are either neutral (such as Omniscan), or charged, such as Dotarem. Charged agents require co-administration with a counterion, typically meglumine; this limits the maximum dosages, as counterions increase the osmolarity of the solution and thus perturb blood osmolality to a greater extent [6,29]. Depending on the diagnostic purpose, dosages of ECF agents vary quite extensively, with ranges from 0.1 to 0.3 mmol/kg to provide a relaxation rate change of about 0.5 s−1 at clinical magnetic fields (1–3 T) [30]. Due to increased gadolinium deposition in long bones and the brain tissue, the European Medicines Agency has suspended human administration of linear contrast agents [26].
2.1.2. Blood Pool Agents
Blood pool agents are T1 CAs that display an increased dwell time within the vasculature and have an indication in magnetic resonance angiography (MRA), which is the visualization of the arterial system with contrast [31,32]. Two general methods have been used to develop blood pool agents—either agents are designed with very high molecular weight which prevents extravasation through cell membranes, or agents have an albumin binding moiety which increases dwell time within the vasculature. A clinical example of this is Ablavar (Bayer). Ablavar contains an albumin-binding ligand (Figure 3) which strongly and reversibly binds to albumin, leading to decreased tumbling time and increased T1 signal intensity [31,32]. Clinically, Ablavar was developed to increase the ease and accuracy of MRA exams; ECF agents, which do enhance arterial vessels, leave the vasculature within minutes and, therefore, can only be visualized on a first-pass basis with carefully timed boluses and sequences, whereas Ablavar can stay within the circulatory system for over an hour, decreasing the technical difficulty of the exam [31,32]. The clinical utility of these agents, however, has been sparse; Ablavar was pulled from the market in 2017 by Bayer due to poor sales.
2.1.3. Hepatobiliary Agents
Several agents have been developed which take advantage of the liver’s function of filtering endobiotic and exobiotic molecules to target this organ specifically. Two agents, gadoxetic acid (Eovist) and gadobenate meglumine (MultiHance), are currently used in the United States for liver imaging (although for gadobenate meglumine, it is an off-label indication) [33,34]. The most specific is gadoxetic acid, which is excreted approximately 50% via renal glomeruli and 50% via hepatocytes. Gadoxetic acid is a linear, gadolinium-based contrast agent with a lipophilic ethoxybenzyl (EOB) moiety (Figure 3) [33,34]. The EOB moiety gives the molecule an amphipathic characteristic and interacts with the organic anion transporter polypeptide 1 on the hepatocytes to facilitate uptake into cells [33,34,35]. Following uptake, gadoxetic acid is secreted into the bile via the multidrug-resistant transporter; since there is a significant dwell time within bile, this allows contrast imaging of the liver. Liver lesions with altered hepatocyte function (such as focal nodular hyperplasia, hepatic adenoma, and hepatocellular carcinoma) demonstrate differential enhancement on T1-imaging compared to surrounding healthy tissue [33,34].
Imaging with gadoxetic acid requires an additional scan; typically, the agent is given as a bolus with arterial phase imaging, followed by portal venous phase imaging; after approximately 20 min, enough uptake into hepatocytes has occurred to allow additional biliary phase imaging. Gadoxetic acid has been shown to increase diagnostic certainty of liver lesions, particularly in cirrhotic cases when fibrous tissue within the liver can make conventional imaging challenging to interpret [35,36]. Gadobenate meglumine (MultiHance) is generally considered an ECF agent; however, it does display a 3–5% uptake in hepatocytes, allowing for hepatobiliary imaging as off-label use [33,34]. Gadobenate meglumine does have increased relaxivity compared to gadoxetic acid, which results in superior arterial phase imaging; however, enough bile accumulation for liver imaging does not occur for 90 to 120 min; patients must return to the scanner, increasing logistical difficulty of the exam [33,34].
2.2. Detection of Trace Metal Ions In Vivo
2.2.1. Zinc-Responsive Contrast Agents
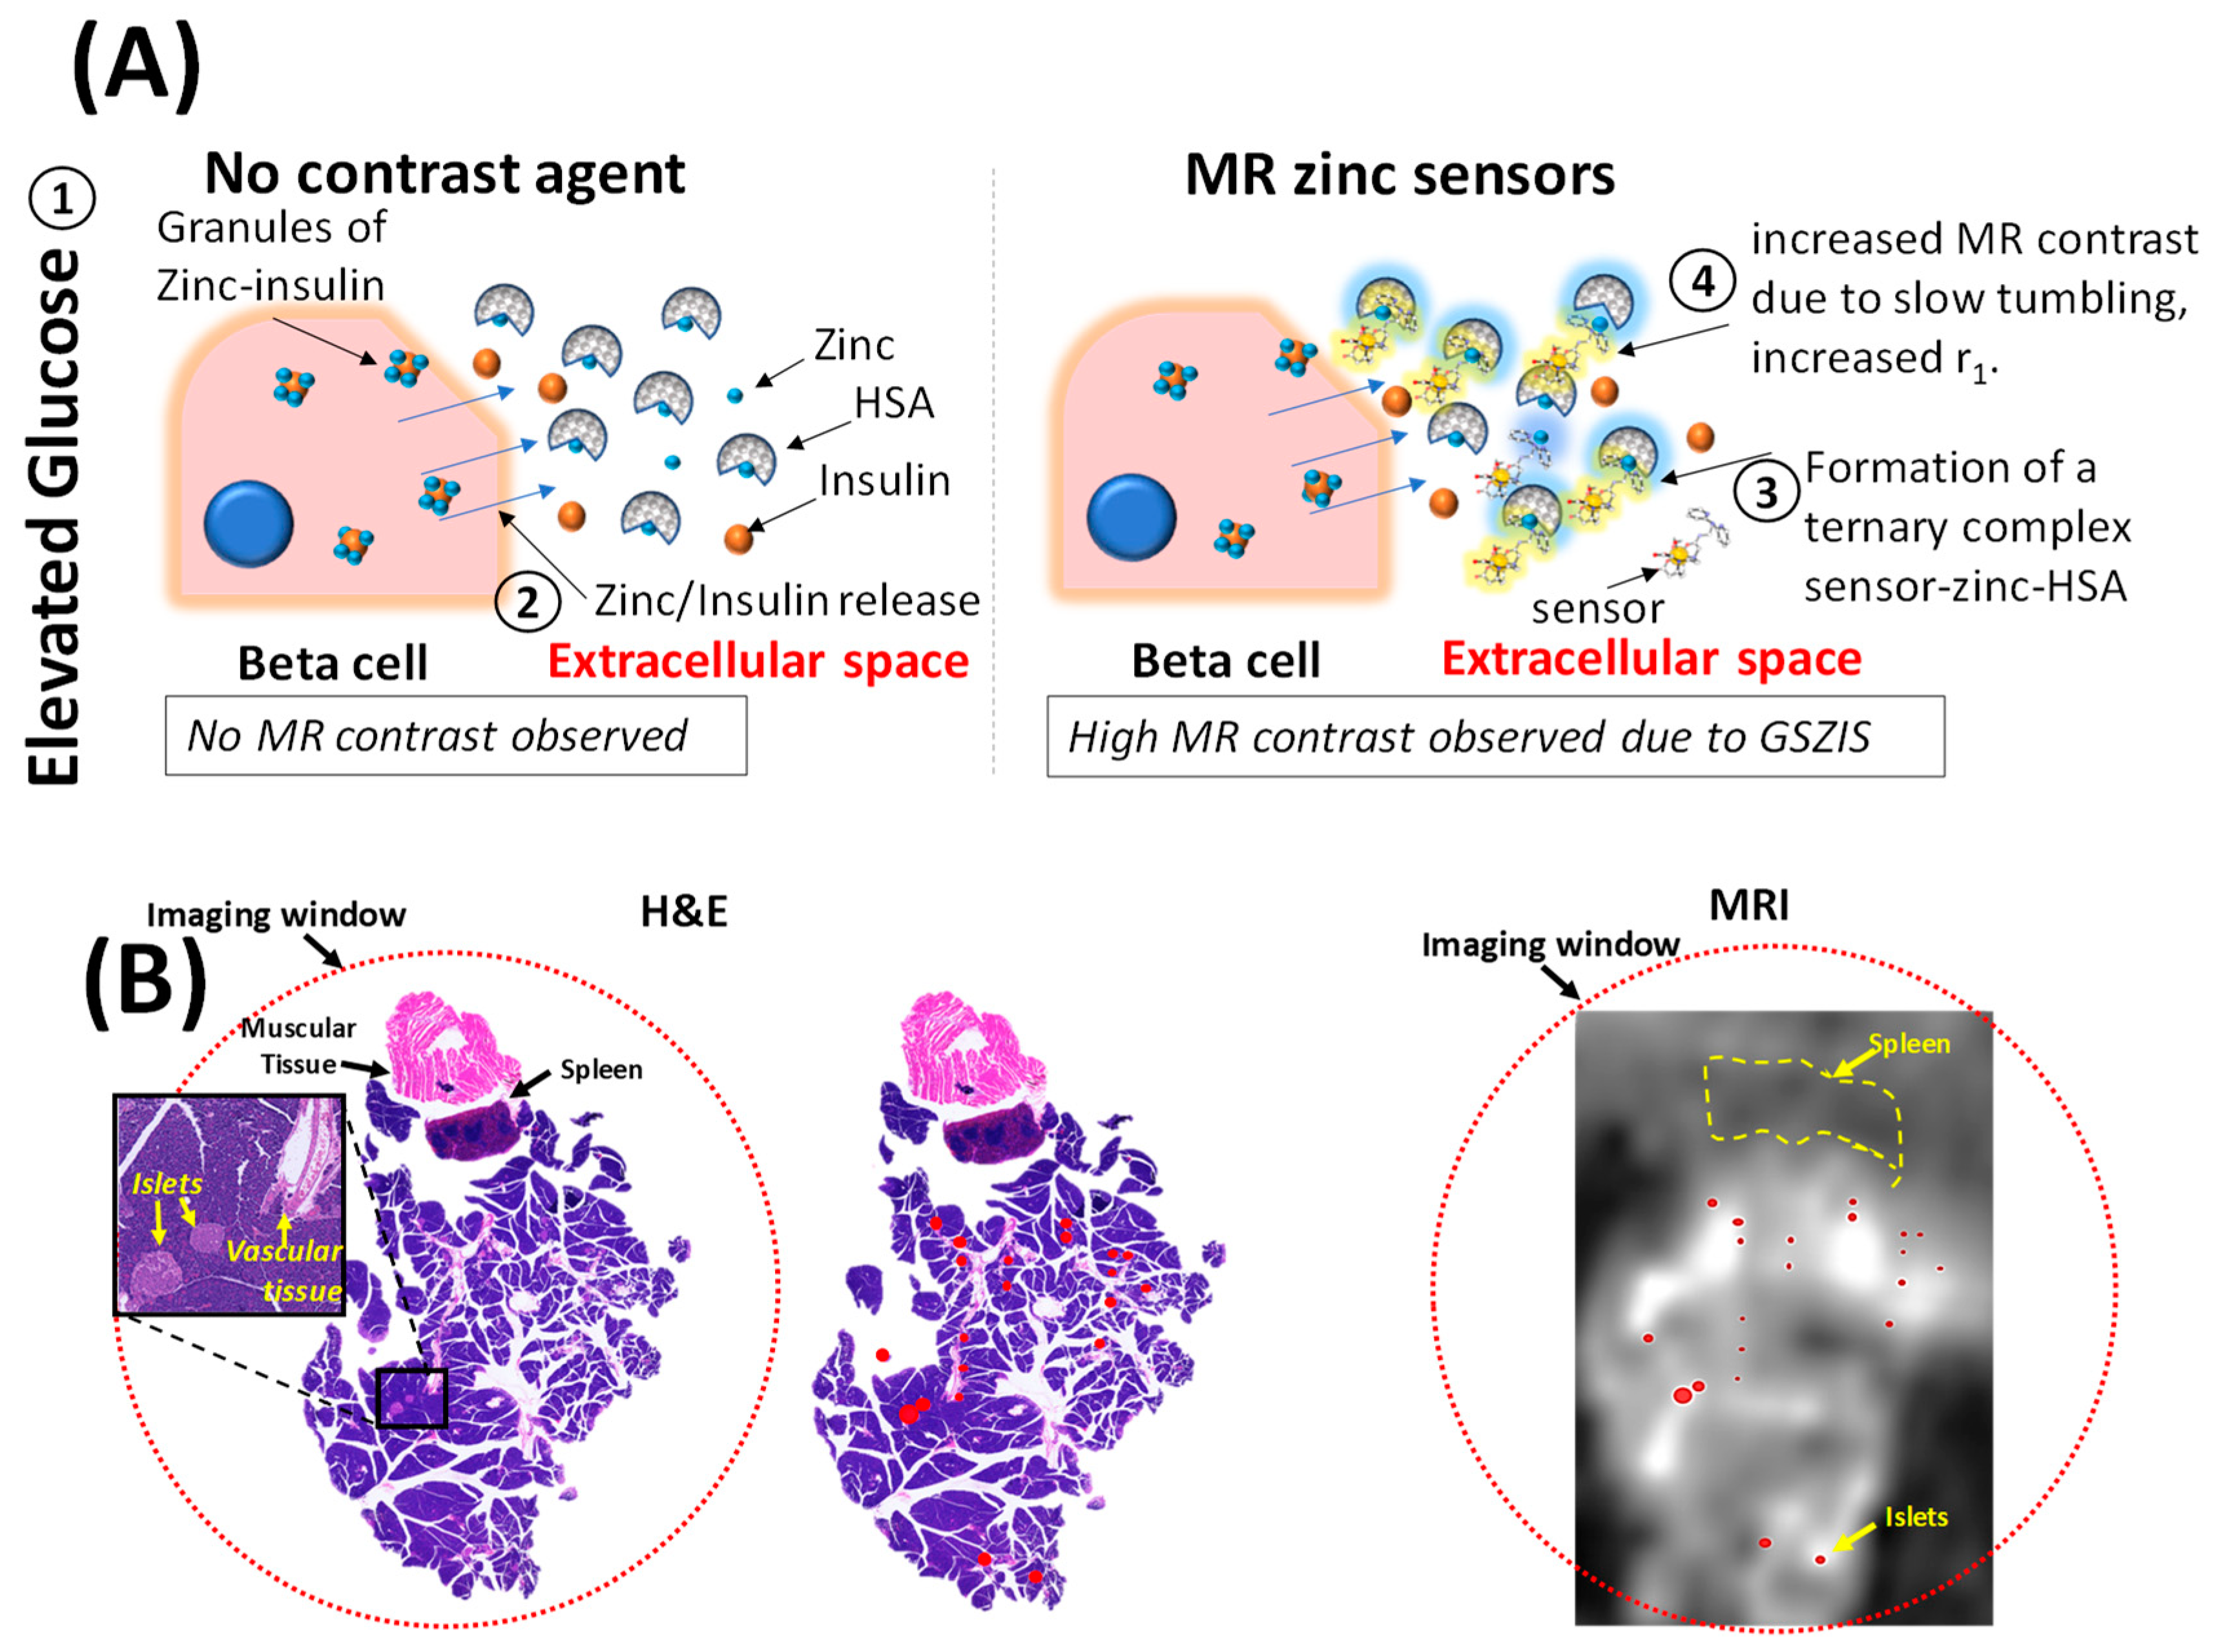
Zinc is a critical trace metal for normal human physiology and function, acting as a cofactor for enzymes, a neurotransmitter, and an important co-secretate in insulin, semen, and breast milk. Zinc is particularly concentrated in the prostate, pancreas, breast, and brain; these are all organs with significant secretory function [37,38,39]. Imaging agents that can detect pathologic alterations in zinc concentrations within these tissues may enhance the sensitivity and specificity of MRI for analysis of these organs; consequently, there has been a significant amount of active research into this area. The first reported agent that could detect Zn2+ with in vivo application is a manganese porphyrin-derivative, Mn(III)-(DPA-C2)2-TPPS3, that could detect contrast enhancement in T1-weighted images from the hippocampus and the caudate–putamen [40,41]. Subsequently, several gadolinium-based Zn2+-responsive CAs have been reported; however, few have made the critical transition from in vitro to in vivo imaging [42,43,44,45]. The typical strategy for zinc-responsive agents is to alter the aminopolycarboxylate macrocyclic ring with a zinc-binding ligand; examples are included in Figure 4. Ligands that have been translated from chemical development to successful in vivo imaging include N,N-bis(2-pyridyl-methyl)ethylenediamine (BPEN), as well as several BPEN derivatives [7,11,12,42,46,47]. When Zn2+ binds to the BPEN ligand, the conformational shift in the molecular structure allows increased water exchange with the gadolinium ion; additionally, the conformational shift allows the zinc-bound molecule to bind to albumin, slowing rotational time (τRR) and further increasing relaxivity [6,12,42]. The ultimate result is a bright enhancement on T1-weighted images in the presence of high concentrations of Zn2+. Alterations to the BPEN ligand, such as changing the length of the alkane chains between nitrogen group (i.e., GdDO3A-BPEN versus GdDO3A-PEPMA (see Figure 4), result in different zinc-binding coefficients and, thus, different zinc affinities. Clinically this is relevant because different zinc affinities produce images with variable intra-organ contrast, which allows phenomena such as dynamic insulin release to be observed. A GdDO3A-BPEN derivative has been successfully applied, in vivo, to detect Zn2+ secretion from secretory organs, specifically, the pancreas and prostate; both of these organs secrete zinc in response to glucose bolus—known as glucose-stimulated insulin/zinc secretion (GSIZS); (Figure 5) [11,12,46]. As such, successful imaging requires a two-injection method: first of the agent, followed by glucose, to stimulate release. These agents have great potential to dramatically enhance MRI imaging of prostate cancer, which suffers from low sensitivity and high false positives, and pancreatic cancer, which currently does not have a useful imaging modality.
2.2.2. Copper-Responsive Contrast Agents
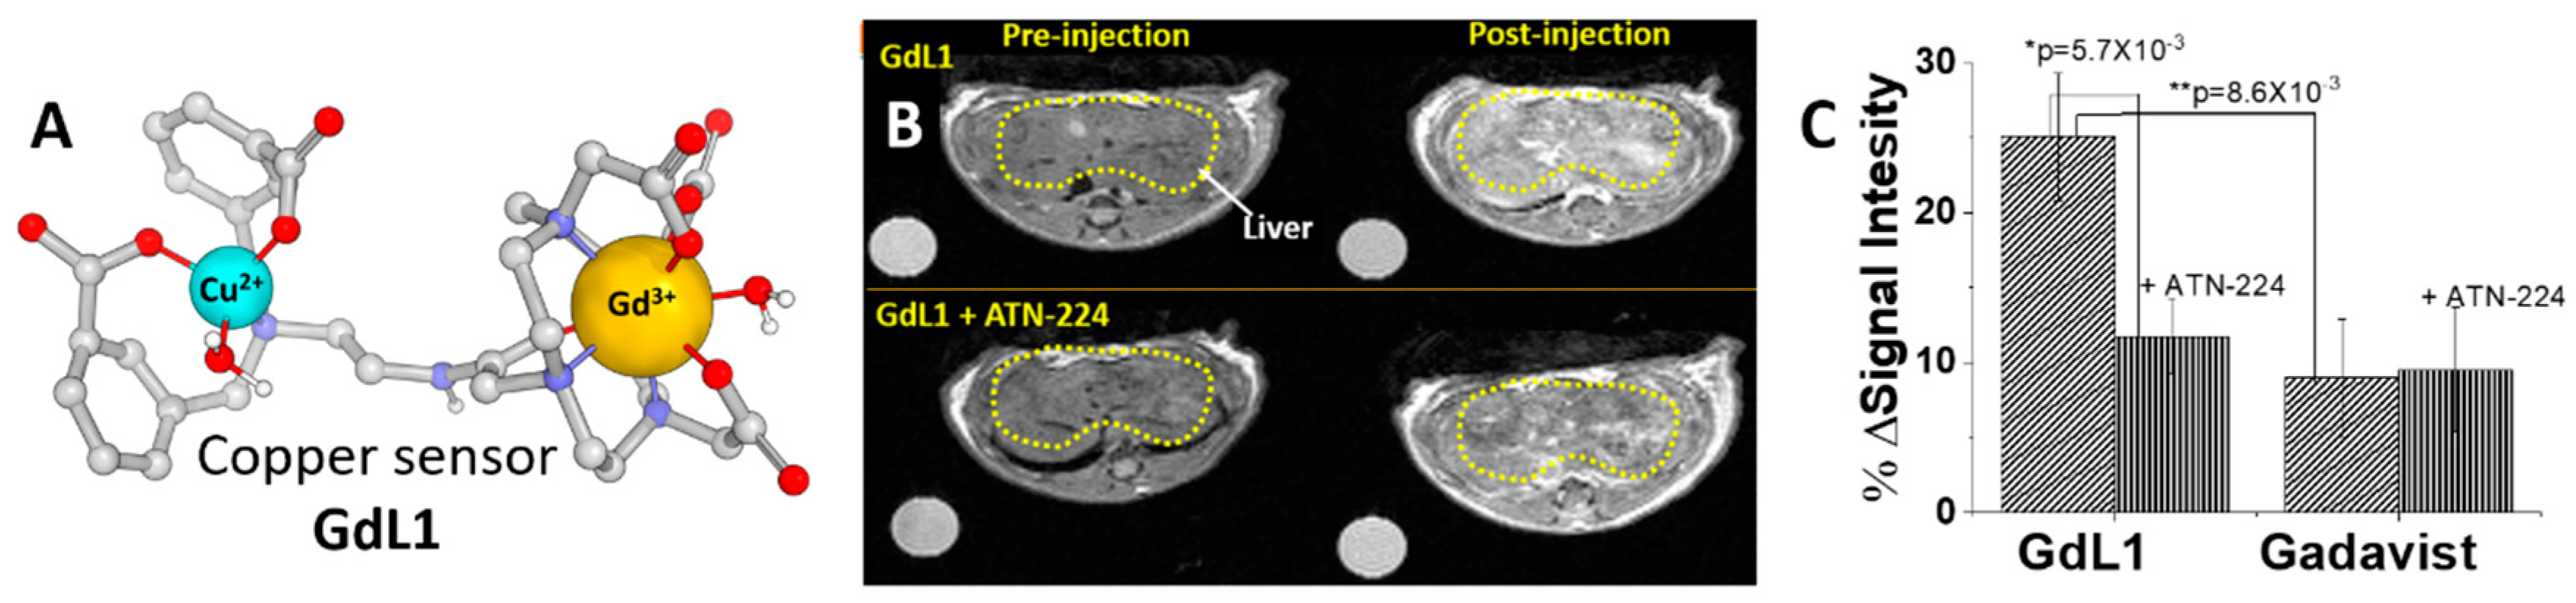
Examples of copper-responsive (either Cu+ or Cu2+; rarely both oxidation states simultaneously) CAs typically involve a aminopolycarboxylate macrocyclic core with a thioether-rich ligand or a bis (benzoic acid) methylamine ligand for copper chelation [48,49,50,51]. In the case of the bis (benzoic acid) methylamine ligand, binding of Cu2+ induces a conformational shift in the molecule which allows the copper-chelated agent to bind to albumin, dramatically reducing the rotational time of the molecule, and is the major mechanism behind the signal enhancement increases [51]. Several of these agents have been tested in a murine cell line for Menke’s disease; the contrast agent displayed significant enhancement in response to the elevated Cu+ in this cell line [50]. Additionally, Paranawithana et al. successfully demonstrated the increased liver enhancement in a live mouse model compared to commercially available agents; to our knowledge, this is the first in vivo use of a Cu2+-responsive contrast agent (Figure 6) [51].
The challenge of clinically translating copper-responsive MRI CAs is the shallow physiologic concentration of copper; agents must be extremely sensitive to extracellular copper concentrations or must be able to cross cell membranes. The potential clinical value of these agents is rooted in the carcinogenic properties of copper. Copper is implicated in angiogenesis by increasing the activity of vascular endothelial growth factor (VEGF), and an increased copper concentration is observed in many different types of neoplasm, including breast; however, it remains to be seen if the concentration falls within the limit of detection, and whether the specific tissue characteristics (i.e., if copper is primarily intracellular versus extracellular) of these cancers is conducive to imaging [52,53,54]. Other targets of copper-responsive MRI CAs are Wilson or Menke disease, though the incidence of these diseases is so low that the clinical use of MRI for evaluation is likely to be insignificant, and the CA would be confined to research purposes only.
2.2.3. Calcium-Responsive Contrast Agents
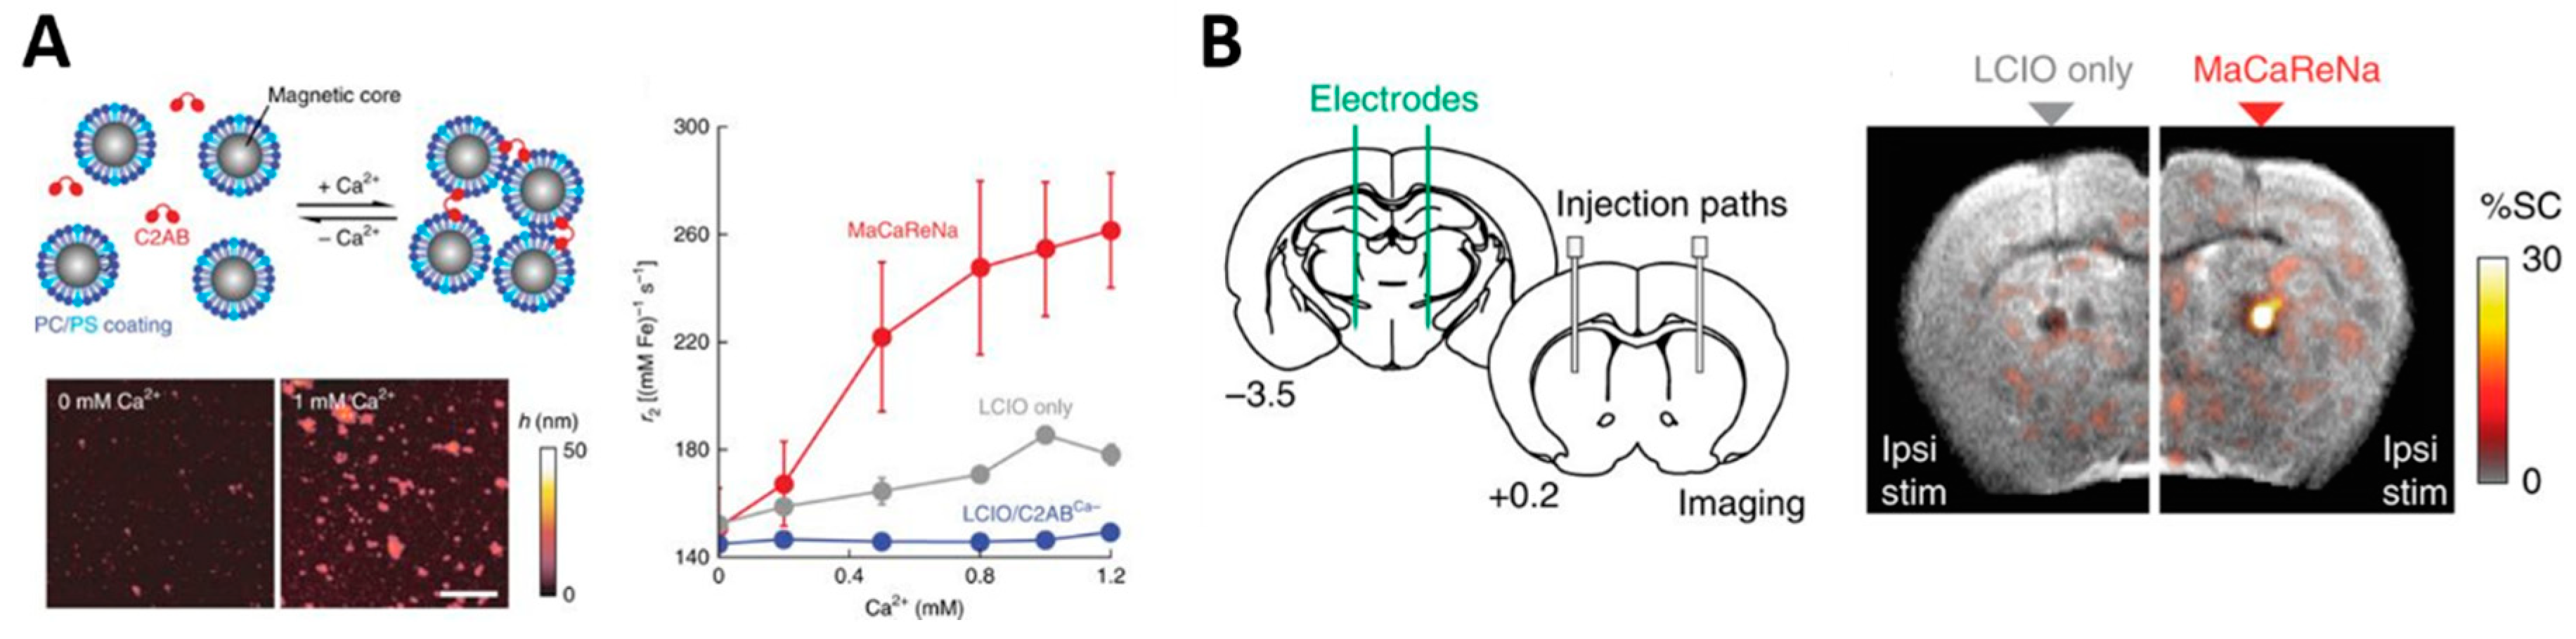
Calcium is crucial for normal physiologic function, acting as a co-factor in countless reactions as well as a critical ion-transporter [55]. Calcium is of particular interest to neurologists and neurobiologists because it is important in neurotransmission [55]. Several calcium-responsive CAs have been developed; the typical strategy is to attach calcium-responsive ligands to the aminopolycarboxylate core. There is a wide variety of ligands that have demonstrated variable calcium affinities at a wide range of concentrations; examples include modified BAPTA (1,2-bis(o-aminophenoxy)-ethane-N,N,N′,N′-tetraacetic acid), modified EDTA (ethylenediamine tetraacetic acid), and ligand arms with bisphosphonate groups [56,57,58]. Relaxivity increases upon binding calcium, ranging from 32% to 97%; responsive concentration ranges are also variable but are typically within the millimolar range. Binding specificity remains a problem with these compounds; often, there is competitive binding from zinc and magnesium [56,57,58]. Several of these agents have been tested in vivo (mainly for T2-imaging with nanoparticles), particularly in neuroimaging, where calcium acts as a neurotransmitter (Figure 7) [59,60,61]. Typically, these agents are injected intracisternally at concentrations in the low micromolar range. Additionally, several calcium-responsive paraCEST agents have been developed [62], as well as several functional MRI (fMRI) methods using oligomerization/aggregation of calcium-responsive agents [63,64]. These agents remain under use as a research tool only; to our knowledge, there are no active clinical translational approaches underway.
2.2.4. Other Metal Ions
Additional CAs that are responsive to potassium and magnesium have been developed and chemically characterized; however, to our knowledge, none of these agents have been used in an in vivo setting, although some agents have been tested in vitro [65,66,67,68]. Unfortunately, due to space constraints, these imaging agents will not be further discussed in this review. A summary of the agents discussed, and their current developmental progress, is listed below in Table 1.
2.3. Extracellular pH Contrast Agents Applied In Vivo
Extracellular pH is another biomarker of enormous importance for the detection of metabolic diseases, such as cancer, acidosis, and kidney failure. For instance, in an aggressive cancer, the extracellular pH in the local tumor environment tends to become acidic due to increased lactic acid production, reduced buffering capacity, and poor perfusion. Enormous efforts have been made to map pH in tissues and regulatory organs, such as the kidney; however, mapping the extracellular pH has proven quite challenging. A rare example of the application of an inorganic agent to measure extracellular pH comes from the gadolinium complex GdDOTA-4AMP. This complex has a stable DOTA backbone derivatized with four amido-phosphonate groups. The inner-sphere bound water exchange rate is not significantly altered at a physiologic pH range [6,7,8], but its protons are catalyzed by the pendant phosphonates that affect the second-sphere relaxivity (prototropic effect). This complex showed an r1 relaxivity percentage enhancement around 140% in the pH region of 6 to 7.4 [71]. When applied alone in vivo, this agent cannot map the extracellular pH because the concentrations of agent in the tissues are unknown; however, administered together with the pH-independent GdDOTP or DyDOTP (sequentially or as a cocktail), the concentration of agent can then be calculated, and the extracellular tissue pH could be successfully mapped in the kidneys and a mouse brain tumor model [69,70]. This strategy does have a major limitation because one has to assume that both contrast agents have the same distribution and pharmacokinetics for accurate calculations. Additionally, agents were given at a constant infusion of 0.2 to 0.4 mmol contrast agent per kilogram animal mass per hour of GdDOTA-4AMP, and 0.4 to 0.8 mmol contrast agent per kilogram animal mass per hour of DyDOTP (1:2 ratio of GdDOTA-4AMP to DyDOTP). A typical clinical MRI requires a single bolus dose; a constant infusion adds another layer of complexity, which may be difficult to translate into humans.
2.4. Tissue-Specific Contrast Agents
The rationale and current state-of-the-art behind tissue-specific contrast agents have been covered in a prior review; therefore, we shall omit this for our review.
3. T2 and T2-Exchange Agents In Vivo
T2 contrast agents decrease the water signal intensity by shortening the transverse relaxation times. Given the growth of higher magnetic field MRI scanners in clinical practice, T2 contrast agents can be an efficient solution for high field applications, since the transverse relaxivity (r2) increases at high fields [6,72]. To date, many in vivo applications of T2 agents are found in the literature [73,74,75,76], but only a few iron nanoparticle-based agents have received FDA approval: SPIO (superparamagnetic, 50–500 nm), USPIO (ultrasmall superparamagnetic, 4–50 nm). However, due to slow pharmacokinetics and undesirable pharmacodynamics, production of both of these agents have been discontinued [8].
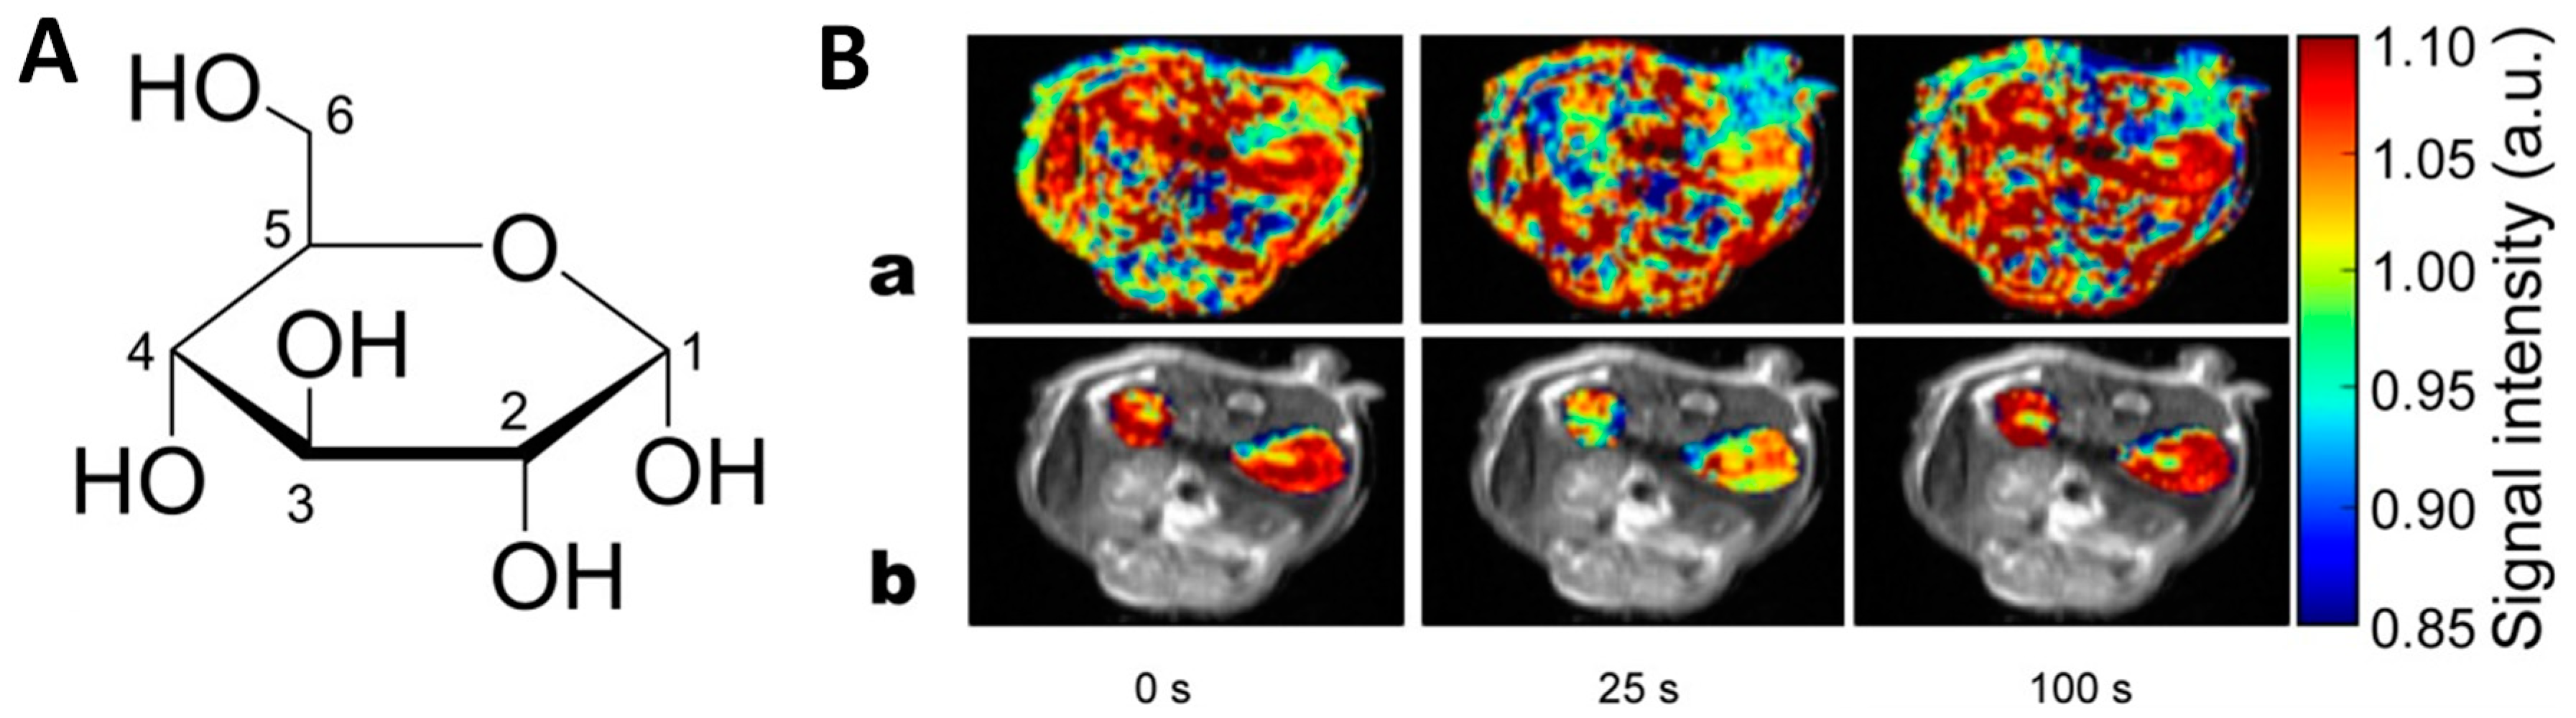
Recently, a new class of T2-agents, T2-exchange (T2ex) agents, have been explored. T2ex-agents are usually small molecules, similar to the Gd3+ agents already in clinical use, and provide some advantages over the conventional iron nanoparticles [13,14,77]. The effect arises from the chemical exchange of protons that exchange differently from the bound water and at an intermediate pace—slower than that required for a common T1-agent (see Figure 3). To the best of our knowledge, so far, none of the inorganic T2ex-agents have been successfully applied in vivo. However, some progress has been demonstrated with diamagnetic molecules containing exchangeable –OH groups, as it is the case that glucose and maltose showed accurate detection of hyperglycolytic tumor regions in a mouse model (Figure 8 and Table 2) [78,79].
4. CEST Agents
4.1. Mechanism of CEST
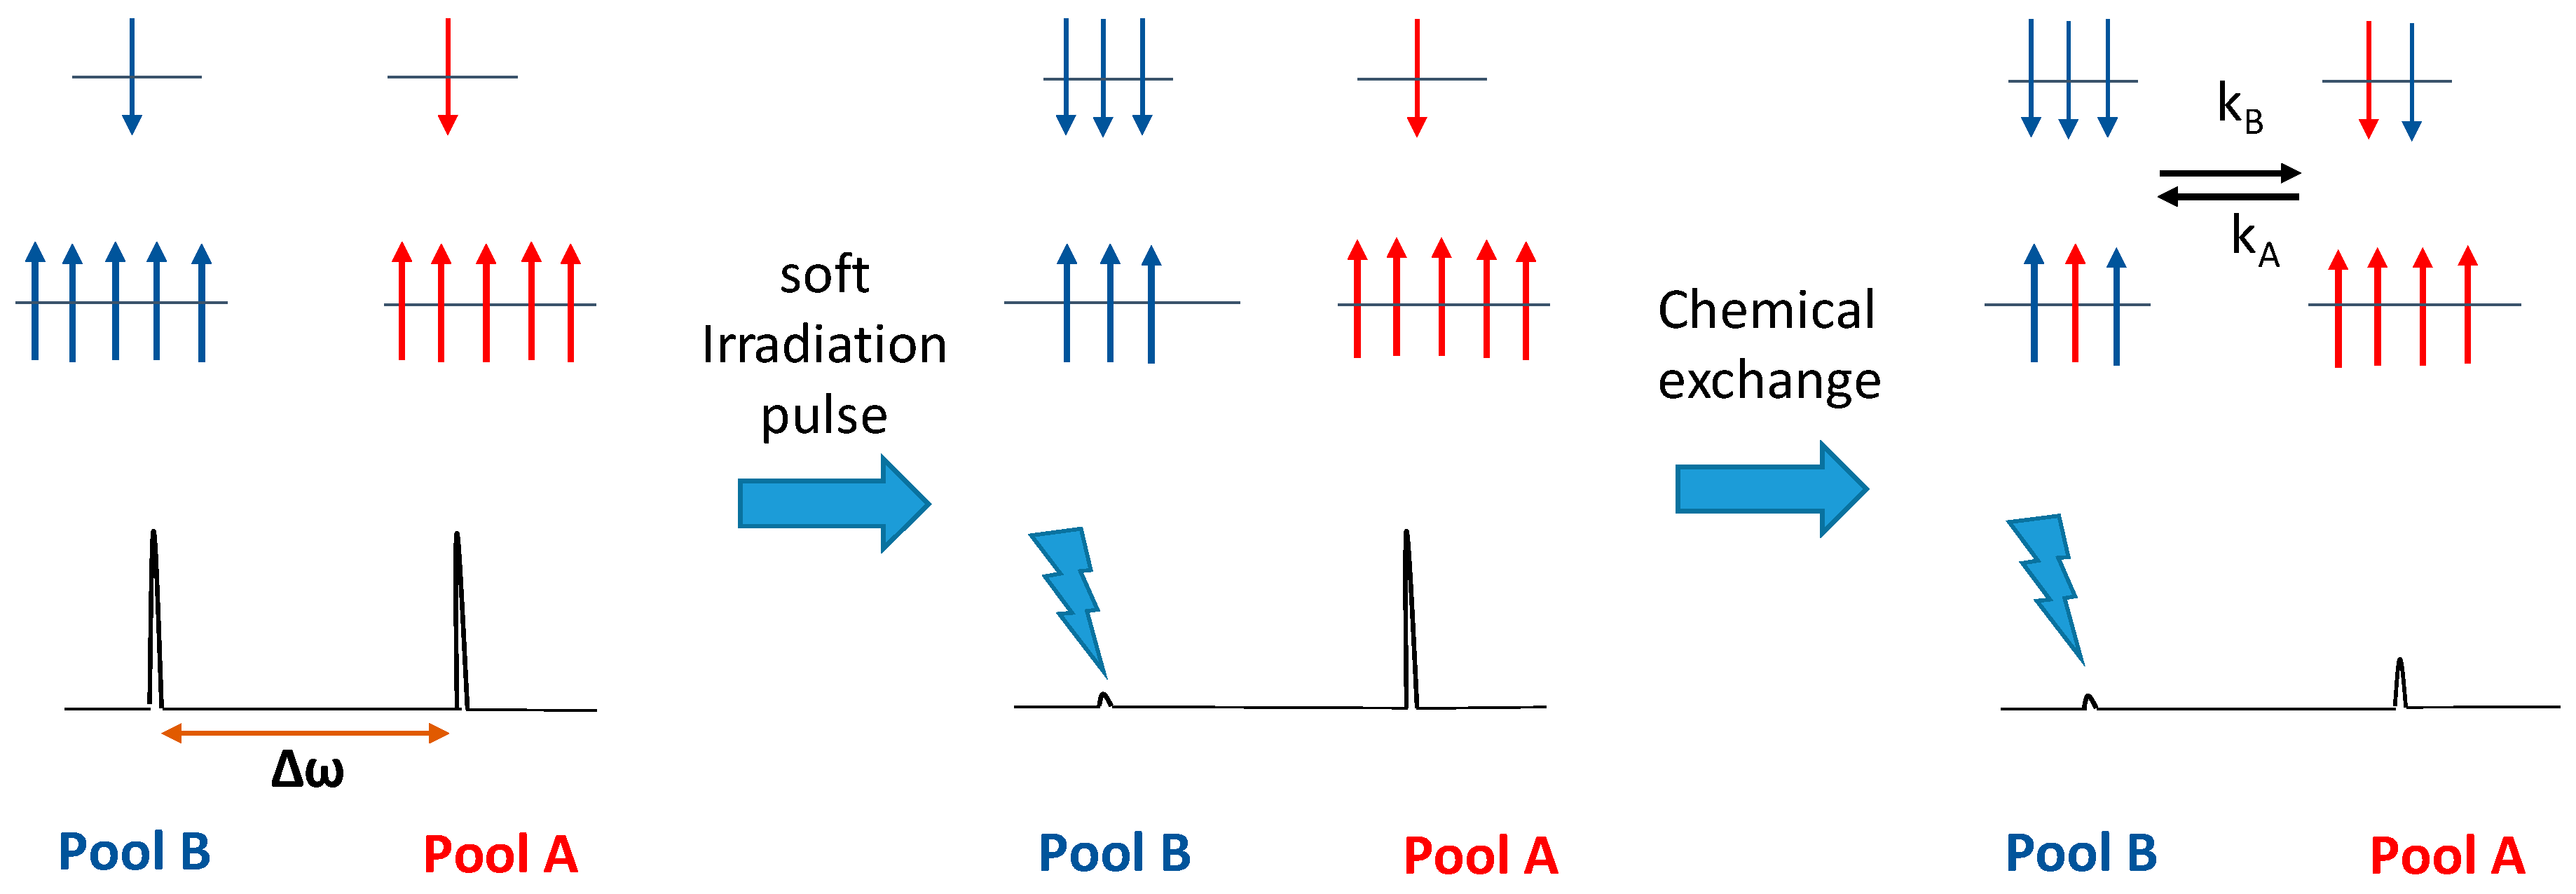
A new generation of contrast agents based on chemical exchange saturation transfer (CEST) has recently emerged. CEST operates in a completely different mechanism than T1-agents; in CEST, saturation competes with relaxation, which means that exchange of saturation between two proton pools should take place before relaxation occurs. For CEST to be observed, the frequency difference between two pools, ∆ω, must be ≥kex (rate of exchange between the pools). As shown in Figure 9, when a long pre-saturation pulse is applied selectively to one pool of protons (Pool B in the Figure 9), it will start exchanging at a slow–intermediate rate with the bulk water protons (Pool A in the Figure 9). Image contrast is produced by the exchange of those spins with the bulk water proton pool—by reducing the MR signal intensity of the tissue water—thereby creating negative image contrast [15].
Since kex is sensitive to a variety of chemical and physical factors, various types of responsive CEST agents have been developed with a variety of physiologic targets, including changes in tissue pH, as biomarkers for metabolic markers and ions, to monitor enzyme activity and changes in the oxidation state.
4.2. DIACEST Agents (Diamagnetic Molecules with Exchangeable Protons)
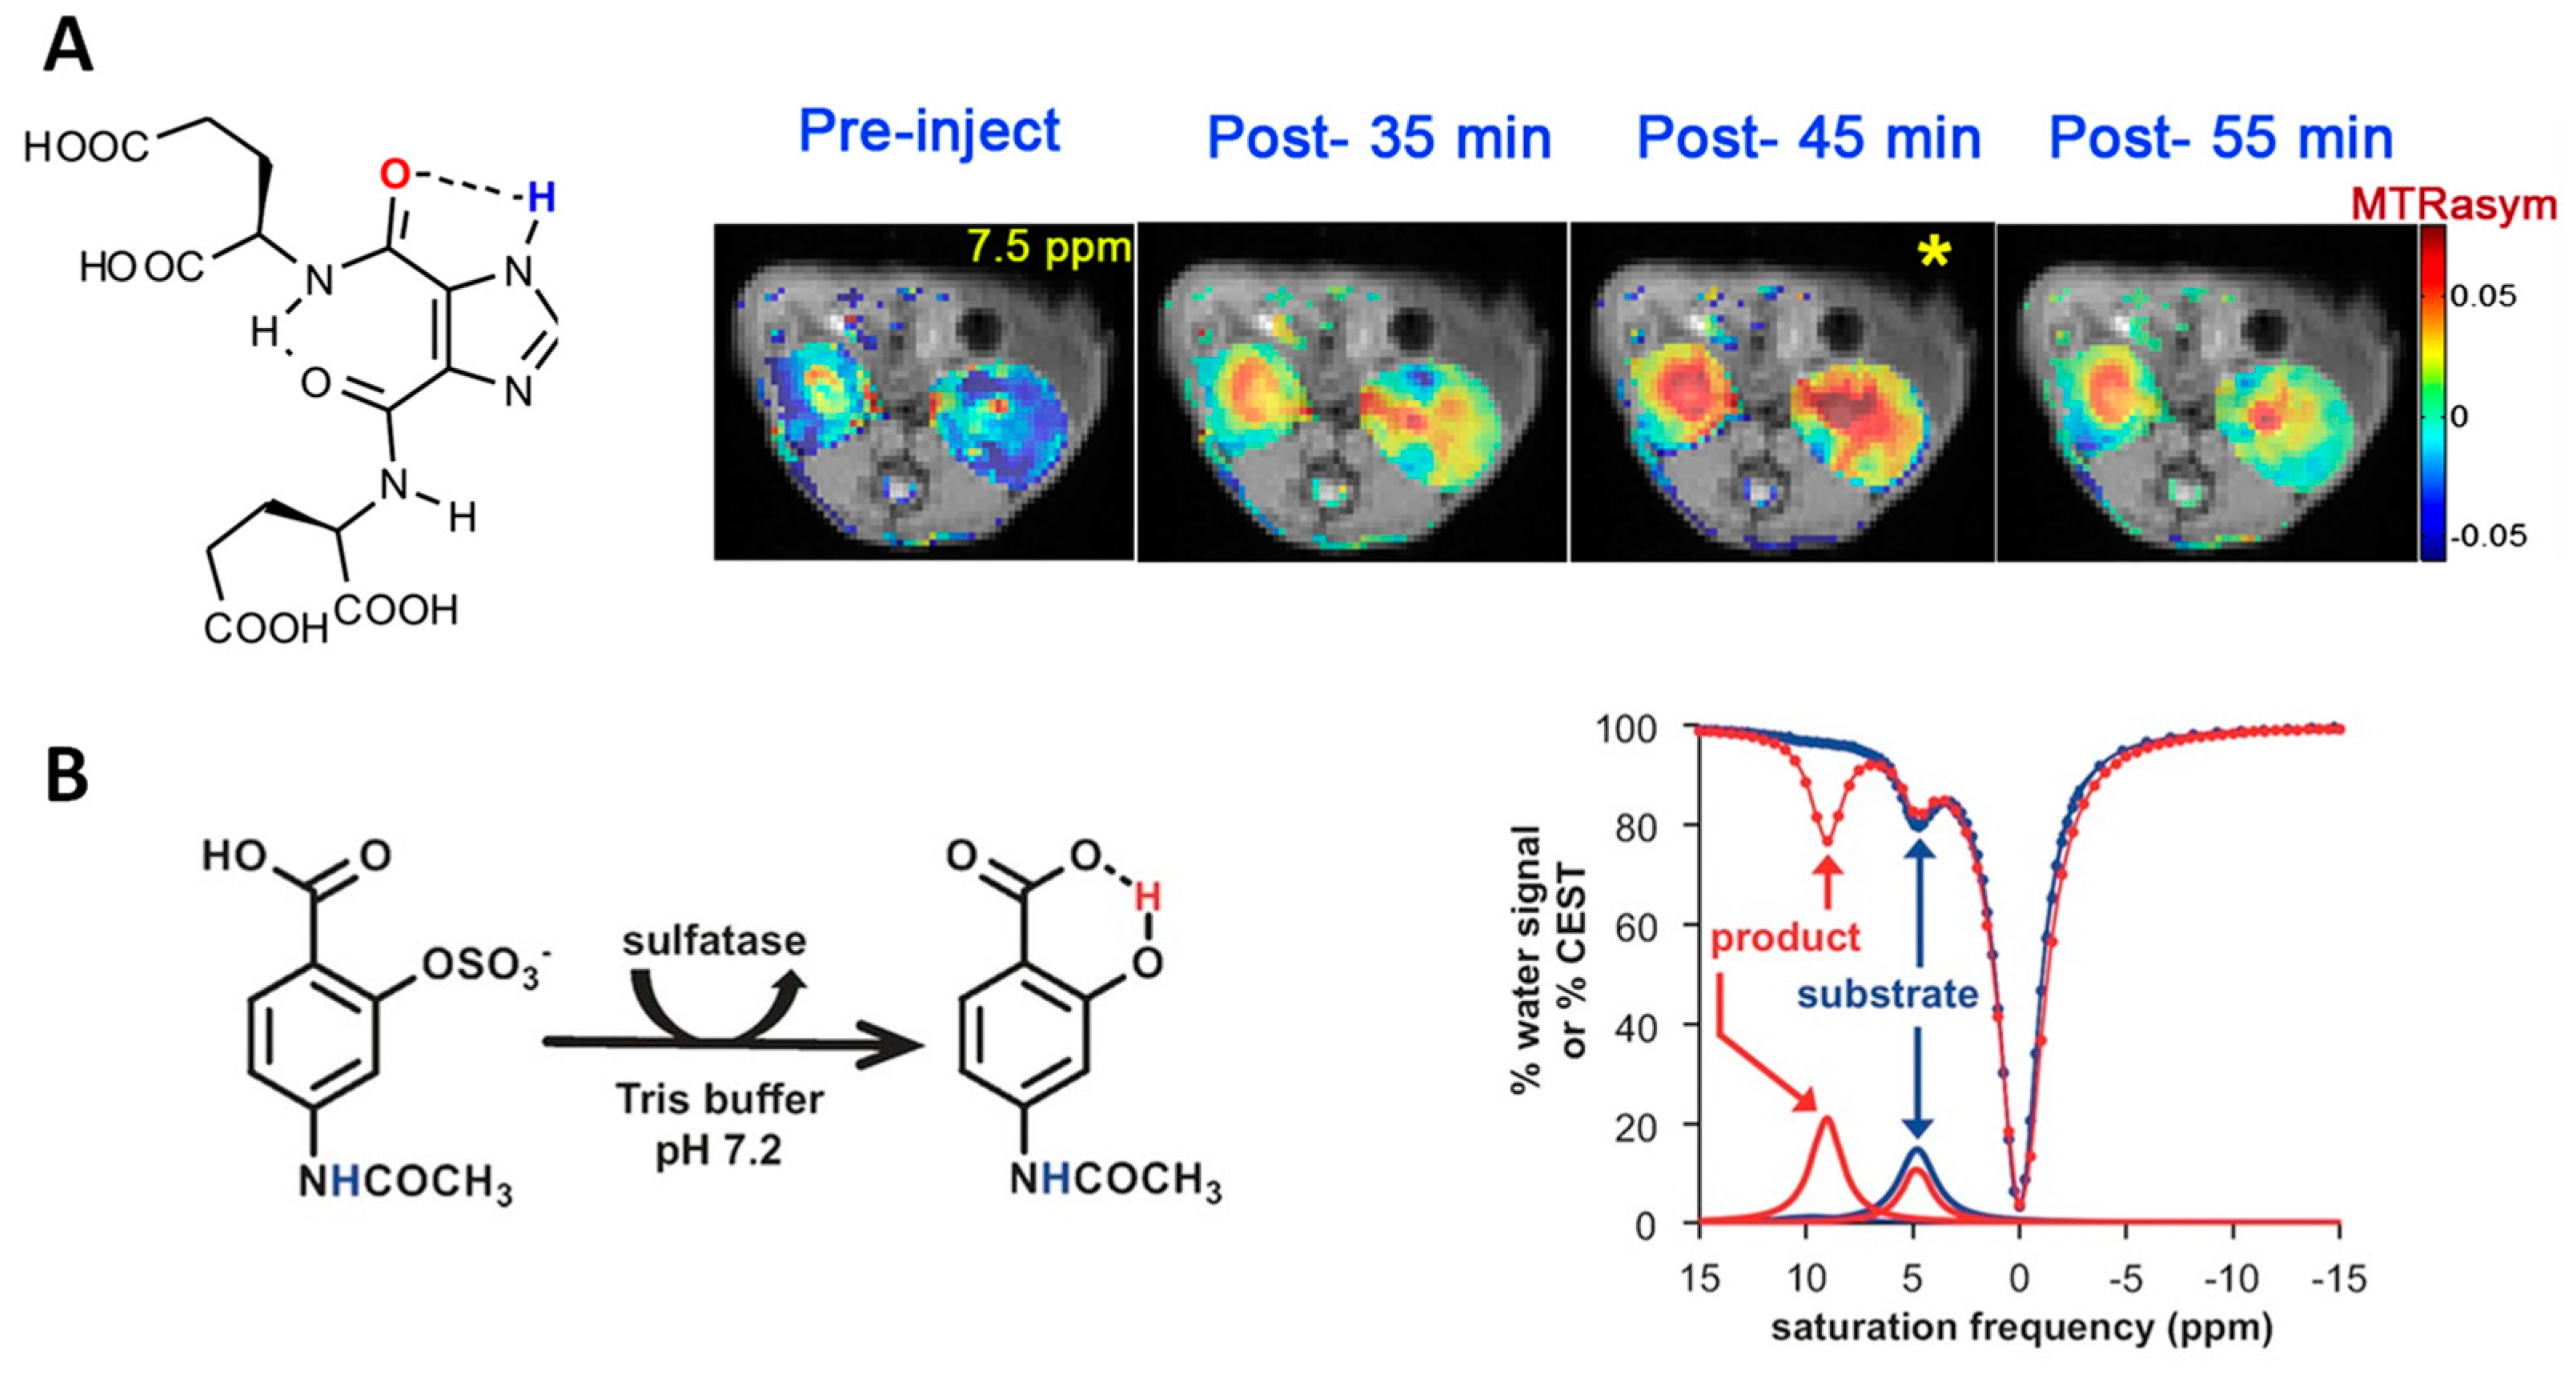
With the introduction of the CEST technique, sugars, amino acids, and another low-molecular-weight diamagnetic (diaCEST) molecules with exchangeable protons, such as –NH and –OH groups have been tested as contrast agents. Often, these agents are low molecular weight compounds with high biocompatibility. Glucose and iopamidol are two diaCEST agents that have been approved for intravenous administration, and are currently under study in human clinical trials [80,81]. Other successful examples with in vivo applications include a new pH-sensitive diaCEST agent (an imidazole-4,5-dicarboxamide) which displays a CEST signal at 7.8 ppm from water, with improved sensitivity and specificity compared to existing agents (i.e., gluCEST and APT CEST agents; Figure 10A) [82,83,84,85]. In addition, this probe is strongly pH-dependent, which allowed the successful measurement of the pH of a mouse kidney (Figure 10). This behavior has already found to agree with the acid–base properties of imidazole-4,5-dicarboxamides [83]. A potential application of diaCEST agents is the in vivo monitoring of enzyme catalysis, in which an enzyme either inactivates or deactivates a target molecule by modulating the exchangeable protons (CatalyCEST MRI) [86]. An example of a target enzyme is sulfatase [86]. Although various methods are used to study sulfatases in vitro, an in vivo sensor may help to understand the biological role of these enzymes. Sulfatase dysfunction is associated with numerous pathologies, including developmental abnormalities, hormone-dependent cancer, and bacterial infection [87]. Salicylic acid has been shown to produce a remarkable CEST signal at a frequency of 9 ppm relative to water frequency (also known as the chemical shift, in which the chemical shift of water is defined as δ = 0 ppm in MRI studies) [88,89]. As shown in Figure 10, the enzymatically cleaved salicylic acid derivative (4-acedamido-2-(sulfoxy)benzoic acid) eliminates the CEST signal at 5 ppm from the pre-cleaved salicylic acid proton (Figure 10B, blue CEST spectrum), and generates a CEST signal at 9 ppm (Figure 10B, red CEST spectrum) [83]. This “activation” of the CEST signal is used to detect sulfatase enzyme activity. Also, to improve detection specificity, an aryl amide ligand (at 5 ppm) that would be unresponsive to sulfatase activity has been introduced to the structure, and thereby serves as an internal control. These CEST spectra were produced from HEK293 human embryonic cell line, which is known to express extracellular sulfatase enzymes [90]. Properties, including relatively higher sensitivity to the local biological environment, biocompatibility, higher solubility, and non-toxicity, make these diaCEST agents a promising group of MRI contrast agents with excellent potential for clinical translation [91].
A limitation of diaCEST is that the frequency difference (∆ω), between the contrast agent exchangeable protons and the bulk waters, is in a concise range of approximately 0.8–10 ppm [92,93]. This small range limit makes it challenging to distinguish between molecules contributing to CEST selectively [4,94]. In addition, since the bulk water resonance is broadened, in vivo, because of local magnetic field inhomogeneities, the chemical shift difference between bulk water peak and exchangeable protons in the agents needs to be maximized to overcome further artifacts. Because of these complications generally, a high dose of diaCEST agent is required for detecting CEST in vivo (Table 3) [93]. These limitations have been recently overcome with the combination of CEST with other advanced MR techniques [95].
4.3. paraCEST Agents (Paramagnetic Molecules with Exchangeable Protons)
A strategy to overcome some limitations of diaCEST is to use paraCEST agents based on paramagnetic lanthanide ions. These agents achieve larger chemical shifts (∆ω), which minimize an off-saturation of the bulk water pool. ParaCEST allows for faster water exchange rates compared to diaCEST, but should remain within the slow water exchange condition, kex < ∆ω (Figure 11). As represented in Figure 11, the larger chemical shift difference (Δω) induced by the paramagnetic ion from EuDOTA-4AmCE3+ allows for a more precise saturation pulse and contributes for a selective investigation of the agent (~45 vs. ~5.5 ppm from barbituric acid and other endogenous molecules). ParaCEST agents shift the MR frequency of labile protons to values that can range from +500 to −720 ppm from the MR frequency of water [92,100,101]. The effectiveness of a CEST agent critically depends on the water exchange rate (kex) between paramagnetic metal ion-bound inner-sphere water protons and bulk water, the water residence lifetime of a contrast agent, τM (τM = 1/kex). In other words, the amount of time the inner-sphere water molecule remains bound to the paramagnetic metal [19]. ParaCEST agents can be activated by frequency-selective irradiation of the highly shifted bound water peak (Figure 11, right). Typically, to detect a CEST signal in vivo, one requires a dose of the agent in the range of 0.05–1.0 mmol/kg [96]. Although numerous CEST agents have been demonstrated to work in vitro, translation of these agents in vivo has been hindered by the fact that these agents can be affected by many external factors: the exchange with tissues, perfusion, pH, temperature variation, high saturation power levels, and the higher dose required to produce an accurate detection being not suitable for in vivo applications [14,96,102].
Despite the challenges associated with paraCEST agents, some agents have made their way towards in vivo translation. For example, in Figure 12A, a pH-responsive agent (an Eu-DOTA-monoketone-tris(amide) complex) was used to image kidney pH in vivo, which could potentially have diagnostic value in detecting kidney failure and acidosis. This Eu3+-based complex contains a phenolic group in its structure. The deprotonation of the phenolic group results in delocalization of excess negative charge from the phenolic oxygen via the aromatic ring to the acetyl oxygen atom directly coordinated to the Eu3+ ion. This small change yields a large shift in frequency of the Eu3+-bound water molecule, which can be used to study physiologic pH variations independent of the concentration of agent (Figure 12A) [96]. Another example is a redox-sensitive bimodal MR contrast agent (Figure 12B). Macrocyclic Eu2+ poly(amino carboxylate) chelates are used as redox-responsive T1-agents because oxidation of Eu2+ leads to the formation of weakly paramagnetic Eu3+, which has little impact on water proton T1. Therefore, Eu2+ complex is used as a T1 shortening agent because of the rapid water exchange of the Eu2+-bound water but, upon oxidation into Eu3+, Eu-DOTA-gly4 exhibits CEST from the coordinated bound waters with slow water exchange kinetics [97]. A final example of a paraCEST agent is EuDO3A, which is a stable complex capable of detecting extracellular lactate in vivo, with further evidence of lactate quantification in the bladder (Figure 12C). EuDO3A binds to lactate bidentate and can shift the lactate-OH proton resonance away from the bulk water signal while retaining the CEST properties of lactate itself [98]. It is well known that lactate is overproduced by most tumors and secreted to the extracellular space, even in the presence of abundant oxygen (known as the Warburg effect); therefore, a method that allows direct imaging of extracellular lactate production by tumors could provide a more precise evaluation of cancer metabolism by MRI [98,103,104]. This has successfully been demonstrated in an in vivo mouse model (Figure 12C). While interesting, to our knowledge, no paraCEST agent is currently under consideration for human trials. The main reason for this is the inability to produce an effective CEST signal for accurate detection at concentrations and saturation power levels that are clinically acceptable and safe for human applications [19,92,102]. Table 2 shows the doses required for the CEST agents, discussed in this review, to produce effective CEST signals.
5. Conclusions
The ability of contrast agents to magnify the effectiveness of standard MRI was foreseen at the advent of clinical MRI, and contrast agents have maintained their status as an indispensable clinical tool since the first agent was released in 1982. In the preceding decades, many obstacles were encountered, particularly for the iron-based nanoparticles and some unstable gadolinium-based complexes but, also, immense progress has been observed developing more functional CAs. It is currently more challenging to approve and make the investment on an inorganic-based contrast agent for clinical use. At the same time, imaging requires accurate and personalized methods that allow monitoring disease and treatment at a molecular scale. Much work has been accomplished developing “smart” contrast agents, responsive to a diverse range of physiologic functions, and many of them showed great promise when applied in live animal models. Whether it is detecting biogenic metals involved in critical cell signaling processes, or detecting specific extracellular biomarkers, the development of a diverse range of responsive agents has the potential to revolutionize clinical diagnosis. It is through the combined efforts of inorganic chemists, biologist, and physicians that these advances are made possible, and it is only through combined efforts that they will be translated from the test tube to clinical MRI. We are optimistic about the future of chemical imaging probes, and believe that a new era of multimodal, functional, and personalized agents will bring good augurs for medical imaging.
Author Contributions
D.P. and W.S.F. contributed equally. A.F.M. supervised the project and co-drafted the manuscript. All authors read and approved the manuscript.
Funding
This research received no external funding.
Conflicts of Interest
The authors declare no conflict of interest.
References
- Wolf, G.L. Current status of MR imaging contrast agents: Special report. Radiology 1989, 172, 709–710. [Google Scholar] [CrossRef] [PubMed]
- Gahramanov, S.; Muldoon, L.L.; Varallyay, C.G.; Li, X.; Kraemer, D.F.; Fu, R.; Hamilton, B.E.; Rooney, W.D.; Neuwelt, E.A. Pseudoprogression of Glioblastoma after Chemo- and Radiation Therapy: Diagnosis by Using Dynamic Susceptibility-weighted Contrast-enhanced Perfusion MR Imaging with Ferumoxytol versus Gadoteridol and Correlation with Survival. Radiology 2013, 266, 842–852. [Google Scholar] [CrossRef] [PubMed]
- Gonzalez, G.; Powell, D.H.; Tissieres, V.; Merbach, A.E. Water-exchange, electronic relaxation, and rotational dynamics of the MRI contrast agent [Gd(DTPA-BMA)(H2O)] in aqueous solution: A variable pressure, temperature, and magnetic field 17O NMR study. J. Phys. Chem. 1994, 98, 53–59. [Google Scholar] [CrossRef]
- Werner, E.J.; Datta, A.; Jocher, C.J.; Raymond, K.N. High-relaxivity MRI contrast agents: Where coordination chemistry meets medical imaging. Angew. Chem. Int. Ed. Engl. 2008, 47, 8568–8580. [Google Scholar] [CrossRef]
- Sherry, A.D.; Wu, Y. The importance of water exchange rates in the design of responsive agents for MRI. Curr. Opin. Chem. Biol. 2013, 17, 167–174. [Google Scholar] [CrossRef] [PubMed]
- De León-Rodríguez, L.M.; Martins, A.F.; Pinho, M.C.; Rofsky, N.M.; Sherry, A.D. Basic MR relaxation mechanisms and contrast agent design. J. Magn. Reson. Imaging 2015, 42, 545–565. [Google Scholar] [CrossRef] [PubMed]
- Yu, J.; Martins, A.F.; Preihs, C.; Clavijo Jordan, V.; Chirayil, S.; Zhao, P.; Wu, Y.; Nasr, K.; Kiefer, G.E.; Sherry, A.D. Amplifying the Sensitivity of Zinc(II) Responsive MRI Contrast Agents by Altering Water Exchange Rates. J. Am. Chem. Soc. 2015, 137, 14173–14179. [Google Scholar] [CrossRef]
- Wahsner, J.; Gale, E.M.; Rodríguez-Rodríguez, A.; Caravan, P. Chemistry of MRI Contrast Agents: Current Challenges and New Frontiers. Chem. Rev. 2018. [Google Scholar] [CrossRef]
- Merbach, A.E.; Helm, L.; Toth, E. The Chemistry of Contrast Agents in Medical Magnetic Resonance Imaging, 2nd ed.; John Wiley & Sons: Chichester, UK, 2013; ISBN 0-471-60778-9. [Google Scholar]
- Lee, S.Y.; Gallagher, D. Assessment methods in human body composition. Curr. Opin. Clin. Nutr. Metab. Care 2008, 11, 566–572. [Google Scholar] [CrossRef]
- Jordan, M.V.C.; Lo, S.-T.; Chen, S.; Preihs, C.; Chirayil, S.; Zhang, S.; Kapur, P.; Li, W.-H.; Leon-Rodriguez, L.M.D.; Lubag, A.J.M.; et al. Zinc-sensitive MRI contrast agent detects differential release of Zn(II) ions from the healthy vs. malignant mouse prostate. Proc. Natl. Acad. Sci. USA 2016, 113, E5464–E5471. [Google Scholar] [CrossRef]
- Martins, A.F.; Clavijo Jordan, V.; Bochner, F.; Chirayil, S.; Paranawithana, N.; Zhang, S.; Lo, S.-T.; Wen, X.; Zhao, P.; Neeman, M.; et al. Imaging Insulin Secretion from Mouse Pancreas by MRI Is Improved by Use of a Zinc-Responsive MRI Sensor with Lower Affinity for Zn2+ Ions. J. Am. Chem. Soc. 2018, 140, 17456–17464. [Google Scholar] [CrossRef] [PubMed]
- Daryaei, I.; Pagel, M.D. Double agents and secret agents: The emerging fields of exogenous chemical exchange saturation transfer and T2-exchange magnetic resonance imaging contrast agents for molecular imaging. Res. Rep. Nucl. Med. 2015, 5, 19–32. [Google Scholar]
- Zhang, L.; Martins, A.F.; Zhao, P.; Wu, Y.; Tircsó, G.; Sherry, A.D. Lanthanide-Based T2ex and CEST Complexes Provide Insights into the Design of pH Sensitive MRI Agents. Angew. Chem. Int. Ed. 2017, 56, 16626–16630. [Google Scholar] [CrossRef] [PubMed]
- Ward, K.M.; Aletras, A.H.; Balaban, R.S. A New Class of Contrast Agents for MRI Based on Proton Chemical Exchange Dependent Saturation Transfer (CEST). J. Magn. Reson. 2000, 143, 79–87. [Google Scholar] [CrossRef] [PubMed]
- Viswanathan, S.; Kovacs, Z.; Green, K.N.; Ratnakar, S.J.; Sherry, A.D. Alternatives to Gadolinium-based MRI Metal Chelates. Chem. Rev. 2010, 110, 2960–3018. [Google Scholar] [CrossRef] [PubMed]
- Vinogradov, E.; Sherry, A.D.; Lenkinski, R.E. CEST: From basic principles to applications, challenges and opportunities. J. Magn. Reson. 2013, 229, 155–172. [Google Scholar] [CrossRef] [PubMed]
- Hancu, I.; Dixon, W.T.; Woods, M.; Vinogradov, E.; Sherry, A.D.; Lenkinski, R.E. CEST and PARACEST MR contrast agents. Acta Radiol. 2010, 51, 910–923. [Google Scholar] [CrossRef]
- Fernando, W.S.; Martins, A.F.; Zhao, P.; Wu, Y.; Kiefer, G.E.; Platas-Iglesias, C.; Sherry, A.D. Breaking the Barrier to Slow Water Exchange Rates for Optimal Magnetic Resonance Detection of paraCEST Agents. Inorg. Chem. 2016, 55, 3007–3014. [Google Scholar] [CrossRef] [PubMed]
- Lux, J.; Sherry, A.D. Advances in gadolinium-based MRI contrast agent designs for monitoring biological processes in vivo. Curr. Opin. Chem. Biol. 2018, 45, 121–130. [Google Scholar] [CrossRef]
- Ibrahim, M.A.; Dublin, A.B. Magnetic Resonance Imaging (MRI), Gadolinium. In StatPearls; StatPearls Publishing: Treasure Island, FL, USA, 2018. [Google Scholar]
- Aime, S.; Caravan, P. Biodistribution of gadolinium-based contrast agents, including gadolinium deposition. J. Magn. Reson. Imaging 2009, 30, 1259–1267. [Google Scholar] [CrossRef]
- Bellin, M.-F. MR contrast agents, the old and the new. Eur. J. Radiol. 2006, 60, 314–323. [Google Scholar] [CrossRef] [PubMed]
- Mitsumori, L.M.; Bhargava, P.; Essig, M.; Maki, J.H. Magnetic Resonance Imaging Using Gadolinium-Based Contrast Agents. Top. Magn. Reson. Imaging 2014, 23, 51. [Google Scholar] [CrossRef] [PubMed]
- Al-Okaili, R.N.; Krejza, J.; Wang, S.; Woo, J.H.; Melhem, E.R. Advanced MR Imaging Techniques in the Diagnosis of Intraaxial Brain Tumors in Adults. RadioGraphics 2006, 26, S173–S189. [Google Scholar] [CrossRef] [PubMed]
- Layne, K.A.; Dargan, P.I.; Archer, J.R.H.; Wood, D.M. Gadolinium deposition and the potential for toxicological sequelae—A literature review of issues surrounding gadolinium-based contrast agents. Br. J. Clin. Pharmacol. 2018, 84, 2522–2534. [Google Scholar] [CrossRef] [PubMed]
- Frenzel, T.; Lengsfeld, P.; Schirmer, H.; Hütter, J.; Weinmann, H.-J. Stability of Gadolinium-Based Magnetic Resonance Imaging Contrast Agents in Human Serum at 37 °C. Investig. Radiol. 2008, 43, 817. [Google Scholar] [CrossRef] [PubMed]
- Idée, J.-M.; Port, M.; Robic, C.; Medina, C.; Sabatou, M.; Corot, C. Role of thermodynamic and kinetic parameters in gadolinium chelate stability. J. Magn. Reson. Imaging 2009, 30, 1249–1258. [Google Scholar] [CrossRef] [PubMed]
- Hao, D.; Ai, T.; Goerner, F.; Hu, X.; Runge, V.M.; Tweedle, M. MRI contrast agents: Basic chemistry and safety. J. Magn. Reson. Imaging 2012, 36, 1060–1071. [Google Scholar] [CrossRef]
- Wedeking, P.; Sotak, C.H.; Telser, J.; Kumar, K.; Chang, C.A.; Tweedle, M.F. Quantitative dependence of MR signal intensity on tissue concentration of Gd(HP-DO3A) in the nephrectomized rat. Magn. Reson. Imaging 1992, 10, 97–108. [Google Scholar] [CrossRef]
- Knuttinen, M.-G.; Karow, J.; Mar, W.; Golden, M.; Xie, K.L. Blood Pool Contrast-enhanced Magnetic Resonance Angiography with Correlation to Digital Subtraction Angiography: A Pictorial Review. J. Clin. Imaging Sci. 2014, 4, 63. [Google Scholar]
- Oliveira, I.S.; Hedgire, S.S.; Li, W.; Ganguli, S.; Prabhakar, A.M. Blood pool contrast agents for venous magnetic resonance imaging. Cardiovasc. Diagn. Ther. 2016, 6, 508–518. [Google Scholar] [CrossRef]
- Frydrychowicz, A.; Lubner, M.G.; Brown, J.J.; Merkle, E.M.; Nagle, S.K.; Rofsky, N.M.; Reeder, S.B. Hepatobiliary MR imaging with gadolinium-based contrast agents. J. Magn. Reson. Imaging 2012, 35, 492–511. [Google Scholar] [CrossRef] [PubMed]
- Choi, Y.; Huh, J.; Woo, D.-C.; Kim, K.W. Use of gadoxetate disodium for functional MRI based on its unique molecular mechanism. BJR 2016, 89, 20150666. [Google Scholar] [CrossRef]
- Haradome, H.; Unno, T.; Morisaka, H.; Toda, Y.; Kwee, T.C.; Kondo, H.; Sano, K.; Ichikawa, T.; Kondo, F.; Sugitani, M.; et al. Gadoxetic acid disodium-enhanced MR imaging of cholangiolocellular carcinoma of the liver: Imaging characteristics and histopathological correlations. Eur. Radiol. 2017, 27, 4461–4471. [Google Scholar] [CrossRef] [PubMed]
- Jhaveri, K.; Cleary, S.; Audet, P.; Balaa, F.; Bhayana, D.; Burak, K.; Chang, S.; Dixon, E.; Haider, M.; Molinari, M.; et al. Consensus Statements from a Multidisciplinary Expert Panel on the Utilization and Application of a Liver-Specific MRI Contrast Agent (Gadoxetic Acid). Am. J. Roentgenol. 2015, 204, 498–509. [Google Scholar] [CrossRef] [PubMed]
- Franklin, R.B.; Milon, B.; Feng, P.; Costello, L.C. Zinc and zinc transporters in normal prostate and the pathogenesis of prostate cancer. Front. Biosci. 2005, 10, 2230–2239. [Google Scholar] [CrossRef] [PubMed]
- Kelleher, S.L.; McCormick, N.H.; Velasquez, V.; Lopez, V. Zinc in Specialized Secretory Tissues: Roles in the Pancreas, Prostate, and Mammary Gland. Adv. Nutr. 2011, 2, 101–111. [Google Scholar] [CrossRef] [PubMed]
- Kambe, T.; Tsuji, T.; Hashimoto, A.; Itsumura, N. The Physiological, Biochemical, and Molecular Roles of Zinc Transporters in Zinc Homeostasis and Metabolism. Physiol. Rev. 2015, 95, 749–784. [Google Scholar] [CrossRef] [PubMed]
- Zhang, X.; Lovejoy, K.S.; Jasanoff, A.; Lippard, S.J. Water-soluble porphyrins as a dual-function molecular imaging platform for MRI and fluorescence zinc sensing. Proc. Natl. Acad. Sci. USA 2007, 104, 10780–10785. [Google Scholar] [CrossRef]
- Lee, T.; Zhang, X.; Dhar, S.; Faas, H.; Lippard, S.J.; Jasanoff, A. In Vivo Imaging with a Cell-Permeable Porphyrin-Based MRI Contrast Agent. Chem. Biol. 2010, 17, 665–673. [Google Scholar] [CrossRef]
- De Leon-Rodriguez, L.; Lubag, A.J.M., Jr.; Sherry, A.D. Imaging free zinc levels in vivo—What can be learned? Inorg. Chim. Acta 2012, 393, 12–23. [Google Scholar] [CrossRef]
- Stasiuk, G.J.; Minuzzi, F.; Sae-Heng, M.; Rivas, C.; Juretschke, H.-P.; Piemonti, L.; Allegrini, P.R.; Laurent, D.; Duckworth, A.R.; Beeby, A.; et al. Dual-Modal Magnetic Resonance/Fluorescent Zinc Probes for Pancreatic β-Cell Mass Imaging. Chem. Eur. J. 2015, 21, 5023–5033. [Google Scholar] [CrossRef] [PubMed]
- Mishra, A.; Logothetis, N.K.; Parker, D. Critical In Vitro Evaluation of Responsive MRI Contrast Agents for Calcium and Zinc. Chem. Eur. J. 2011, 17, 1529–1537. [Google Scholar] [CrossRef] [PubMed]
- Bonnet, C.S.; Caillé, F.; Pallier, A.; Morfin, J.-F.; Petoud, S.; Suzenet, F.; Tóth, É. Mechanistic Studies of Gd3+-Based MRI Contrast Agents for Zn2+ Detection: Towards Rational Design. Chem. Eur. J. 2014, 20, 10959–10969. [Google Scholar] [CrossRef] [PubMed]
- Lubag, A.J.M.; De Leon-Rodriguez, L.M.; Burgess, S.C.; Sherry, A.D. Noninvasive MRI of β-cell function using a Zn2+-responsive contrast agent. Proc. Natl. Acad. Sci. USA 2011, 108, 18400–18405. [Google Scholar] [CrossRef] [PubMed]
- Lo, S.-T.; Martins, A.F.; Jordan, V.C.; Sherry, A.D. Zinc as an Imaging Biomarker of Prostate Cancer. Isr. J. Chem. 2017, 57, 854–861. [Google Scholar] [CrossRef]
- Que, E.L.; New, E.J.; Chang, C.J. A cell-permeable gadolinium contrast agent for magnetic resonance imaging of copper in a Menkes disease model. Chem. Sci. 2012, 3, 1829–1834. [Google Scholar] [CrossRef]
- Que, E.L.; Gianolio, E.; Baker, S.L.; Wong, A.P.; Aime, S.; Chang, C.J. Copper-Responsive Magnetic Resonance Imaging Contrast Agents. J. Am. Chem. Soc. 2009, 131, 8527–8536. [Google Scholar] [CrossRef]
- Que, E.L.; Chang, C.J. A Smart Magnetic Resonance Contrast Agent for Selective Copper Sensing. J. Am. Chem. Soc. 2006, 128, 15942–15943. [Google Scholar] [CrossRef]
- Paranawithana, N.; Martins, A.; Clavijo-Jordan, V.; Zhao, P.; Chirayil, S.; Meloni, G.; Sherry, D. A Responsive MRI Contrast Agent for Detection of Excess copper(II) in the Liver in Vivo. ChemRxiv 2018. [Google Scholar] [CrossRef]
- Gupte, A.; Mumper, R.J. Elevated copper and oxidative stress in cancer cells as a target for cancer treatment. Cancer Treat. Rev. 2009, 35, 32–46. [Google Scholar] [CrossRef]
- Rigiracciolo, D.C.; Scarpelli, A.; Lappano, R.; Pisano, A.; Santolla, M.F.; Marco, P.D.; Cirillo, F.; Cappello, A.R.; Dolce, V.; Belfiore, A.; et al. Copper activates HIF-1α/GPER/VEGF signalling in cancer cells. Oncotarget 2015, 6, 34158–34177. [Google Scholar] [CrossRef] [PubMed]
- Blockhuys, S.; Wittung-Stafshede, P. Roles of Copper-Binding Proteins in Breast Cancer. Int. J. Mol. Sci. 2017, 18, 871. [Google Scholar] [CrossRef] [PubMed]
- Südhof, T.C. Calcium Control of Neurotransmitter Release. Cold Spring Harb. Perspect. Biol. 2012, 4, a011353. [Google Scholar] [CrossRef] [PubMed]
- Li, W.; Fraser, S.E.; Meade, T.J. A Calcium-Sensitive Magnetic Resonance Imaging Contrast Agent. J. Am. Chem. Soc. 1999, 121, 1413–1414. [Google Scholar] [CrossRef]
- Dhingra, K.; Fousková, P.; Angelovski, G.; Maier, M.E.; Logothetis, N.K.; Tóth, É. Towards extracellular Ca2+ sensing by MRI: Synthesis and calcium-dependent 1H and 17O relaxation studies of two novel bismacrocyclic Gd3+ complexes. J. Biol. Inorg. Chem. 2008, 13, 35–46. [Google Scholar] [CrossRef]
- Mishra, A.; Fousková, P.; Angelovski, G.; Balogh, E.; Mishra, A.K.; Logothetis, N.K.; Tóth, É. Facile Synthesis and Relaxation Properties of Novel Bispolyazamacrocyclic Gd3+ Complexes: An Attempt towards Calcium-Sensitive MRI Contrast Agents. Inorg. Chem. 2008, 47, 1370–1381. [Google Scholar] [CrossRef] [PubMed]
- Lin, Y.-J.; Koretsky, A.P. Manganese ion enhances T1-weighted MRI during brain activation: An approach to direct imaging of brain function. Magn. Reson. Med. 1997, 38, 378–388. [Google Scholar] [CrossRef] [PubMed]
- Moussaron, A.; Vibhute, S.; Bianchi, A.; Gündüz, S.; Kotb, S.; Sancey, L.; Motto-Ros, V.; Rizzitelli, S.; Crémillieux, Y.; Lux, F.; et al. Ultrasmall Nanoplatforms as Calcium-Responsive Contrast Agents for Magnetic Resonance Imaging. Small 2015, 11, 4900–4909. [Google Scholar] [CrossRef] [PubMed]
- Okada, S.; Bartelle, B.B.; Li, N.; Breton-Provencher, V.; Lee, J.J.; Rodriguez, E.; Melican, J.; Sur, M.; Jasanoff, A. Calcium-dependent molecular fMRI using a magnetic nanosensor. Nat. Nanotechnol. 2018, 13, 473. [Google Scholar] [CrossRef]
- Angelovski, G.; Chauvin, T.; Pohmann, R.; Logothetis, N.K.; Tóth, É. Calcium-responsive paramagnetic CEST agents. Bioorg. Med. Chem. 2011, 19, 1097–1105. [Google Scholar] [CrossRef]
- Angelovski, G.; Gottschalk, S.; Milošević, M.; Engelmann, J.; Hagberg, G.E.; Kadjane, P.; Andjus, P.; Logothetis, N.K. Investigation of a Calcium-Responsive Contrast Agent in Cellular Model Systems: Feasibility for Use as a Smart Molecular Probe in Functional MRI. ACS Chem. Neurosci. 2014, 5, 360–369. [Google Scholar] [CrossRef] [PubMed]
- Garello, F.; Vibhute, S.; Gündüz, S.; Logothetis, N.K.; Terreno, E.; Angelovski, G. Innovative Design of Ca-Sensitive Paramagnetic Liposomes Results in an Unprecedented Increase in Longitudinal Relaxivity. Biomacromolecules 2016, 17, 1303–1311. [Google Scholar] [CrossRef] [PubMed]
- Oukhatar, F.; Même, S.; Même, W.; Szeremeta, F.; Logothetis, N.K.; Angelovski, G.; Tóth, É. MRI Sensing of Neurotransmitters with a Crown Ether Appended Gd3+ Complex. ACS Chem. Neurosci. 2015, 6, 219–225. [Google Scholar] [CrossRef] [PubMed]
- Hifumi, H.; Tanimoto, A.; Citterio, D.; Komatsu, H.; Suzuki, K. Novel 15-crown-5 ether or β-diketone incorporated gadolinium complexes for the detection of potassium ions or magnesium and calcium ions. Analyst 2007, 132, 1153–1160. [Google Scholar] [CrossRef] [PubMed]
- Kubíček, V.; Vitha, T.; Kotek, J.; Hermann, P.; Vander Elst, L.; Muller, R.N.; Lukeš, I.; Peters, J.A. Towards MRI contrast agents responsive to Ca(II) and Mg(II) ions: Metal-induced oligomerization of dota–bisphosphonate conjugates. Contrast Media Mol. Imaging 2010, 5, 294–296. [Google Scholar] [CrossRef] [PubMed]
- Abada, S.; Lecointre, A.; Elhabiri, M.; Esteban-Gómez, D.; Platas-Iglesias, C.; Tallec, G.; Mazzanti, M.; Charbonnière, L.J. Highly relaxing gadolinium based MRI contrast agents responsive to Mg2+ sensing. Chem. Commun. 2012, 48, 4085–4087. [Google Scholar] [CrossRef] [PubMed]
- Raghunand, N.; Howison, C.; Sherry, A.D.; Zhang, S.; Gillies, R.J. Renal and systemic pH imaging by contrast-enhanced MRI. Magn. Reson. Med. 2003, 49, 249–257. [Google Scholar] [CrossRef] [PubMed]
- Martinez, G.V.; Zhang, X.; García-Martín, M.L.; Morse, D.L.; Woods, M.; Sherry, A.D.; Gillies, R.J. Imaging the extracellular pH of tumors by MRI after injection of a single cocktail of T1 and T2 contrast agents. NMR Biomed. 2011, 24, 1380–1391. [Google Scholar] [CrossRef] [PubMed]
- Kálmán, F.K.; Woods, M.; Caravan, P.; Jurek, P.; Spiller, M.; Tircsó, G.; Király, R.; Brücher, E.; Sherry, A.D. Potentiometric and Relaxometric Properties of a Gadolinium-Based MRI Contrast Agent for Sensing Tissue pH. Inorg. Chem. 2007, 46, 5260–5270. [Google Scholar] [CrossRef] [PubMed]
- Vander Elst, L.; Roch, A.; Gillis, P.; Laurent, S.; Botteman, F.; Bulte, J.W.M.; Muller, R.N. Dy-DTPA derivatives as relaxation agents for very high field MRI: The beneficial effect of slow water exchange on the transverse relaxivities. Magn. Reson. Med. 2002, 47, 1121–1130. [Google Scholar] [CrossRef] [PubMed]
- Shapiro, M.G.; Westmeyer, G.G.; Romero, P.A.; Szablowski, J.O.; Küster, B.; Shah, A.; Otey, C.R.; Langer, R.; Arnold, F.H.; Jasanoff, A. Directed evolution of a magnetic resonance imaging contrast agent for noninvasive imaging of dopamine. Nat. Biotechnol. 2010, 28, 264–270. [Google Scholar] [CrossRef] [PubMed]
- Zhao, Z.; Zhou, Z.; Bao, J.; Wang, Z.; Hu, J.; Chi, X.; Ni, K.; Wang, R.; Chen, X.; Chen, Z.; et al. Octapod iron oxide nanoparticles as high-performance T2 contrast agents for magnetic resonance imaging. Nat. Commun. 2013, 4, 1–7. [Google Scholar] [CrossRef] [PubMed]
- Lee, T.; Cai, L.X.; Lelyveld, V.S.; Hai, A.; Jasanoff, A. Molecular-Level Functional Magnetic Resonance Imaging of Dopaminergic Signaling. Science 2014, 344, 533–535. [Google Scholar] [CrossRef] [PubMed]
- Anderson, C.E.; Donnola, S.B.; Jiang, Y.; Batesole, J.; Darrah, R.; Drumm, M.L.; Brady-Kalnay, S.M.; Steinmetz, N.F.; Yu, X.; Griswold, M.A.; et al. Dual Contrast–Magnetic Resonance Fingerprinting (DC–MRF): A Platform for Simultaneous Quantification of Multiple MRI Contrast Agents. Sci. Rep. 2017, 7, 8431. [Google Scholar] [CrossRef] [PubMed]
- Soesbe, T.C.; Ratnakar, S.J.; Milne, M.; Zhang, S.; Do, Q.N.; Kovacs, Z.; Sherry, A.D. Maximizing T2-exchange in Dy3+DOTA-(amide)X chelates: Fine-tuning the water molecule exchange rate for enhanced T2 contrast in MRI. Magn. Reson. Med. 2014, 71, 1179–1185. [Google Scholar] [CrossRef] [PubMed]
- Yadav, N.N.; Xu, J.; Bar-Shir, A.; Qin, Q.; Chan, K.W.Y.; Grgac, K.; Li, W.; McMahon, M.T.; van Zijl, P.C.M. Natural d-glucose as a biodegradable MRI relaxation agent. Magn. Reson. Med. 2014, 72, 823–828. [Google Scholar] [CrossRef] [PubMed]
- Goldenberg, J.M.; Pagel, M.D.; Cárdenas-Rodríguez, J. Characterization of d-maltose as a T2-exchange contrast agent for dynamic contrast-enhanced MRI. Magn. Reson. Med. 2018, 80, 1158–1164. [Google Scholar] [CrossRef]
- Longo, D.L.; Dastrù, W.; Digilio, G.; Keupp, J.; Langereis, S.; Lanzardo, S.; Prestigio, S.; Steinbach, O.; Terreno, E.; Uggeri, F.; et al. Iopamidol as a responsive MRI-chemical exchange saturation transfer contrast agent for pH mapping of kidneys: In vivo studies in mice at 7 T. Magn. Reson. Med. 2011, 65, 202–211. [Google Scholar] [CrossRef]
- Longo, D.L.; Busato, A.; Lanzardo, S.; Antico, F.; Aime, S. Imaging the pH evolution of an acute kidney injury model by means of iopamidol, a MRI-CEST pH-responsive contrast agent. Magn. Reson. Med. 2013, 70, 859–864. [Google Scholar] [CrossRef]
- Zhou, J.; Payen, J.-F.; Wilson, D.A.; Traystman, R.J.; van Zijl, P.C.M. Using the amide proton signals of intracellular proteins and peptides to detect pH effects in MRI. Nat. Med. 2003, 9, 1085–1090. [Google Scholar] [CrossRef]
- Yang, X.; Song, X.; Ray Banerjee, S.; Li, Y.; Byun, Y.; Liu, G.; Bhujwalla, Z.M.; Pomper, M.G.; McMahon, M.T. Developing imidazoles as CEST MRI pH sensors. Contrast Media Mol. Imaging 2016, 11, 304–312. [Google Scholar] [CrossRef] [PubMed]
- Roalf, D.R.; Nanga, R.P.R.; Rupert, P.E.; Hariharan, H.; Quarmley, M.; Calkins, M.E.; Dress, E.; Prabhakaran, K.; Elliott, M.A.; Moberg, P.J.; et al. Glutamate imaging (GluCEST) reveals lower brain GluCEST contrast in patients on the psychosis spectrum. Mol. Psychiatry 2017, 22, 1298–1305. [Google Scholar] [CrossRef] [PubMed]
- Bagga, P.; Pickup, S.; Crescenzi, R.; Martinez, D.; Borthakur, A.; D’Aquilla, K.; Singh, A.; Verma, G.; Detre, J.A.; Greenberg, J.; et al. In vivo GluCEST MRI: Reproducibility, background contribution and source of glutamate changes in the MPTP model of Parkinson’s disease. Sci. Rep. 2018, 8, 2883. [Google Scholar] [CrossRef] [PubMed]
- Sinharay, S.; Fernández-Cuervo, G.; Acfalle, J.P.; Pagel, M.D. Detection of Sulfatase Enzyme Activity with a CatalyCEST MRI Contrast Agent. Chem. Eur. J. 2016, 22, 6491–6495. [Google Scholar] [CrossRef] [PubMed]
- Hanson, S.R.; Best, M.D.; Wong, C.-H. Sulfatases: Structure, Mechanism, Biological Activity, Inhibition, and Synthetic Utility. Angew. Chem. Int. Ed. 2004, 43, 5736–5763. [Google Scholar] [CrossRef] [PubMed]
- Yang, X.; Yadav, N.N.; Song, X.; Ray Banerjee, S.; Edelman, H.; Minn, I.; van Zijl, P.C.M.; Pomper, M.G.; McMahon, M.T. Tuning Phenols with Intra-Molecular Bond Shifted HYdrogens (IM-SHY) as diaCEST MRI Contrast Agents. Chem. Eur. J. 2014, 20, 15824–15832. [Google Scholar] [CrossRef] [PubMed]
- Li, J.; Feng, X.; Zhu, W.; Oskolkov, N.; Zhou, T.; Kim, B.K.; Baig, N.; McMahon, M.T.; Oldfield, E. Chemical Exchange Saturation Transfer (CEST) Agents: Quantum Chemistry and MRI. Chem. Eur. J. 2016, 22, 264–271. [Google Scholar] [CrossRef] [PubMed]
- Fernández-Cuervo, G.; Sinharay, S.; Pagel, M.D. A CatalyCEST MRI Contrast Agent that Can Simultaneously Detect Two Enzyme Activities. ChemBioChem 2016, 17, 383–387. [Google Scholar] [CrossRef]
- Van Zijl, P.C.M.; Yadav, N.N. Chemical exchange saturation transfer (CEST): What is in a name and what isn’t? Magn. Reson. Med. 2011, 65, 927–948. [Google Scholar] [CrossRef]
- Woods, M.; Woessner, D.E.; Sherry, A.D. Paramagnetic lanthanide complexes as PARACEST agents for medical imaging. Chem. Soc. Rev. 2006, 35, 500–511. [Google Scholar] [CrossRef]
- Hingorani, D.V.; Bernstein, A.S.; Pagel, M.D. A review of responsive MRI contrast agents: 2005–2014. Contrast Media Mol. Imaging 2015, 10, 245–265. [Google Scholar] [CrossRef] [PubMed]
- Yang, X.; Song, X.; Li, Y.; Liu, G.; Ray Banerjee, S.; Pomper, M.G.; McMahon, M.T. Salicylic Acid and Analogues as diaCEST MRI Contrast Agents with Highly Shifted Exchangeable Proton Frequencies. Angew. Chem. Int. Ed. 2013, 52, 8116–8119. [Google Scholar] [CrossRef]
- Cohen, O.; Huang, S.; McMahon, M.T.; Rosen, M.S.; Farrar, C.T. Rapid and quantitative chemical exchange saturation transfer (CEST) imaging with magnetic resonance fingerprinting (MRF). Magn. Reson. Med. 2018, 80, 2449–2463. [Google Scholar] [CrossRef] [PubMed]
- Wu, Y.; Zhang, S.; Soesbe, T.C.; Yu, J.; Vinogradov, E.; Lenkinski, R.E.; Sherry, A.D. pH imaging of mouse kidneys in vivo using a frequency-dependent paraCEST agent. Magn. Reson. Med. 2016, 75, 2432–2441. [Google Scholar] [CrossRef] [PubMed]
- Funk, A.M.; Clavijo Jordan, V.; Sherry, A.D.; Ratnakar, S.J.; Kovacs, Z. Oxidative Conversion of a Europium(II)-Based T1 Agent into a Europium(III)-Based paraCEST Agent that can be Detected In Vivo by Magnetic Resonance Imaging. Angew. Chem. 2016, 128, 5108–5111. [Google Scholar] [CrossRef]
- Zhang, L.; Martins, A.F.; Mai, Y.; Zhao, P.; Funk, A.M.; Clavijo Jordan, M.V.; Zhang, S.; Chen, W.; Wu, Y.; Sherry, A.D. Imaging Extracellular Lactate In Vitro and In Vivo Using CEST MRI and a Paramagnetic Shift Reagent. Chem. Eur. J. 2017, 23, 1752–1756. [Google Scholar] [CrossRef]
- Yoo, B.; Sheth, V.R.; Howison, C.M.; Douglas, M.J.K.; Pineda, C.T.; Maine, E.A.; Baker, A.F.; Pagel, M.D. Detection of in vivo enzyme activity with CatalyCEST MRI. Magn. Reson. Med. 2014, 71, 1221–1230. [Google Scholar] [CrossRef]
- Sherry, A.D.; Woods, M. Chemical Exchange Saturation Transfer Contrast Agents for Magnetic Resonance Imaging. Annu. Rev. Biomed. Eng. 2008, 10, 391–411. [Google Scholar] [CrossRef]
- Kumas, C.; Fernando, W.S.; Zhao, P.; Regueiro-Figueroa, M.; Kiefer, G.E.; Martins, A.F.; Platas-Iglesias, C.; Sherry, A.D. Unexpected Changes in the Population of Coordination Isomers for the Lanthanide Ion Complexes of DOTMA–Tetraglycinate. Inorg. Chem. 2016, 55, 9297–9305. [Google Scholar] [CrossRef]
- Zhang, S.; Merritt, M.; Woessner, D.E.; Lenkinski, R.E.; Sherry, A.D. PARACEST Agents: Modulating MRI Contrast via Water Proton Exchange. Acc. Chem. Res. 2003, 36, 783–790. [Google Scholar] [CrossRef]
- Warburg, O. On the Origin of Cancer Cells. Science 1956, 123, 309–314. [Google Scholar] [CrossRef] [PubMed]
- Heiden, M.G.V.; Cantley, L.C.; Thompson, C.B. Understanding the Warburg Effect: The Metabolic Requirements of Cell Proliferation. Science 2009, 324, 1029–1033. [Google Scholar] [CrossRef] [PubMed]
Figure 1.
Schematic of T1, T2, T2-exchange, and chemical exchange saturation transfer (CEST) (paraCEST) lanthanide contrast agents (CAs) with one coordinated water molecule (inner-sphere water, its oxygen is colored black) in solution (bulk and outer-sphere waters, oxygens are in red). Second-sphere water molecules (water oxygens are colored blue). The parameters that govern the relaxivity are also represented: O–Ln distance (r), the mean lifetime (τM) of the water molecules in the inner sphere, the rotational correlation time (τR) and the electronic spin relaxation times (T1e and T2e). Below, the corresponding simulated plots are represented, showing the contrast effect (r1, r2, Mz/M0) vs. the τM, assuming standard parameters from the literature.

Figure 2.
Axial T1-weighted (A) post-contrast axial T1-weighed FSE acquisition. (B) A focal region of heterogeneous enhancement (white arrows) indicating disruption of the blood–brain barrier, a finding usually seen in malignant gliomas. Dynamic susceptibility contrast (DSC) perfusion images were also acquired. During the first pass, a Gd-based CA to explore the T2* effects and post-processed rCBV map (C) demonstrates a focal area of markedly increased tumor vascularity (arrowheads) matching the area of enhancement. This area was targeted for stereotactic biopsy, which confirmed the suspicion of an anaplastic glioma. Reproduced with permission from [6].

Figure 3.
Schematic representation of Gd3+-based contrast agents commercially approved and used in the clinic: (A) polyaza macrocycles, (B) linear aminopolycarboxylates. Corresponding overall charges represented at the top right corner of each agent. All the agents are coordinated to one water molecule that is not represented here, for simplicity. CAs labeled with * were suspended by the European Medicines Agency due to concerns over nephrogenic systemic fibrosis. Note that all starred agents are linear, not macrocyclic, compounds.

Figure 4.
Chemical structures of some zinc-responsive MRI contrast agents applied in vivo. The typical strategy for creating these agents is to add a zinc-responsive N,N-bis(2-pyridyl-methyl)ethylenediamine (BPEN) ligand to the macrocyclic ring. Altering the alkane chain linking nitrogen atoms alters the binding constants of zinc, resulting in different responsiveness.

Figure 5.
Schematic illustrating the phenomenon observed in vivo from β-cells during glucose-stimulated zinc/insulin secretion: insulin (brown spheres) and Zn2+ (cyan spheres) release. Ternary complex highlighted in yellow and blue (right) (A). Histological staining; islets labelled in red (B) (left). MRI of slice of tissue showing functional zinc release from the β-cells in the islets in the presence of the low affinity zinc sensor GdDO3A-PEPMA (B) (right). Adapted with permission from [12]. Copyright 2018 American Chemical Society.

Figure 6.
(A) Copper-responsive MRI contrast agent, shown chelating a Cu2+ ion. (B) First in vivo demonstration of a copper-responsive MRI contrast agent (Images are from a mouse liver, both with (bottom) and without (top) pre-treatment with ATN-224, a Cu2+ chelator. Notice the bright enhancement in the top-left frame after injection of the contrast agent, and the decrease in brightness on the bottom left frame after injection of the contrast agent after ATN-224 treatment, indicating enhancement is due to the presence of copper ions. Since this agent is not expected to cross the cell membrane, copper ions are likely in the extracellular space (C) quantitative signal intensity changes of the copper-responsive MRI contrast agent (GdL-1), compared to Gadavist, with and without the presence of ATN-224. Adapted from [51].

Figure 7.
(A) Schematic of the sensor design based on lipid-coated iron oxide nanoparticles (LCIOs) and C2AB (top left) and the AFM of MaCaReNas imaged after exposure to 0 or 1 mM Ca2+ (bottom left). Titration curves showing r2 values as a function of [Ca2+] in aCSF, indicating MaCaReNa responsiveness to calcium concentrations characteristic of the brain extracellular space. LCIOs alone (grey) or in the presence of C2ABCa− (blue) display little responsiveness to Ca2+. (B) MFB electrode implantation and striatal MaCaReNa infusion Ipsilateral (ipsi) MFB stimulation (stim) induces MRI signal changes in the presence of MaCaReNas (right), but not of control LCIO particles (left). Adapted with permission from [61]. Copyright © 2018, Springer Nature.

Figure 8.
(A) Haworth projection of d-glucose. (B) Transverse relaxation data from a dynamic in vivo glucose infusion experiment on a mouse. T2-weighted images of mouse kidneys from the time of a glucose bolus infusion are displayed (time indicated below each image). (a) Effects in all regions displayed. (b) Only kidney signal displayed in color on grayscale image to highlight effects. Adapted with permission from [78].

Figure 9.
Schematic representation of the distribution of proton spins and the simulated NMR spectra when a pre-saturation pulse is applied, and the system is under a chemical exchange. As a result, a negative contrast is produced by the difference of chemical exchange in between pools; this is known as CEST.

Figure 10.
(A) The chemical structure imidazole-4,5-dicarboxamide, a diaCEST pH sensor (left), and in vivo kidney pH maps (right). Adapted with permission from [83]. (B) CatalyCEST MRI of sulfatase activity: (left) the aryl sulfate ligand of compound 2 (referred to as the substrate) is cleaved by sulfatase, generating a salicylic acid moiety. The aryl amide ligand is not changed by the enzyme and the detection of sulfatase activity from mammalian cells. The CEST spectra before (blue) and after (red) incubation of the agent with HEK293 cell suspension showed the appearance of a CEST signal at δ = 9.0 ppm (right). Adapted with permission from [87].

Figure 11.
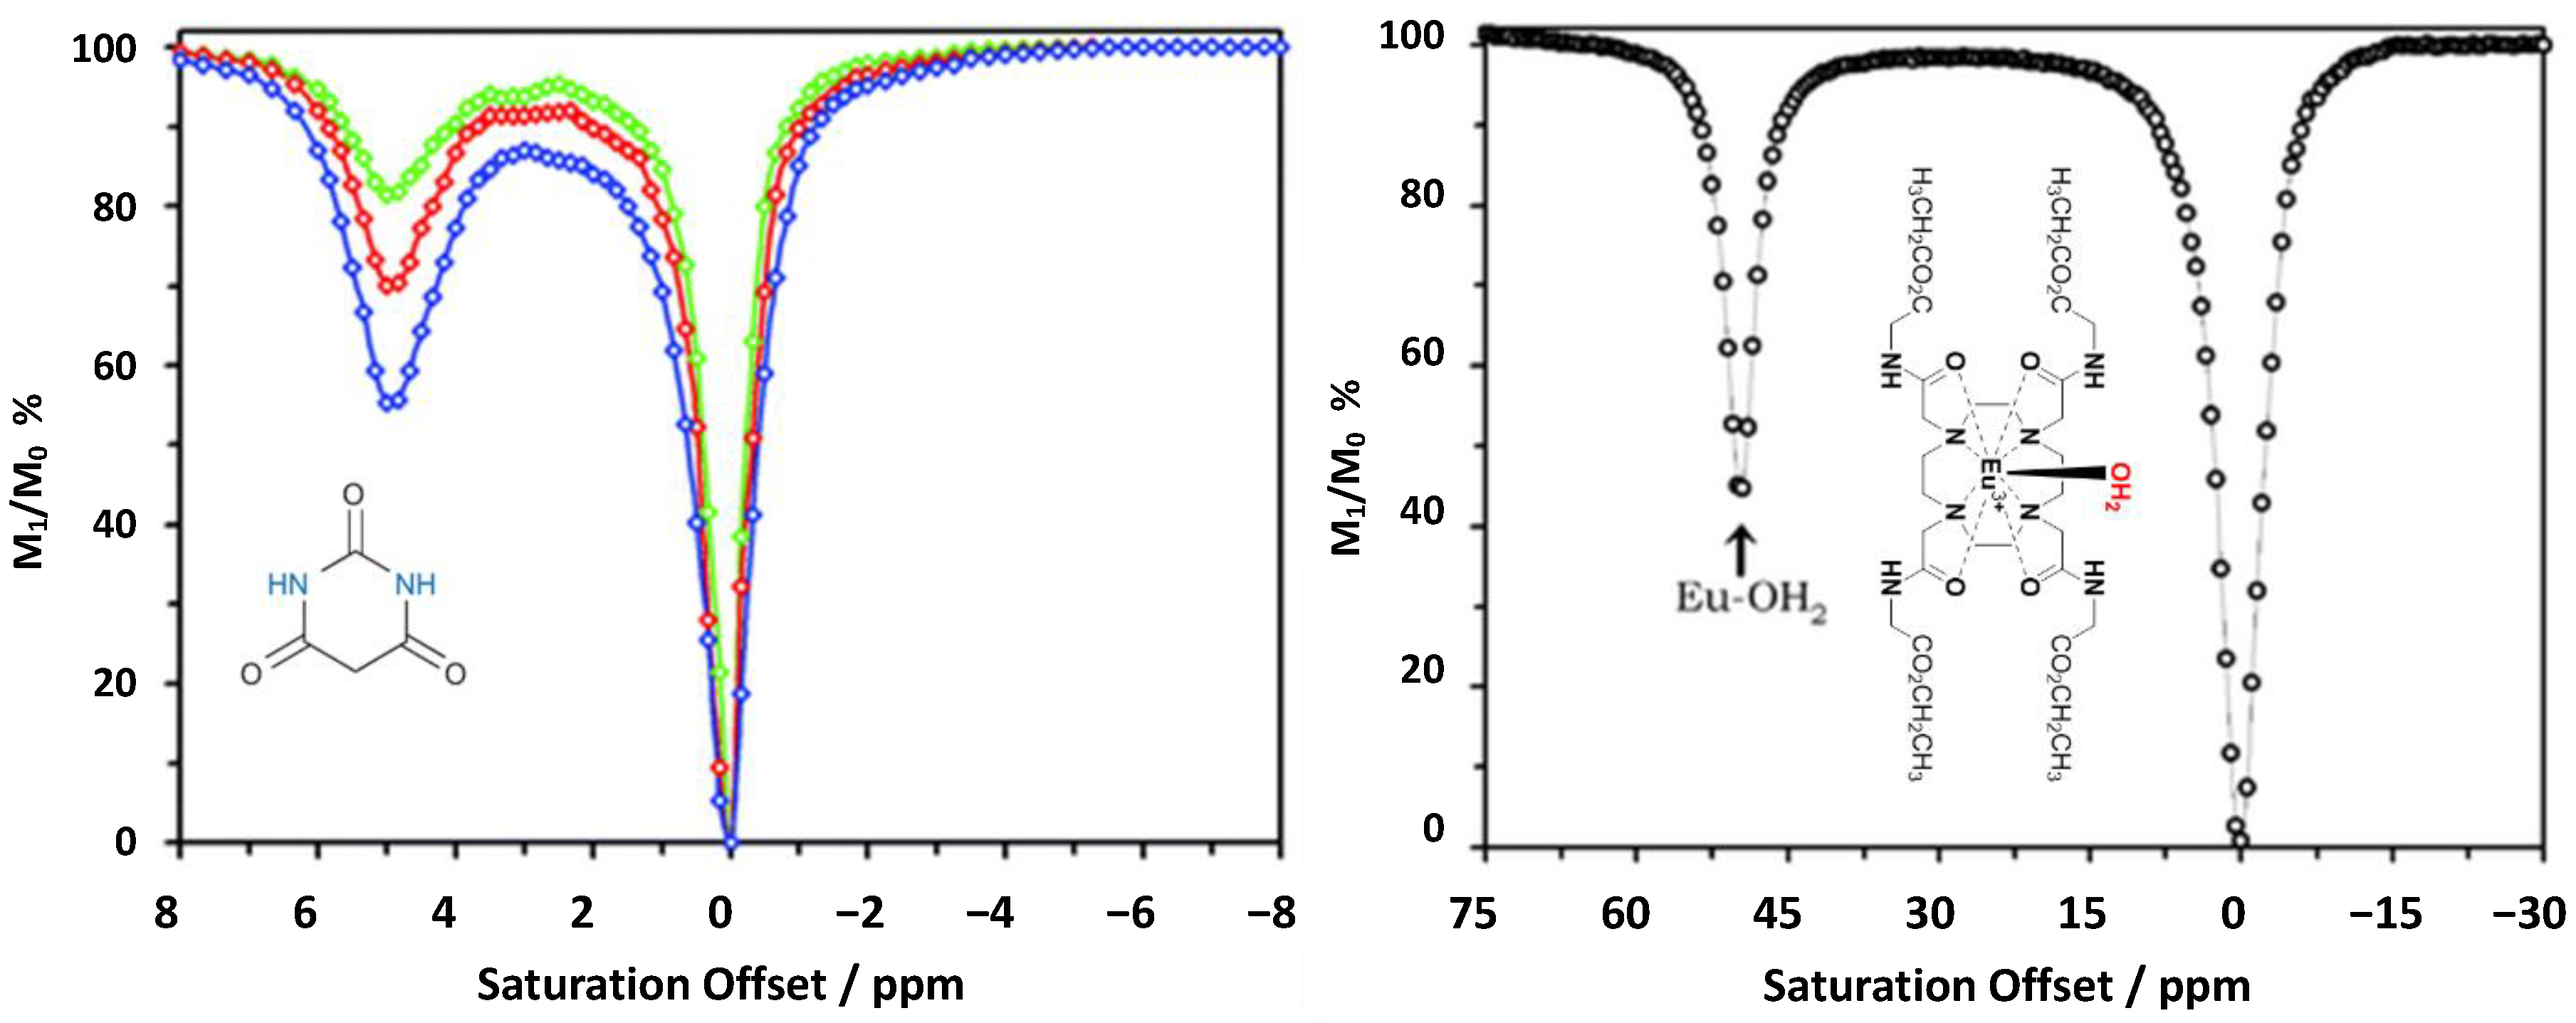
CEST spectra of 125 mM (blue), 62.5 mM (red), and 31.25 mM (green) solutions of barbituric acid (diaCEST agent) recorded at 300 MHz, pH 7.0 and 37 °C (left). The CEST spectra of a 30 mM solution EuDOTA-4AmCE3+ (paraCEST agent) recorded at 270 MHz and 25 °C; the peak at +50 ppm reflects exchange with the coordinated “bound” water molecule (right). Adapted with permission from [92].
Figure 11.
CEST spectra of 125 mM (blue), 62.5 mM (red), and 31.25 mM (green) solutions of barbituric acid (diaCEST agent) recorded at 300 MHz, pH 7.0 and 37 °C (left). The CEST spectra of a 30 mM solution EuDOTA-4AmCE3+ (paraCEST agent) recorded at 270 MHz and 25 °C; the peak at +50 ppm reflects exchange with the coordinated “bound” water molecule (right). Adapted with permission from [92].

Figure 12.
(A) The structure of the pH responsive agent (left), fitted CEST spectra (right) with MTRasym profiles for two different single voxels from the left kidney, as indicated in the CEST pH map (right). (B) T1w and CEST imaging of an intramuscular injection of Eu-DOTA-gly4 complex into the thigh muscle of a healthy male C57BL/6J mouse at B0 = 9.4 T. T1w images at (a) pre-injection, (b) 5 min, (c) 12 min, (d) 16 min, and (e) the CEST image at 17 min. (C) The structure of EuDO3A (top), axial view of T1-weighted proton MRI, the CEST image, and the overlay image of a mouse after iv injection of 0.105 mmol/kg EuDO3A and lactate (bottom). The CEST image of the bladder shows that the intact lactate·EuDO3A complex is present at 45 min after iv injection (n = 3). The CEST image represents amplitude differences between images collected after a 14 μT presaturation pulse of 5 s duration at ±43 ppm. Adapted with permission from [96,97,98].


Table 1.
Selected responsive contrast agents (mostly T1), dosages, biologic use, and current development level. Several agents have made the successful transition to in vivo imaging.
Table 1.
Selected responsive contrast agents (mostly T1), dosages, biologic use, and current development level. Several agents have made the successful transition to in vivo imaging.
| Agent | Dose | Physiologic Target | Biologic Use | Current Development Status | Ref. |
|---|---|---|---|---|---|
| Mn(III)-(DPA-C2)2-TPPS3 | nM range; direct intracranial injection | Intracellular Zn2+ | Zn2+ signaling in brain tissue | In vivo testing; rat model | [41] |
| GdDOTA-BiPEN derivatives | 0.07 mmol/kg administered intravenously | Extracellular Zn2+ | GSIZS in the pancreas and GSZS in prostate | Extensive in vivo testing; mouse and rat pancreas, and mouse prostate | [7,47] |
| GdDO3A-BPEN | 0.07 mmol/kg administered intravenously | Extracellular Zn2+ | GSIZS in the pancreas | In vivo testing; mouse pancreas | [12] |
| GdDO3A-PEPMA | 0.07 mmol/kg administered intravenously | Extracellular Zn2+ | GSIZS in the pancreas | In vivo testing; mouse pancreas | [12] |
| GdL-1 | 0.10 mmol/kg administered intravenously | Extracellular Cu2+ | Extracellular liver copper stores | In vivo testing; mouse model | [51] |
| MnCl2 | 3.6 μmol/min administered intravenously | Possibly extracellular Ca2+ | Possible Ca2+ signaling in the brain | In vivo testing; rat model | [59] |
| SCA-USRPs | 0.04 mmol/kg administered intravenously | Extracellular Ca2+ | Ca2+ fluctuations in kidneys | In vivo testing; mouse model | [63] |
| MaCaReNas | nM range; direct intracranial injection | Extracellular Ca2+ | Extracellular Ca2+ signaling in the brain | In vivo testing; rat model | [61] |
| GdDOTA-4AMP | 0.2 to 0.4 mmol co-administered intravenously with DDOTA-4AMP or GdDOTP | Extracellular pH | Kidney pH mapping | In vivo testing; mouse model | [69,70] |
Table 2.
Selected T2ex contrast agents, dosages, biologic use, and current development level. Several agents have made the successful transition to in vivo imaging.
Table 2.
Selected T2ex contrast agents, dosages, biologic use, and current development level. Several agents have made the successful transition to in vivo imaging.
| Agent | Dose | Physiologic Target | Biologic Use | Current Development Status | Ref. |
|---|---|---|---|---|---|
| d-glucose | 3.0 mmol/kg administered intravenously | Glucose uptake transporters | Detection of hyperglycolytic cancers | In vivo testing; mouse model | [78] |
| d-maltose | 3.0 mmol/kg administered intravenously | d-maltose uptake | Detection of hyperglycolytic cancers | In vivo testing; mouse model | [79] |
Table 3.
Selected CEST contrast agents discussed in this review, dosages, biologic use, and current development level.
Table 3.
Selected CEST contrast agents discussed in this review, dosages, biologic use, and current development level.
| Agent | Dose | Biological Use | Current Development Status | Ref. |
|---|---|---|---|---|
| Imidazole-4,5-dicarboxamide | 1.0 mmol/kg infused intravenously (sat. power: 5.9 µT) | pH mapping of Kidneys | In vivo testing; mouse model | [83] |
| Eu-DOTA-monoketone-tris(amide) | 0.4 mmol/kg administered intravenously (sat. power: 10 µT) | pH mapping | In vivo testing; mouse model | [96] |
| Eu-DOTA-gly4 complex | 0.05 mmol/kg administered intramuscularly (sat. power: 10 µT) | Redox sensitive agent in vivo | In vivo testing; mouse model | [97] |
| EuDO3A complex | 0.1 mmol/kg administered intravenously (sat. power: 14 µT) | Extracellular lactate | In vivo testing; mouse model | [98] |
| ZGGR-a-amino-(Tm-DOTA) | 0.2 mmol/kg administered intravenously (sat. power: 10 µT) | Urokinase plasminogen activator (uPA) | In vivo testing; cancer mouse model | [99] |
© 2019 by the authors. Licensee MDPI, Basel, Switzerland. This article is an open access article distributed under the terms and conditions of the Creative Commons Attribution (CC BY) license (http://creativecommons.org/licenses/by/4.0/).
Share and Cite
MDPI and ACS Style
Parrott, D.; Fernando, W.S.; Martins, A.F. Smart MRI Agents for Detecting Extracellular Events In Vivo: Progress and Challenges. Inorganics 2019, 7, 18. https://doi.org/10.3390/inorganics7020018
AMA Style
Parrott D, Fernando WS, Martins AF. Smart MRI Agents for Detecting Extracellular Events In Vivo: Progress and Challenges. Inorganics. 2019; 7(2):18. https://doi.org/10.3390/inorganics7020018
Chicago/Turabian StyleParrott, Daniel, W. Shirangi Fernando, and Andre F. Martins. 2019. "Smart MRI Agents for Detecting Extracellular Events In Vivo: Progress and Challenges" Inorganics 7, no. 2: 18. https://doi.org/10.3390/inorganics7020018
Note that from the first issue of 2016, this journal uses article numbers instead of page numbers. See further details here.