Deep Reinforcement Learning Algorithms in Intelligent Infrastructure


Alumni Imperial College London, Intelligent Systems and Networks Group, Electrical and Electronic Engineering, South Kensington, London SW7 2AZ, UK
Infrastructures 2019, 4(3), 52; https://doi.org/10.3390/infrastructures4030052
Submission received: 25 June 2019
/
Revised: 11 August 2019
/
Accepted: 12 August 2019
/
Published: 16 August 2019
(This article belongs to the Special Issue Intelligent Infrastructures)
Abstract
:Intelligent infrastructure, including smart cities and intelligent buildings, must learn and adapt to the variable needs and requirements of users, owners and operators in order to be future proof and to provide a return on investment based on Operational Expenditure (OPEX) and Capital Expenditure (CAPEX). To address this challenge, this article presents a biological algorithm based on neural networks and deep reinforcement learning that enables infrastructure to be intelligent by making predictions about its different variables. In addition, the proposed method makes decisions based on real time data. Intelligent infrastructure must be able to proactively monitor, protect and repair itself: this includes independent components and assets working the same way any autonomous biological organisms would. Neurons of artificial neural networks are associated with a prediction or decision layer based on a deep reinforcement learning algorithm that takes into consideration all of its previous learning. The proposed method was validated against an intelligent infrastructure dataset with outstanding results: the intelligent infrastructure was able to learn, predict and adapt to its variables, and components could make relevant decisions autonomously, emulating a living biological organism in which data flow exhaustively.
1. Introduction
Artificial intelligence (AI) will enable infrastructure to be human in addition to only intelligent: AI will become the brain of the infrastructure, which will monitor, operate and manage its different assets, components and functions. This coordination and integration between simple parts and elements will enable infrastructure to reach a higher level of complexity similar to biological organisms. The intelligence of infrastructure, unlike in humans, will be decentralized to reduce single points of failure: it will be hosted in a distributed configuration between local edge servers and the external cloud in data centres. Electronic embedded devices will enable the sensorial abilities of infrastructure to feel environmental conditions, user occupancy, energy usage, material or components stress and asset status: this ability to feel, sense and interact with its users and environment will make infrastructure more human [1]. Information or data will be transmitted between sensing devices and the infrastructure brain using a combination of wireless or wired methods and different transmission protocols based on the sensor network characteristics, such as the number of sensors, distance, bandwidth, power and data: technical radio frequency requirements such as path obstacle and channel interferences will also be considered.
There is already a gradual digitalization of infrastructure, or “smart concrete”, that enables the monitoring of infrastructure to avoid its deterioration in order to make optimum investment decisions [2]: safe infrastructure requires data to evaluate its short and long term performance, where wireless sensor networks enable infrastructure monitoring without the Capital Expenditure (CAPEX) of cabling: this provides real time status data, therefore enabling proactive maintenance rather than a reactive approach, which is normally at higher cost. In addition to providing data connectivity, Wi-Fi and Bluetooth low energy (BLE) beacons can be used to collect infrastructure occupancy information [3]: these data are key for space management and assessments about usage.
The main component of digital infrastructure, or digital twin, is the Building Information Model (BIM). The BIM consists of two major components: a three dimensional graphical reproduction of the building geometry and a related database in which all data, properties and relations are stored. The value of the BIM generated during the design and construction phase is well documented and can result in an estimated 30% reduction in total construction costs [4]; however, once the building is handed over to its owners, the remaining applications of the BIM are not widely used by the building maintainers and operators. BIM technology adoption is focused on BIM human users and people interaction, rather than on technology, in order to achieve a successful change in management [5] and overcome the resistance of the construction and building industry against transformation (Figure 1).
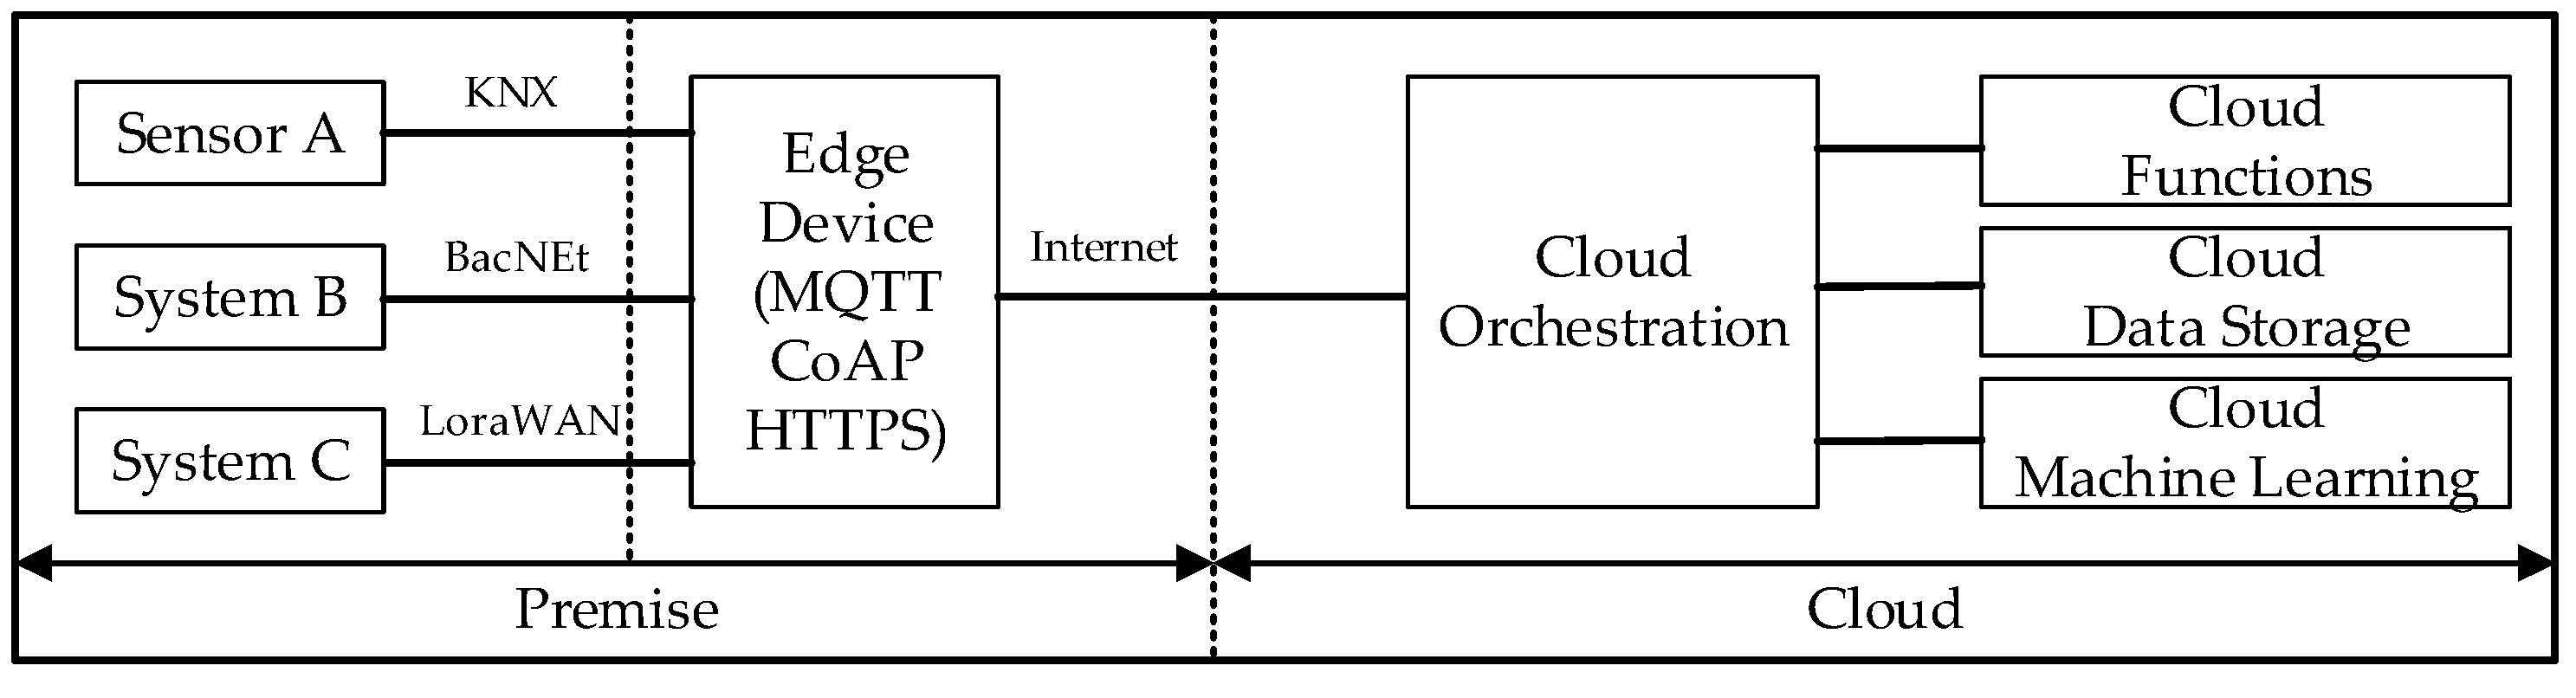
The Internet of Things (IoT) is the extension of digital connectivity into the physical devices and components of infrastructure based on numerous protocols such as Message Queuing Telemetry Transport (MQTT), Constrained Application Protocol (CoAP), Representational State Transfer (REST) and JavaScript Object Notation (JSON), among many others (Figure 2). In the IoT, things are objects of the physical world (physical things) that can be sensed or objects of the information world (virtual things) that can be digitalized: both are capable of being identified, integrated into information and transmitted via the sensor wired or wireless communication networks [6]. The IoT has made a significant contribution to building construction, operation and management by enabling data services, providing efficient functionalities and moving toward sustainable development goals [7]; however, the full adoption of the IoT in infrastructure still presents challenges such as the interoperability of protocols, data consistency and the amount of data to be collected, processed and stored. In addition, the integration of a BIM 3D virtual reality model with the real time uninterrupted collection of data from the IoT to control and manage infrastructure [8] provides innovative applications that improve construction and operational efficiencies. The integration methods between BIM tools’ Application Program Interfaces (APIs), cloud computing and relational databases for real time applications were created by a query language that uses semantic web technologies service oriented architecture (SOA) patterns and web services based strategies [9].
A virtual infrastructure represented in augmented reality (AR) will improve the user interaction with intelligent infrastructure for specific applications such as maintenance, training and wayfinding. AR combines 3D point cloud tracking for the accurate combination of indoor location and point of interest information [10] with a BIM dataset, where AR can access the BIM model to directly update its information. In addition to user interaction, intelligent infrastructure also focuses on providing quality of life and a healthy environment for its users: temperature and humidity variables such as air quality (CO2, chemicals and dust) are also being collected by sensors because poor air quality causes health issues and decreases productivity [11]. Infrastructure and building energy consumption contribute greatly to humanity’s global energy usage (50%) and CO2 emissions (30%) [12]. Smart grids and smart meters enable infrastructure users and owners to monitor energy usage in real time and shift demand according to energy price in order to get the biggest proportion of clean renewable energy [13]: intelligent infrastructure will be able to be an energy broker by storing and commercializing electricity in fleets of electric vehicles as the final energy distribution chain.
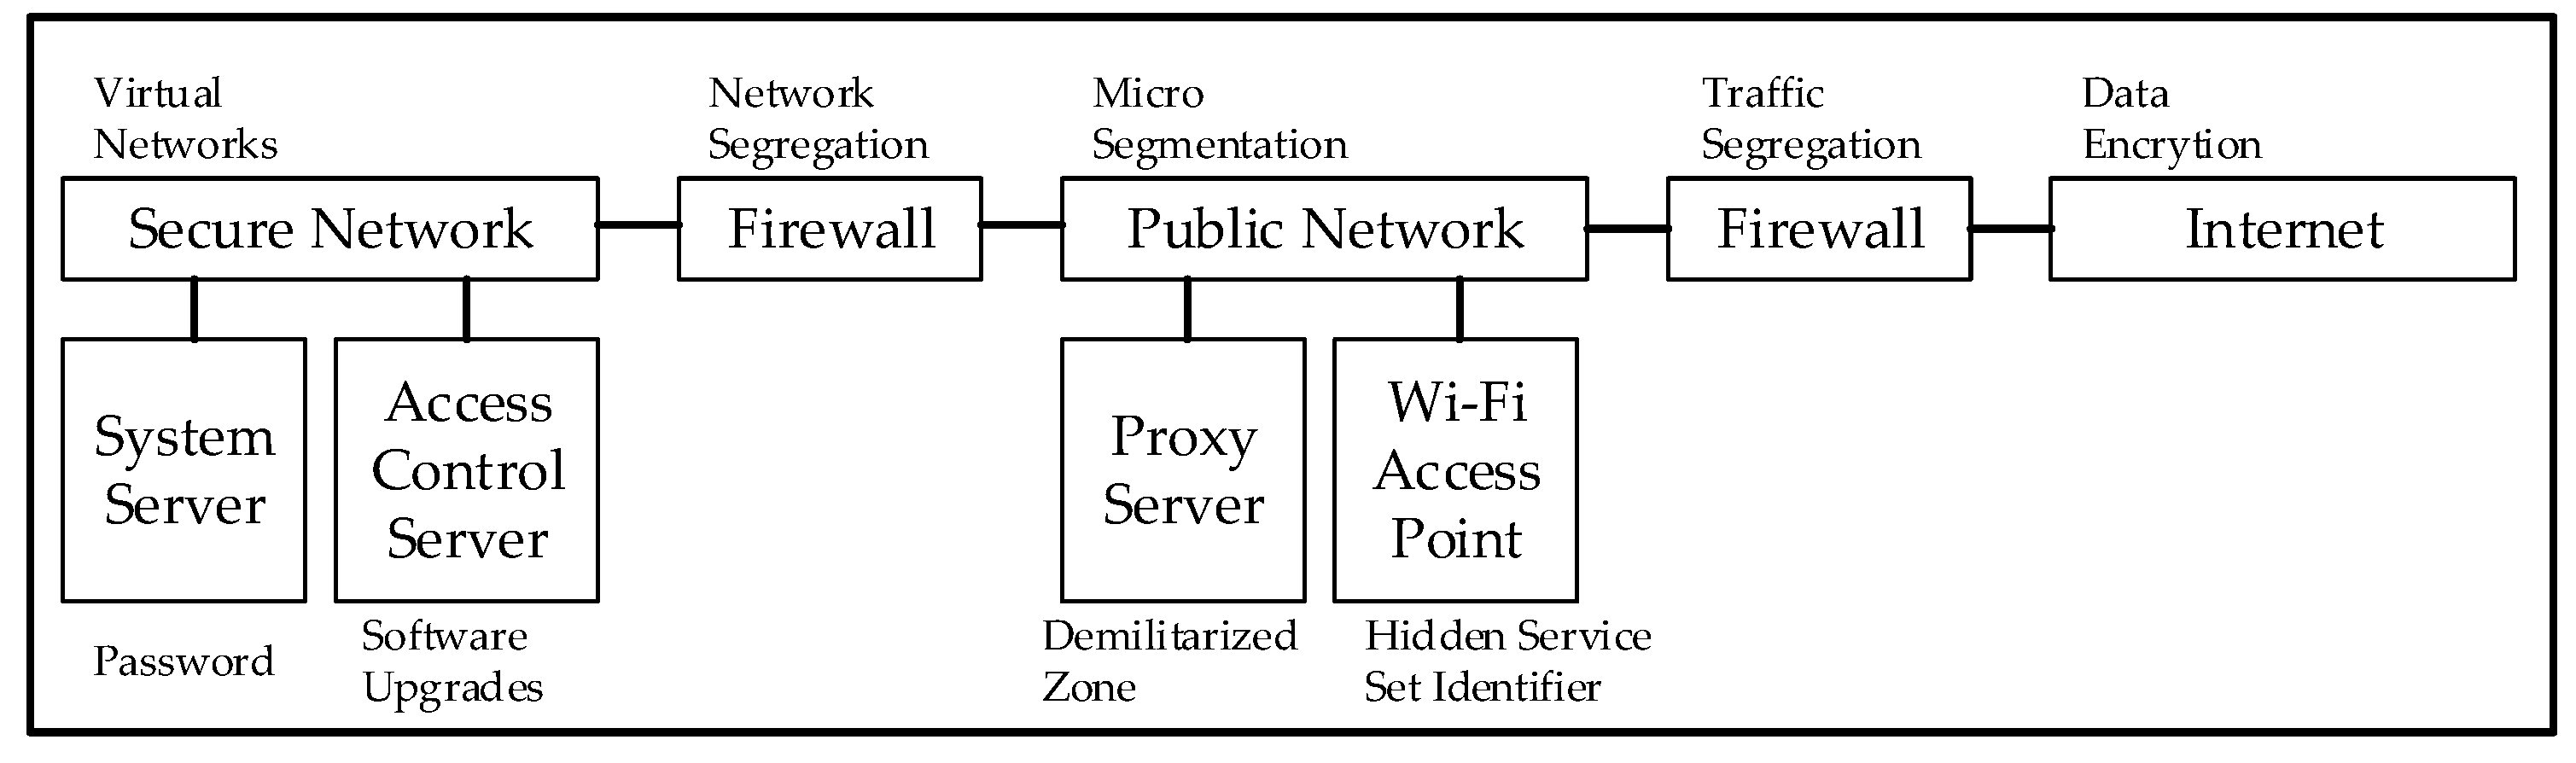
Although technology enables infrastructure to be smarter through the interconnection of users and the provision of services between systems, this open accessibility also increases cybersecurity risks (Figure 3). Securing the intelligent infrastructure cyberspace is key in order to protect safety, prosperity and economic growth [14]: critical infrastructure will be specifically protected, as potential attackers have a wide range of different motivations, such as hostile countries, political activism, ransom hacks, intellectual theft or disgruntled employee revenge. The main challenge that cybersecurity faces in intelligent infrastructure is its economic cost: despite its risk, cybersecurity is not considered a significant investment area because the cost of full implementation is prohibitive, therefore negating an exhaustive business case, which leads to reactive security rather than proactive security [15].
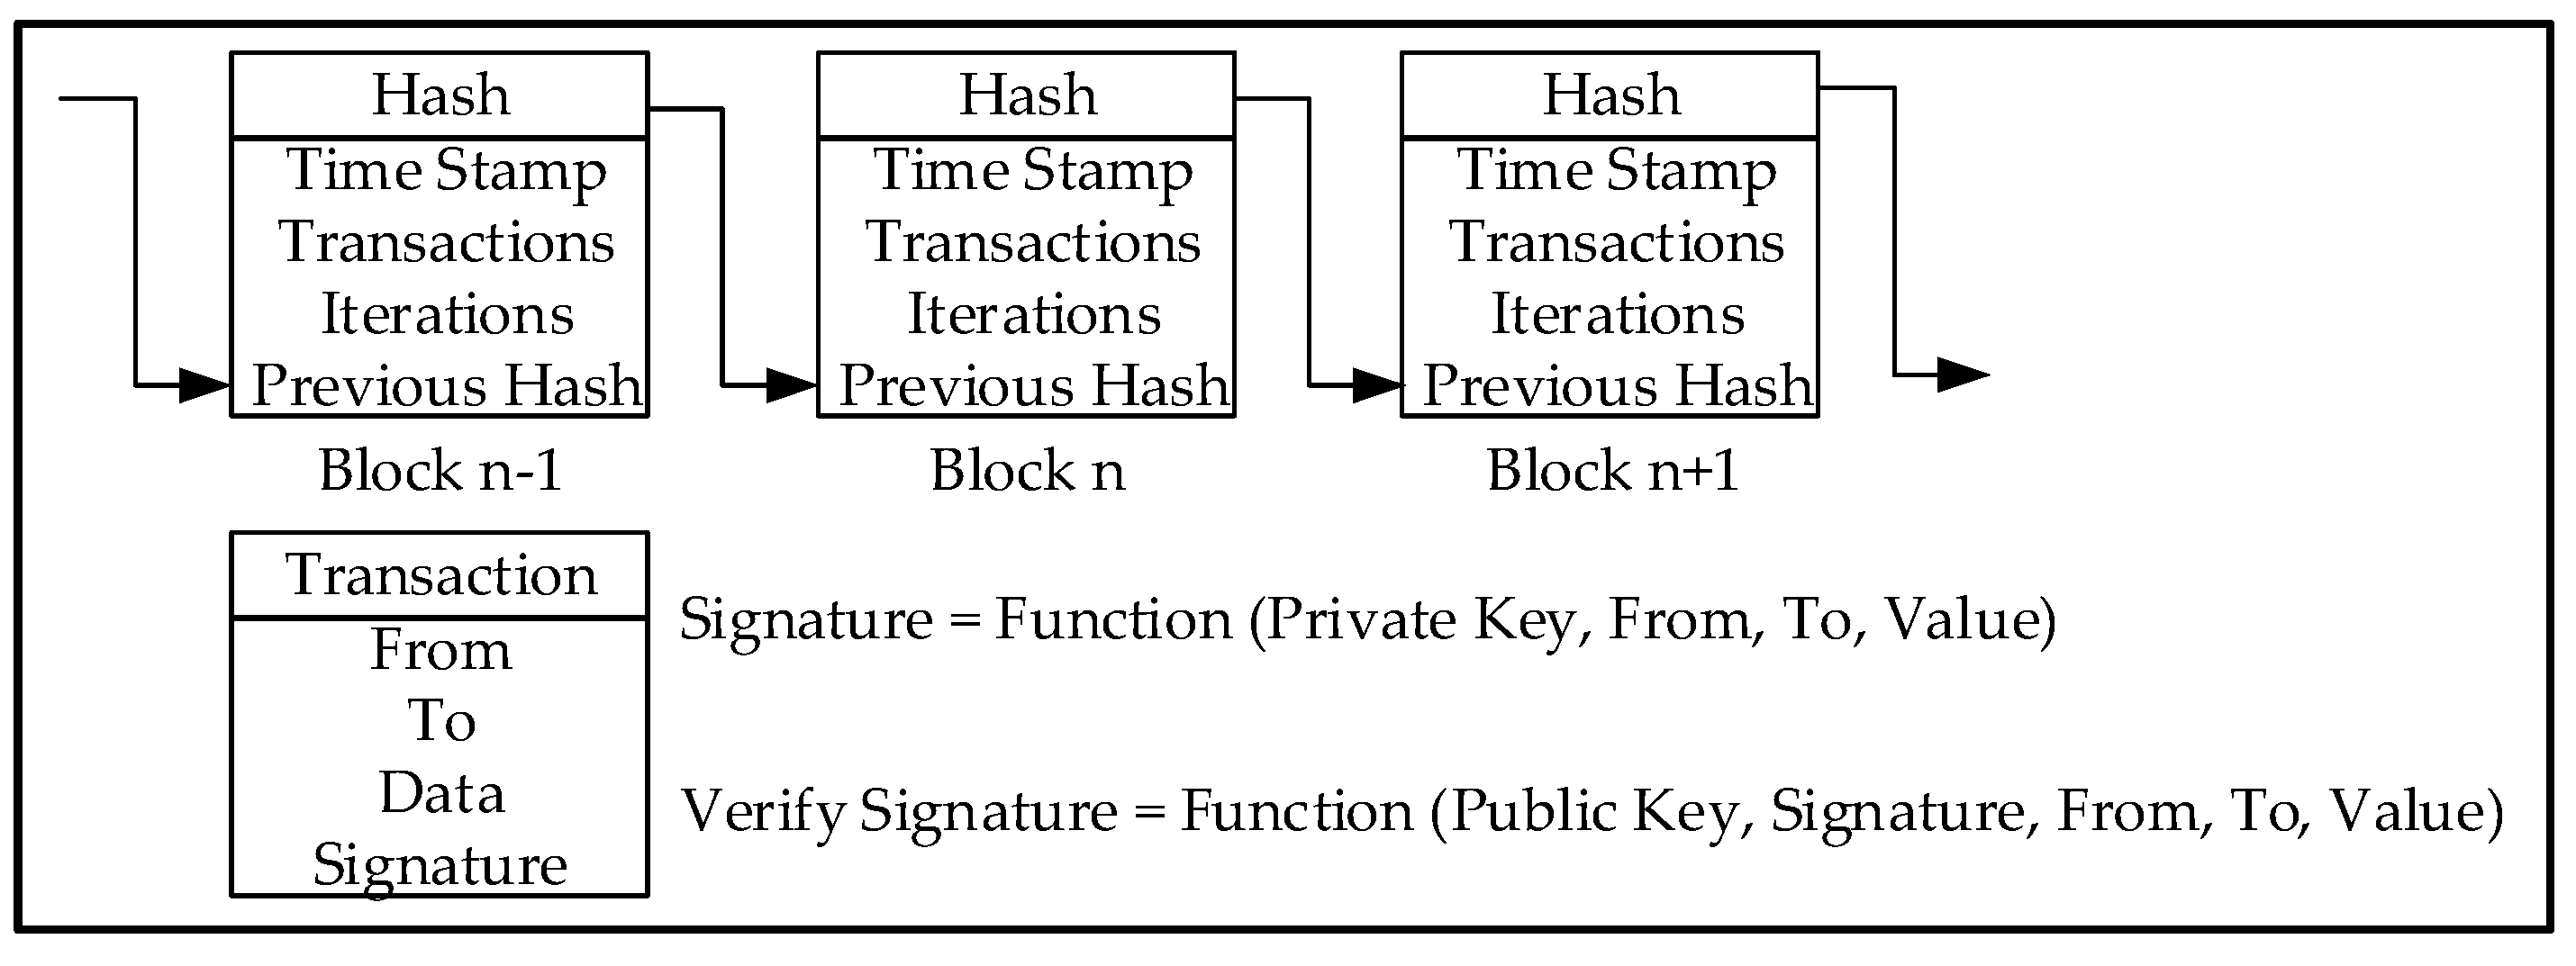
Blockchain technology (Figure 4) can also increase cybersecurity resilience in order to mitigate threats to the availability, integrity, confidentiality, authenticity and accountability of intelligent infrastructure [16]. Blockchain applications can be applied to humans, technology and businesses: they provide privacy, integrity and data confidentiality in transactions via a distributed structure [17] without the need for an intermediary authoriser. Blockchain services for intelligent infrastructure range from data validation, smart meter readings and payments, user authentication and asset integrity [18] to traditional payments, smart contracts and digital transactions of information or money [19].
The intelligence of infrastructure will be founded on artificial intelligence (AI), emulating the way biological organisms learn from experiences, adapt to the external environment, transmit information and finally evolve across mutations. AI is based on the brain structure and neural configuration: the brain acquires a large amount of information obtained from the senses, analyses and processes the data via different learned functions and finally makes judgments and takes decisions, where the clusters of neuron specialization occurs as a result of their adaption to learning tasks [20].
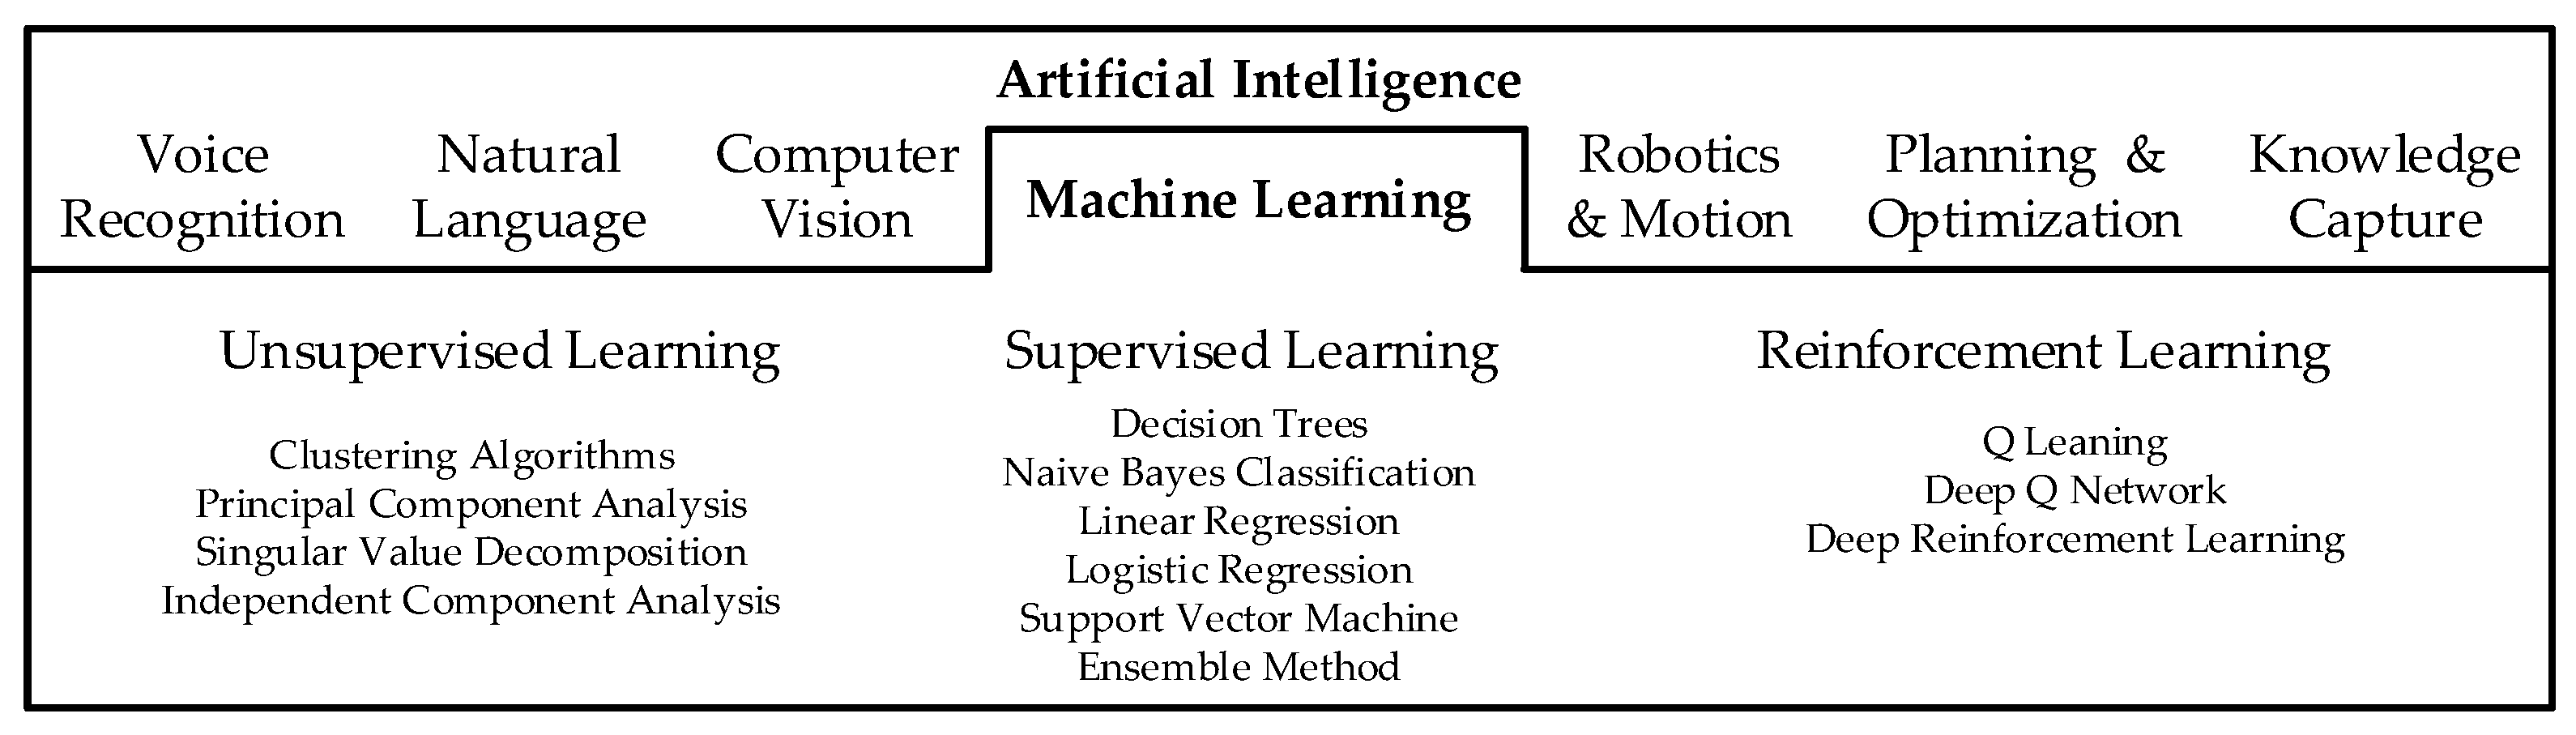
Intelligent algorithms can be divided into three main classes: Supervised learning finds a function matching given input–output pairs, and this method requires a training set. Instead, in unsupervised learning, only inputs are given, and the cost function to be minimized depends on the task to be modelled and a priori assumptions such as implicit properties of the model, its parameters or the observed variables. Finally, inputs are usually not given in reinforcement learning, as they are generated by an agent’s interactions with the environment: at each point in time, the agent performs an action and the environment generates an observation with an instantaneous associated cost according to some dynamics (Figure 5).
Different AI learning methods have diverse learning and computational properties: therefore, they are applied to different models. Reinforcement learning is used for fast and quick decisions in unsupervised scenarios; deep learning clusters based on gradient descent are most suited for identity and memory, although they are computationally expensive; and finally, genetic algorithms transmit information to future generations [21]. In addition, artificial intelligence has been used to make management decisions in complex management structures [22].
1.1. Article Proposal
This article proposes the implementation of artificial intelligence in intelligent infrastructure with an extensive literature review that also covers the building information model, the Internet of Things and deep reinforcement learning. In addition, this article also presents a deep reinforcement learning model based on a random neural network that updates the neural network weights, taking into consideration its entire previous learning, rather than just the latest information, therefore including time and memory. The proposed method was validated in a public research intelligent building dataset with successful results.
1.2. Article Structure
Section 2 of this article presents a research background that consists of artificial intelligence in infrastructure, Data and the Building Information Model, the Internet of Things with related cybersecurity and deep reinforcement learning. Section 3 presents a mathematical definition of the deep reinforcement learning model, whereas Section 4 includes a proposed method of intelligent infrastructure. The validation of the proposed method is shown in Section 5. Finally, a discussion and conclusions are shared in Section 6 and Section 7, respectively.
2. Research Background
2.1. Artificial Intelligence in Infrastructure
Several machine learning regression methods that develop a predictive model have been examined and applied to predict the hourly full load of the electrical power output of a combined cycle power plant [23]. Its base load operation is influenced by four main parameters: ambient temperature, atmospheric pressure, relative humidity and exhaust steam pressure, and these parameters are used as input variables in the dataset that affect the electrical power output, which is considered the target variable. The usage prediction of building energy has an important role in building energy management and conservation, as it assists in the evaluation of the building energy efficiency, the delivery of building commissioning and the detection and diagnosis of building system faults [24]: an artificial intelligence based approach for building energy uses prediction algorithms based on historical data and methods such as multiple linear regression, artificial neural networks and support vector regression. A statistical machine learning framework studies the effects of eight input variables (relative compactness, surface area, wall area, roof area, overall height, orientation, glazing area, glazing area distribution) on two output variables: the heating load and cooling load of residential buildings based on a classical linear regression approach [25] (the model is compared to a state of the art nonlinear nonparametric method based on random forests).
The forecast of energy consumption in homes is an important activity for the smart grid, and this prediction is very dependent on inhabitants’ behaviour [26]: a stochastic prediction method segments data based on patterns in energy consumption, aggregating it via the k means clustering algorithm. Data driven predictive models for the energy use of appliances include measurements of temperature and humidity sensors from a wireless network, weather from a nearby airport station and energy use [27]: data are filtered to remove nonpredictive parameters and enable feature ranking, where four statistical models are trained and evaluated with repeated cross validation (multiple linear regression, support vector machine with radial kernel, random forest and gradient boosting machines). Machine learning and artificial intelligence have been used in emergency navigation in a cloud environment to reduce device energy consumption [28] (without static ad hoc networks such as wireless sensor infrastructure) [29].
2.2. Infrastructure, Data and the Building Information Model
The building information model (BIM) was developed for effective collaboration between design and construction project participants through the building life cycle; however, in order for the BIM to be effective, it also requires additional layers of integration on a functional level (BIM modeler and checker), information management (BIM server) and process support (BIM collaboration) [30]. Despite its major technical advantages, the BIM has not been fully adopted, and its definitive benefits have not been fully capitalized by industry stakeholders during the construction and handover stage: this appears to be linked to risks and challenges such as intellectual property, user skills, model reuse and cybersecurity, which are potentially limiting its effectiveness [31]. In addition, the integration of BIM also blurs the level of responsibility between different team members and data and design ownership. Empirical insights into the implementation and collaborative nature of BIM construction projects are divided into (1) Information Technology capacity, (2) technology management, (3) attitude and behaviour, (4) role taking, (5) trust, (6) communication, (7) leadership and (8) learning and experience [32], where the taxonomy of BIM affects three dimensions: technology, people and process.
BIM applications in green infrastructure, or the green BIM triangle, follow specific project phases from design, construction to operation and renovation or demolition); green attribute analysis such as energy consumption, emissions, lighting or ventilation, material and waste; and finally, BIM attributes in supporting green building assessments, which includes database integration, document management, analysis and simulation and visualization [33]. Traditional risk management strategies can be complemented with BIM technology to manage hazards such as automatic rule checking, knowledge based systems and reactive proactive IP based safety systems [34]: BIM could not only be utilized to support project development processes as a systematic risk management tool, but it could also provide the core data generator and platform to allow other BIM based tools to perform further risk analysis (although due to existing technical limitations and the lack of “human factor” testing, BIM based risk management has not been commonly used in real environments). A BIM model can be integrated with other IoT technologies to improve user interaction and interfaces [35]: examples include an ultrawide band (UWB) based indoor positioning system and an inertial measurement unit (IMU) that retrieves user contextual information with respect to the built environment for the control of electric appliances in a smart home. The BIM can also be applied with other manufacturing and production techniques and reverse engineering [36], which include 3D laser scanning, virtual reality, 3D printing and prefabrication for a better understanding of the design and construction process and for tools with enhanced organization and management quality that reduce defects and reworks.
There are also additions and extensions to the traditional BIM model: BIM itself is a purpose built, product centric information database that lacks domain semantics. An ontology based semantic approach that analyses construction workface planning is focused on extracting quantity information from a BIM design model. This method allows user semantic queries using a domain vocabulary that exploits the building product ontology formalized from construction perspectives [37]: as such, information relevant to construction practitioners can be readily extracted and visualized in 3D in order to serve application needs in the construction field.
A 4D BIM is defined as a 3D model that includes time, and it can be used as a framework to automatically analyse, generate and visualize the evacuation paths of multiple teams considering construction activities and site conditions of the specific project schedule [38]: the prototype enables users to define parameters for pathfinding, such as workspaces, material storage areas and temporary structures, to automatically identify the accessible evacuation paths. A 6D BIM model that also included time, a cost schedule and CO2 emissions calculations was applied in a railway station, Kings Cross London [39]: the model provided an effective plan and design that adjusted to the economic and environmental framework and requirements of a construction project while operating in tandem with maintenance and uninterrupted railway operations.
2.3. The Internet of Things and Cybersecurity
The IoT enables comprehensive connectivity between devices; however, this benefit also intrinsically increases cybersecurity risks, as cyber attackers are provided with expanded network access and additional digital targets. The evolution of IoT technology started with “machine to machine” through the connection of machines and devices, and then included “Interconnections of Things” that connect any physical or virtual object and finally a “Web of Things” that enables collaboration between people and objects [40]. The fast development of the IoT had the consequence that it was initially designed without appropriate consideration of the security challenges involved [41]: various vulnerabilities have been detected that will keep the IoT as a technology with risks, and as a result, numerous attacks on the IoT were invented before its actual commercial implementation [42]. As security will be a fundamental enabling factor of most IoT applications, mechanisms must also be designed to protect communications enabled by such technologies [43]. The IoT is formed of three layers (sensor, transportation and application) that are similar to traditional networks with equivalent security issues and integration challenges [44]. Because physical, virtual and user private information is captured, transmitted and shared by the IoT sensors [45], the enforcement of security and privacy policies will also consider and implement the cybersecurity aspects of data confidentiality and authentication, access control within the IoT network, identity management, privacy and trust between users and things. The dynamic IoT is formed by heterogeneous technologies that provide innovative services in various application domains, which will meet flexible security and privacy requirements [46]: traditional security countermeasures cannot be directly applied due to the different standards, communication protocols and scalability issues related to and as a consequence of the high number of interconnected devices. An important challenge for supporting diverse multimedia applications in the IoT is the security heterogeneity of wired and wireless sensor and transmission networks, which requires a balance between flexibility and efficiency [47]. A secure and safe Internet of Things (SerIoT) was proposed to improve the information and physical security of different operational IoT application platforms in a holistic and cross layered manner [48]: the SerIoT covers areas such as mobile telephony, networked health systems, the Internet of Things, smart cities, smart transportation systems, supply chains and industrial informatics [49].
The IoT enables the integration of intelligent behaviour and services into the surrounding environments, such as infrastructure and buildings [50]: a smart building management system based on knowledge databases, machine learning, big data engines and data storage extracts information from the building, its users or managers; adapts to the real environment; and finally takes action on building systems applying previously learned strategies. The commoditization of smart building technology based on the IoT will redefine the way we work and live in the future. The promise of intelligent infrastructure extends far beyond energy efficiency or house comfort services, and the IoT will enable radical changes similar to the ones brought by the internet [51]: cloud integration is democratizing the IoT in intelligent infrastructure to include more complex functionality at a reduced cost (however, it also provides additional issues, such as cybersecurity and privacy, that will be addressed). An IoT platform based implementation for design automatization in smart building systems reuses hardware and software on shared infrastructure to optimize design performance [52]: the methodology consists of a functional design layer with virtual device platforms, function templates and virtual devices; a module design layer with module platforms, virtual device templates, sensing modules and data analytics modules; and finally an implementation platform with building operation systems APIs and programme code run time. Digitalization will merge the intelligence of infrastructure, buildings and transport systems because technology and solutions based on IoT and AI are shared [53] to cover similar functionalities such as route optimization, parking management, accident detection or fare collection.
2.4. Deep Reinforcement Learning
Deep learning enables reinforcement learning to scale decision making solutions that were previously unmanageable. A new algorithm called double deep Q network (DQN) generalizes an arbitrary function approximation [54]: the algorithm includes deep neural networks and reduces overestimations by decomposing the max operation in the target into action selection and action evaluation. Although the DQN solves problems with high dimensional observation spaces, it can only manage discrete and low dimensional action spaces. The DQN depends on finding the action that maximizes the cost function, which in the continuous valued case requires an iterative optimization process at each step [55]: in order to overcome this issue, an algorithm based on the deterministic policy gradient operates over continuous spaces.
A framework for deep reinforcement learning asynchronously executes multiple agents in parallel on multiple instances of the environment [56]: this parallelism decorrelates the agent’s data into a more stationary process based on gradient descent that optimizes deep neural network controllers. A neural network architecture for the modelling of free reinforcement learning consists of a dual network that represents two separate estimators, one for the state value function and the other for the state dependent action advantage function [57]: the two streams are combined via a special aggregating layer to produce an estimate of the state action from the value function. Continuous simple actions, high state and action dimensionality control, tasks with partial observations and tasks with hierarchical structures are benchmarked [58]. Challenges posed by reproducibility, experimental techniques and reporting procedures on deep reinforcement learning methods [59] have been presented in reported metrics, where results are compared to common baselines to suggest guidelines to make future results more reproducible. Deep reinforcement learning has also been applied in resource management problems for systems and networking [60]: the decision making tasks where appropriate solutions are taken depend on understanding the workload and environment experience.
The end to end learning of communications protocols in complex environments presents issues on partial observability, where multiple agents sense and act with the goal of maximizing their shared utility: these drawbacks are addressed by two approaches based on centralized learning but decentralized execution [61]: reinforced interagent learning applies deep Q learning, and differentiable interagent learning exploits the fact that, during learning, agents can back propagate error derivatives through noisy communication channels. Imagination augmented agents (I2As) is a novel architecture for deep reinforcement learning that combines model free and model based aspects [62]: model based reinforcement learning and planning methods prescribe how a model should be used to arrive at a policy, whereas I2As learns to interpret predictions from a learned environment model to construct implicit plans in arbitrary ways by using the predictions as additional context in deep policy networks.
The useful interaction between sophisticated reinforcement learning (RL) systems and real world environments requires the communication of complex goals in these systems. Goals can be defined in terms of nonexpert human preferences between pairs of trajectory segments to solve complex RL tasks that do not require access to the reward function [63]: the model can successfully train complex novel behaviours with one hour of validation time, which reduces the cost of human supervision. Learning goal directed behaviour in environments with sparse feedback is a major challenge for reinforcement learning algorithms, and one of the key difficulties is insufficient exploration that results in an agent being unable to learn robust policies: intrinsically motivated agents can explore new behaviour for their own sake rather than directly solving external goals and tasks posed by the environment. A hierarchical DQN (h DQN) is a framework that integrates hierarchical action value functions that operate at different temporal scales with intrinsically motivated goal driven based deep reinforcement learning [64]: a top level q value function learns a policy over intrinsic goals, while a lower level function learns a policy over atomic actions to satisfy flexible goal specifications such as functions over entities and relations.
To use reinforcement learning successfully in situations close to real world complexity, agents must derive efficient representations of the environment from high dimensional sensory inputs and use these to transform past experiences into typical models that can be adapted to new situations [65]: humans and other animals solve this problem through a combination of reinforcement learning and hierarchical sensory processing systems. A deep Q network can successfully learn policies directly from high dimensional sensory inputs using end to end reinforcement learning. A learning energy based policy for continuous states and actions applies a soft Q learning method based on learning maximum entropy policies that expresses the optimal policy via a Boltzmann distribution [66]: the amortized Stein variational gradient descent learns a stochastic sampling network that approximates samples from this distribution in order to improve the exploration and composition that allow for transferring skills between tasks with a connection to actor critic methods.
A framework for autonomous driving that uses deep reinforcement learning is a challenging model as a supervised learning problem due to its complex interactions with the environment, including other vehicles, pedestrians and roadworks [67]: the model incorporates recurrent neural networks for information integration in order to enable vehicles to handle partially observable scenarios, and it also integrates recent work on attention models that focused on relevant information to reduce the computational complexity for deployment in embedded hardware. There have been six extensions to the DQN algorithm (double Q learning, prioritized replay, duelling networks, multistep learning, distributional reinforcement learning and noisy sets); however, it is unclear which of these extensions are complementary and can be successfully combined [68], and an integrated agent called rainbow combines them to assess incremental performance with several experiments.
Two less often addressed issues of deep reinforcement learning are the lack of a generalization capability for new target goals and data inefficiency, as it requires several and costly iterations of trial and error to converge, which makes real world scenario applications impractical [69]. To address the first issue, an actor critic model whose policy is a function of the goal as well as the current state allows for a more efficient generalization process. To address the second issue, a framework provides an environment with high quality 3D scenes and a physics engine that enables agents to take actions and interact with objects in order to collect efficiently a huge number of end to end trainable samples that do not need feature engineering, feature matching between frames or 3D reconstruction of the environment. An active detection and class specific model locates objects in scenes that enable an agent to focus attention on candidate regions for identifying the correct location of a target object [70]: the agent learns to deform a bounding box using simple transformation actions with the goal of determining the most specific location of target objects, which follows top–down reasoning and deep reinforcement learning.
Deep reinforcement learning enables autonomous robots to learn large collections of behavioural skills with minimal human intervention; however, robotic applications of reinforcement learning often compromise the autonomy of the learning process in favour of achieving training times that are practical for real physical systems [71], and a deep reinforcement learning algorithm based on off policy training of deep Q functions can scale to complex 3D manipulation tasks that can learn deep neural network policies efficiently enough to train real physical robots. Typically, deep reinforcement learning methods only utilize visual input for training, although an innovative method augments these models to exploit 3D feature information during the training phase involving partially observable states [72]: the model is trained to simultaneously learn these features, which minimise a Q learning objective in order to improve the training speed and performance of the agent.
3. Deep Reinforcement Learning Model
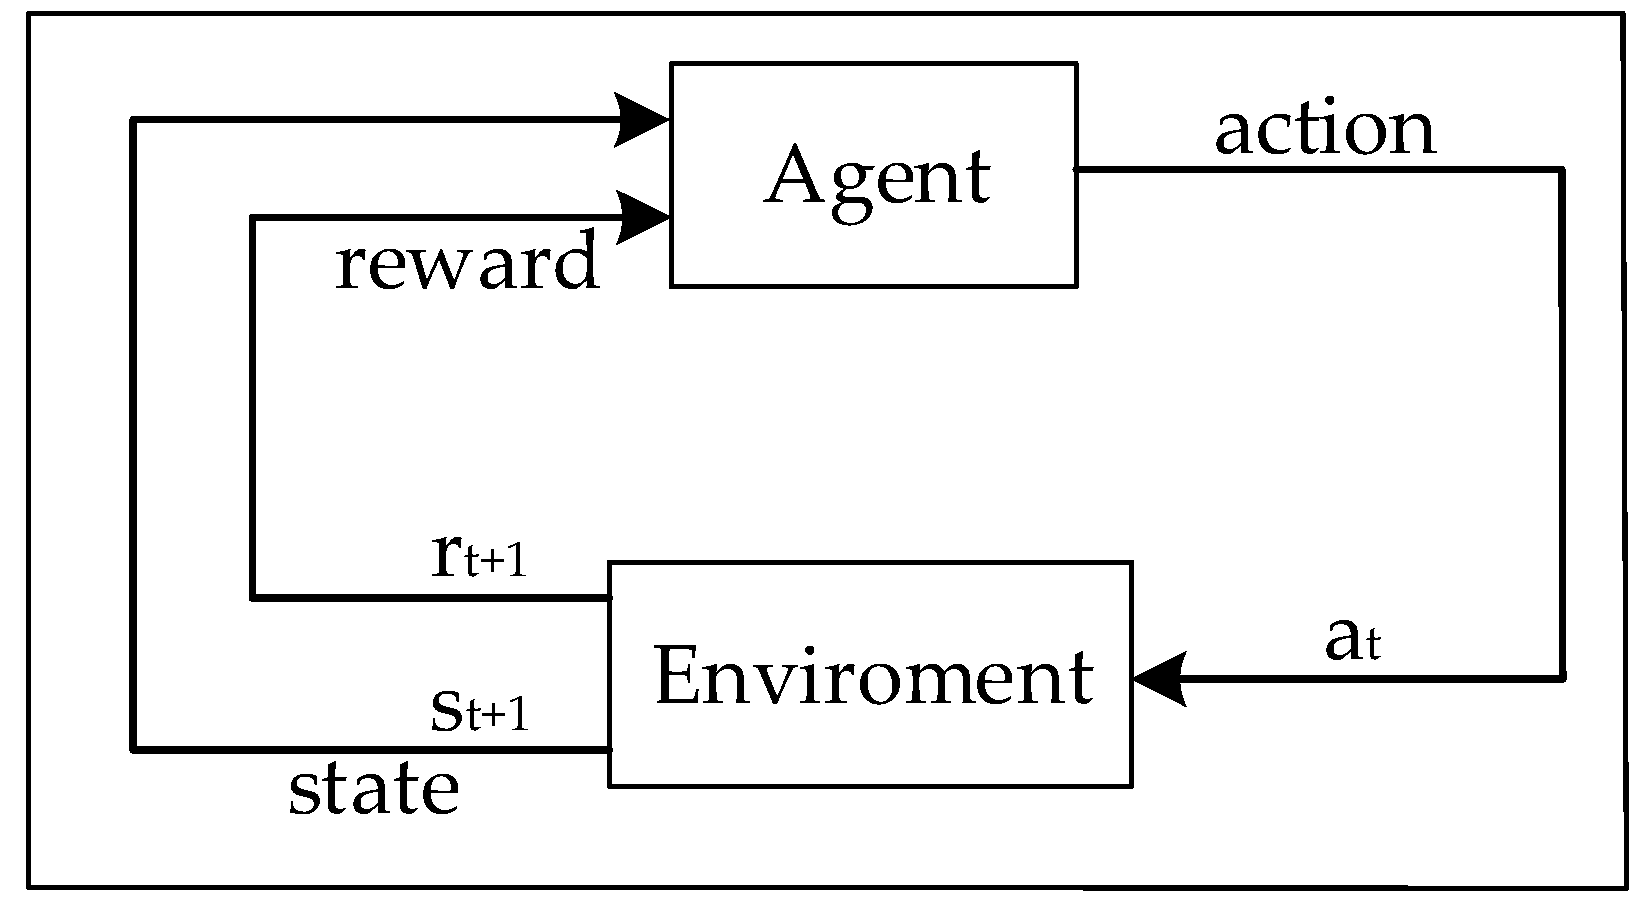
In a reinforcement learning model [73], agents interact with the environment via observations (O) and actions (A). At each interaction step t, the agent receives as input some indication of the current state st of the environment. Then the agent selects an action at with a probability pt of generating output. This action changes the state st of the environment to st+1, and the value of this state evolution is transmitted to the agent through a scalar reinforcement signal or reward rt+1 associated with the transition (st, at, st+1). The agent chooses actions over time that tend to increase the long term sum of values of the reinforcement signal by trial and error guided by a reinforcement algorithm. Basic reinforcement learning is modelled as a Markov decision process (Figure 6):
- A set of environment and agent states, S;
- A set of actions, A, of the agent;
- A set of observations O, from the agent;
- A set of temporal measurements t;
- Pa(s, st) as the probability of transition from state st to state st+1 under action at;
- Ra(s, st) as the immediate reward rt+1 after transition from state st to state st+1 under action at;
- Rules that describe agent observations.
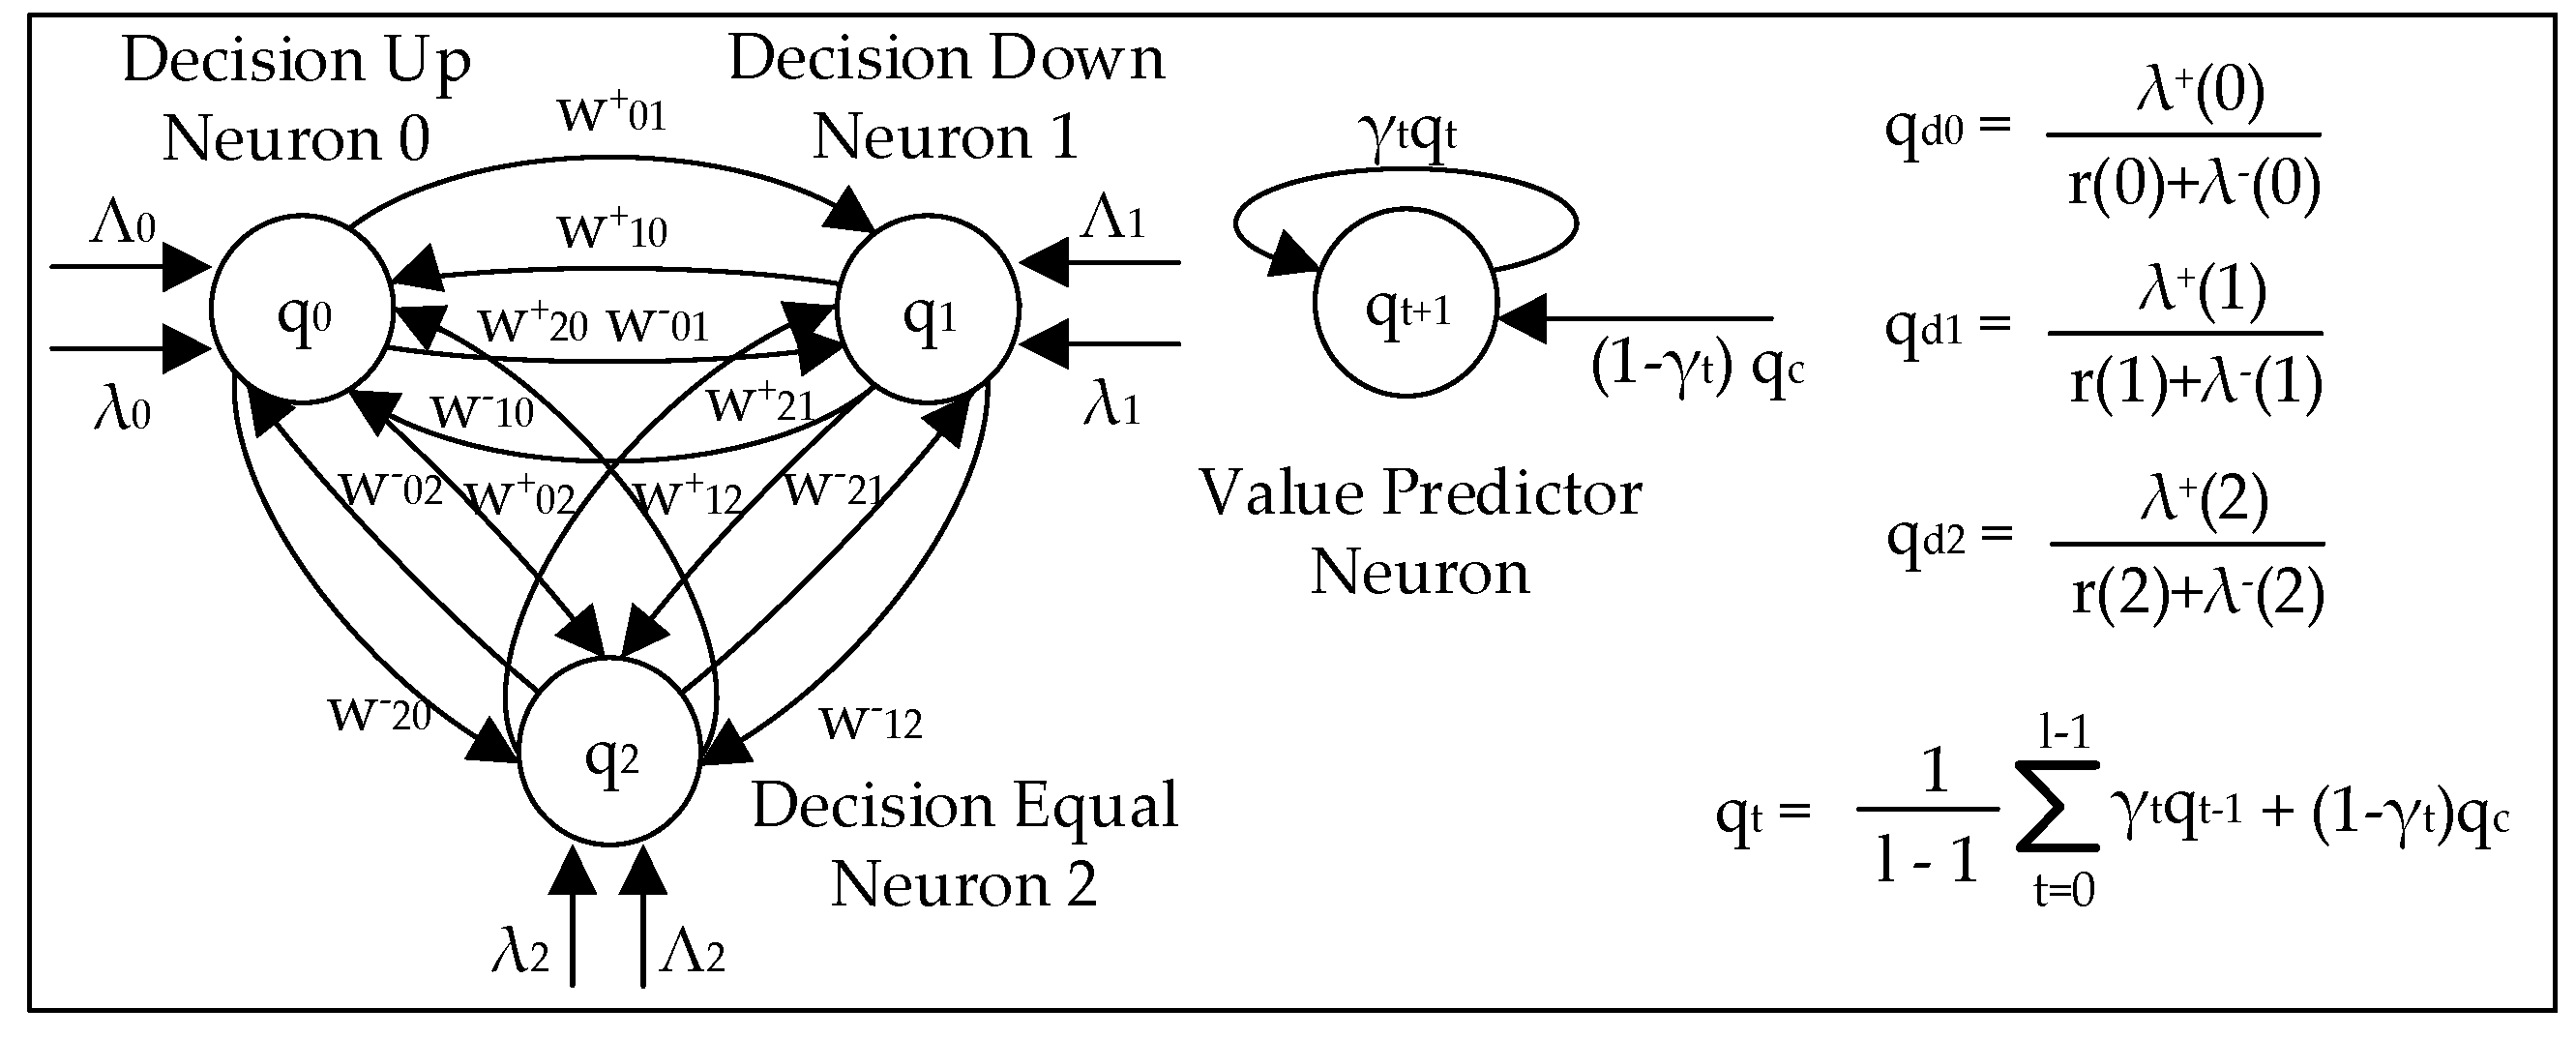
The deep reinforcement learning algorithm presented in this section consists of a random neural network (RNN) [74,75,76] with at least as many nodes as the number of decisions to be taken: the network is generated where neurons are numbered 1, …, j, …, n, and therefore for any decision i, there is some neuron i. Decisions in this RL algorithm with an RNN are made by selecting the decision j for which the corresponding neuron is the most excited, the one that has the largest value of qj. The state qj is the probability that it is excited, and these quantities satisfy the following system of nonlinear equations:
In the deep reinforcement learning model, neurons make decisions if the next reward trend is upwards, downwards or equal (Figure 7). In addition, as defined at the end of this section, the proposed model also includes a predictor neuron to forecast the value of future rewards.
In altering the reinforcement learning algorithm described in the cognitive packet network [77,78,79,80,81], given that some goal G that the agent has to achieve is a function to be optimized and that reward R is a consequence of interaction with the environment, successive measured values of R are denoted by Rl, l = 1, 2, …, and these are used to compute a decision threshold Tl:
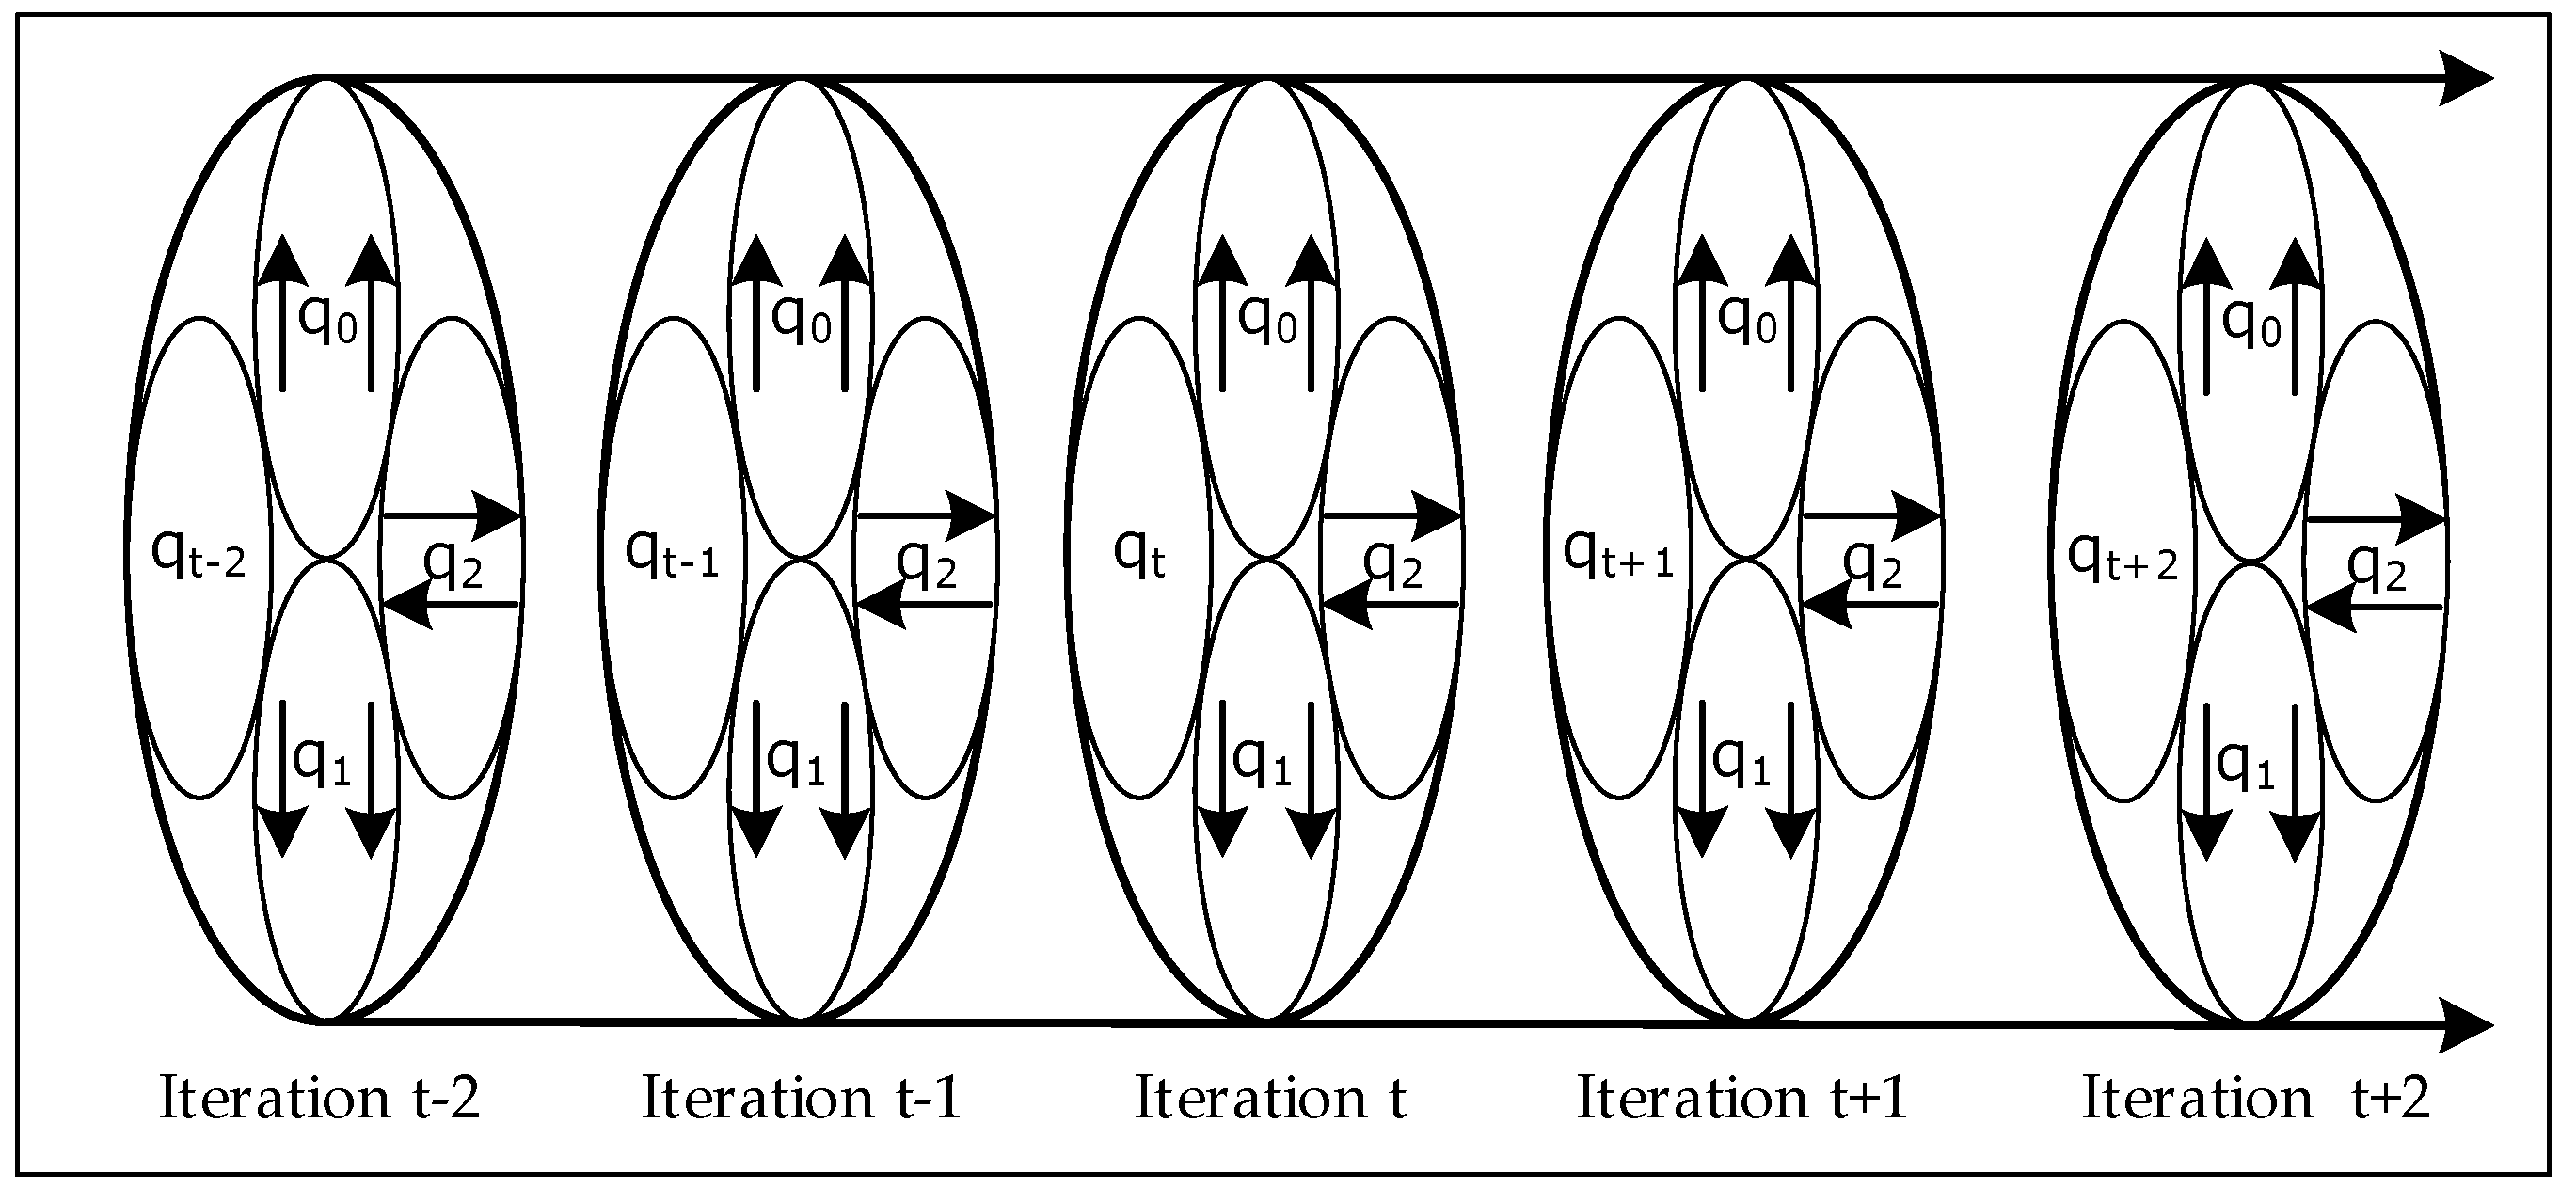
where α represents the threshold memory, and 0 < α < 1 and β represent the learning gradient. Both variables can be statically assigned or dynamically updated based on external observations. The agent takes the lth decision, which corresponds to neuron j, and then the lth reward Rl is measured and its associated Tl-1 is calculated, where the network weights are updated as follows for all neurons i ≠ j. The key innovation of the deep reinforcement learning algorithm presented in this section is that it includes time, or memory, when updating the network weights: it is based on all previous values rather than the previous state (Figure 8).
The deep reinforcement algorithm rewards the network weights if the trend decision is correct, where R1 > 0 and j = 0 for upwards, R1 < 0 and j = 1 for downwards or R1 = 0 and j = 2 for equal:
Otherwise, it penalises the networks weights by
where δt is a variable weighting factor that depends on t, 0 < δt < 1, and l is the stage decision. In the above equations, w+ij is the rate at which neuron i transmits excitation spikes to neuron j, and w-ij is the rate at which neuron i transmits inhibitory spikes to neuron j in both situations when neuron i is excited. Λi and λi are the rates of the external excitatory and inhibitory signals, respectively. In addition to the reinforcement learning algorithm for decision trends, the deep reinforcement algorithm makes predictions on the future values of the manager neurons qt+1 based on the previous predictions qt and current measurement qc:
where γt is a variable weighting factor that depends on t, 0 < γt < 1, that can be statically or dynamically assigned, representing the prediction memory.
4. Deep Reinforcement Learning in Intelligent Infrastructure
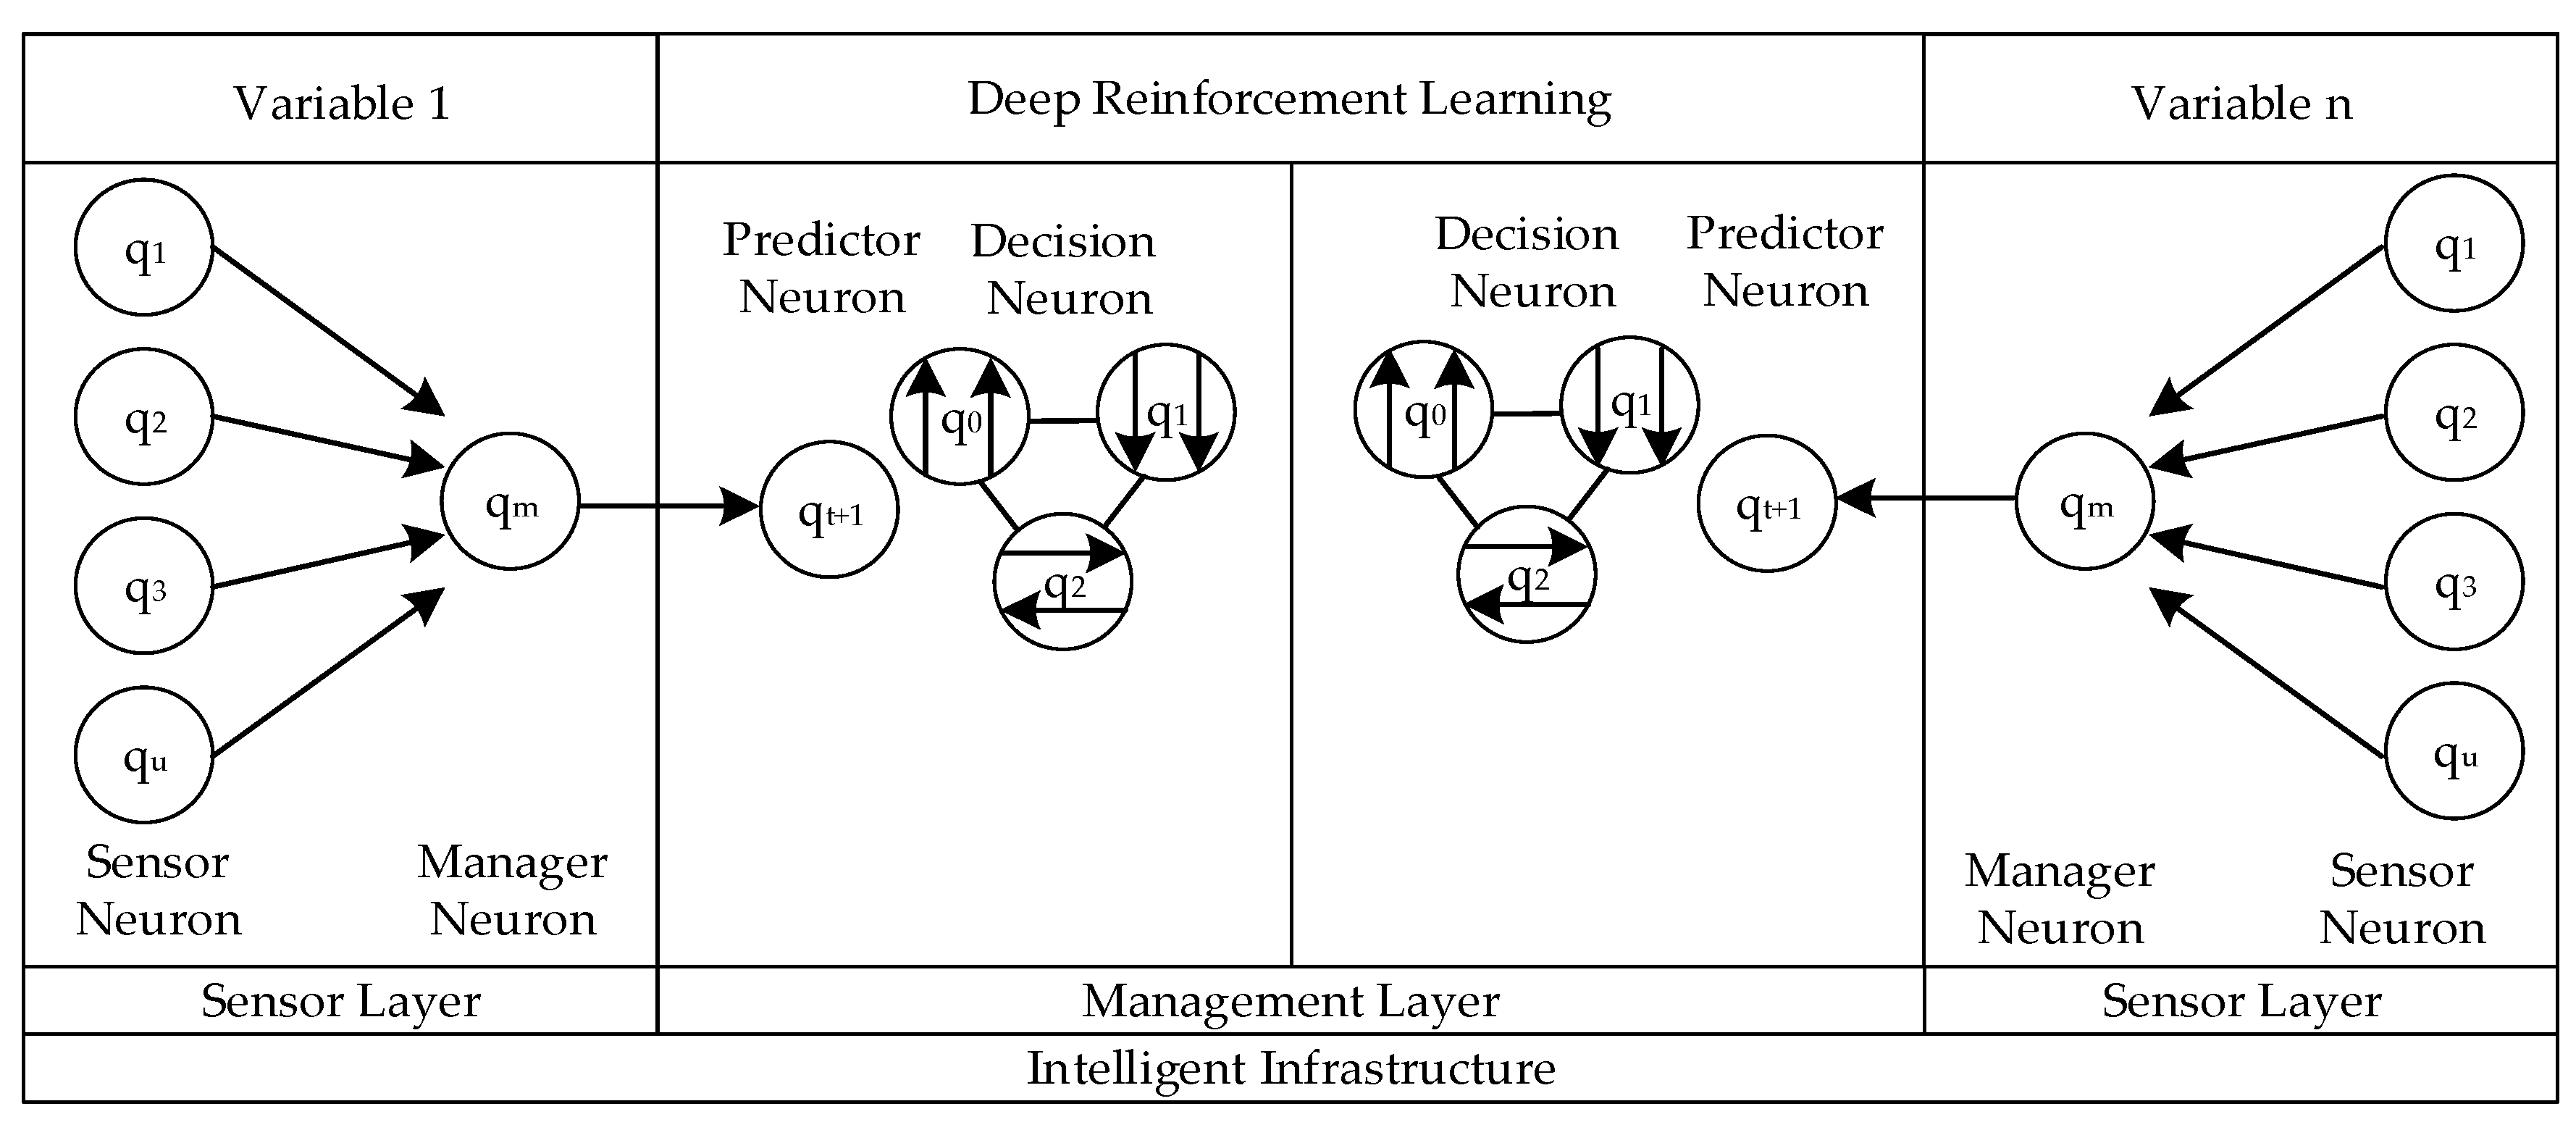
The intelligent infrastructure model consists of a layer of sensor neurons that takes infrastructure measurements for specific variables such as temperature or humidity related to a precise area or floor. The u sensor neurons are connected to their respective management sensor, which averages their value. In addition, a neural management layer that makes predictions about the sensor network values and trends is based on the presented deep reinforcement learning (Figure 9).
The intelligent infrastructure presented in this article uses deep reinforcement learning to make three trend decisions with three associated neurons and an independent neuron that makes predictions of the values of the manager neuron qm:
- q0 predicts that the trend of the manager neuron qm is to go upwards or up;
- q1 predicts that the trend of the manager neuron qm is downwards or down;
- q2 predicts that the trend of the manager neuron qm is to keep its value or be equal;
- qt+1 predicts the value of the manager neuron qm.
5. Deep Reinforcement Learning in Intelligent Infrastructure: Validation and Results
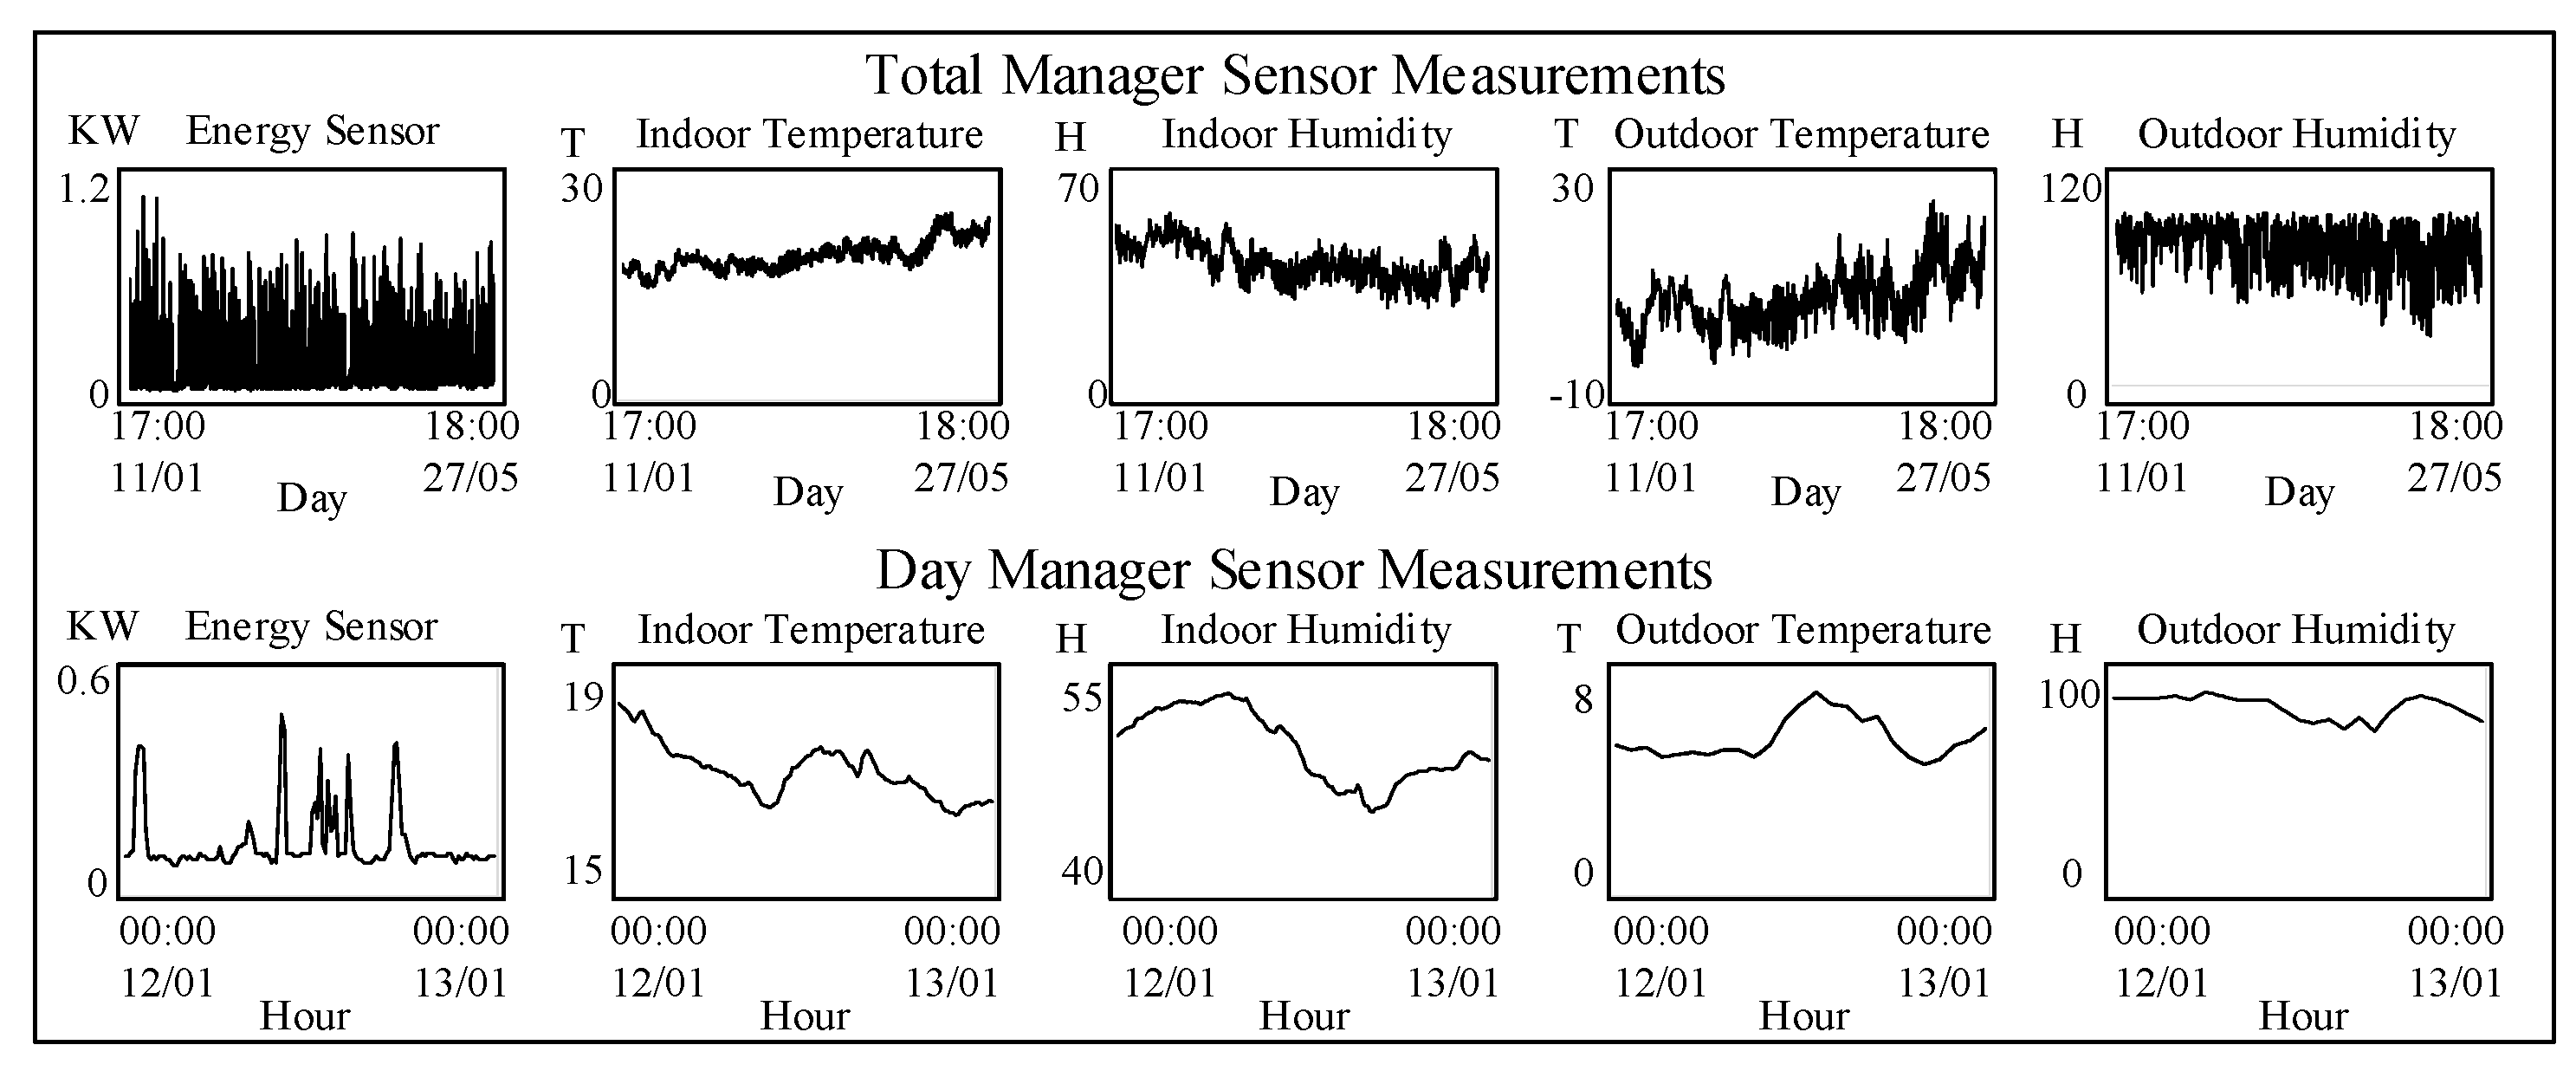
The intelligent infrastructure deep reinforcement algorithm was validated with a research dataset [27] (https://github.com/iamrishab/Data-driven-prediction-models-of-energy-use-of-appliances-in-a-low-energy-house) based on a house with electric metering with Meter-Bus energy counters that measure the energy consumption of appliances, electric baseboard heaters and lighting (Figure 10). The house temperature and humidity were monitored with a ZigBee wireless sensor network located in nine different zones: in addition, the temperature and humidity of an external weather station was also included.
Information was collected every 10 min for 137 days (4.5 months) from 11 January 2016 at 17:00 to 27 May 2016 at 18:00, with 19,736 measurements in total, where an entire day was formed of 144 measurements. Key values of the dataset are shown in Table 1. Deep reinforcement learning is an unsupervised learning algorithm, and therefore the validation did not include training iterations.
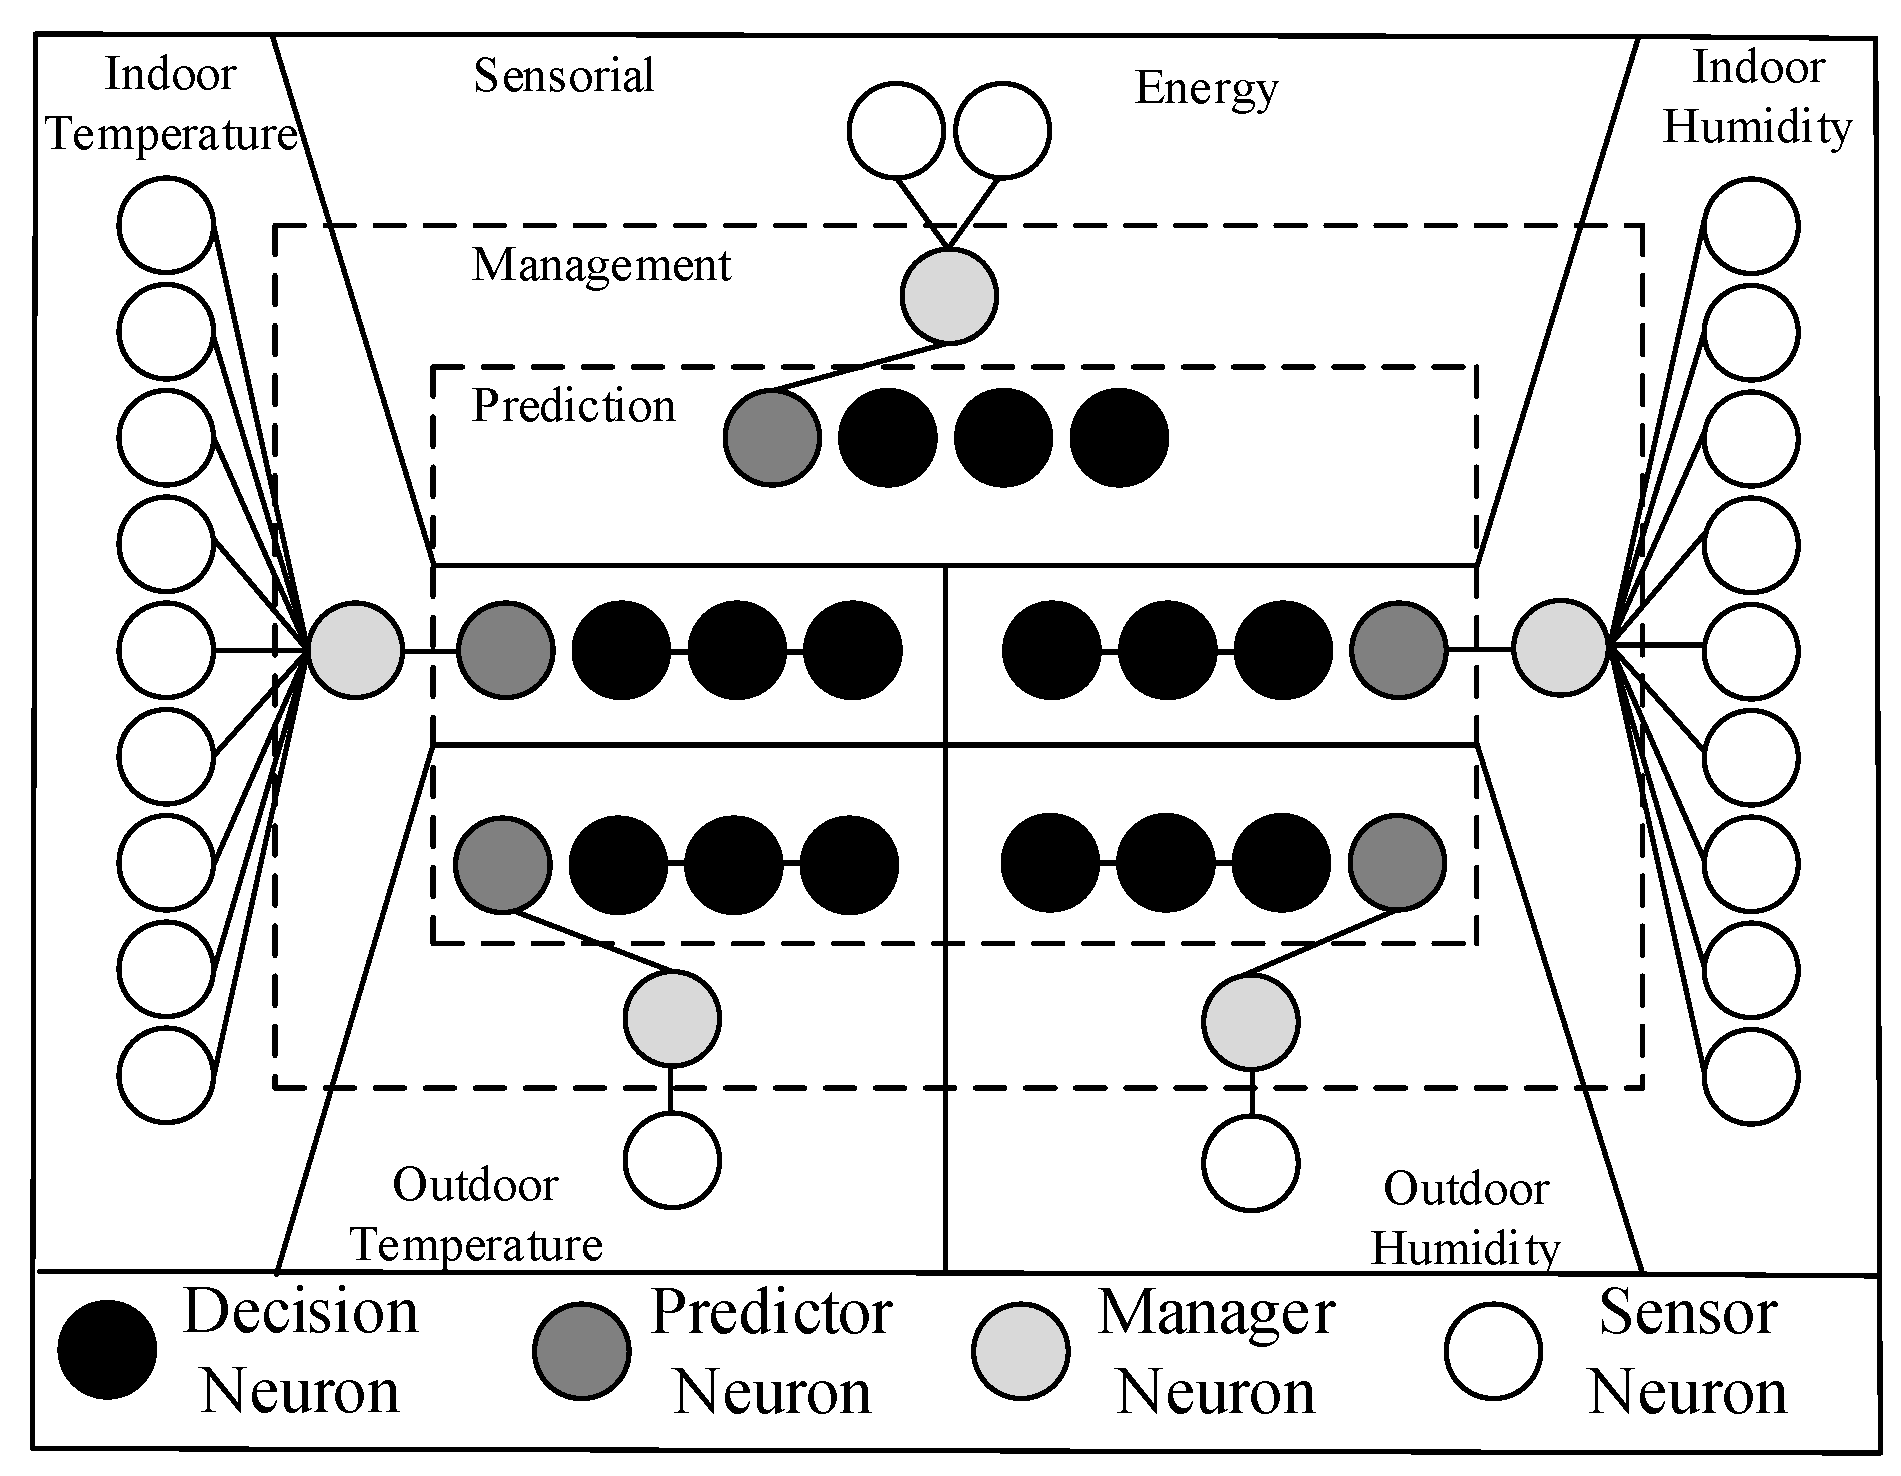
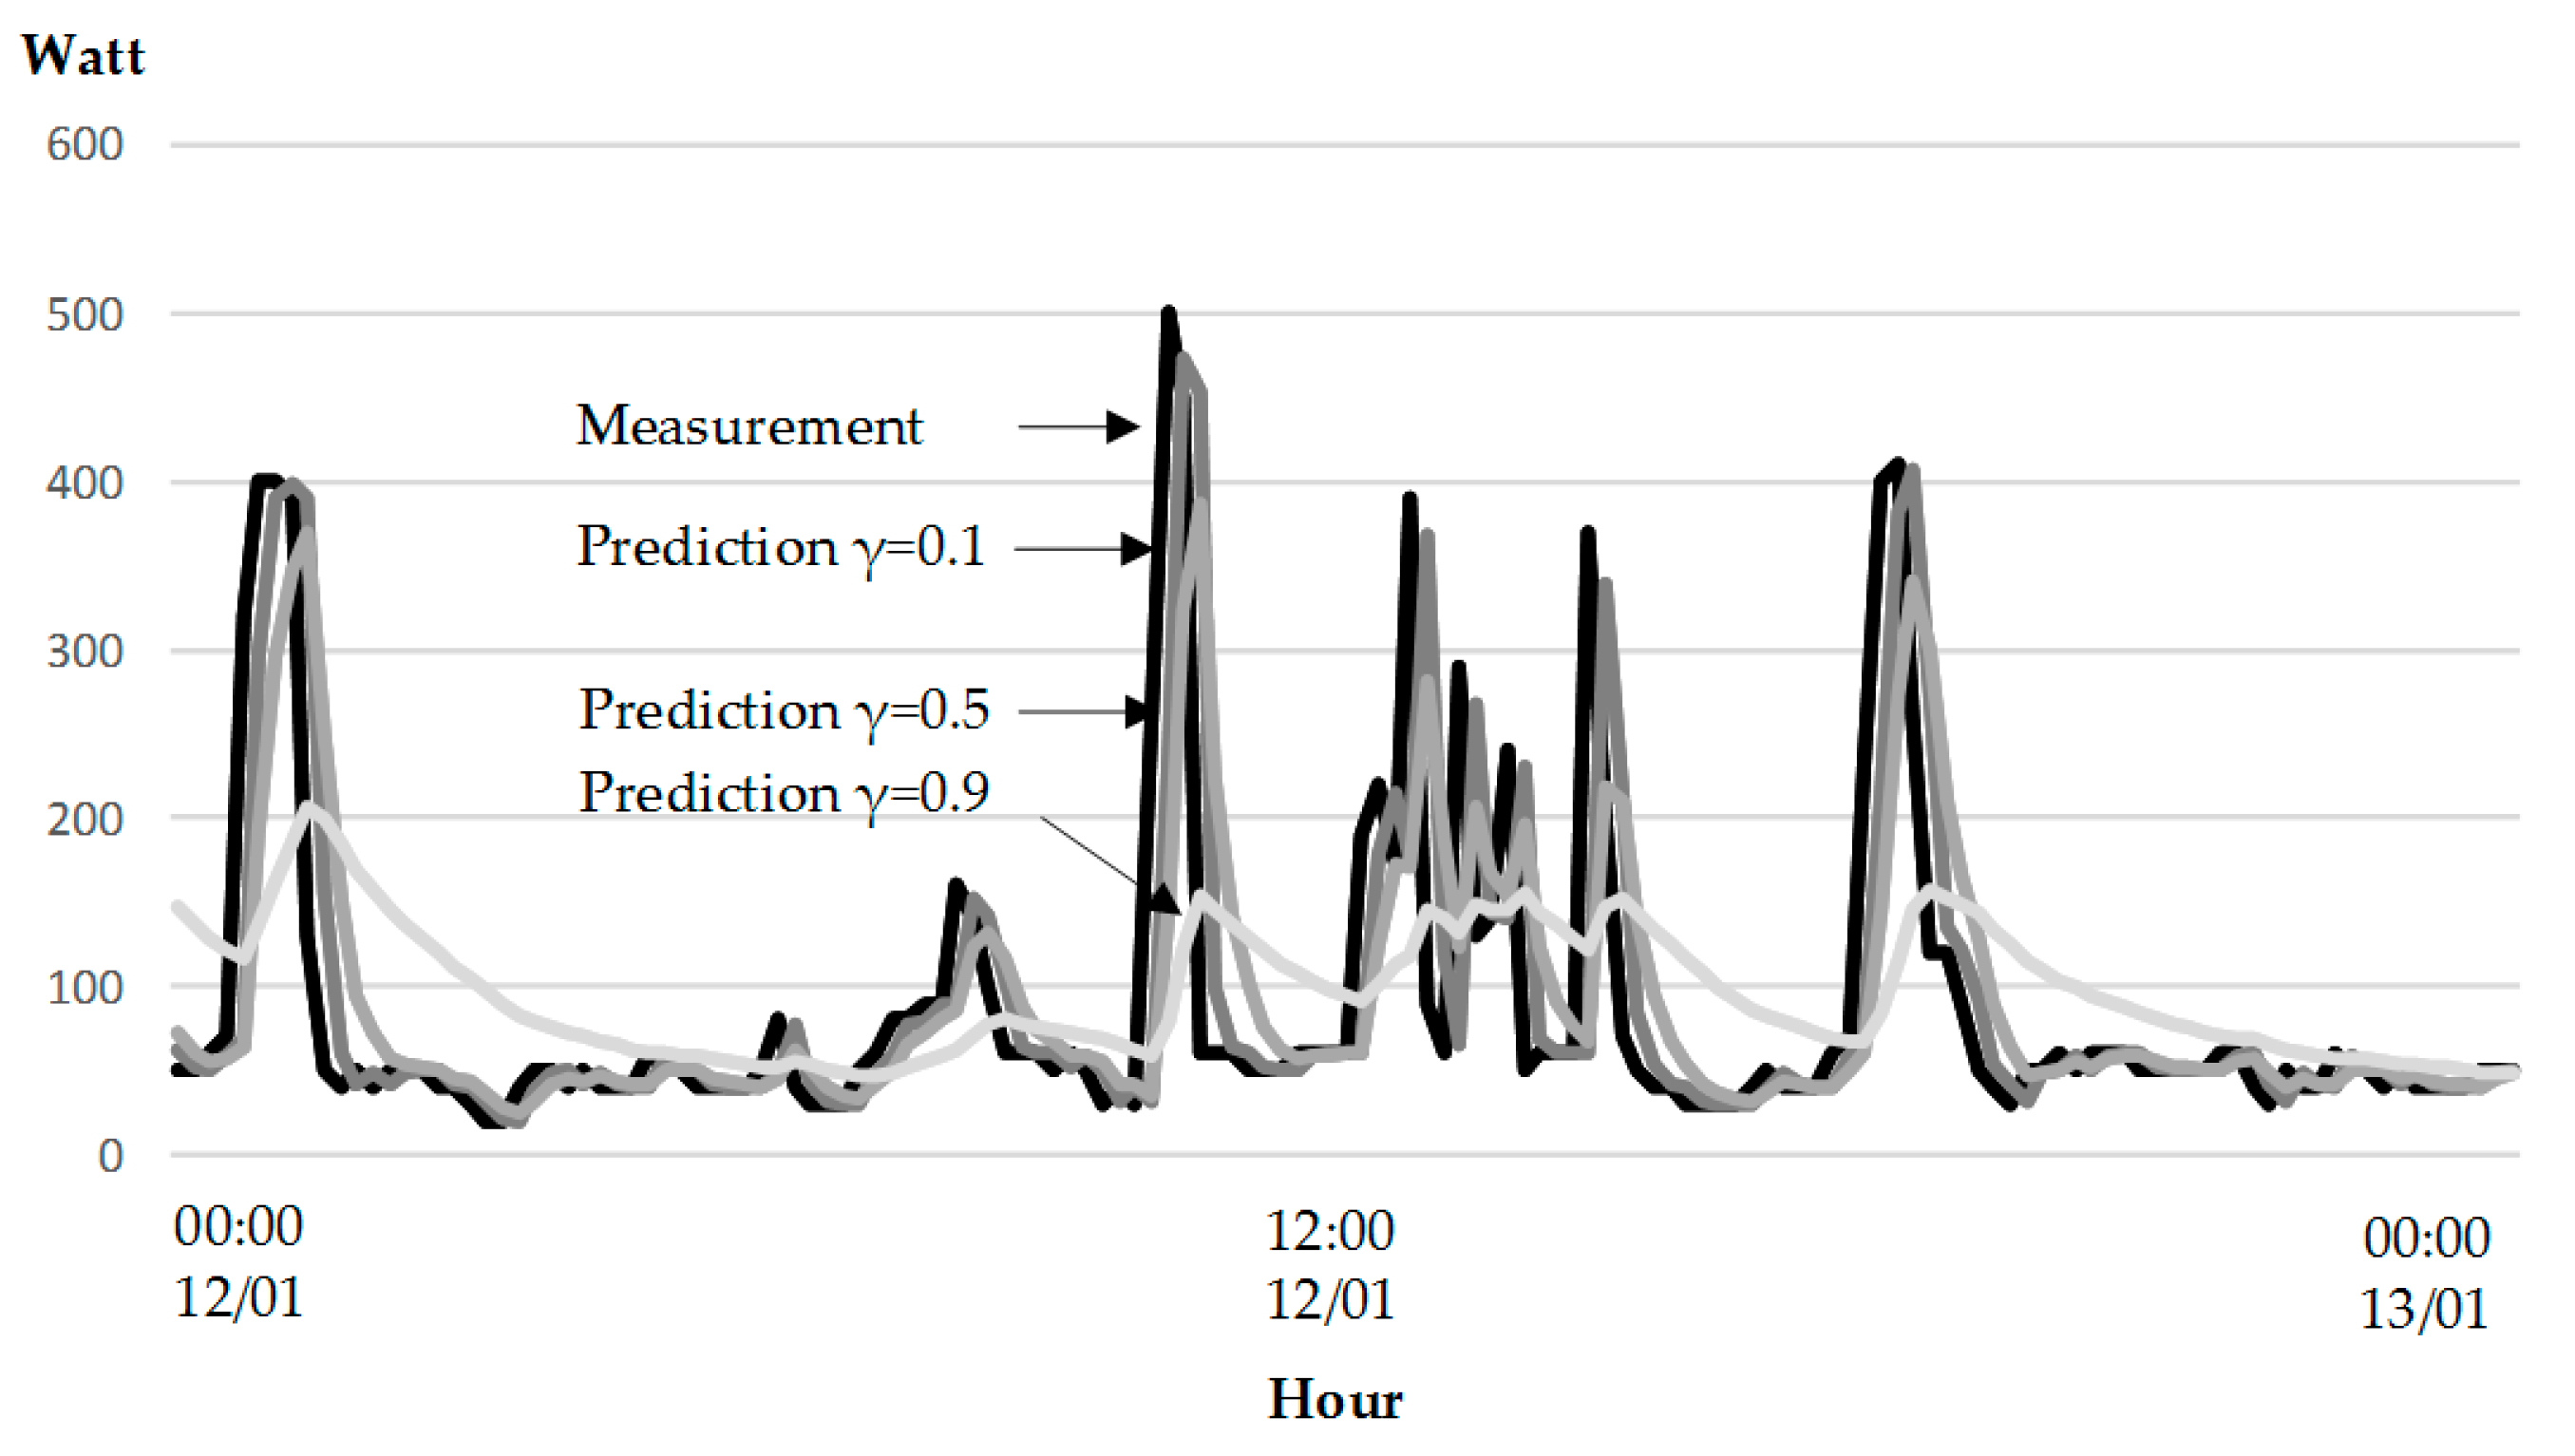
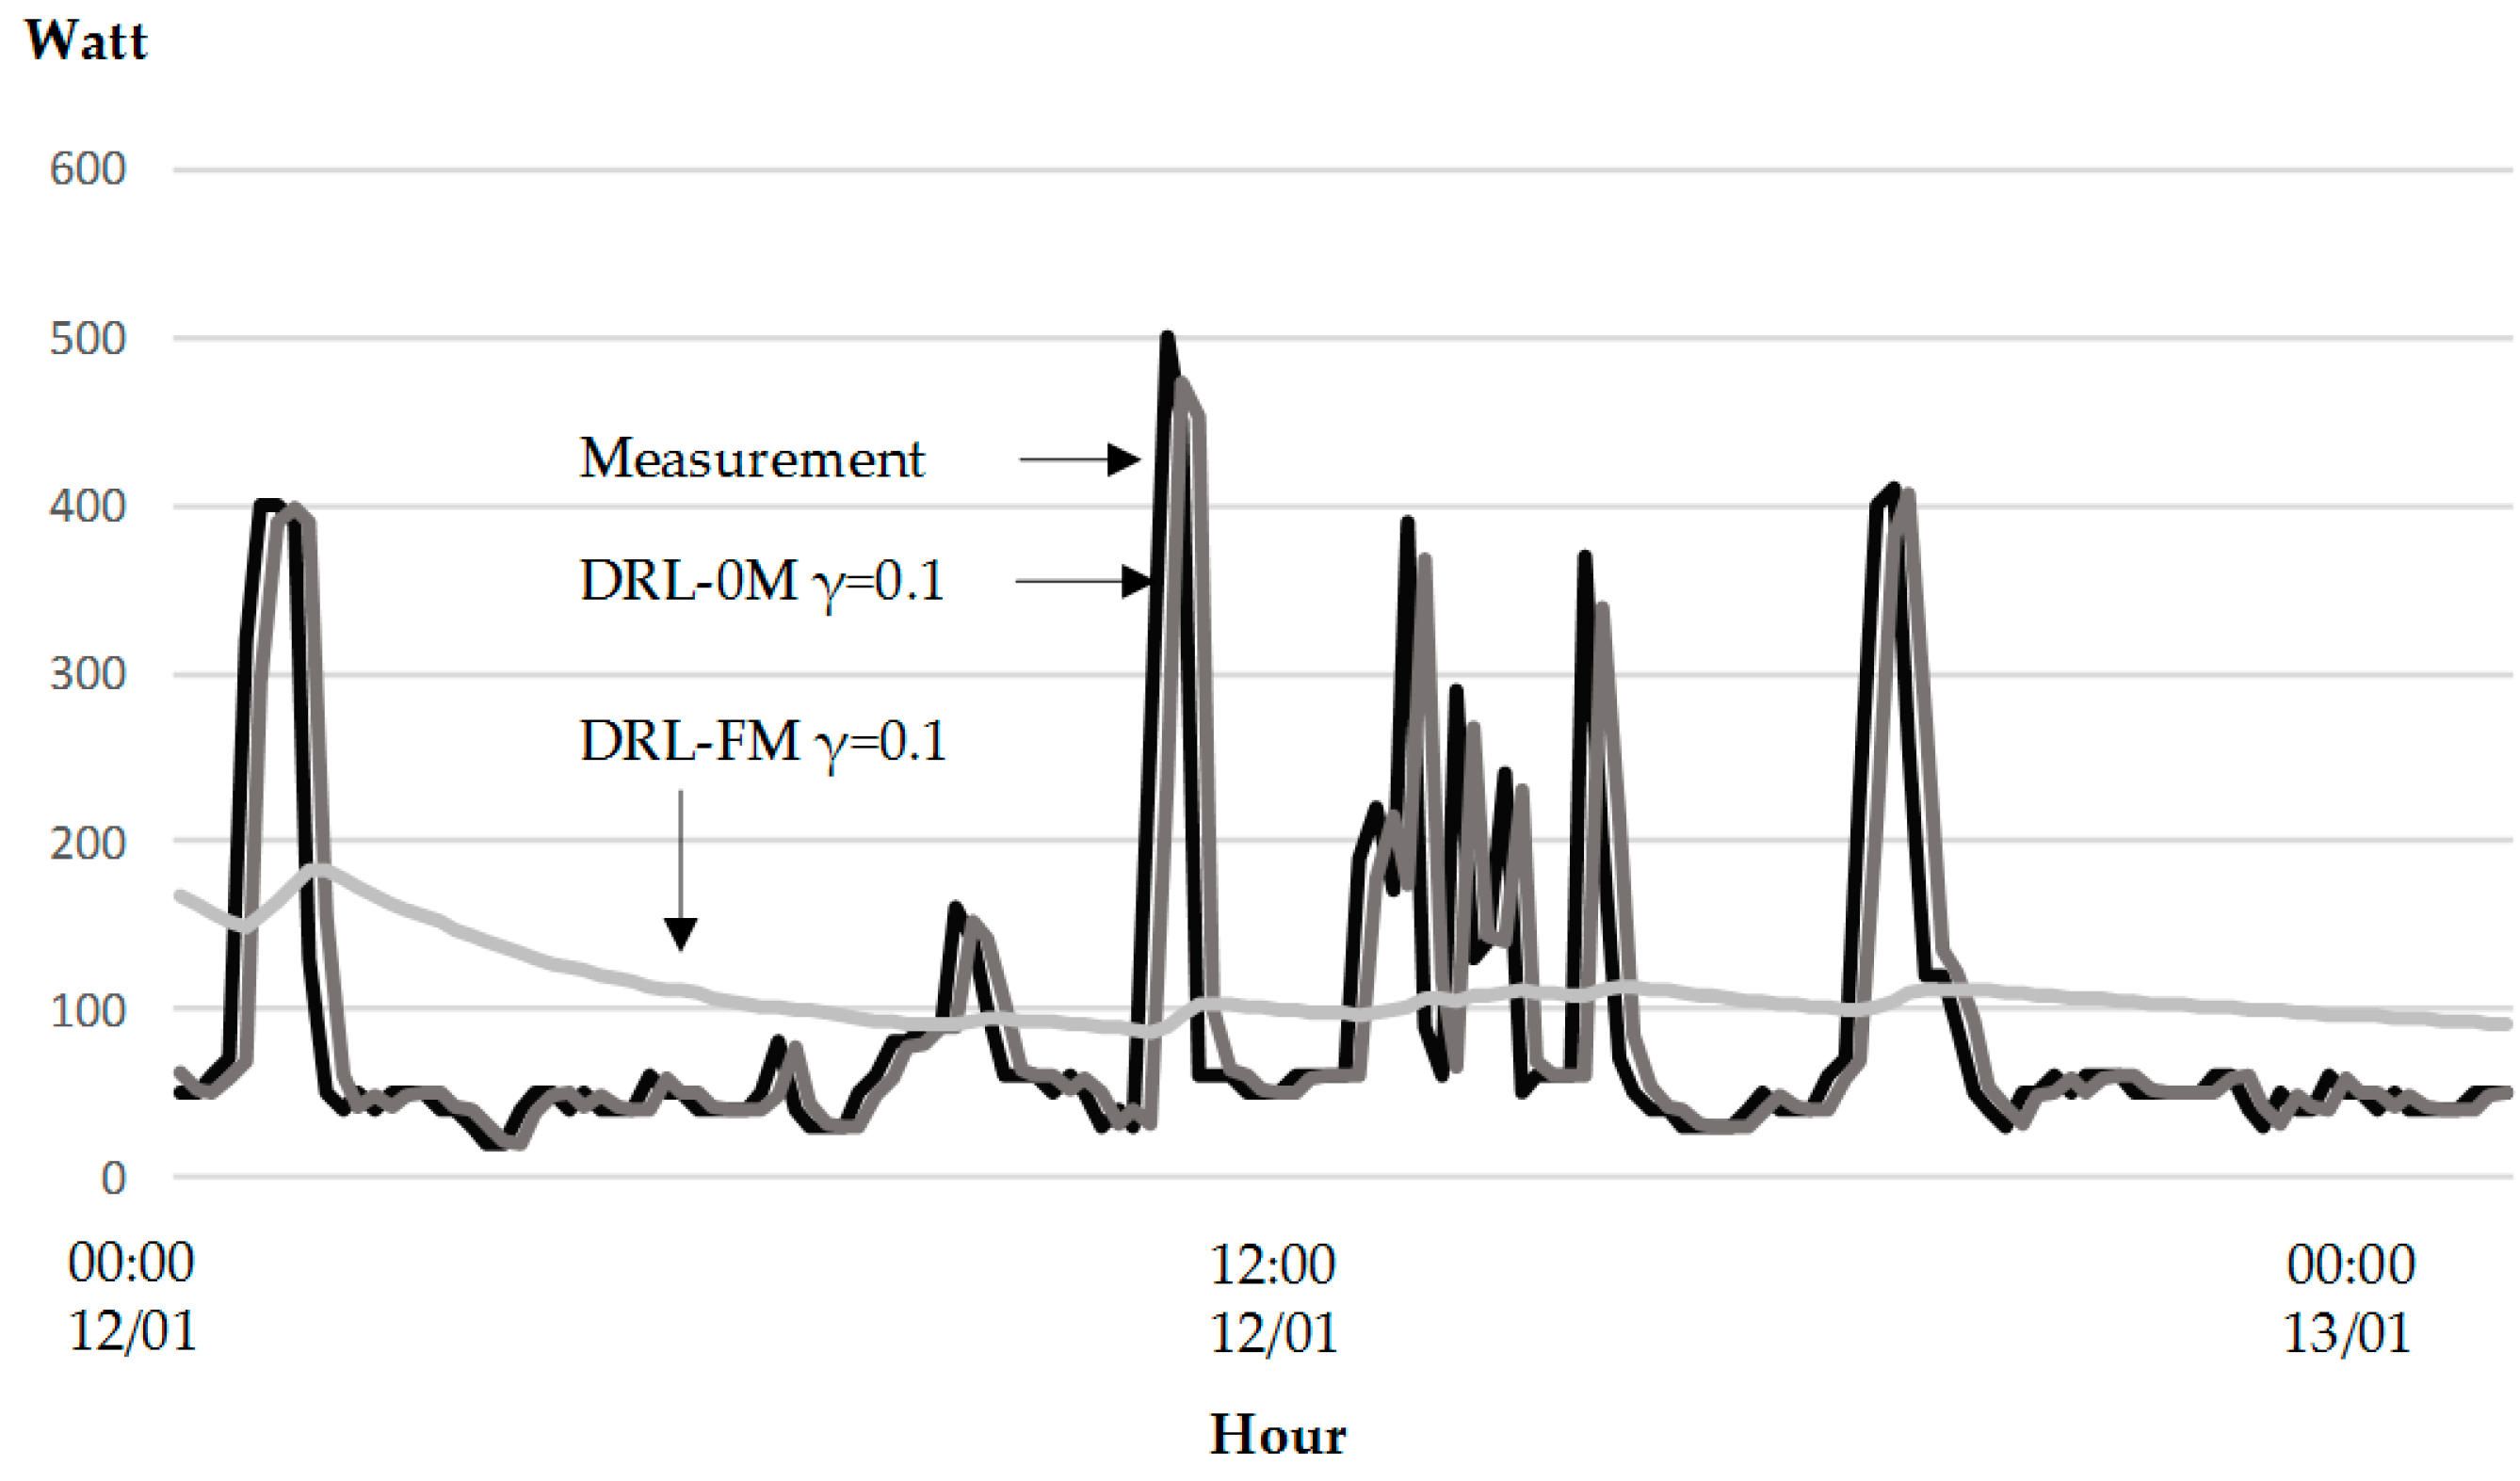
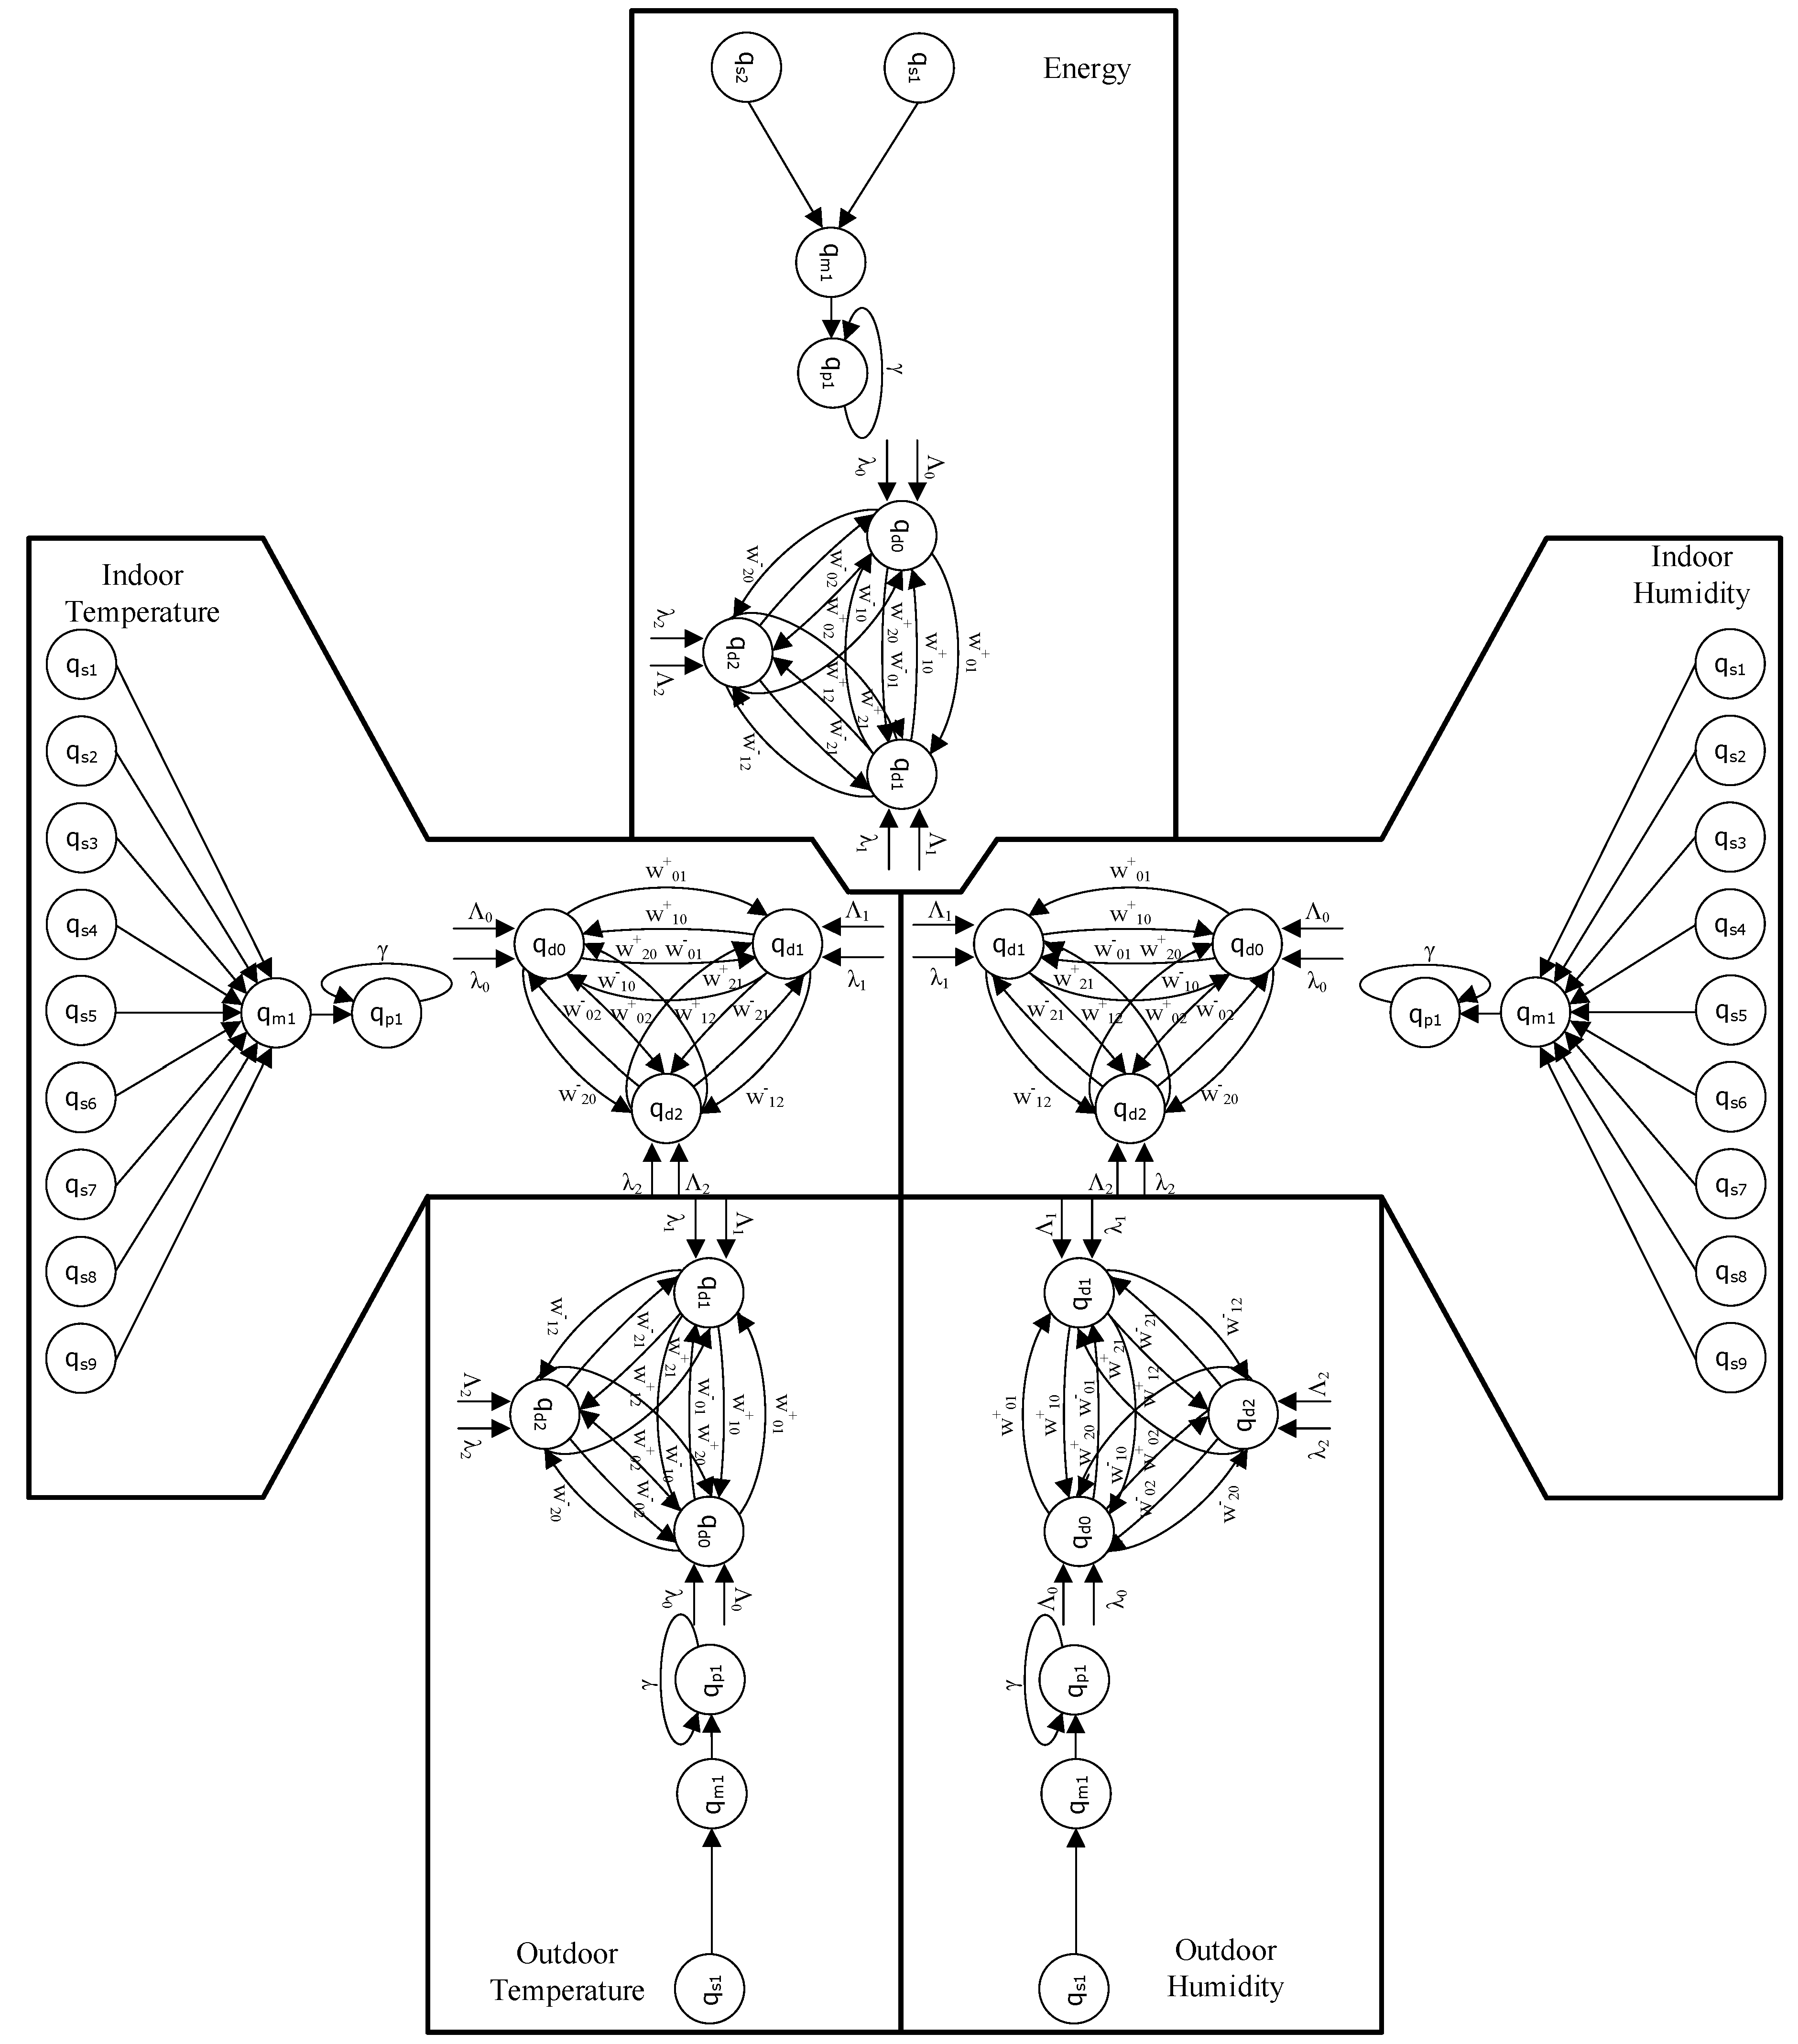
The intelligent infrastructure (Appendix B) consisted of a configuration of five sensor networks with one neuron per external sensor. There were 22 external sensor neurons in total connected to 5 manager neurons associated with energy consumption, indoor and outdoor temperature and humidity, respectively (Figure 11).
Equally, there were five management layers that made trend and value predictions using a Deep Reinforcement Learning (DRL) algorithm based on six different memory configurations, as shown in Table 2.
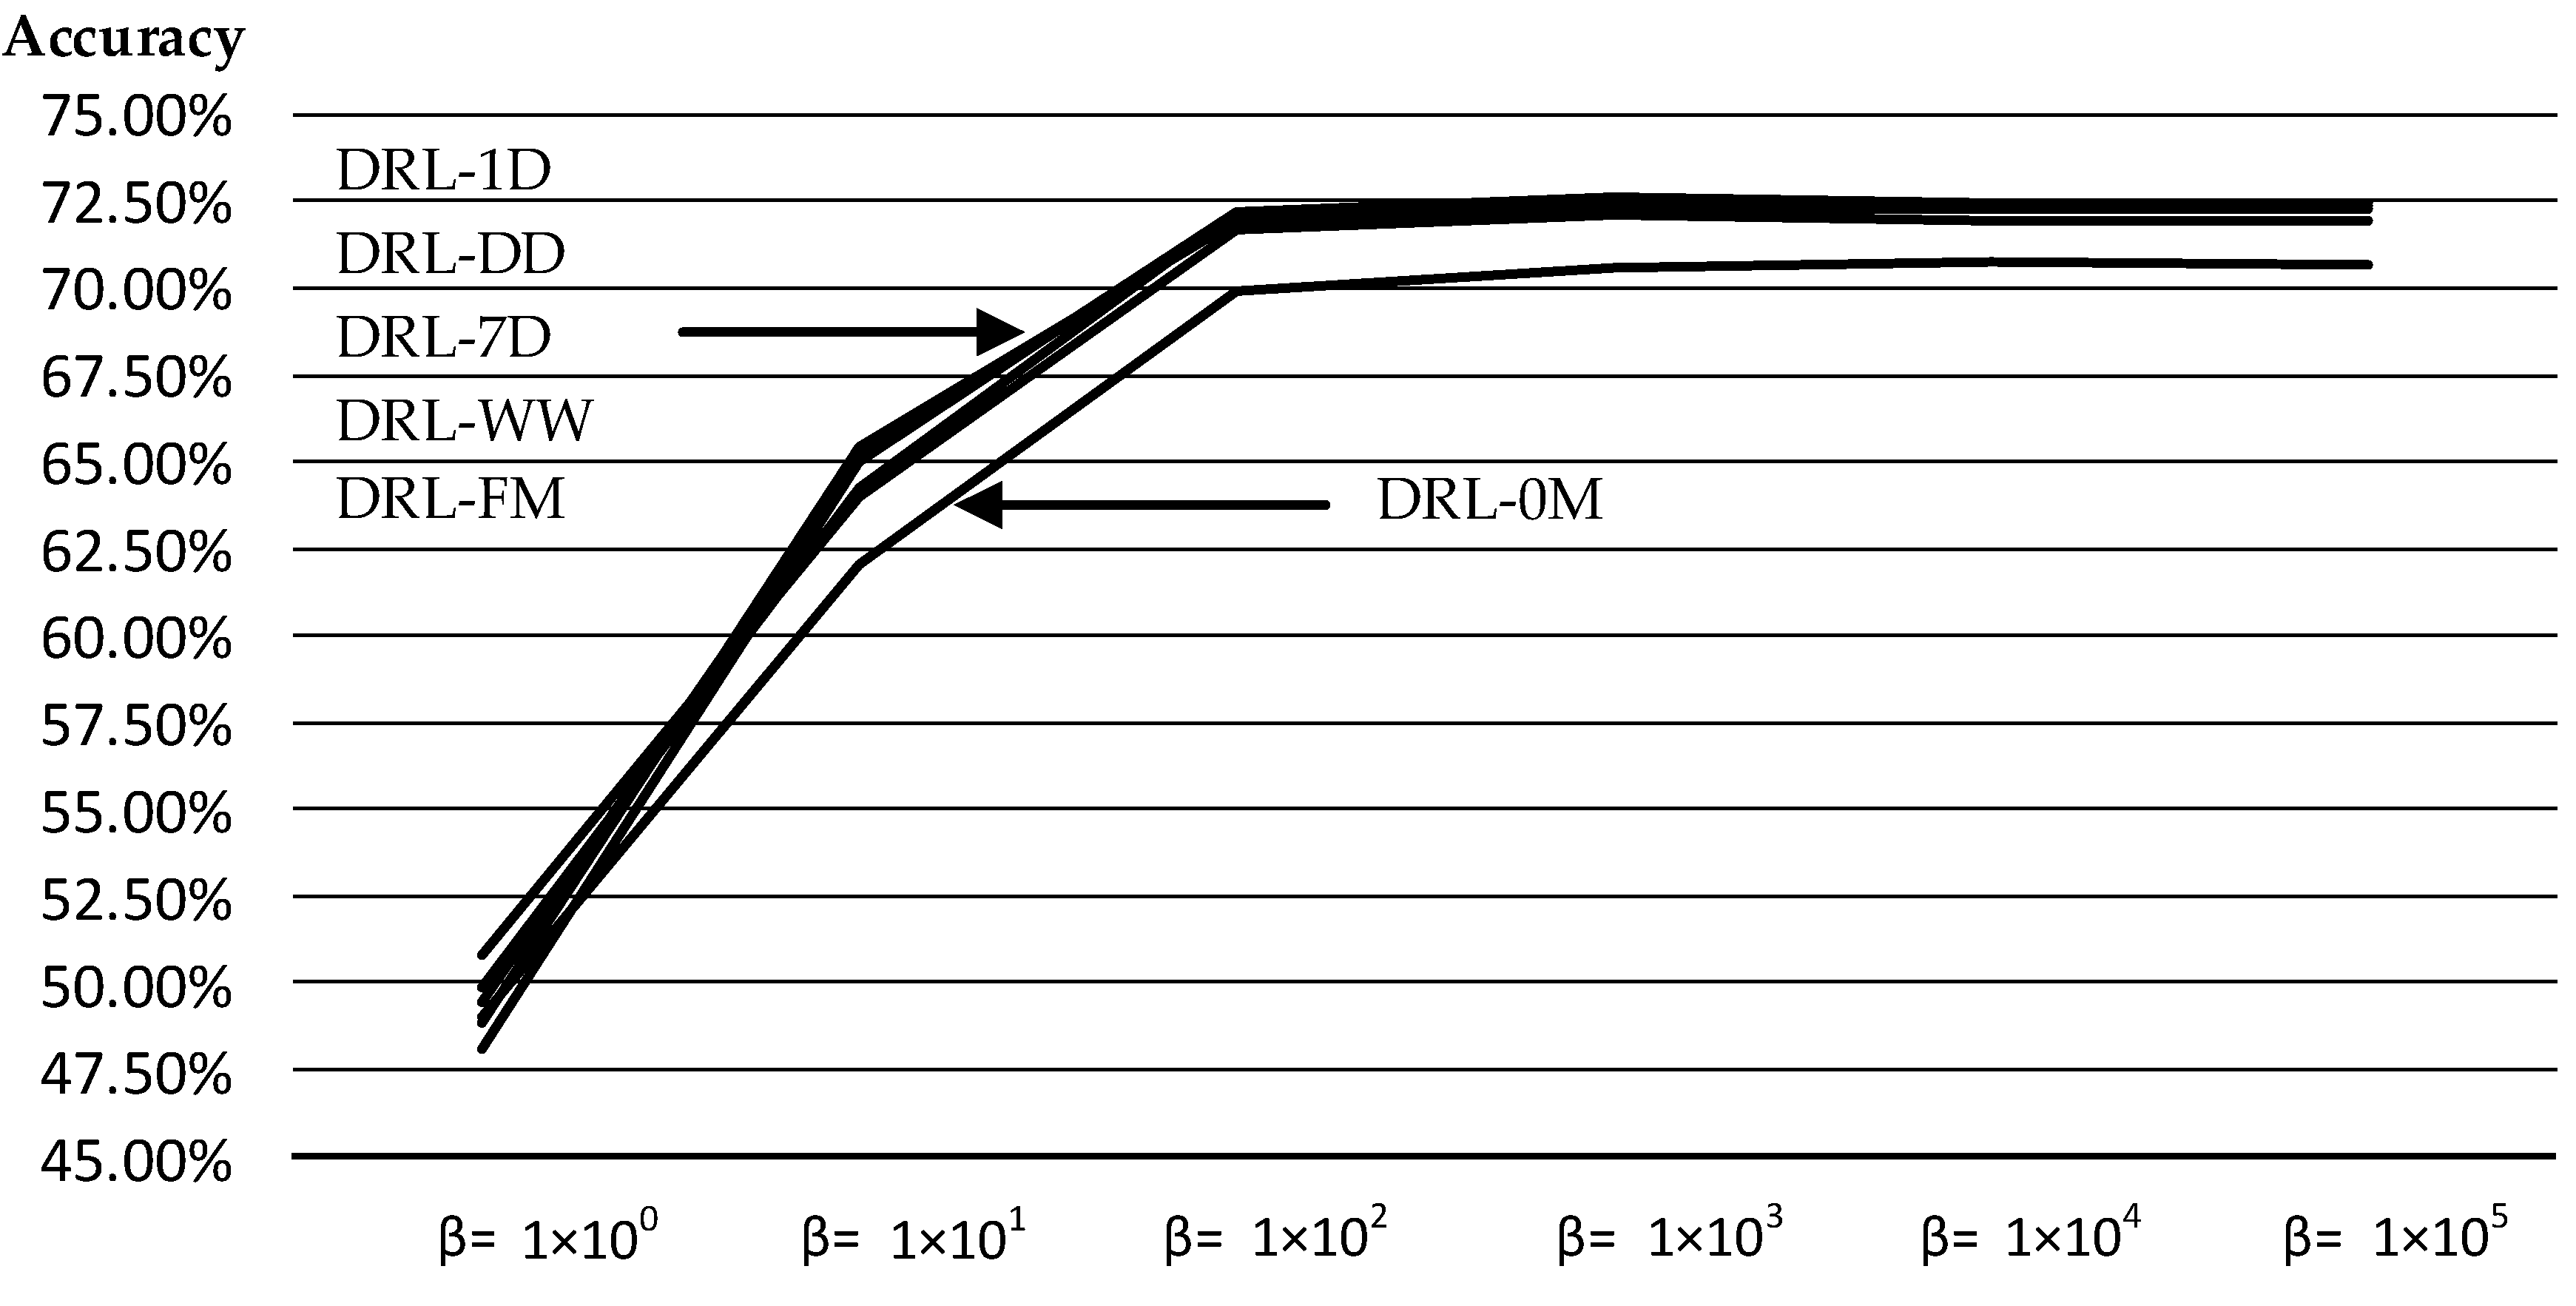
Table 3 and Table 4 show the number of rewards (R) or successes, penalizations (P) or misses and accuracy (A) for different values of the learning gradient β across the 19,736 data measurements for the DRL-0M no memory and DRL-FM full memory configurations, respectively, at medium threshold memory (α = 0.5).
There was a slight increment in accuracy with the introduction of deep reinforcement learning, although the values between different memory configurations were not very different (Figure 12): the learning gradient β had an impact on the accuracy, where its optimum value was 1 × 10³.
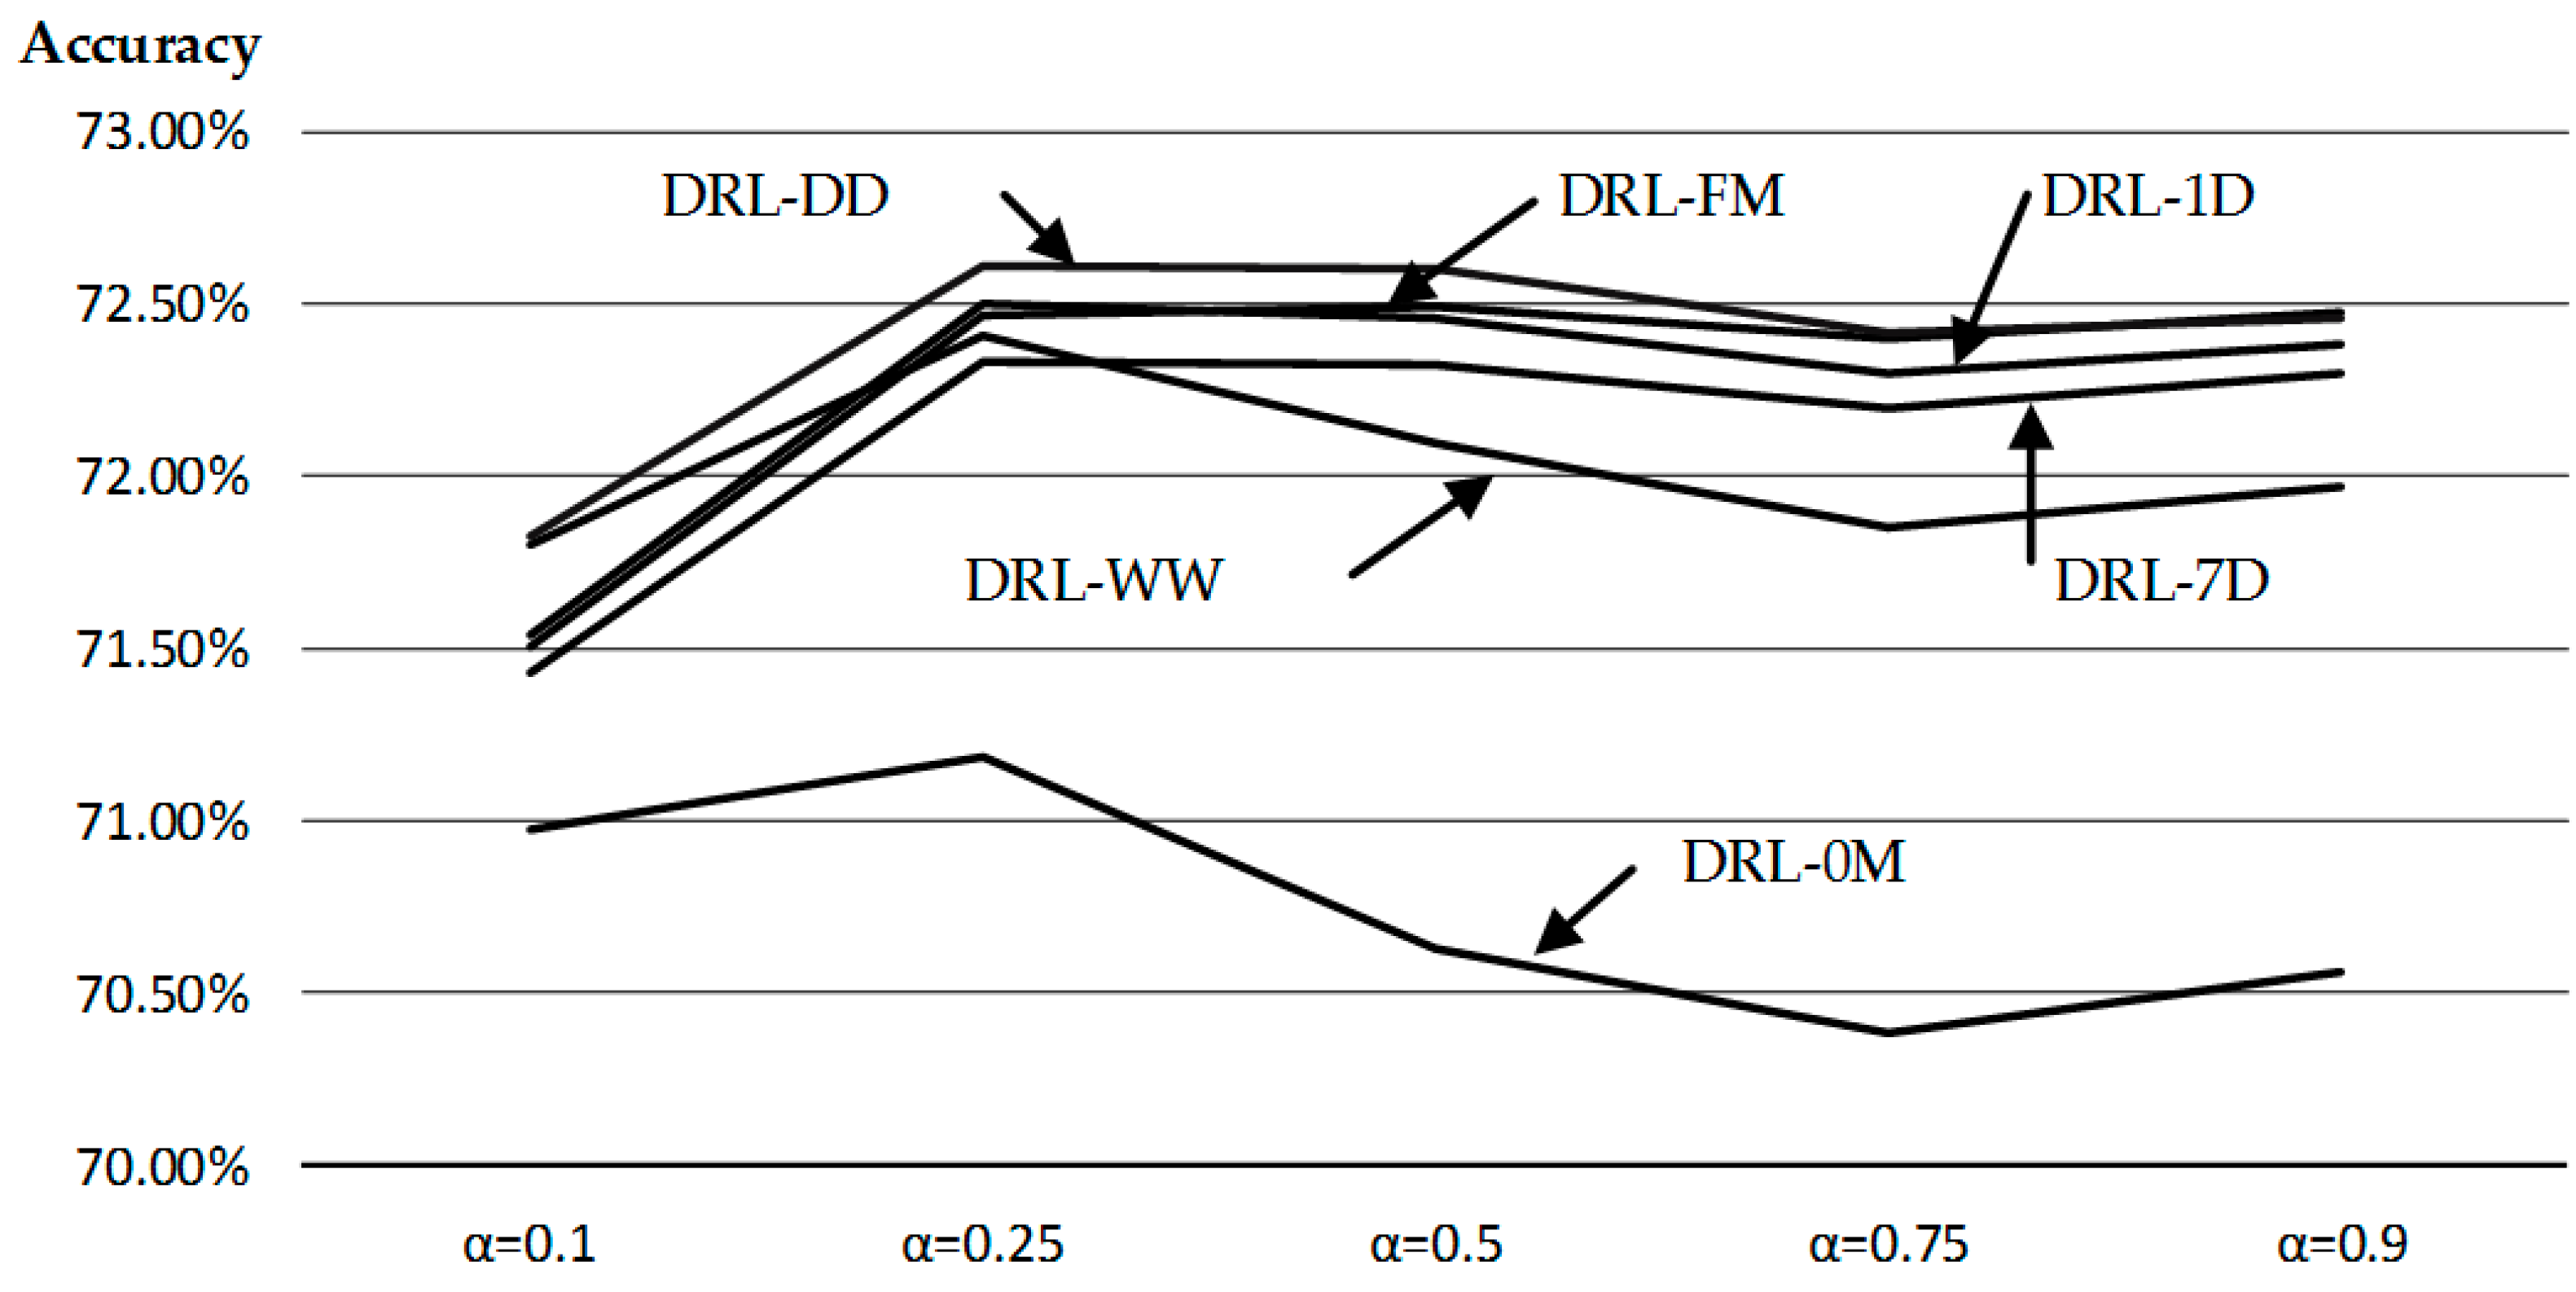
Table 5 and Table 6 show the number of rewards (R) or successes, penalizations (P) or misses and accuracy (A) for different values of the threshold memory α across the 19,736 data measurements for the DRL-0M no memory and DRL-FM full memory configurations, respectively, at a medium learning gradient (β = 1 × 10³).
Equivalent to the previous validation, there was a slight increment in accuracy with the introduction of deep reinforcement learning, although the values between different memory configurations were not very different (Figure 13): the threshold memory α did not have a great impact on the accuracy, although it peaked at a 0.25 value.
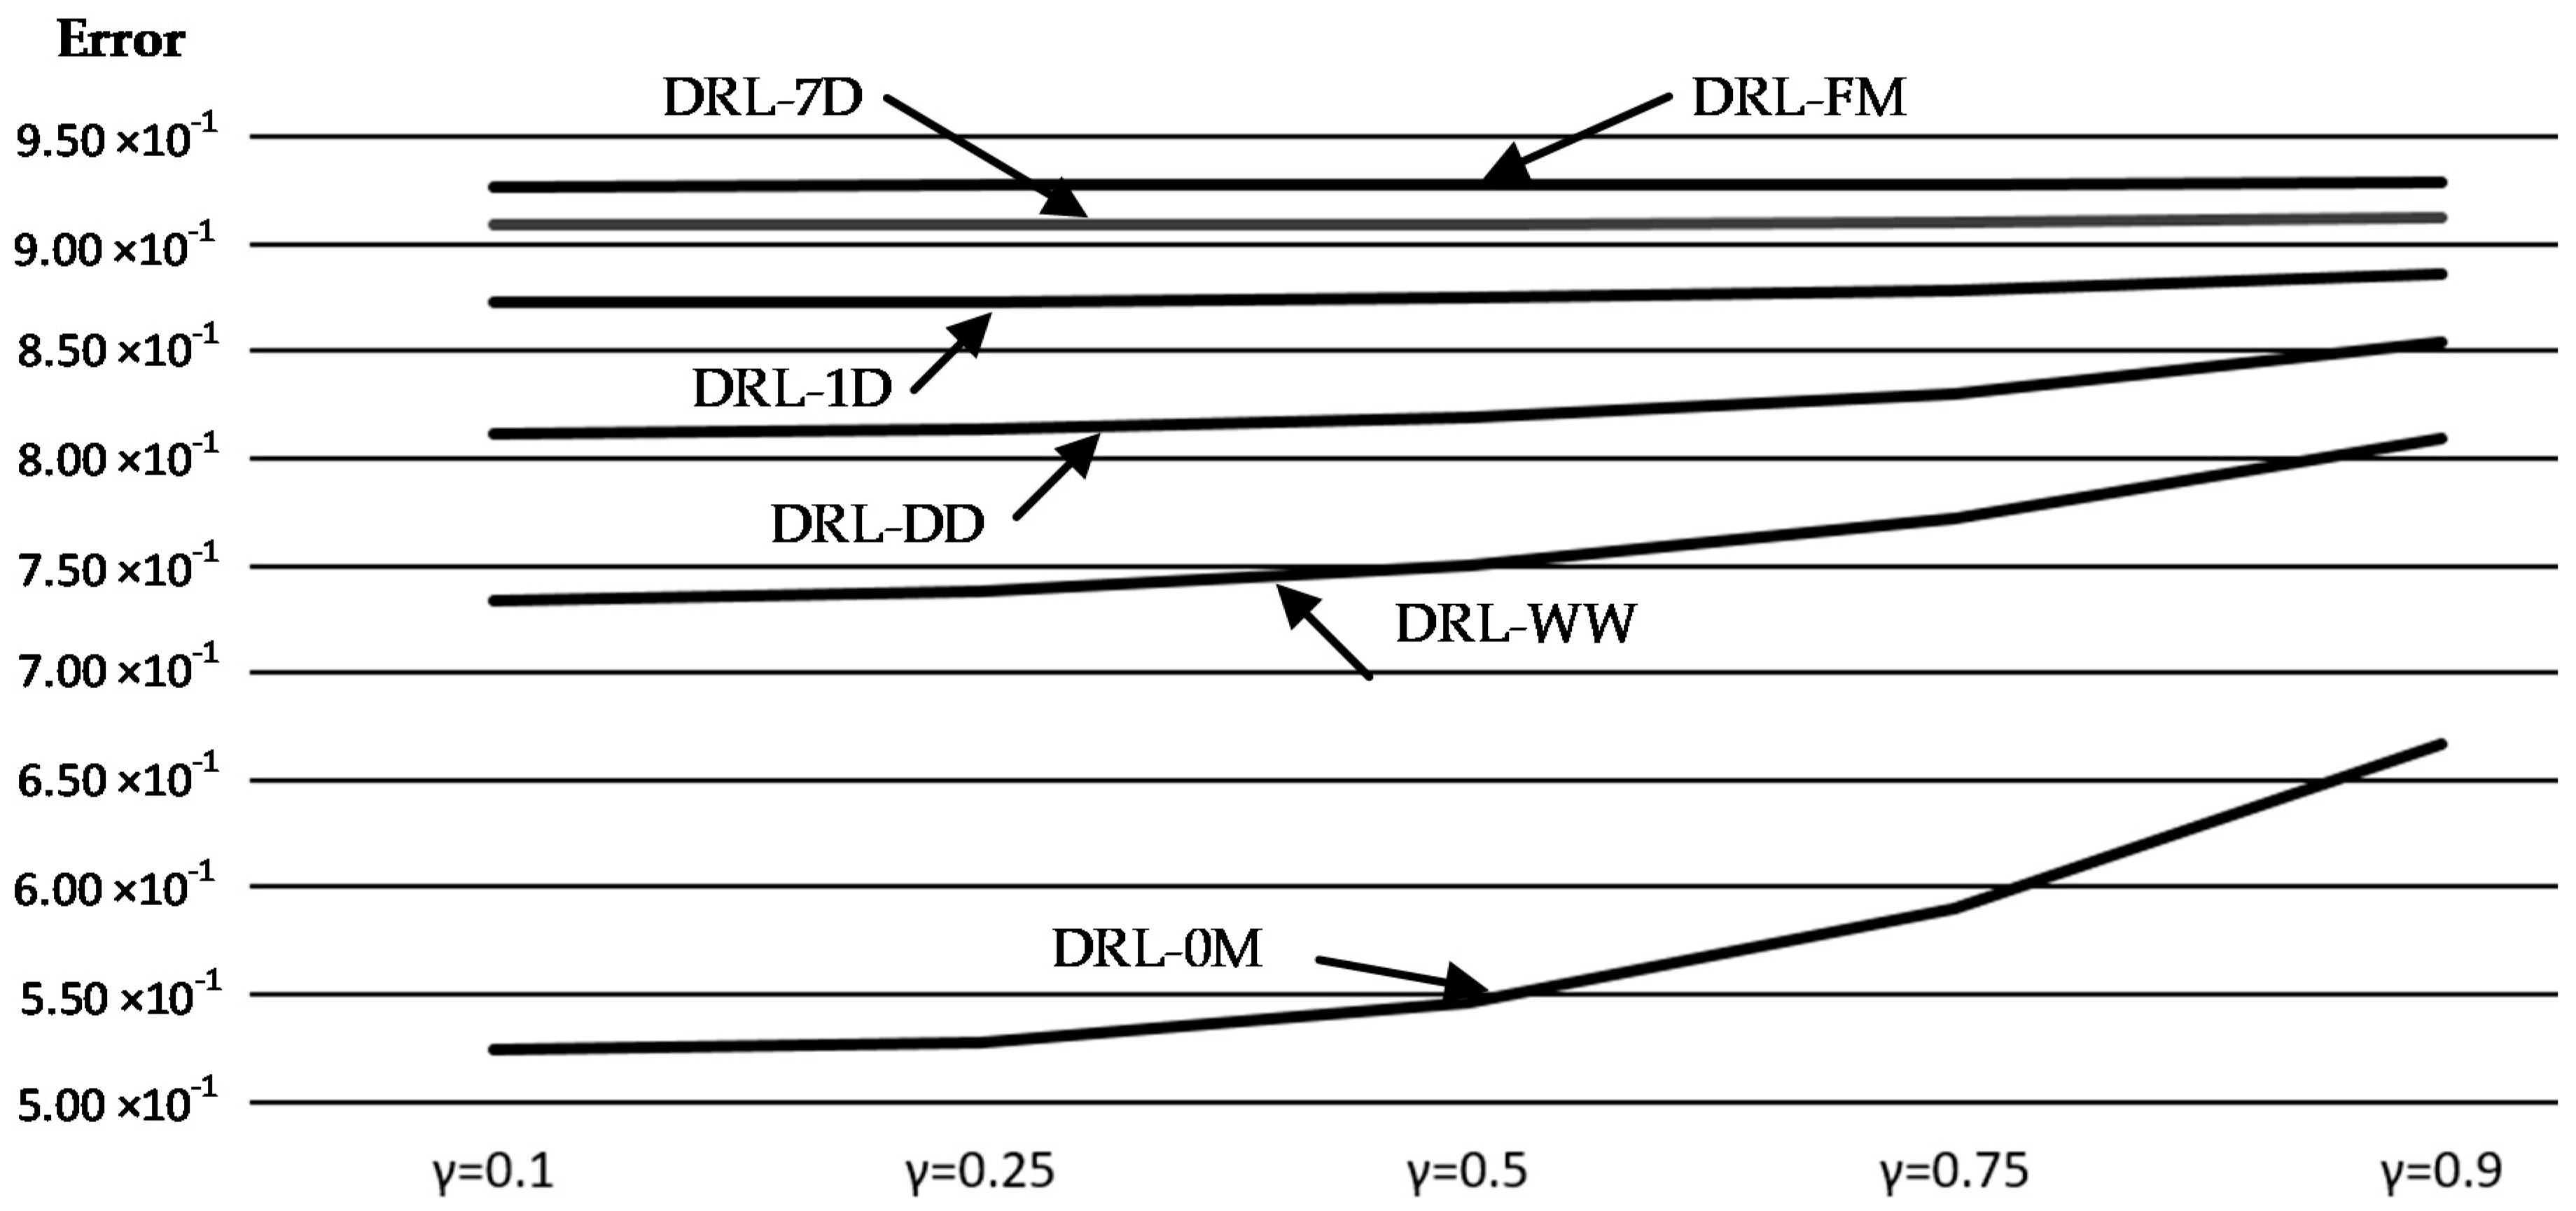
Table 7 and Table 8 show the root mean square error of the predicted values (Appendix A) against the real measurements for different values of the prediction memory γ across the 19,736 data measurements for the DRL-0M no memory and DRL-FM full memory configurations, respectively, at medium threshold memory (α = 0.5) and a medium learning gradient (β = 1 × 10³).
The addition of deep reinforcement learning increased the trend prediction decision; however, it also increased the error of the predictor neuron unexpectedly. The error decreased when the weighting factors rewarded the actual value rather than the previous prediction (Figure 14).
6. Discussion
There are several challenges to the application of artificial intelligence to intelligent infrastructure that are described within this section:
- (1)
- The IoT enables greater sensing capabilities with distributed electronic devices that consume very low power and transmit information at very low bandwidth using LoRaWAN, Bluetooth, Wi-Fi or 5G Transmission networks. In addition, the IoT has additional application specific open protocols such as KNX, the Modbus protocol, BacNET/IT or Lonworks. This abundance of protocols and transmission networks will be designed to enable open and interoperable solutions from different manufacturers;
- (2)
- Virtual devices’ data between different digital platforms and cloud infrastructure will be standardized with a common naming scheme and relationship mapping that identifies the dependencies between different devices using common normalization structures: ideally, semantic data must capture ontology and taxonomy between assets. In addition, data obtained from different applications and systems will be normalized in common data structures;
- (3)
- Real physical devices or assets will be tagged with Universally Unique Identifiers (UUIDs) using common asset nomenclature structures based on JSON, Cascading Style Sheets (CSS) or Extensible Markup Language (XML), among others. Asset information and variables will be transmitted to the IoT cloud with standardized transmission protocols such as a MQTT server for low bandwidth applications, Hypertext Transfer Protocol Secure (HTTPS) for reliable communications or CoAP for unreliable asynchronous communications;
- (4)
- The balance between expandability, availability and the cost effective servers and data hosting provided by the cloud against edge computing on a premise that enables additional resilience and independence will be considered in terms of reliability, cybersecurity, cost and functionality. The management of devices administered by the cloud will also be normalized with additional applications that automate their configurations and updates;
- (5)
- The improved interconnection of devices and assets enabled by the IoT also increases cybersecurity risks that will be addressed with firewalls, demilitarized zones (DMZs), proxy servers, data encryption, blockchain, virtualization, microsegmentation and software define networks (SDNs);
- (6)
- Although data will be increasingly stored in redundant virtual platforms and will therefore be difficult to permanently remove, human data privacy will also be considered. Data will be encrypted, and access to private data will be monitored and authorized, where not all data will be stored: in addition, data will not identify their human generators and owners. The failure to be sensitive and open about data privacy will generate a human reaction against intelligent infrastructure;
- (7)
- Different infrastructure user interfaces will be unified in order to increase user experience (UX) from an end user perspective via mobile or web apps to management and operator users via common dashboards with unified single panes;
- (8)
- Human adoption of artificial intelligence, with its applications and innovations, will be gradual and inducted to enable a successful coexistence. Although AI and deep machine learning will enable intelligent infrastructure managers to make higher abstracted decisions as a result of enhanced data correlations that will provide tailored and greater insights, the operational and maintenance perspective can lead to job redundancies, as tasks can be done autonomously based on learned predictions. A clear example is the application of blockchain to digital ledgers that will enhance or replace the role of bankers, accountants or project managers;
- (9)
- AI will include ethics at every decision stage, enabling humans to override any AI decision to avoid catastrophic situations where AI could extinguish humans due to faulty sensor devices, nonexhaustive learning or intentional cyber attacks;
- (10)
- Finally, the additional digital infrastructure inserted into real infrastructure will increase its economic cost, where returns on investment (ROIs) are normally difficult to evidence or justify. Successful business cases that consider both CAPEX and OPEX will feature intangible benefits, applications or enhanced user experience that remain difficult to quantify from an economic perspective. A clear analogy is the quantification between the current economic benefit and the ROIs of railways built two centuries ago: the quality of life, mobility, business opportunities and user experience we are currently benefiting from would have been very difficult to justify during their respective feasibility stages.
7. Conclusions
This research proposed a deep reinforcement learning algorithm embedded in intelligent infrastructure that enables its adaptation to the external environment, learning from its users and monitoring its functionality in terms of assets, space and energy, therefore assisting managers or developers to make commercial or operational decisions. The proposed algorithm gradually learns and adapts based on unsupervised learning as an autonomous method, and therefore no previous human validation or learning iterations that train the model are required.
Sensorial neurons that gather and filter building environment information are dispersed through the infrastructure, whereas management sensors make predictions about values and trends (upwards, downwards and equal) based on a reinforcement learning algorithm enabling the intelligent infrastructure to adapt to the future demands of its space, environmental conditions or energy. Validation results showed that the learning gradient had a greater impact than the threshold memory: in order to make the right decisions, learning from the current environment is more important than memorizing previous experience.
A biological algorithm based on neural networks and deep reinforcement learning enables infrastructure to be intelligent by making predictions about its different variables: neurons of the artificial neural networks are associated with a prediction or decision layer based on a deep reinforcement learning algorithm that takes into consideration all of its previous learning. In addition, the proposed method makes decisions in real time, which facilitates the intelligent infrastructure in proactively monitoring, protecting and repairing itself.
Funding
This research has received no external funding.
Conflicts of Interest
The author declares no conflicts of interest.
Appendix A. Management Sensor Predicted Values
Figure A1.
Management sensor value prediction validation: γ-value.

Figure A2.
Management sensor value prediction validation: reinforcement learning.

Appendix B. Intelligent Infrastructure Neural Schematic
Figure A3.
Intelligent Infrastructure Neural Schematic.

References
- Serrano, W. Digital Systems in Smart City and Infrastructure: Digital as a Service. Smart Cities 2018, 1, 134–154. [Google Scholar] [CrossRef]
- Hoult, N.; Bennett, P.; Stoianov, I.; Fidler, P.; Maksimovic, C.; Middleton, C.; Graham, N.; Soga, K. Wireless sensor networks: Creating ‘smart infrastructure’. Proc. Inst. Civ. Eng. 2009, 162, 136–143. [Google Scholar] [CrossRef]
- Chen, J.; Chen, H.; Luo, X. Collecting building occupancy data of high resolution based on WiFi and BLE network. Autom. Constr. 2019, 102, 183–194. [Google Scholar] [CrossRef]
- Lee, S.-K.; Kim, K.-R.; Yu, J.-H. BIM and ontology-based approach for building cost estimation. Autom. Constr. 2014, 41, 96–105. [Google Scholar] [CrossRef]
- Arayici, Y.; Coates, P.; Koskela, L.; Kagioglou, M.; Usher, C.; O’Reilly, K. Technology adoption in the BIM implementation for lean architectural practice. Autom. Constr. 2011, 20, 189–195. [Google Scholar] [CrossRef]
- International Telecommunication Union. Overview of the Internet of Things; Y.2060; Telecommunications Standarization Sector of ITU: Geneva, Switzerland, 2012; pp. 1–22. [Google Scholar]
- Jia, M.; Komeily, A.; Wang, Y.; Srinivasan, R. Adopting Internet of Things for the development of smart buildings: A review of enabling technologies and applications. Autom. Constr. 2019, 101, 111–126. [Google Scholar] [CrossRef]
- Wu, C.; Liu, H.; Huang, L.; Lin, J.; Hsu, M. Integrating BIM and IoT technology in environmental planning and protection of urban utility tunnel construction. In Proceedings of the 2018 IEEE International Conference on Advanced Manufacturing (ICAM), Yunlin, Taiwan, 16–18 November 2018. [Google Scholar] [CrossRef]
- Tang, S.; Shelden, D.; Eastman, C.; Pishdad-Bozorgi, P.; Gao, X. A review of building information modeling (BIM) and the internet of things (IoT) devices integration: Present status and future trends. Autom. Constr. 2019, 101, 127–139. [Google Scholar] [CrossRef]
- Uimonen, M.; Hakkarainen, M. Accessing BIM-Related Information through AR. In Proceedings of the 2018 IEEE International Symposium on Mixed and Augmented Reality Adjunct (ISMAR-Adjunct), Munich, Germany, 16–20 October 2018. [Google Scholar] [CrossRef]
- Motlagh, N.H.; Zaidan, M.; Lagerspetz, E.; Varjonen, S.; Toivonen, J.; Rebeiro-Hargrave, J.M.A.; Siekkinen, M.; Hussein, T.; Nurmi, P.; Tarkoma, S. Indoor Air Quality Monitoring Using Infrastructure-Based Motion Detectors. In Proceedings of the 2019 IEEE 17th International Conference on Industrial Informatics (INDIN), Helsinki-Espoo, Finland, 22–25 July 2019. [Google Scholar]
- Costa, A.; Keane, M.; Torrens, I.; Corry, E. Building operation and energy performance: Monitoring, analysis and optimisation toolkit. Appl. Energy 2013, 101, 310–316. [Google Scholar] [CrossRef]
- Zhao, L.; Zhang, J.-L.; Liang, R. Development of an energy monitoring system for large public buildings. Energy Build. 2013, 66, 41–48. [Google Scholar] [CrossRef]
- Onyeji, I.; Bazilian, M.; Bronk, C. Cyber Security and Critical Energy Infrastructure. Electr. J. 2014, 27, 52–60. [Google Scholar] [CrossRef]
- Maglaras, L.; Kim, K.-H.; Janicke, H.; Rallis, M.A.F.S.; Fragkou, P.; Cruz, A.M.T. Cyber security of critical infrastructures. Ict Express 2018, 4, 42–45. [Google Scholar] [CrossRef]
- Sun, J.; Yan, J.; Zhang, K. Blockchain-based sharing services: What blockchain technology can contribute to smart cities. Financ. Innov. 2016, 2, 26. [Google Scholar] [CrossRef] [Green Version]
- Biswas, K.; Muthukkumarasamy, V. Securing Smart Cities Using Blockchain Technology. In Proceedings of the 2016 IEEE 18th International Conference on High Performance Computing and Communications; IEEE 14th International Conference on Smart City; IEEE 2nd International Conference on Data Science and Systems (HPCC/SmartCity/DSS), Sydney, Australia, 12–14 December 2016. [Google Scholar] [CrossRef]
- Serrano, W. The Random Neural Network with a BlockChain Configuration in Digital Documentation. In Proceedings of the International Symposium on Computer and Information Sciences, Poznan, Poland, 20–21 September 2018. [Google Scholar] [CrossRef]
- Serrano, W. The Blockchain Random Neural Network in Cybersecurity and the Internet of Things. In IFIP Advances in Information and Communication Technology Book Series, Proceedings of the IFIP International Conference on Artificial Intelligence Applications and Innovations, Hersonissos, Greece, 24–26 May 2019; Springer Nature: Berlin/Heidelberg, Germany, 2019; Volume 559, pp. 50–63. [Google Scholar] [CrossRef]
- Serrano, W.; Gelenbe, E.; Yin, Y. The Random Neural Network with Deep learning Clusters in Smart Search. Neurocomputing 2019, 1–20. [Google Scholar] [CrossRef]
- Serrano, W.; Gelenbe, E. Deep learning clusters in the cognitive packet network. Neurocomputing 2019, 1–25. [Google Scholar] [CrossRef]
- Serrano, W. Genetic and deep learning clusters based on neural networks for management decision structures. Neural Comput. Appl. 2019, 1–25. [Google Scholar] [CrossRef]
- Tüfekci, P. Prediction of full load electrical power output of a base load operated combined cycle power plant using machine learning methods. Electr. Power Energy Syst. 2014, 60, 126–140. [Google Scholar] [CrossRef]
- Wang, Z.; Srinivasan, R. A review of artificial intelligence based building energy use prediction: Contrasting the capabilities of single and ensemble prediction models. Renew. Sustain. Energy Rev. 2017, 75, 796–808. [Google Scholar] [CrossRef]
- Tsanasa, A.; Xifara, A. Accurate quantitative estimation of energy performance of residential buildings using statistical machine learning tools. Energy Build. 2012, 49, 560–567. [Google Scholar] [CrossRef]
- Arghira, N.; Hawarah, L.; Ploix, S.; Jacomino, M. Prediction of appliances energy use in smart homes. Energy 2012, 48, 128–134. [Google Scholar] [CrossRef]
- Candanedo, L.; Feldheim, V.; Deramaix, D. Data driven prediction models of energy use of appliances in a low-energy house. Energy Build. 2017, 140, 81–97. [Google Scholar] [CrossRef]
- Bi, H.; Gelenbe, E. A Cooperative Emergency Navigation Framework Using Mobile Cloud Computing. In Proceedings of the 2014 International Symposium Computer and Information Sciences, Kuala Lumpur, Malaysia, 3–5 June 201; pp. 41–48.
- Gelenbe, E.; Bi, H. Emergency Navigation without an Infrastructure. Sensors 2014, 14, 15142–15162. [Google Scholar] [CrossRef] [PubMed] [Green Version]
- Oh, M.; Lee, J.; Hong, S.W.; Jeong, Y. Integrated system for BIM-based collaborative design. Autom. Constr. 2015, 58, 196–206. [Google Scholar] [CrossRef]
- Tookey, A.G.J.; Ghaffarianhoseini, A.; Naismith, N.; Azhar, S.; Efimova, O.; Raahemifar, K. Building Information Modelling (BIM) uptake: Clear benefits, understanding its implementation, risks and challenges. Renew. Sustain. Energy Rev. 2017, 75, 1046–1053. [Google Scholar]
- Liu, Y.; van Nederveen, S.; Hertogh, M. Understanding effects of BIM on collaborative design and construction: An empirical study in China. Int. J. Proj. Manag. 2017, 35, 686–698. [Google Scholar] [CrossRef]
- Lu, Y.; Wu, Z.; Chang, R.; Li, Y. Building Information Modeling (BIM) for green buildings: A critical review and future directions. Autom. Constr. 2017, 83, 134–148. [Google Scholar] [CrossRef]
- Zou, Y.; Kiviniemi, A.; Jones, S.W. A review of risk management through BIM and BIM-related technologies. Saf. Sci. 2017, 97, 88–98. [Google Scholar] [CrossRef]
- Rashid, K.M.; Louis, J.; Fiawoyife, K.K. Wireless electric appliance control for smart buildings using indoor location tracking and BIM-based virtual environments. Autom. Constr. 2019, 101, 48–58. [Google Scholar] [CrossRef]
- Ding, Z.; Liu, S.; Liao, L.; Zhang, L. A digital construction framework integrating building information modeling and reverse engineering technologies for renovation projects. Autom. Constr. 2019, 102, 45–58. [Google Scholar] [CrossRef]
- Liu, H.; Lu, M.; Al-Hussein, M. Ontology-based semantic approach for construction-oriented quantity take-off from BIM models in the light-frame building industry. Adv. Eng. Inf. 2016, 30, 190–207. [Google Scholar] [CrossRef]
- Kim, K.; Lee, Y.-C. Automated Generation of Daily Evacuation Paths in 4D BIM. Appl. Sci. 2019, 9, 1789. [Google Scholar] [CrossRef]
- Kaewunruen, S.; Xu, N. Digital Twin for Sustainability Evaluation of Railway Station Buildings. Front. Built Envrion. 2018, 4, 77. [Google Scholar] [CrossRef]
- Lee, G.M.; Crespi, N.; Choi, J.K.; Boussard, M. Internet of Things. In Telecommunication Services Evolution; Springer Nature: Berlin/Heidelberg, Germany, 2013; Volume 7768, pp. 257–282. [Google Scholar]
- Andrea, I.; Chrysostomou, C.; Hadjichristofi, G. Internet of Things: Security Vulnerabilities and Challenges. In Proceedings of the 2015 IEEE Symposium on Computers and Communication, Larnaca, Cyprus, 6–9 July 2015; pp. 180–187. [Google Scholar]
- Deogirikar, J.; Vidhate, A. Security attacks in IoT: A survey. In Proceedings of the IEEE International Conference on IoT in Social, Mobile, Analytics and Cloud, Palladam, India, 10–11 February 2017; pp. 32–37. [Google Scholar]
- Granjal, J.; Monteiro, E.; Silva, J.S. Security for the Internet of Things: A Survey of Existing Protocols and Open Research Issues. IEEE Commun. Surv. Tutor. 2015, 17, 1294–1312. [Google Scholar] [CrossRef]
- Jing, Q.; Vasilakos, A.; Wan, J.; Lu, J.; Qiu, D. Security of the Internet of Things: Perspectives and challenges. Wirel. Netw. 2014, 20, 2481–2501. [Google Scholar] [CrossRef]
- Roman, R.; Najera, P.; Lopez, J. Securing the Internet of Things. IEEE Comput. Soc. 2011, 44, 51–58. [Google Scholar] [CrossRef]
- Sicari, S.; Rizzardi, A.; Grieco, L.A.; Coen-Porisini, A. Security, privacy and trust in Internet of Things: The road ahead. Comput. Netw. 2015, 76, 146–164. [Google Scholar] [CrossRef]
- Zhou, L.; Chao, H.C. Multimedia Traffic Security Architecture for the Internet of Things. IEEE Netw. 2011, 25, 35–40. [Google Scholar] [CrossRef]
- Gelenbe, E.; Domanska, J.; Czàchorski, T.; Drosou, A.; Tzovaras, D. Security for Internet of Things: The SerIoT Project. In Proceedings of the 2018 IEEE International Symposium on Networks, Computers and Communications, Rome, Italy, 19–21 June 2018; pp. 1–5. [Google Scholar]
- Domanska, J.; Nowak, M.; Nowak, S.; Czachorski, T. European Cybersecurity Research and the SerIoT Project. In Proceedings of the 2018 International Symposium on Computer and Information Sciences, Poznan, Poland, 20–21 September 2018; pp. 66–173. [Google Scholar]
- Szilagyi, I.; Wira, P. An intelligent system for smart buildings using machine learning and semantic technologies: A hybrid data-knowledge approach. In Proceedings of the IEEE Industrial Cyber-Physical Systems, St. Petersburg, Russia, 15–18 May 2018; pp. 20–25. [Google Scholar] [CrossRef]
- Bajer, M. IoT for Smart Buildings—Long Awaited Revolution or Lean Evolution. In Proceedings of the IEEE 6th International Conference on Future Internet of Things and Cloud, Barcelona, Spain, 6–8 August 2018; pp. 149–154. [Google Scholar] [CrossRef]
- Jia, R.; Jin, B.; Jin, M.; Zhou, Y.; Konstantakopoulos, I.; Zou, H.; Kim, J.; Li, D.; Gu, W.; Arghandeh, R.; et al. Design Automation for Smart Building Systems. Proc. IEEE 2018, 106, 1680–1699. [Google Scholar] [CrossRef] [Green Version]
- Zantalis, F.; Koulouras, G.; Karabetsos, S.; Kandris, D. A Review of Machine Learning and IoT in Smart Transportation. Future Int. 2019, 11, 94. [Google Scholar] [CrossRef]
- Van Hasselt, H.; Guez, A.; Silver, D. Deep reinforcement learning with double Q-Learning. In Proceedings of the Association for the Advancement of Artificial Intelligence, Phoenix, AZ, USA, 12–17 February 2016; pp. 2094–2100. [Google Scholar]
- Lillicrap, T.; Hunt, J.; Pritzel, A.; Heess, N.; Erez, T.; Tassa, Y.; Silver, D.; Wierstra, D. Continuous control with Deep Reinforcement learning. arXiv 2016, arXiv:1509.02971. [Google Scholar]
- Mnih, V.; Puigdomenech, A.; Mirza, M.; Graves, A.; Lillicrap, T.; Harley, T.; Silver, D.; Kavukcuoglu, K. Asynchronous Methods for Deep Reinforcement Learning. Int. Conf. Mach. Learn. 2016, 48, 1928–1937. [Google Scholar]
- Wang, Z.; Schaul, T.; Hessel, M.; van Hasselt, H.; Lanctot, M.; Freitas, N. Dueling network architectures for deep reinforcement learning. In Proceedings of the 2016 International Conference on International Conference on Machine Learning, New York, NY, USA, 19–24 June 2016; pp. 1995–2003. [Google Scholar]
- Duan, Y.; Chen, X.; Houthooft, R.; Schulman, J.; Abbeel, P. Benchmarking deep reinforcement learning for continuous control. In Proceedings of the International Conference on Machine Learning, New York, NY, USA, 19–24 June 2016; pp. 1329–1338. [Google Scholar]
- Henderson, P.; Islam, R.; Bachman, P.; Pineau, J.; Precup, D.; Meger, D. Deep Reinforcement Learning that Matters. In Proceedings of the Association for the Advancement of Artificial Intelligence, New Orleans, LA, USA, 2–7 February 2018; pp. 1–26. [Google Scholar]
- Mao, H.; Alizadeh, M.; Menache, I.; Kandula, S. Resource Management with Deep Reinforcement Learning. In Proceedings of the ACM Workshop on Hot Topics in Networks, Atlanta, GA, USA, 9–10 November 2016; pp. 50–56. [Google Scholar]
- Foerster, J.; Assael, Y.; Freitas, N.; Whiteson, S. Learning to Communicate with Deep Multi-Agent Reinforcement Learning. In Proceedings of the 30th Conference on Neural Information Processing Systems (NIPS 2016), Barcelona, Spain, 5–10 December 2016. [Google Scholar]
- Racanière, S.; Weber, T.; Reichert, D.; Buesing, L.; Guez, A.; Rezende, D.; Badia, A.P.; Vinyals, O.; Heess, N.; Li, Y.; et al. Imagination-Augmented Agents for Deep Reinforcement Learning. In Proceedings of the 31st Conference on Neural Information Processing Systems (NIPS 2017), Long Beach, CA, USA, 4–9 December 2017. [Google Scholar]
- Christiano, P.; Leike, J.; Brown, T.; Martic, M.; Legg, S.; Amodei, D. Deep Reinforcement Learning from Human references. In Proceedings of the 31st Conference on Neural Information Processing Systems (NIPS2017), Long Beach, CA, USA, 4–9 December 2017. [Google Scholar]
- Kulkarni, T.D.; Narasimhan, K.R.; Saeedi, A.; Tenenbaum, J.B. Hierarchical Deep Reinforcement Learning: Integrating Temporal Abstraction and Intrinsic Motivation. In Proceedings of the 30th Conference on Neural Information Processing Systems (NIPS 2016), Barcelona, Spain, 5–10 December 2016. [Google Scholar]
- Mnih, V.; Kavukcuoglu, K.; Rusu, D.S.a.A.; Veness, J.; Bellemare, M.G.; Graves, A.; Fidjeland, M.R.A.K.; Ostrovski, G.; Petersen, S.; Beattie, C.; et al. Human-level control through deep reinforcement learning. Res. Lett. 2015, 518, 529–533. [Google Scholar] [CrossRef] [PubMed]
- Haarnoja, T.; Tang, H.; Abbeel, P.; Levine, S. Reinforcement Learning with Deep Energy-Based Policies. In Proceedings of the 34th International Conference on Machine Learning, Sydney, Australia, 6–11 August 2017. [Google Scholar]
- El Sallab, A.; Abdou, M.; Perot, E.; Yogamani, S. Deep Reinforcement Learning framework for Autonomous Driving. In Proceedings of the S&T International Symposium on Electronic Imaging Science and Technology 2017: Autonomous Vehicles and Machines 2017, Burlingame, CA, USA, 29 January–2 February 2017; pp. 70–76. [Google Scholar] [CrossRef]
- Hessel, M.; Modayil, J.; van Hasselt, H.; Schaul, T.; Ostrovski, G.; Dabney, W.; Horgan, D.; Piot, B.; Azar, M.; Silver, D. Rainbow: Combining Improvements in Deep Reinforcement Learning. In Proceedings of the Thirty-Second AAAI Conference on Artificial Intelligence (AAAI-18), New Orleans, LA, USA, 2–7 February 2018. [Google Scholar]
- Zhu, Y.; Mottaghi, R.; Kolve, E.; Lim, J.J.; Gupta, A. Target-driven Visual Navigation in Indoor Scenes using Deep Reinforcement Learning. In Proceedings of the 2017 IEEE International Conference on Robotics and Automation, Singapore, 29 May–3 June 2017; pp. 3357–3364. [Google Scholar]
- Caicedo, J.; Lazebnik, S. Active Object Localization with Deep Reinforcement Learning. In Proceedings of the 2015 IEEE International Conference on Computer Vision, Santiago, Chile, 7–13 December 2015. [Google Scholar]
- Gu, S.; Holly, E.; Lillicrap, T.; Levine, S. Deep Reinforcement Learning for Robotic Manipulation with Asynchronous Off-Policy Updates. In Proceedings of the2017 IEEE International Conference on Robotics and Automation (ICRA), Singapore, 29 May–3 June 2017. [Google Scholar] [CrossRef]
- Lample, G.; Chaplot, D.S. Playing FPS Games with Deep Reinforcement Learning. In Proceedings of the Thirty-First AAAI Conference on Artificial Intelligence (AAAI-17), San Francisco, CA, USA, 4–9 February 2017. [Google Scholar]
- Kaelbling, L.P.; Littman, M.L.; Moore, A.W. Reinforcement Learning: A Survey. J. Artif. Intell. Res. 1996, 4, 237–285. [Google Scholar] [CrossRef] [Green Version]
- Gelenbe, E. Random Neural Networks with Negative and Positive Signals and Product Form Solution. Neural Comput. 1989, 1, 502–510. [Google Scholar] [CrossRef]
- Gelenbe, E. Learning in the Recurrent Random Neural Network. Neural Comput. 1993, 5, 154–164. [Google Scholar] [CrossRef]
- Gelenbe, E. G-Networks with Triggered Customer Movement. J. Appl. Probab. 1993, 30, 742–748. [Google Scholar] [CrossRef]
- Gelenbe, E. Cognitive Packet Network. Patent U.S. 6804201 B1, 10 December 2004. [Google Scholar]
- Gelenbe, E.; Xu, Z.; Seref, E. Cognitive Packet Networks. In Proceedings of the International Conference on Tools with Artificial Intelligence, Chicago, IL, USA, 9–11 November 1999; pp. 47–54. [Google Scholar]
- Gelenbe, E.; Lent, R.; Xu, Z. Networks with Cognitive Packets. In Proceedings of the IEEE International Symposium on the Modeling, Analysis and Simulation of Computer and Telecommunication Systems, San Francisco, CA, USA, 29 August–1 September 2000; pp. 3–10. [Google Scholar]
- Gelenbe, E.; Lent, R.; Xu, Z. Measurement and performance of a cognitive packet network. Comput. Netw. 2001, 37, 691–701. [Google Scholar] [CrossRef]
- Gelenbe, E.; Lent, R.; Montuori, A.; Xu, Z. Cognitive Packet Networks: QoS and Performance. In Proceedings of the IEEE International Symposium on the Modeling, Analysis and Simulation of Computer and Telecommunication Systems, Fort Worth, TX, USA, 11–16 October 2002; pp. 3–9. [Google Scholar]
Figure 1.
Building information model levels.

Figure 2.
The Internet of Things.

Figure 3.
Cybersecurity architecture.

Figure 4.
Blockchain configuration.

Figure 5.
Artificial intelligence classification.

Figure 6.
Reinforcement learning algorithm.

Figure 7.
Deep reinforcement learning model.

Figure 8.
Deep reinforcement algorithm.

Figure 9.
Deep reinforcement learning in intelligent infrastructure.

Figure 10.
Intelligent infrastructure neural configuration.

Figure 11.
Intelligent infrastructure manager sensor values.

Figure 12.
Management sensor trend prediction validation: β value.

Figure 13.
Management sensor trend prediction validation: α value.

Figure 14.
Management sensor value prediction validation: γ value.


Table 1.
Dataset key values.
| Key | Description |
|---|---|
| Data points | 22 |
| Measurements | 19,736 |
| Variables | Energy (W), indoor temperature (°C), indoor humidity (H), outdoor temperature (°C), outdoor humidity (H) |
| Data inputs | 434,192 |
| Size | 2974 kilobytes |
| Testing iterations | 19,736 (100%) |
| Training iterations | 0.0 (0.0%) |
Table 2.
Deep Reinforcement Learning (DRL) memory configurations.
| Type | Description | Time |
|---|---|---|
| DRL-0M | No memory: same as traditional reinforcement learning | t = l−1 |
| DRL-FM | Full memory: learning starts since the beginning of actions | t = 0 |
| DRL-1D | Partial memory: learning covers only last day | t = l−1− 144 |
| DRL-7D | Partial memory: learning covers only last week | t = l−1−144 × 7 |
| DRL-DD | Partial memory: learning covers same time for all previous days | t = Δ144 |
| DRL-WW | Partial memory: learning covers same time for all previous weeks | t = Δ144 × 7 |
Table 3.
DRL-0M management sensor trend prediction validation: β value.
| Β | Energy | Indoor Temperature | Indoor Humidity | Outdoor Temperature | Outdoor Humidity | Total Values |
|---|---|---|---|---|---|---|
| 1 × 100 | R: 6359 P: 13,377 A: 32.22% | R: 8889 P: 10,847 A: 45.04% | R: 11,226 P: 8510 A: 56.88% | R: 11,755 P: 7981 A: 52.50% | R: 11,493 P: 8243 A: 58.23% | R: 48,329 P: 50,351 A: 48.98% |
| 1 × 101 | R: 6575 P: 13,161 A: 33.31% | R: 12,827 P: 6909 A: 64.99% | R: 13,563 P: 6173 A: 68.72% | R: 13,696 P: 6040 A: 69.40% | R: 14,594 P: 5142 A: 73.95% | R: 61,255 P: 37,425 A: 62.07% |
| 1 × 10² | R: 6503 P: 13,233 A: 32.95% | R: 14,719 P: 5017 A: 74.58% | R: 14,360 P: 5376 A: 72.76% | R: 16,456 P: 3280 A: 83.38% | R: 16,962 P: 2774 A: 85.94% | R: 69,000 P: 29,680 A: 69.92% |
| 1 × 10³ | R: 6503 P: 13,233 A: 32.95% | R: 14,190 P: 5546 A: 71.90% | R: 14,208 P: 5528 A: 71.99% | R: 17,606 P: 2130 A: 89.21% | R: 17,187 P: 2549 A: 87.08% | R: 69,694 P: 28,986 A: 70.63% |
| 1 × 10⁴ | R: 6499 P: 13,237 A: 32.93% | R: 14,038 P: 5698 A: 71.13% | R: 14,156 P: 5580 A: 71.73% | R: 17,787 P: 1949 A: 90.12% | R: 17,341 P: 2395 A: 87.86% | R: 69,821 P: 28,859 A: 70.75% |
| 1 × 10⁵ | R: 6550 P: 13,186 A: 33.19% | R: 13,883 P: 5853 A: 70.34% | R: 14,306 P: 5430 A: 72.49% | R: 17,860 P: 1876 A: 90.49% | R: 17,142 P: 2594 A: 86.86% | R: 69,741 P: 28,939 A: 70.67% |
Table 4.
DRL-FM management sensor trend prediction validation: β value.
| Β | Energy | Indoor Temperature | Indoor Humidity | Outdoor Temperature | Outdoor Humidity | Total Values |
|---|---|---|---|---|---|---|
| 1 × 100 | R: 6531 P: 13,205 A: 33.09% | R: 8283 P: 11,453 A: 41.97% | R: 10,129 P: 9607 A: 51.32% | R: 10,413 P: 9323 A: 52.76% | R: 12,117 P: 7619 A: 61.40% | R: 47,473 P: 51,207 A: 48.11% |
| 1 × 101 | R: 6646 P: 13,090 A: 33.67% | R: 13,473 P: 6263 A: 68.27% | R: 14,337 P: 5399 A: 72.64% | R: 14,321 P: 5415 A: 72.56% | R: 15,373 P: 4363 A: 77.89% | R: 64,150 P: 34,530 A: 65.01% |
| 1 × 10² | R: 6633 P: 13,103 A: 33.61% | R: 15,211 P: 4525 A: 77.07% | R: 15,021 P: 4715 A: 76.11% | R: 17,099 P: 2637 A: 86.64% | R: 17,254 P: 2482 A: 87.42% | R: 71,218 P: 27,462 A: 72.17% |
| 1 × 10³ | R: 6624 P: 13,112 A: 33.56% | R: 14,640 P: 5096 A: 74.18% | R: 14,734 P: 5002 A: 74.66% | R: 18,016 P: 1720 A: 91.28% | R: 17,524 P: 2212 A: 88.79% | R: 71,538 P: 27,142 A: 72.49% |
| 1 × 10⁴ | R: 6621 P: 13,115 A: 33.55% | R: 14,425 P: 5311 A: 73.09% | R: 14,726 P: 5010 A: 74.61% | R: 18,131 P: 1605 A: 91.87% | R: 17,575 P: 2161 A: 89.05% | R: 71,478 P: 27,202 A: 72.43% |
| 1 × 10⁵ | R: 6621 P: 13,115 A: 33.55% | R: 14,389 P: 5347 A: 72.91% | R: 14,716 P: 5020 A: 74.56% | R: 18,153 P: 1583 A: 91.98% | R: 17,590 P: 2146 A: 89.13% | R: 71,469 P: 27,211 A: 72.43% |
Table 5.
DRL-0M management sensor trend prediction validation: α value.
| α | Energy | Indoor Temperature | Indoor Humidity | Outdoor Temperature | Outdoor Humidity | Total Values |
|---|---|---|---|---|---|---|
| 0.1 | R: 6536 P: 13,200 A: 33.12% | R: 14,592 P: 5144 A: 73.94% | R: 14,255 P: 5481 A: 72.23% | R: 17,282 P: 2454 A: 87.57% | R: 17,368 P: 2368 A: 88.00% | R: 70,033 P: 28,647 A: 70.97% |
| 0.25 | R: 6530 P: 13,206 A: 33.09% | R: 14,483 P: 5253 A: 73.38% | R: 14,290 P: 5446 A: 72.41% | R: 17,717 P: 2019 A: 89.77% | R: 17,226 P: 2510 A: 87.28% | R: 70,246 P: 28,434 A: 71.19% |
| 0.5 | R: 6503 P: 13,233 A: 32.95% | R: 14,190 P: 5546 A: 71.90% | R: 14,208 P: 5528 A: 71.99% | R: 17,606 P: 2130 A: 89.21% | R: 17,187 P: 2549 A: 87.08% | R: 69,694 P: 28,986 A: 70.63% |
| 0.75 | R: 6478 P: 13,258 A: 32.82% | R: 13,978 P: 5758 A: 70.82% | R: 14,043 P: 5693 A: 71.15% | R: 17,625 P: 2111 A: 89.30% | R: 17,329 P: 2407 A: 87.80% | R: 69,453 P: 29,227 A: 70.38% |
| 0.9 | R: 6485 P: 13,251 A: 32.86% | R: 13,997 P: 5739 A: 70.92% | R: 14,150 P: 5586 A: 71.70% | R: 17,720 P: 2016 A: 89.79% | R: 17,276 P: 2460 A: 87.54% | R: 69,628 P: 29,052 A: 70.56% |
Table 6.
DRL-FM management sensor trend prediction validation: α value.
| α | Energy | Indoor Temperature | Indoor Humidity | Outdoor Temperature | Outdoor Humidity | Total Values |
|---|---|---|---|---|---|---|
| 0.1 | R: 6591 P: 13,145 A: 33.40% | R: 14,894 P: 4842 A: 75.47% | R: 14,855 P: 4881 A: 75.27% | R: 17,399 P: 2337 A: 88.16% | R: 16,818 P: 2918 A: 85.21% | R: 70,557 P: 28,123 A: 71.50% |
| 0.25 | R: 6636 P: 13,100 A: 33.62% | R: 14,874 P: 4862 A: 75.36% | R: 14,875 P: 4861 A: 75.37% | R: 17,795 P: 1941 A: 90.17% | R: 17,326 P: 2410 A: 87.79% | R: 71,506 P: 27,174 A: 72.46% |
| 0.5 | R: 6624 P: 13,112 A: 33.56% | R: 14,640 P: 5096 A: 74.18% | R: 14,734 P: 5002 A: 74.66% | R: 18,016 P: 1720 A: 91.28% | R: 17,524 P: 2212 A: 88.79% | R: 71,538 P: 27,142 A: 72.49% |
| 0.75 | R: 6630 P: 13,106 A: 33.59% | R: 14,420 P: 5316 A: 73.06% | R: 14,718 P: 5018 A: 74.57% | R: 18,103 P: 1633 A: 91.73% | R: 17,574 P: 2162 A: 89.05% | R: 71,445 P: 27,235 A: 72.40% |
| 0.9 | R: 6632 P: 13,104 A: 3.60% | R: 14,483 P: 5253 A: 73.38% | R: 14,731 P: 5005 A: 74.64% | R: 18,105 P: 1631 A: 91.74% | R: 17,571 P: 2165 A: 89.03% | R: 71,522 P: 27,158 A: 72.48% |
Table 7.
DRL-0M management sensor value predictor error: γ value.
| γ | Energy | Indoor Temperature | Indoor Humidity | Outdoor Temperature | Outdoor Humidity | Total Values |
|---|---|---|---|---|---|---|
| 0.1 | 5.14 × 10⁻¹ | 3.34 × 10⁻⁴ | 2.36 × 10⁻³ | 1.23 × 10⁻³ | 6.85 × 10⁻³ | 5.25 × 10⁻¹ |
| 0.25 | 5.15 × 10⁻¹ | 3.84 × 10⁻⁴ | 2.60 × 10⁻³ | 1.45 × 10⁻³ | 8.0 × 10⁻³ | 5.28 × 10⁻¹ |
| 0.5 | 5.29 × 10⁻¹ | 5.30 × 10⁻⁴ | 3.27 × 10⁻³ | 2.09 × 10⁻³ | 1.14 × 10⁻² | 5.46 × 10⁻¹ |
| 0.75 | 5.61 × 10⁻¹ | 9.33 × 10⁻⁴ | 4.97 × 10⁻³ | 3.80 × 10⁻³ | 2.00 × 10⁻² | 5.90 × 10⁻¹ |
| 0.9 | 6.09 × 10⁻¹ | 1.90 × 10⁻³ | 8.69 × 10⁻³ | 7.88 × 10⁻³ | 3.89 × 10⁻² | 6.67 × 10⁻¹ |
Table 8.
DRL-FM management sensor value predictor error: γ value.
| γ | Energy | Indoor Temperature | Indoor Humidity | Outdoor Temperature | Outdoor Humidity | Total Values |
|---|---|---|---|---|---|---|
| 0.1 | 7.42 × 10⁻¹ | 1.26 × 10⁻² | 3.49 × 10⁻² | 3.43 × 10⁻² | 1.03 × 10⁻¹ | 9.27 × 10⁻¹ |
| 0.25 | 7.43 × 10⁻¹ | 1.26 × 10⁻² | 3.49 × 10⁻² | 3.43 × 10⁻² | 1.03 × 10⁻¹ | 9.27 × 10⁻¹ |
| 0.5 | 7.43 × 10⁻¹ | 1.26 × 10⁻² | 3.49 × 10⁻² | 3.43 × 10⁻² | 1.03 × 10⁻¹ | 9.27 × 10⁻¹ |
| 0.75 | 7.43 × 10⁻¹ | 1.26 × 10⁻² | 3.49 × 10⁻² | 3.44 × 10⁻² | 1.03 × 10⁻¹ | 9.28 × 10⁻¹ |
| 0.9 | 7.44 × 10⁻¹ | 1.26 × 10⁻² | 3.50 × 10⁻² | 3.44 × 10⁻² | 1.03 × 10⁻¹ | 9.29 × 10⁻¹ |
© 2019 by the author. Licensee MDPI, Basel, Switzerland. This article is an open access article distributed under the terms and conditions of the Creative Commons Attribution (CC BY) license (http://creativecommons.org/licenses/by/4.0/).
Share and Cite
MDPI and ACS Style
Serrano, W. Deep Reinforcement Learning Algorithms in Intelligent Infrastructure. Infrastructures 2019, 4, 52. https://doi.org/10.3390/infrastructures4030052
AMA Style
Serrano W. Deep Reinforcement Learning Algorithms in Intelligent Infrastructure. Infrastructures. 2019; 4(3):52. https://doi.org/10.3390/infrastructures4030052
Chicago/Turabian StyleSerrano, Will. 2019. "Deep Reinforcement Learning Algorithms in Intelligent Infrastructure" Infrastructures 4, no. 3: 52. https://doi.org/10.3390/infrastructures4030052