
Visual Analysis of Relationships between Heterogeneous Networks and Texts: An Application on the IEEE VIS Publication Dataset


1
Department of Computer Science, Linnaeus University, 351 95 Växjö, Sweden
2
Swedish Research Institute (RISE SICS), Box 1263, 164 29 Kista, Sweden
*
Author to whom correspondence should be addressed.
Informatics 2017, 4(2), 11; https://doi.org/10.3390/informatics4020011
Submission received: 6 April 2017
/
Revised: 28 April 2017
/
Accepted: 8 May 2017
/
Published: 11 May 2017
(This article belongs to the Special Issue Scalable Interactive Visualization)
Abstract
:The visual exploration of large and complex network structures remains a challenge for many application fields. Moreover, a growing number of real-world networks is multivariate and often interconnected with each other. Entities in a network may have relationships with elements of other related datasets, which do not necessarily have to be networks themselves, and these relationships may be defined by attributes that can vary greatly. In this work, we propose a comprehensive visual analytics approach that supports researchers to specify and subsequently explore attribute-based relationships across networks, text documents and derived secondary data. Our approach provides an individual search functionality based on keywords and semantically similar terms over the entire text corpus to find related network nodes. For examining these nodes in the interconnected network views, we introduce a new interaction technique, called Hub2Go, which facilitates the navigation by guiding the user to the information of interest. To showcase our system, we use a large text corpus collected from research papers listed in the visualization publication dataset that consists of 2752 documents over a period of 25 years. Here, we analyze relationships between various heterogeneous networks, a bag-of-words index and a word similarity matrix, all derived from the initial corpus and metadata.

1. Introduction
The combination of different heterogeneous networks and related textual data is crucial for various application domains. Libraries, for example, are nowadays interested in analyzing (known or hidden) relationships among various collections of books, which might be related to each other even though they do not share the same author or topic. Based on an initial book search, analysts want to find out what terms were used in a specific book, find related ones that might use the same or similar terms and also visualize the direct neighborhood network of those books, which could, for instance, consist of other books written by the same authors.
Similar text corpora may be derived from conference proceeding publications, such as the IEEE Visualization Conference [1] proceedings, which we use as an application example and use case in this paper. Here, a researcher could be interested in finding out more about a specific topic and therefore wants to explore publications that use a number of specific keywords or terms. However, related publications might use different terms, but still talk about the same idea; or those publications mention certain terms that do not appear in the title or their keyword list. For less experienced researchers, it might help to alleviate the initial process of getting an overview of their new field if they would have access to tools that are able to find these concealed connections.
Integrating different network visualizations together with related multivariate data and helping analysts to discover relevant information, in the context of this paper by providing them with interactive possibilities to view and explore the relations between networks and large text corpora, is still an open challenge and has not yet been sufficiently addressed to the best of our knowledge. This approach is also important for other application domains such as biology, where the correlation of large metabolic pathways, protein-protein-interaction networks or regulatory networks is an important issue and the interconnections between various networks are not always obvious. Different networks come with numerous multivariate attributes (e.g., coming from experimental data), and exploring just one network and its related multivariate data is already a challenge in itself. This has been addressed by various techniques and tools; see the state-of-the-art survey of Kerren et al. [2]. Another survey for the visual analysis of graphs and open challenges in this area is provided by von Landesberger et al. [3]. In a collection of datasets (see the illustration in Figure 1), an attribute in one network might be related to other attributes in various other networks, even though they might not have the same identifier or name. To make interesting assessments about the data, analysts need to search for specific keywords, terms, authors or other metadata across different networks that might or might not be related.
If they also have text corpora available in addition to the network data, it can be interesting to see the relationships between documents that result from analyzing the text corpora. Such relations could be derived from the usage of specific terms in the documents, from a list of papers written by a specific author or be based on texts written at the same institution. It could also be worth investigating whether authors who use similar terms throughout their publications have a connection to each other. Examples of such a connection could be co-authoring a paper, performing research in the same field or having the same affiliation. Maybe the authors never really worked together, but one author was citing another author’s work and was influenced by the choice of words in the original document. In this article, we address these challenges and analysis tasks. Our main contributions in the field of heterogeneous network exploration in the context of visual text analytics are:
- we present a scalable system that gives analysts the possibility to interactively specify and explore mappings across interconnected heterogeneous networks with thousands of nodes and related data derived from text corpora;
- we provide a way to perform a search based on main keywords and semantically similar terms over the entire text corpus to find related nodes, which represent, for instance, papers, authors or affiliations;
- we introduce the technique “Hub2Go”, which enables users to quickly add and examine these nodes in the interconnected networks views; and
- we give the option to directly compare the usage of specific terms across a selection of nodes.
The remainder of this article is organized as follows. In the next section, we discuss related work in network visualization and document analysis. The compilation of our example data is described thoroughly in Section 3. We discuss our visualization together with a method for exploring mappings between different networks and datasets in Section 4 and Section 5. Then, we showcase our approach with a use case in Section 6 followed by a discussion on limitations and performance aspects in Section 7. We conclude this article in Section 8.
2. Related Work
The visualization of links across related networks has so far mostly been addressed for biological pathways. Due to the sheer size of these networks, biologists usually create a number of smaller subsets that are then analyzed using different techniques. Caleydo [4], for instance, shows networks side by side in a 2.5D environment. Entourage [5] uses a focus+context approach to explore relationships in biological pathways. While analysts explore a pathway and focus on specific nodes, parts of related pathways are shown in additional views as contextual subsets. Our application uses dynamic network views similar to this idea; based on a focus node and configured attribute matching settings between networks and additional datasets, our system allows one to explore nodes and their direct neighborhood in related network views. Exploring the connections in just one larger network is often already a challenging task: navigating across links to adjacent nodes is difficult if the nodes are far away from each other and not in the current view. This usually requires much panning and also zooming of the graph view and puts a lot of cognitive load on the user. To tackle this problem, May et al. [6] proposed signposts to provide cues about off-screen regions in a graph visualization. Henry et al. [7] combine traditional node-link diagrams with adjacency matrices for a compact view on a network. The links between the matrix representations can be considered as connections between subnetworks within one large network. Another approach from Moscovich et al. [8] introduced (1) link sliding to automatically move the camera across links to adjacent nodes and (2) bring and go, which moves adjacent nodes into the current view, close to the selected node. Our Hub2Go technique uses a similar approach, but supports automatic camera movements in multiple network views to ease the navigation from and to nodes across interconnected networks and relations to other data. There are also tools to assist users in creating and exploring networks from raw tabular data, such as Orion [9] or Ploceus [10]. These tools use single node-link and matrix views to visualize the generated networks. Our approach differs from these techniques because we expect already existing network data, visualize related networks in multiple node-link views and give options to dynamically define and visualize links between those views.
Tools for the visual analysis of documents and literature publications are related to our use case application. A general overview of text visualization techniques is available in the interactive TextVis Browser [11]. Furthermore, Federico et al. [12] provide a broad survey about various techniques and open challenges for analyzing the scientific literature. More specifically, Görg et al. [13] use Jigsaw for the exploration and sensemaking of document collections. They use a list view to show the relationships among co-authors, keywords and other attributes, together with a clustered view of related papers. Shen et al. [14] use an interactive table together with multiple stacked network planes in a 2D or 3D view to visualize interconnections between various paper, author and publication networks. PivotSlice [15] uses a more general approach to visualize relationships in datasets. It supports dynamic queries on attributes and divides datasets into facets and connected views on the data. Phrase Nets [16] offers techniques to depict relationships in a text and map it into a network-based overview. Refinery [17] shows combined heterogeneous networks with subgraphs generated from user queries in one network view. Chen et al. [18] analyze the metadata of document collections and visualize identified topics together with co-authors in a single network visualization to show collaborations over time. Instead of only using titles, abstracts, keywords and other metadata as the previous tools, our system also supports exploring the complete text corpus of a document collection, which gives analysts the possibility to find documents based on terms that might otherwise not be visible. There are various other systems that use the complete text corpora of document collections. For instance, TextPioneer [19] uses on automatic topic extraction to build a hierarchical overview of interesting topics across multiple text corpora, whereas our approach focuses more on the exploration of specific terms of a document corpus. CiteRivers [20] aims at visualizing citation patterns of scientific document collections over time, but does not feature the exploration of author collaborations as we do in our network visualizations.
3. Data Sources and Preprocessing
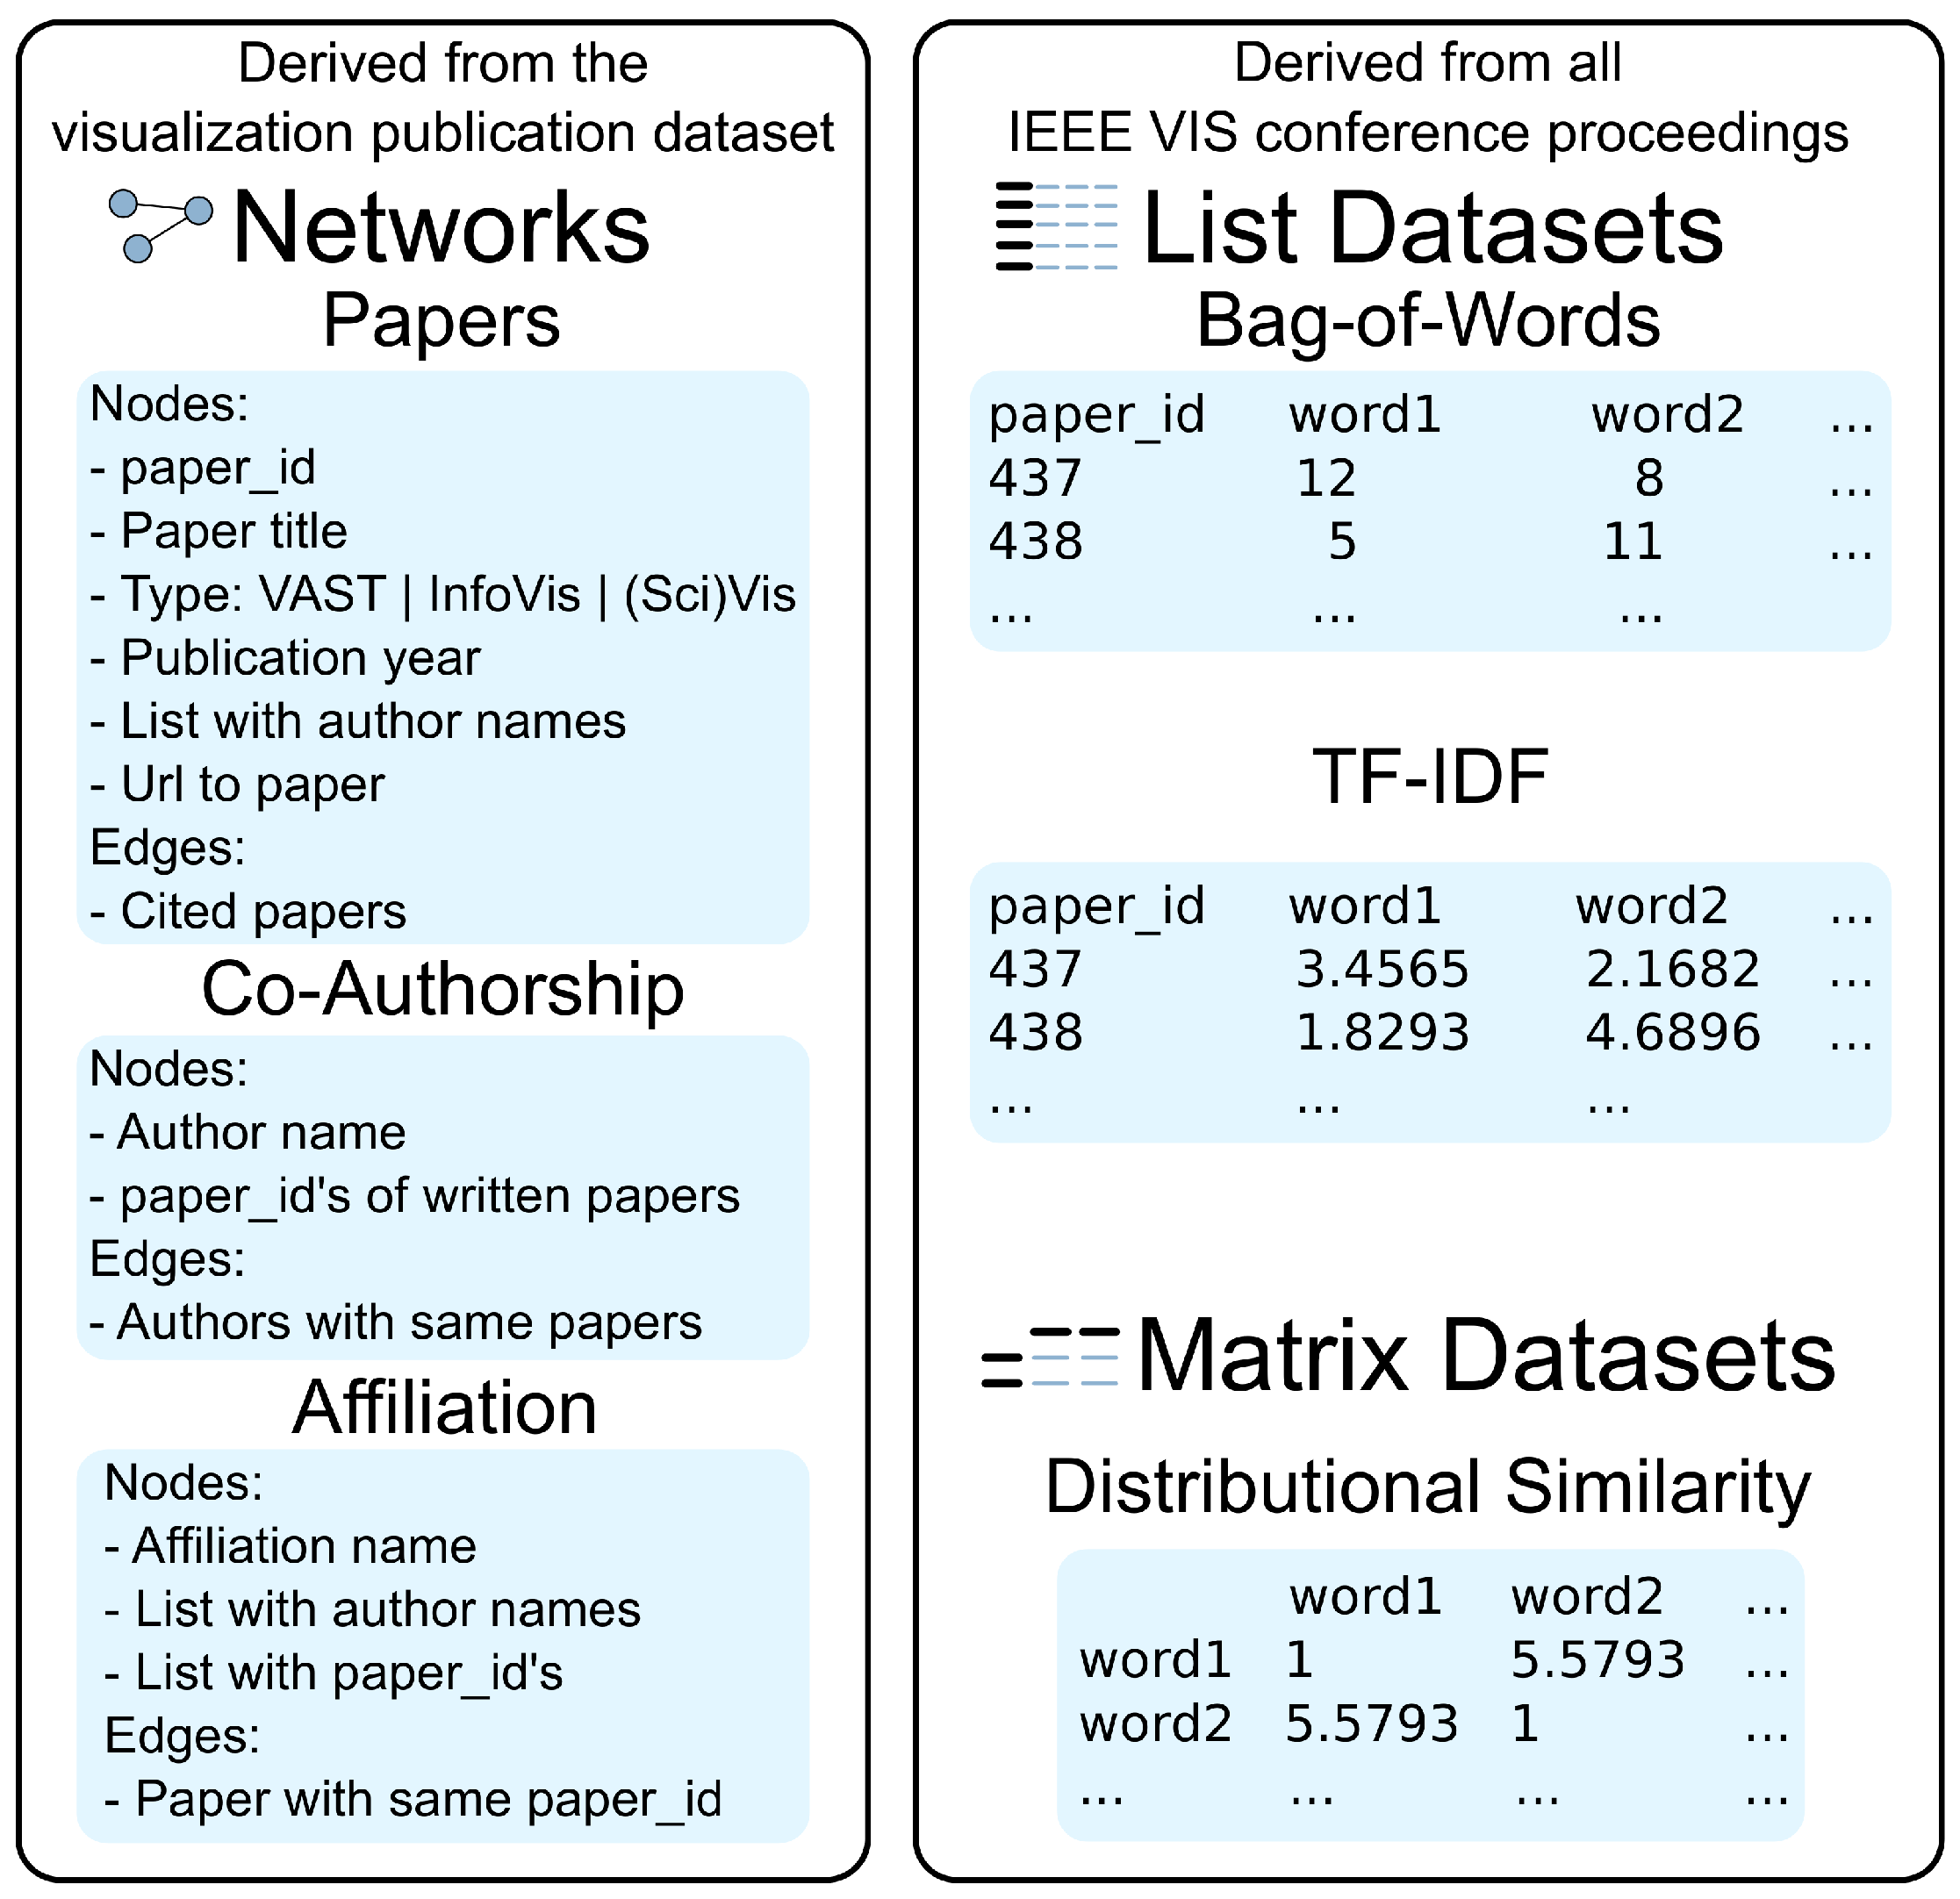
Our visualization runs in a web browser and uses a client/server-based architecture, which is based on our Online Graph Exploration System (OnGraX) [21,22]. Generally, OnGraX can be used to specify and explore mappings across any networks and related quantitative data. For our use case employed throughout this article, we focus on analyzing the complete text corpus, which we derived from all papers in the IEEE VIS conference proceedings with the help of the visualization publication dataset [23]. We created three networks from the initial data, which help us to explore relations within the data. Nodes in the first network (2752 nodes and 10,021 edges) represent all papers from 1990–2015, and edges represent paper citations. Node shapes in the resulting network visualization encode the VIS conferences: rectangles for the Visual Analytics Science and Technology (VAST) conference, circles for the Information Visualization (InfoVis) conference, triangles for the Scientific Visualization (SciVis) conference and diamonds for older Vis papers. Nodes in the second network (4890 nodes and 14,023 edges) represent all authors and co-authors from the dataset. Edges are added between authors if they wrote a paper together at least once. Nodes in the third network (1539 nodes and 5773 edges) represent all author affiliations, and edges are added if authors from different affiliations published a paper together. As we did not prune the initial VIS dataset, the co-authorship and affiliation networks may contain duplicates with slightly different wording.
Moreover, we did a pdf-to-text conversion for all papers in the IEEE VIS conference proceedings and used the resulting text corpus to create a word occurrence index (a so-called bag-of-words (BoW) index) and a word importance index (a so-called term frequency–inverse document frequency (TF-IDF) index) to find the most frequent and most important terms. The resulting indices contain 12,346 words/terms each and can also be used to uncover the main representative words/terms in a specific paper or to find terms that were used by a specific author or even in an affiliation. The indices contain single words, as well as bigrams, which are discussed in Section 3.1. Additionally, we use a word similarity matrix to find and analyze the relationships between terms that are used in the same context between various papers.
Figure 2 shows the structure and attributes of the networks and datasets in detail. The resulting list and matrix datasets are stored as plain, space-delimited text files on the server. At runtime, the server loads and keeps a copy of all required datasets in memory to provide faster query times for mapping requests during the exploration of the networks.
Note that the difference between the BoW and TF-IDF indices is that the former only quantifies the frequency of occurrence of terms in the data (i.e., has a term occurred or not?), whereas the latter tries to qualify the importance of occurrences (i.e., is a term important or not?). Having identified the main keywords in a paper (or author/affiliation) of interest, it is also possible to find other papers (authors/affiliations) that have used the same terms. As an example, we may be interested in a specific paper about “sentiment analysis”. By using the BoW index, we can find all other papers that have mentioned this term, and we can subsequently analyze the co-authorship networks of this group of papers (see Section 5 for details on this process). If we use the TF-IDF index instead, we find other papers for which the term is a useful index term (i.e., for which it is important). Finally, the word similarity matrix enables us to find other terms that have been used near-synonymously (or, more generally, in the same way) as some keyword. Searching for the term “sentiment analysis” again, we can use the word similarity matrix to find other terms that might be of interest to us; perhaps terms such as “opinion mining” and “topic detection”, which could then be included in the current analysis. In the following, we provide details on how we produced the BoW, TF-IDF indices and word similarity matrices.
3.1. Text Preprocessing
After the pdf-to-text conversion, we removed the punctuation from the resulting text and also lower-cased and tokenized it. We even identified salient bigrams in the data, such as the term “traffic_flows” from our use case in Section 6, using a variant of mutual information that is commonly used for bigram detection in natural language processing:
where is the co-occurrence frequency of a and b, and are the individual frequencies of a and b and is a discounting factor that counteracts the tendency of mutual information to promote infrequent items, which we set to . The resulting mutual information scores are sorted, and only the highest-scoring bigrams are included in the data. The threshold for the mutual information scores is a trade-off between precision and recall: a lower threshold leads to more, but less precise bigrams, while a higher threshold leads to fewer, but more precise bigrams. We opt for a more conservative threshold in this paper.
3.2. Bag-of-Words
Bag-of-words (BoW) is a standard text representation formalism in natural language processing (NLP), which represents text simply as a bag containing frequency counts of the words that occur in the text. Formally, the BoW representation of a text is a vector:
whose dimensionality n is the size of the vocabulary (i.e., each word in the vocabulary is represented by one separate dimension) and is some weight that quantifies the importance of the word in the text. There are many ways to quantify the importance of a word in a document; the arguably most common term weighting scheme is TF-IDF, which in its simplest form is defined as:
where tfi,j is the frequency of word i in document j, dfi is the number of documents word i occurs in and N is the total number of documents in the data. It should be noted that there are many variations, refinements and alternatives to using TF-IDF to extract useful terms as indicated by Chuang et al. [24], for example. However, we opt for the standard TF-IDF measure in this work, since it is simple to compute and produces useful results. Using BoW representations enables us to find all documents that contain a certain term (i.e., all documents for which the value of the dimension representing the term in question is not zero). The TF-IDF representation also enables us to list the most useful index terms for a document (i.e., the terms with highest TF-IDF weights for that particular document).
3.3. Word Similarity
In order to produce the word similarity matrix, we use distributional semantics, which is the practice of using information about the co-occurrence patterns of terms in order to quantify semantic similarity. In a standard distributional semantic model (DSM), each word is represented by a distributional vector, , where is a function of the co-occurrence count between the focus word and each context word that has occurred within a window of k tokens around the focus word [25]. Words that have co-occurred with the same other words (i.e., that are interchangeable in context) get similar distributional vectors, which means we can use the resulting model to quantify semantic similarity between terms.
There are many variations of DSMs, ranging from simple count-based methods to the currently more popular, and more complex, models based on factorization techniques or neural networks [26,27,28]. We opt for an approach based on an incremental random projection of a count-based model, called random indexing (RI) [29], which accumulates distributional vectors by summing sparse random index vectors that act as fingerprints for the context items:
where c is the extension of the context window, is some weight function that quantifies the importance of context term b and is a permutation that rotates the random index vectors according to the position j of the context items within the context windows, thus enabling the model to take word order into account [30]. We use 2000-dimensional vectors, , and the weight function suggested in Sahlgren et al. [31]. There are several reasons why we use RI instead of one of the currently more popular DSM models. One is the ability of RI to encode word order, which is not possible to do using, e.g., the word2vec library or the GloVe model. Another reason is the scalability and efficiency of RI, which makes it suitable for collections with large amounts of data. It should also be mentioned that the most current DSMs perform similarly, given that parameters have been optimized for the specific data and task at hand.
In order to produce the word similarity matrix, we compute pairwise similarities between all words with frequency in the data using cosine similarity. We utilize a comparatively high frequency cut-off for the word similarity matrix, since low-frequent words have insufficient distributional statistics to produce reliable distributional vectors.
4. Specifying Attribute Mappings
Before exploring the interconnections and relations between networks and additional datasets, analysts have to specify which attributes they want to compare throughout the complete data collection. Instead of having to do this programmatically, our application enables analysts to create and subsequently explore arbitrary mappings between all graphs and additional datasets (e.g., lists or matrices) on the fly by using a small bipartite graph visualization as shown in Figure 3. Nodes either represent a graph or a dataset that was imported into the application. The node colors are selected by the tool from a color list created with ColorBrewer [32]. They are also used as background colors for the hubs during the exploration of a mapping to indicate the target dataset (see Figure 4h). Every dialog with a view on a graph or dataset has a small colored rectangle in the top right corner to indicate its mapped color. Users can add unidirectional and bidirectional mappings by dragging the mouse from a source to a target node. The application will ask which attribute from the source should be mapped against the target.
As performance can be an issue if a large number of graphs and datasets with many entries are loaded, users can add and remove graphs and datasets (that are already imported into the system) to the matcher on the fly. Depending on a priori knowledge, mappings can be defined from and to specific attributes or be more general, to iterate over all possible attributes of a target graph or dataset. For the data from our use case, all matches across the datasets are calculated and visualized in less than a second, but to provide better scalability for bigger datasets with a large number of entities and additional attributes, specific mappings could be helpful to reduce the required time to iterate over all possible matches.
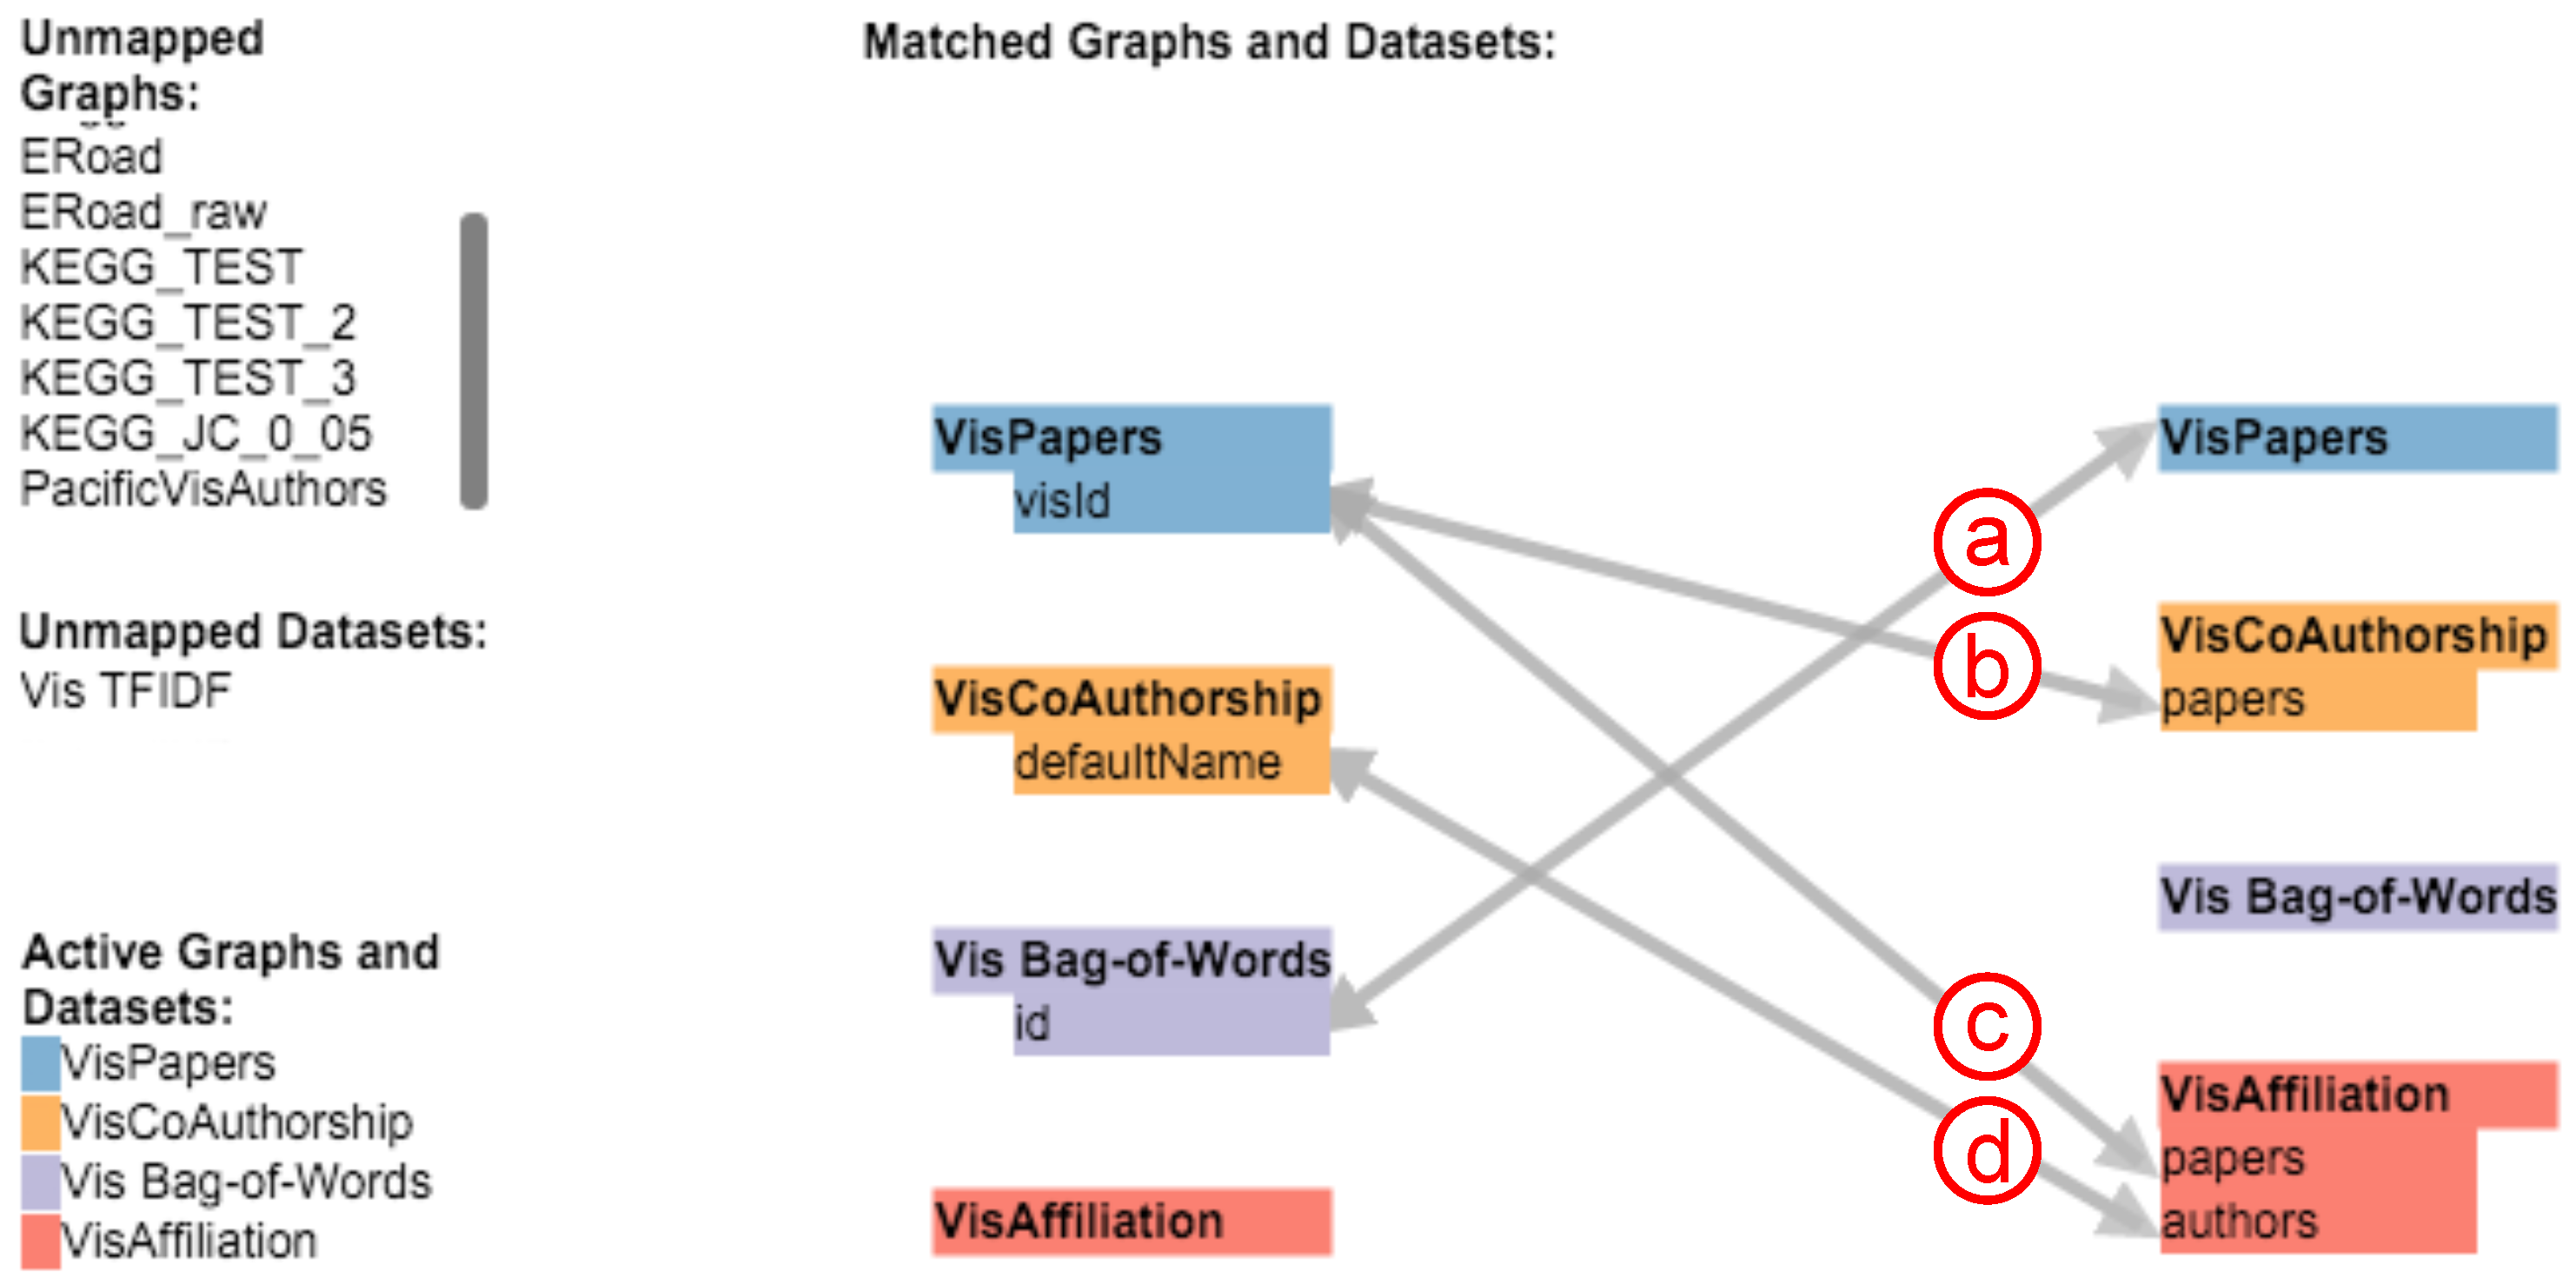
An actual mapping is performed dynamically, i.e., if a user clicks on a node in one of the network views or an entry in one of the additional bar charts. In Figure 3, the analyst declared four mappings between three graphs and the BoW index. The first mapping (see Figure 3a) from the BoW index to the papers network is used if a user clicks on a node in the respective network view. The application will then iterate through the BoW index, locate the row with the matching paper ID and fetch all terms used in that paper to show their BoW values in the BoW chart. As this mapping is bidirectional, the mapping will also be performed if a term is clicked in the BoW chart. In this case, the application will fetch all papers that use this specific term. The next two mappings (see Figure 3b,c) from the paper publications network to the co-authorship and affiliation networks are used to find related authors and affiliations for a clicked paper. The application will map the paper to all authors in the co-authorship network and affiliations that have the paper ID in their list of papers. The last mapping (see Figure 3d) maps an author’s name from the co-authorship network to the affiliation network, thereby enabling the user to find all affiliations a specific author wrote papers for and also to find all authors of a specific affiliation. Currently, our application only discovers matches between attributes with identical values. For instance, the last mapping (see Figure 3d) only finds completely identical strings between the configured attributes of the co-authorship and affiliation network. To be able to support fuzzy matching, we plan to extend the mapping feature in a future version. String similarities and configurable range values for numerical attributes could be used to find and display similar results.
In our example, the latter three attribute mappings (see Figure 3b–d) are defined to specific attributes in the source and target nodes, as the exact attributes, interconnections and relations are already known for these datasets. Alternatively, if the attributes of a newly-imported graph are unknown, it is possible to specify an attribute mapping that tries to find identical attribute values by iterating over all entities and their attributes of a mapped graph or dataset. The mapping in Figure 3a, for instance, implies the paper network without declaring a specific target attribute. In this case, the application will try to match all possible attributes of the target to the specified source attribute. If an attribute can be mapped depends on the type of the source attribute (e.g., nominal or ordinal). The application will only try to map between attributes of the same type.
5. Visualization Approach
Depending on the use case, it is not always possible to merge several heterogeneous networks into one view. For instance, some metabolic networks from the Kyoto Encyclopedia of Genes and Genomes (KEGG) pathway database [33] have a precomputed layout, which is preferred by biologists, but the networks are still connected with each other. In this case, it would be beneficial to have multiple views on the networks and provide a means to navigate the relationships, similar to the approach facilitated by Entourage [5]. In another scenario, multiple networks could be merged into one single network view. The Apolo system [34] uses this technique to make sense of large network data using machine learning and user interaction to find nodes that might be of interest to the user. Our goal was to design a flexible system that can be used for different application areas. We also wanted to be able to visualize additional related multivariate data across the networks. It is possible to show attributes of target nodes directly in a graph visualization, for instance as information wedges at the borders of the visualization [35], but the number of attributes that can be visualized with this technique is limited and not applicable for all possible use cases. Consequently, we decided to use multiple coordinated views together with brushing and linking techniques [36] for our tool.
5.1. Visual Design
Graphs are visualized as interactive node-link views (see Figure 4a), whereas list-based datasets, such as the bag-of-words index, are shown as horizontal bar charts (see Figure 4d,e) due to space efficiency. The distributional similarity dialog (see Figure 4e) displays the most similar terms of a selected word in the related BoW chart. The attribute comparer (see Figure 4f) helps to compare quantitative attributes, such as the BoW values for instance, among a selection of nodes that can be added from any network view by performing a right-click on a node. It also supports sorting of nodes based on a selected attribute. The concrete processing depends on the network type in our case: if a node is added from the affiliation or the co-authorship network, the accumulated value from all papers for that affiliation or author is visualized, whereas a node from the paper network shows the actual BoW or TF-IDF value for that paper directly. If a node in one of the network views or an entry in the charts is hovered with the mouse, all related nodes or entries in all other views are highlighted, which helps to interactively explore the relationships between the datasets.
Node-link visualizations of networks with many thousands of nodes and edges are usually quite cluttered and difficult to explore without further filtering or clustering. To circumvent this issue, we facilitate a bottom-up approach to explore the datasets: when the application is started, all network views are empty, and the BoW/TF-IDF charts show all terms over the complete dataset. Nodes from networks are added into or removed from the views on demand, either by directly searching for a specific node in the node list (see Figure 4g), finding nodes by keywords from the BoW chart or by requesting connected matches from a node in another node-link view. If a network does not already have precomputed node positions, the network views use a force-directed layout from the yFiles library [37]. The layout is calculated whenever new nodes are added to the view and tries to minimize the position changes of already existing nodes in order to preserve the mental map. If necessary, users can adjust the layout settings and select different layout algorithms such as circular or hierarchical graph layouts.
5.2. Hub2Go
In order to perform a bottom-up exploration across interconnected heterogeneous networks and related data views, it is essential to quickly find nodes of interest. Users should also have the option to seamlessly add nodes into a related target network and swiftly go to their location to explore their local neighborhood. Moreover, it should be possible to remove nodes from a search result, if it did not yield interesting information. Depending on the use case, it is also not always feasible to directly show all interconnections to a target node if the node has a high number of interconnections.
To provide a flexible solution for these problems, we introduce the Hub2Go technique. Whenever a search is requested by clicking on a node in a network view or by selecting a term in the BoW or TF-IDF charts, the system represents the search results as Hub2Go instances at the border of the initial network view or chart (see Figure 4h). The hubs show the connections to other datasets: in the context of Figure 4, the user clicked on the paper “Opinion Flow” (marked in red) in the paper network (see Figure 4a) and initialized a search for connected entities in other networks or datasets based on the configured mappings. Three Hub2Go instances show the result: five nodes in the co-authorship network, 1598 terms in the BoW chart and one node in the affiliation network.
To create the concrete network views given in Figure 4, we started by searching for the term “sentiment” in the BoW chart (see Figure 5a). By clicking on the resulting term, the system matches the term over all configured networks and visualizes the result as three Hub2Go instances (see Figure 5b). In this case, the hubs show 34 papers, 166 authors and 21 affiliations that mention this term at least once. Hovering over the blue hub, which is related to the paper network, shows a list of all 34 found papers. Left-clicking the hub adds all nodes from the search result to the target network (see Figure 5c); or removes them, if they are already in the view. Alternatively, users could browse through the list and manually add or remove nodes of interest by left-clicking them. Going back to Figure 4, we also added all matching nodes to the other node-link views using our Hub2Go technique. Additionally, users can perform a right-click on a hub or a node in a hub-list to add all or specific nodes to the attribute comparer. In this case, we added all 34 papers to the attribute comparer (see Figure 4f) by right-clicking on the blue Hub2Go instance, and to analyze the occurrence of related terms among these papers, we also added “sentiment”, “credibility”, “topic”, “opinion”, “position” and “content” to the attribute comparer by right-clicking them in the distributional similarity dialog, which currently shows the most similar terms for the term “sentiment”.
In Figure 4, the user is currently hovering the orange hub, associated with the co-authorship network, with the mouse cursor, which brings up a list with all found authors for the selected paper and also highlights all connected nodes in the other views. Hovering the mouse over a specific item in the hub-list automatically centers the connected target node in the relevant view, enabling the analyst to swiftly explore its local neighborhood. To indicate whether nodes of a search result are already in the view, circles in this list appear green if they are already added to the network view or red if they have not been added to the view. When clicking on a node in a hub list, the neighborhood of this node can optionally also be added to the network view (based on a user setting). This is helpful to quickly find related nodes in the dataset, for instance citations from or to other papers or authors who also wrote other papers together with the initial author of a paper.
6. Use Case
Our analysis goal for the use case described in the following is to discover relationships between papers that cannot be spotted by an analysis of pure metadata, such as the data provided by the visualization publication dataset [23]. For instance, we may want to discover thematic outliers in the paper collection of a specific author and analyze if there are similarities between those outliers and other papers written by the author (or by others). The three network views could also be of variable interest to different users. Students or researchers usually want to explore research results and are interested in the relations between existing papers and authors, whereas libraries or funding organizations might also be interested in co-authorship and the related affiliations to explore the results of an interdisciplinary project.
Let us assume for this use case that a student previously read an interesting paper about “traffic flows” and that the student remembers one of the authors of this paper: “Jarke J. van Wijk”. The student wants to find out more about the author and might also have a few questions related to the paper and wants to use our system to answer them:
- Q1,
- author question: Which words/terms does van Wijk use in his papers? Answering this question would provide the student a first impression about van Wijk’s most important research areas.
- Q2,
- author question: Does he usually focus on the same terms throughout his papers or does he address various different topics, which would indicate a broad research interest?
- Q3,
- paper question: Are there other papers related to the term “traffic_flows” that might be of interest to the student?
- Q4,
- paper question: Considering the term “traffic_flows”: are other terms in other papers used in a similar context, which would make those papers also interesting to the student?
Analysis Step 1:
Aiming to answer Q1, the student first adds the TF-IDF chart to this analysis (see Figure 6g) to get the most important words among selected papers. He/she then activates the co-authorship network view and searches for van Wijk’s name in the search dialog (see Figure 6a) and adds van Wijk’s corresponding author node together with all other nodes of authors who collaborated with him to the egocentric network view (see Figure 6b). After clicking on van Wijk’s node in this view, the system shows four Hub2Go instances (see Figure 6c), which indicate 38 related papers in the paper network (blue), 8 nodes in the affiliation network (terra cotta) and 7245 terms in the BoW (violet) and TF-IDF charts (jade green). The two charts already give the student an overview of all terms used in van Wijk’s papers, thereby answering Q1. Left-clicking on the blue hub adds all papers to the paper network view, and the student also puts all of van Wijk’s affiliations into the affiliation network view (note that in this case, some of the affiliations are actually duplicates with slightly different wording in the visualization publication dataset).
The student could now further explore which terms are used in a specific paper by clicking on its node in the paper network. The student could also explore which of his own (or his co-authors’) papers van Wijk cites in the VIS publication dataset. For doing so, we use a pop-up menu that appears while an interesting node (i.e., a specific paper) is hovered with the mouse in order to add all nodes that are adjacent to the hovered node into the network view. This way, the student is able to easily identify papers that cite or are cited by one of van Wijk’s papers. By using the pop-up menu, he/she could also directly open the IEEE-Xplore link, which is saved in the URL attribute of each node, to take a closer look at the actual papers.
Hovering over a node in the VisPapers view also highlights connected nodes in the other networks, enabling the student to see the authors and affiliations of specific papers. Furthermore, the student could also investigate the co-authorship network and hover over a node to highlight all papers that an author wrote together with van Wijk.
Analysis Step 2:
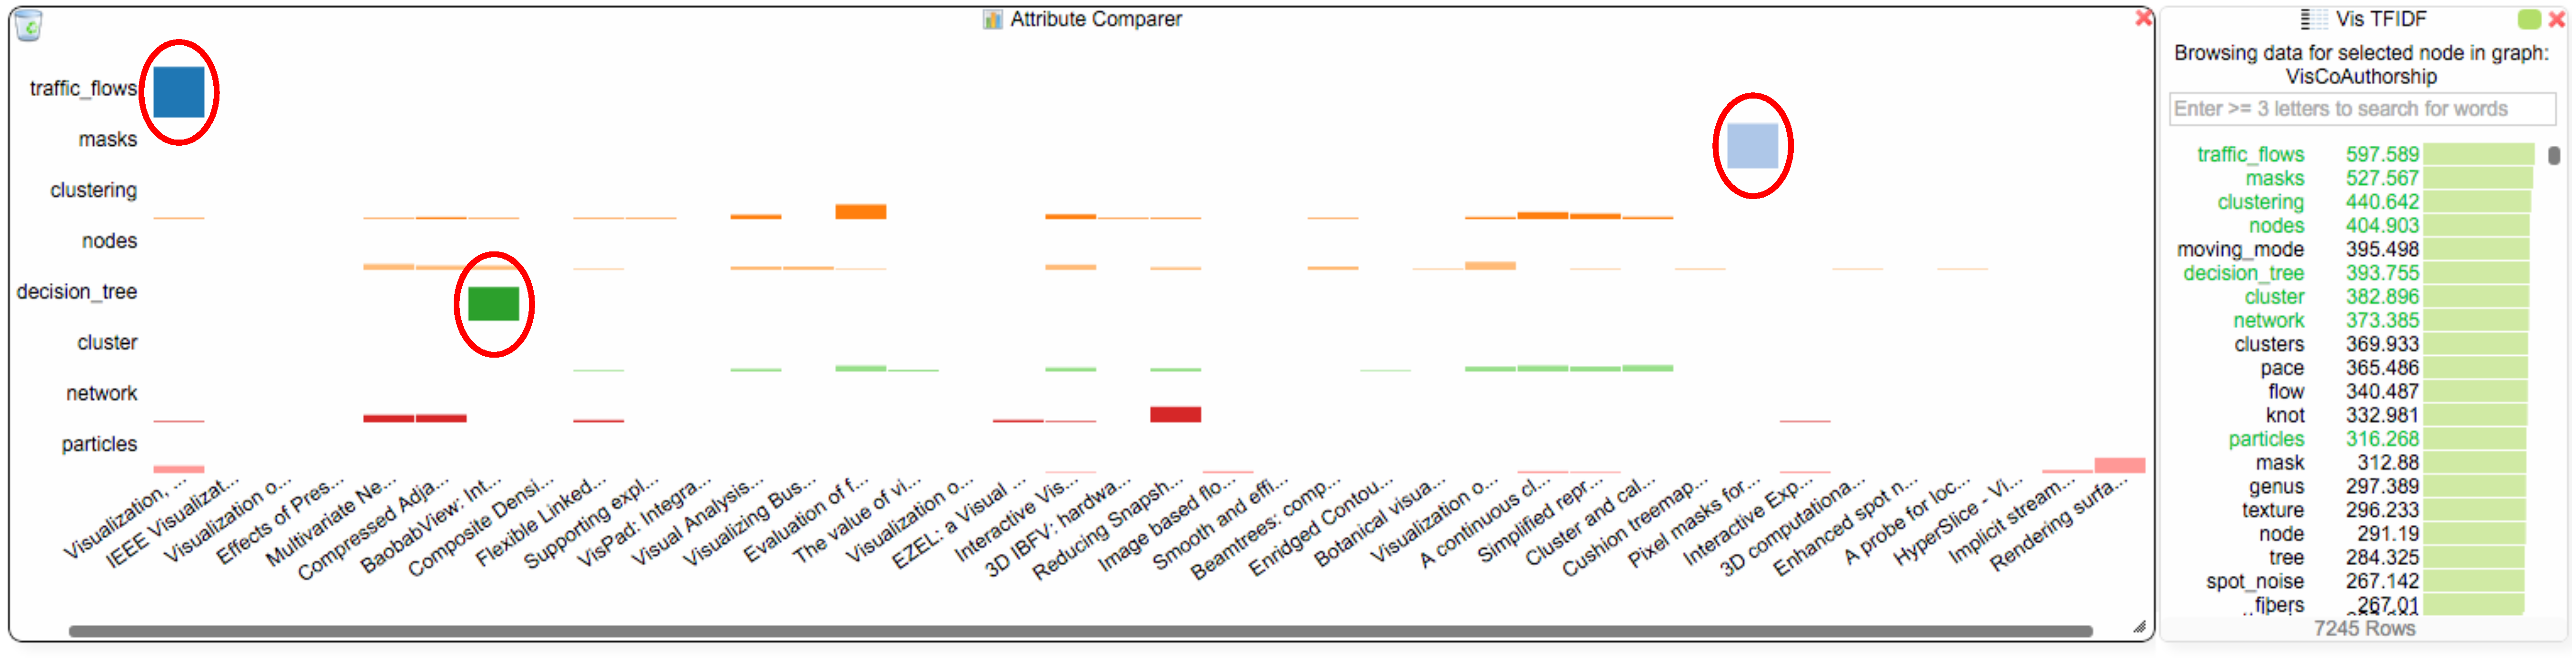
To answer Q2, the student investigates the TF-IDF chart, which shows the terms for all of van Wijk’s papers, as long as his node is selected in the co-authorship network. The student adds eight of van Wijk’s most used/important terms “traffic_flows”, “masks”, “clustering”, “nodes”, “decision_tree”, “cluster”, “network” and “particles” to the attribute comparer (see Figure 7) and right clicks the blue hub in the co-authorship view to also add van Wijk’s papers to the comparer. The student notices that the terms “clustering”, “nodes”, “cluster”, “network” and “particles” are used quite evenly throughout van Wijk’s paper collection. However, the other three terms are interesting outliers: “traffic_flows”, “masks” and “decision_tree” are each uniquely used in three different papers. In this case, the student discovers from the chosen terms that van Wijk addresses similar topics in most of his papers (in the case of the terms that are used evenly), but the three outliers could also indicate a broader research interest. The student could now further investigate and use the paper network view to open the links to the papers, and he/she could also use the TF-IDF chart to get an overview of the other terms that were used in those papers.
Analysis Step 3:
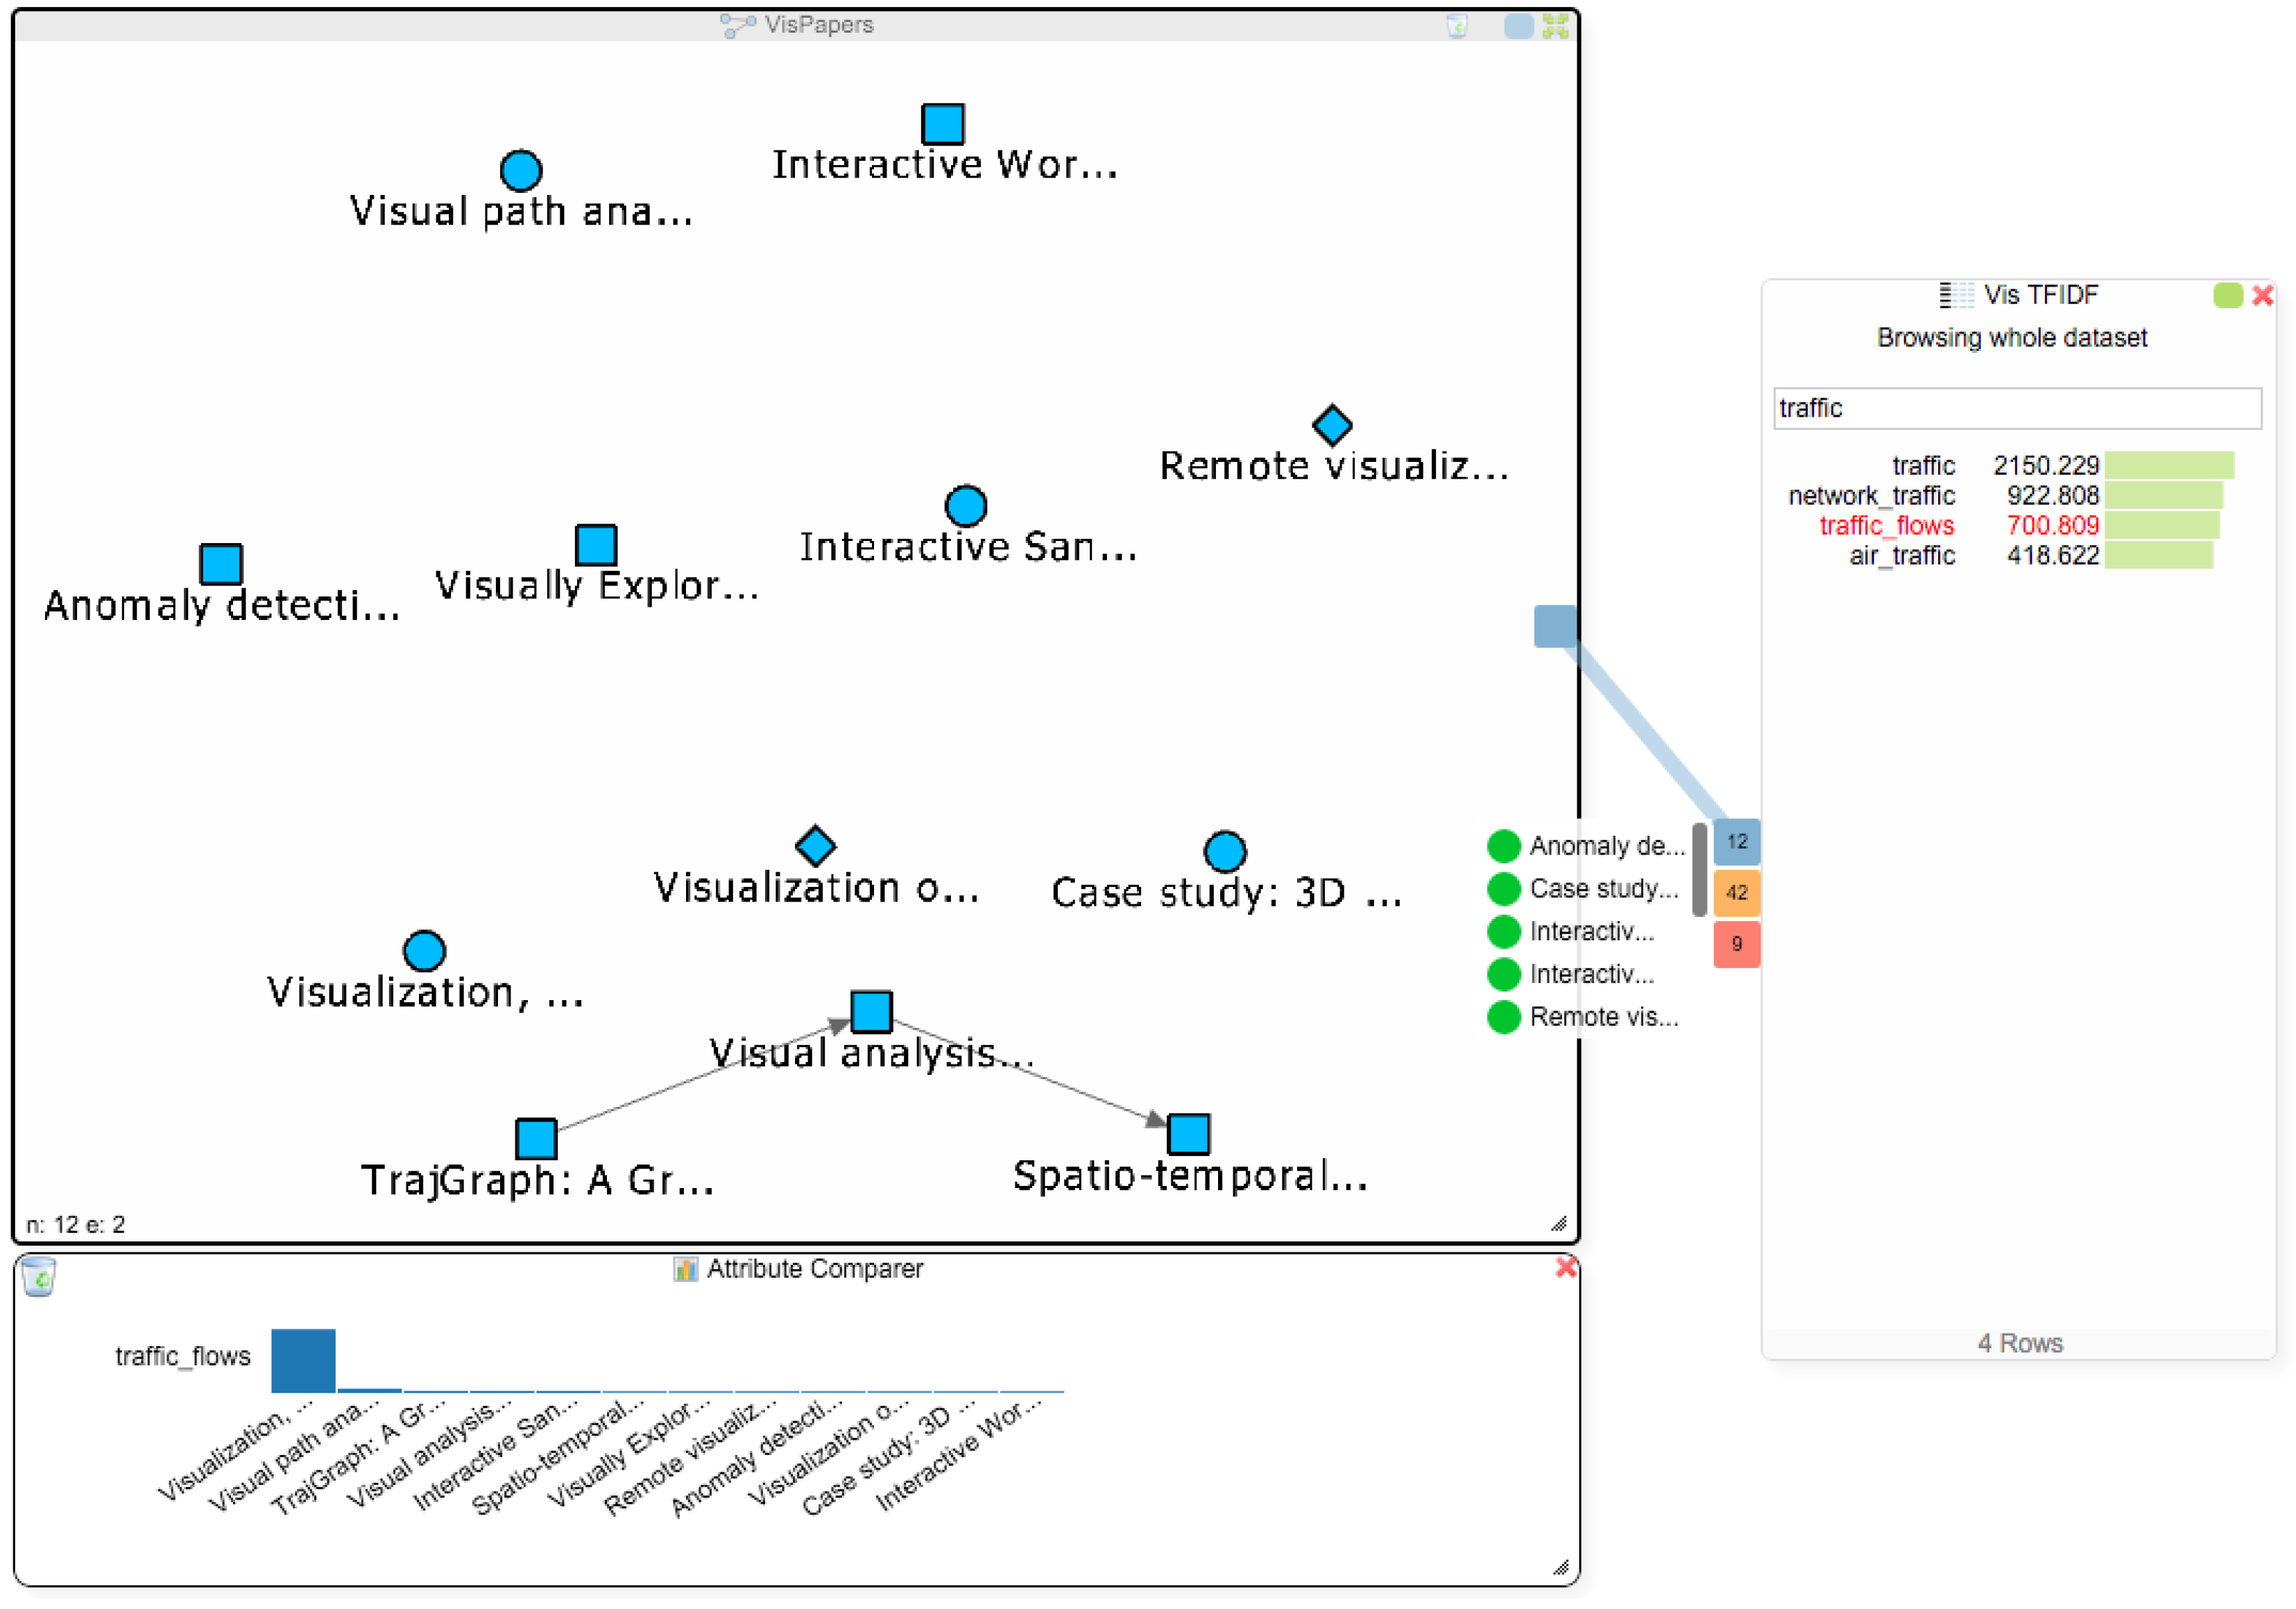
The student now decides to address Q3 and to find more papers about the term “traffic_flows”. Figure 7 already revealed that van Wijk only has one single paper that mentions this term, and searching for the term in the titles of all papers via the node list of the paper network also only reveals van Wijk’s paper. The addition of the BoW and TF-IDF indices makes it possible to search for terms in the data, rather than being limited to searching for keywords in the titles of papers. Therefore, the student can now find all papers that mention some specific term, regardless of whether it is in the title of the paper or not. To see if there are other papers in the dataset that use this term, the student clicks on “traffic_flows” in the TF-IDF chart and gets three Hub2Go instances linking to 12 papers, 42 authors and 9 affiliations (see Figure 8). After clearing the attribute comparer from the previous search queries, the student adds all 12 papers to the paper network and the attribute comparer using the blue hub. Van Wijk’s paper has by far the highest frequency of the term, but the student could now also open the other papers to see if they are relevant for his research.
Analysis Step 4:
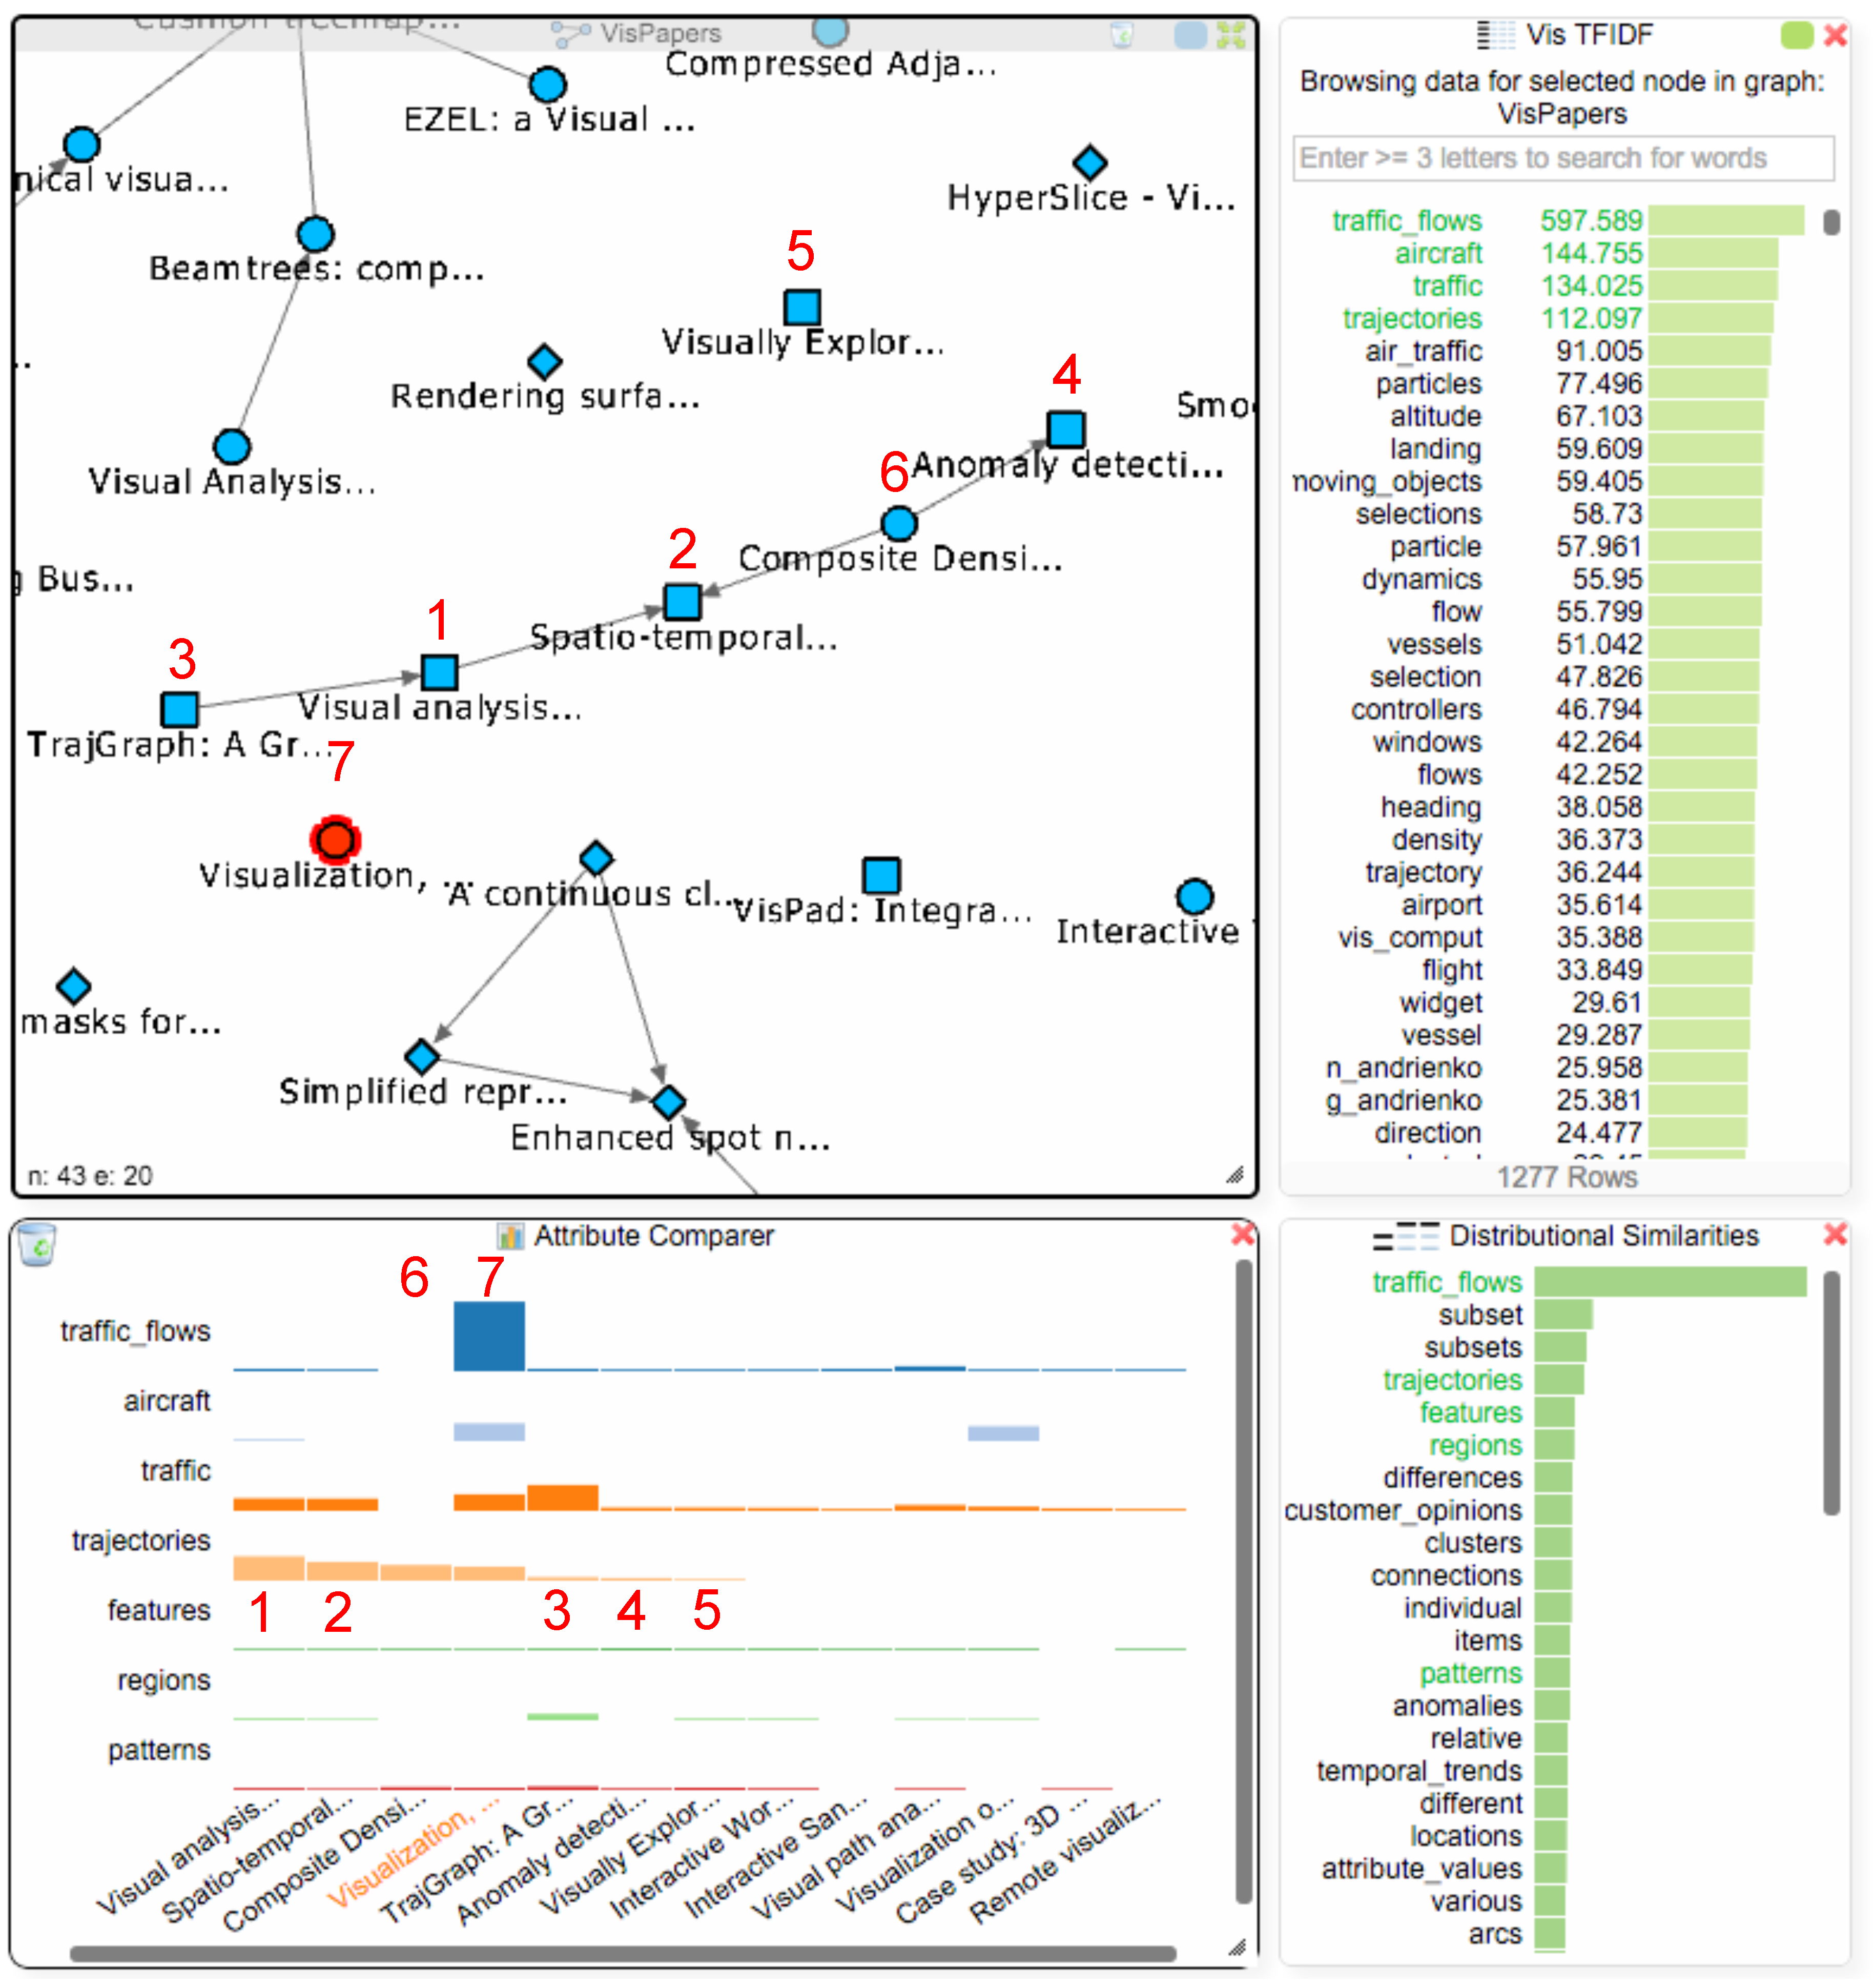
The student can now utilize the TF-IDF (or BoW) values together with the distributional similarities to further investigate these 12 papers and find additional work that might be thematically related to traffic flows, thereby addressing Q4. The student selects van Wijk’s paper in the paper network to get the TF-IDF values for that paper and adds the next three terms with the highest values (“aircraft”, “traffic”, “trajectories”) to the comparer. A well-known issue with keyword search is vocabulary variation (sometimes referred to as the synonymy problem), which means that several different terms can be used to refer to the same thing. In the case of “traffic_flows”, there could be other terms that are also used by researchers to refer to this type of visualization. The student therefore consults the distributional similarities view (see Figure 9), which shows the most similar terms, and identifies four interesting ones “trajectories”, “features”, “regions” and “patterns”, which might be relevant for investigation besides the term “traffic_flows”. The first term from the distributional similarities “trajectories” was already in the TF-IDF chart, which encourages the student to further investigate the papers mentioning this term.
Right-clicking on the term “trajectories” in the attribute comparer orders the papers in the chart based on the TF-IDF values for this term. The student finds five new papers that mention this term (see Figure 9 (1–5) at the bottom in the attribute comparer dialog). They could be of interest, and the student decides to add them into the paper network view that still contains all of van Wijk’s papers. Right-clicking the papers in the attribute comparer adds them to the paper network view: four of these papers (1–4) are actually connected to each other, and one of van Wijk’s papers (see Figure 9(6); “Composite Density Maps for Multivariate Trajectories”) is part of this group, as it cites two papers with the term “trajectories”. Since it does not mention the term “traffic_flows”, it was not added to the attribute comparer in the initial search. To investigate the occurrence of the already selected terms in this paper, the student also adds it to the attribute comparer by right clicking on it in the paper network. The student finds out that the paper also uses the terms “trajectories”, “features” and “patterns”, which suggests that he/she might also take a closer look at this paper.
Note that the distributional similarities encode the similarity of usage in the data rather than some generic (or “objective”) notion of semantic similarity. This means that we will find terms that have been used in the same way in this view. Such similarities may sometimes be somewhat surprising and perhaps even counter-intuitive (in this case the terms “subset” and “subsets” are not related to the initial search term), but are a direct effect of word usage in the data at hand.
7. Discussion
The employment of multiple coordinated views has the advantage that we can explore various interconnected networks at once. This is of course limited to the available screen space. On a 2K desktop resolution, three to four networks in addition to the BoW and distributional similarity charts are a realistic usage scenario (Figure 4 and Figure 6 were taken at a 1900 × 1080 resolution), whereas a 4K resolution offers even more space for additional network views. A higher resolution is essential for bigger document collections, for instance, if users plan to explore the interconnections between various different conference proceedings and would have three or four paper citation networks and not just a single one, as we did in our use case.
Analyzing a bigger text corpus should have a big impact on the performance of the system and the interaction between the views, as all word indices and similarities are calculated beforehand and loaded into the main memory on the OnGraX server. Exploring a larger number of different networks also scales well for realistic use cases. Our mapping system on the server uses multiple parallel threads and can iterate through up to 16 datasets or networks at the same time to find matches. As such, only the highest number of nodes and the number of mapped attributes in a graph have an impact on the performance, and a matching usually runs in time. Additionally, all networks are rendered on the client computer’s GPU by using WebGL [38]. This approach is faster than using the more common SVG-based node-link visualization approaches, and our system provides good scalability for up to 10,000 nodes and edges (depending on the hardware specifications of the client). As we use a bottom up approach and only load nodes into the views on demand, the number of nodes that have to be visualized at once is usually quite small and as such also scales well with bigger networks.
While users can quickly specify new attribute mappings between imported graphs and datasets, this process usually requires some a priori knowledge about the structure and attributes of the data. OnGraX currently only visualizes attributes of a graph or dataset during the creation of a new mapping in the mapping dialog. Our plan is to improve this view to give users more intuitive access to this information.
8. Conclusions
In this work, we presented a system to explore the structure and relations between heterogeneous interconnected networks and additional metadata. The inclusion of large textual information, in the form of both a BoW/TF-IDF index and a word similarity matrix, together with the possibility to map these data across different networks, constitutes a novel contribution in visual text analytics and allows us to extensively explore relations between related papers, authors or affiliations based on selected keywords. Being able to search for terms and semantically similar used words and visualize their usage throughout the complete text corpus can reveal relations between thematically-related documents, which would otherwise not be apparent if an analyst could only search through the titles and keywords of a document collection. Our Hub2Go technique assists users to quickly add (or remove) interconnected nodes in interactive network views and charts and assists in navigating to the locations of these nodes to explore their local network structure. Our system has been developed in close collaboration with NLP experts, and the next step is to assess the usability of our system by performing a user study with a larger document collection. We also plan to make the OnGraX system publicly available in the near future. Due to copyright reasons, we cannot make the whole full text dataset accessible, but the extracted BoW and TF-IDF files, as well as the word similarity matrix are available at the provided URL in the Supplementary Materials.
Supplementary Materials
The following are available online at http://bit.ly/2qS79rw Video S1: Intro Video, Video S2: Use Case, File S3: BoW, TF-IDF and word similarity files for the VIS publication dataset.
Acknowledgments
This work was funded by the StaViCTA (Stance in discourse using Visual and Computational Text Analytics) project, framework grant “The Digitized Society – Past, Present, and Future” with No. 2012-5659 from the Swedish Research Council (Vetenskapsrådet).
Author Contributions
Björn Zimmer and Andreas Kerren conceived of and designed the solution. Björn Zimmer implemented the software. Björn Zimmer and Magnus Sahlgren analyzed and preprocessed the data. Magnus Sahlgren contributed critical advice for the use case. Björn Zimmer, Magnus Sahlgren and Andreas Kerren wrote the paper.
Conflicts of Interest
The authors declare no conflict of interest.
References
- IEEE VIS. IEEE Visualization Conference (VIS). Available online: http://ieeevis.org. (accessed on 9 May 2017).
- Kerren, A.; Purchase, H.; Ward, M.O. Multivariate Network Visualization; Lecture Notes in Computer Science; Springer: Berlin, Germany, 2014. [Google Scholar]
- von Landesberger, T.; Kuijper, A.; Schreck, T.; Kohlhammer, J.; van Wijk, J.; Fekete, J.D.; Fellner, D. Visual Analysis of Large Graphs: State-of-the-Art and Future Research Challenges. Comput. Gr. Forum 2011, 30, 1719–1749. [Google Scholar] [CrossRef]
- Lex, A.; Streit, M.; Kruijff, E.; Schmalstieg, D. Caleydo: Design and Evaluation of a Visual Analysis Framework for Gene Expression Data in its Biological Context. In Proceedings of the 3rd IEEE Pacific Visualization Symposium, IEEE, PacificVis ’10, Taipei, Taiwan, 2–5 March 2010; pp. 57–64. [Google Scholar]
- Lex, A.; Partl, C.; Kalkofen, D.; Streit, M.; Gratzl, S.; Wassermann, A.M.; Schmalstieg, D.; Pfister, H. Entourage: Visualizing Relationships between Biological Pathways Using Contextual Subsets. IEEE Trans. Vis. Comput. Gr. 2013, 19, 2536–2545. [Google Scholar] [CrossRef] [PubMed]
- May, T.; Steiger, M.; Davey, J.; Kohlhammer, J. Using Signposts for Navigation in Large Graphs. Comput. Gr. Forum 2012, 31, 985–994. [Google Scholar] [CrossRef]
- Henry, N.; Fekete, J.D.; McGuffin, M.J. NodeTrix: A Hybrid Visualization of Social Networks. IEEE Trans. Vis. Comput. Gr. 2007, 13, 1302–1309. [Google Scholar] [CrossRef] [PubMed]
- Moscovich, T.; Chevalier, F.; Henry, N.; Pietriga, E.; Fekete, J.D. Topology-Aware Navigation in Large Networks. In Proceedings of the SIGCHI Conference on Human Factors in Computing Systems, Boston, MA, USA, 4–9 April 2009; pp. 2319–2328. [Google Scholar]
- Heer, J.; Perer, A. Orion: A System for Modeling, Transformation and Visualization of Multidimensional Heterogeneous Networks. Inf. Vis. 2012, 13, 111–133. [Google Scholar] [CrossRef]
- Liu, Z.; Navathe, S.B.; Stasko, J.T. Ploceus: Modeling, Visualizing, and Analyzing Tabular Data as Networks. Inf. Vis. 2014, 13, 59–89. [Google Scholar] [CrossRef]
- Kucher, K.; Kerren, A. Text Visualization Techniques: Taxonomy, Visual Survey, and Community Insights. In Proceedings of the 8th IEEE Pacific Visualization Symposium, 2015, PacificVis ’15, Hangzhou, China, 14–17 April 2015; pp. 117–121. [Google Scholar]
- Federico, P.; Heimerl, F.; Koch, S.; Miksch, S. A Survey on Visual Approaches for Analyzing Scientific Literature and Patents. IEEE Trans. Vis. Comput. Gr. 2016. [Google Scholar] [CrossRef] [PubMed]
- Görg, C.; Liu, Z.; Kihm, J.; Choo, J.; Park, H.; Stasko, J. Combining Computational Analyses and Interactive Visualization for Document Exploration and Sensemaking in Jigsaw. IEEE Trans. Vis. Comput. Gr. 2013, 19, 1646–1663. [Google Scholar] [CrossRef]
- Shen, Z.; Ogawa, M.; Teoh, S.T.; Ma, K.L. BiblioViz: A System for Visualizing Bibliography Information. In Proceedings of the 2006 Asia-Pacific Symposium on Information Visualisation, Tokyo, Japan, 1–3 February 2006; Volume 60, pp. 93–102. [Google Scholar]
- Zhao, J.; Collins, C.; Chevalier, F.; Balakrishnan, R. Interactive Exploration of Implicit and Explicit Relations in Faceted Datasets. IEEE Trans. Vis. Comput. Gr. 2013, 19, 2080–2089. [Google Scholar] [CrossRef] [PubMed]
- Van Ham, F.; Wattenberg, M.; Viegas, F.B. Mapping Text with Phrase Nets. IEEE Trans. Vis. Comput. Gr. 2009, 15, 1169–1176. [Google Scholar] [CrossRef] [PubMed]
- Kairam, S.; Riche, N.H.; Drucker, S.; Fernandez, R.; Heer, J. Refinery: Visual Exploration of Large, Heterogeneous Networks through Associative Browsing. Comput. Gr. Forum 2015, 34, 301–310. [Google Scholar] [CrossRef]
- Chen, F.; Chiu, P.; Lim, S. Topic Modeling of Document Metadata for Visualizing Collaborations over Time. In Proceedings of the 21st International Conference on Intelligent User Interfaces, Sonoma, CA, USA, 7–10 March 2016; pp. 108–117. [Google Scholar]
- Liu, S.; Chen, Y.; Wei, H.; Yang, J.; Zhou, K.; Drucker, S.M. Exploring Topical Lead-Lag across Corpora. IEEE Trans. Knowl. Data Eng. 2015, 27, 115–129. [Google Scholar] [CrossRef]
- Heimerl, F.; Han, Q.; Koch, S.; Ertl, T. CiteRivers: Visual Analytics of Citation Patterns. IEEE Trans. Vis. Comput. Gr. 2016, 22, 190–199. [Google Scholar] [CrossRef] [PubMed]
- Zimmer, B.; Kerren, A. Harnessing WebGL and WebSockets for a Web-Based Collaborative Graph Exploration Tool. In Proceedings of the 15th International Conference on Web Engineering, Rotterdam, The Netherlands, 23–26 June 2015; pp. 583–598. [Google Scholar]
- Zimmer, B.; Kerren, A. OnGraX: A Web-Based System for the Collaborative Visual Analysis of Graphs. J. Graph Algorithms Appl. 2017, 21, 5–27. [Google Scholar] [CrossRef]
- Isenberg, P.; Heimerl, F.; Koch, S.; Isenberg, T.; Xu, P.; Stolper, C.; Sedlmair, M.; Chen, J.; Möller, T.; Stasko, J. Visualization Publication Dataset, 2015. Available online: http://www.vispubdata.org/ (accessed on 9 May 2017).
- Chuang, J.; Manning, C.D.; Heer, J. Without the Clutter of Unimportant Words: Descriptive Keyphrases for Text Visualization. ACM Trans. Comput.-Hum. Interact. 2012, 19, 1–29. [Google Scholar] [CrossRef]
- Turney, P.D.; Pantel, P. From Frequency to Meaning: Vector Space Models of Semantics. J. Artif. Intell. Res. 2010, 37, 141–188. [Google Scholar]
- Turian, J.; Ratinov, L.; Bengio, Y. Word Representations: A Simple and General Method for Semi-supervised Learning. In Proceedings of the 48th Annual Meeting of the Association for Computational Linguistics. Association for Computational Linguistics, Uppsala, Sweden, 11–16 July 2010; pp. 384–394. [Google Scholar]
- Mikolov, T.; Sutskever, I.; Chen, K.; Corrado, G.S.; Dean, J. Distributed Representations of Words and Phrases and their Compositionality. In Proceedings of the Neural Information Processing Systems Conference, Lake Tahoe, Nevada, USA, 5–10 December 2013; pp. 3111–3119. [Google Scholar]
- Pennington, J.; Socher, R.; Manning, C.D. GloVe: Global Vectors for Word Representation. In Proceedings of the 2014 Conference on Empirical Methods in Natural Language Processing, Dohar, Qatar, 25–29 October 2014; pp. 1532–1543. [Google Scholar]
- Kanerva, P.; Kristofersson, J.; Holst, A. Random Indexing of Text Samples for Latent Semantic Analysis. In Proceedings of the 22nd Annual Conference of the Cognitive Science Society, Cognitive Science Society, Philadelphia, PA, USA, 13–15 August 2000; p. 1036. [Google Scholar]
- Sahlgren, M.; Holst, A.; Kanerva, P. Permutations as a Means to Encode Order in Word Space. In Proceedings of the 30th Annual Conference of the Cognitive Science Society. Cognitive Science Society, Washington, DC, USA, 23–26 July 2008; pp. 1300–1305. [Google Scholar]
- Sahlgren, M.; Gyllensten, A.C.; Espinoza, F.; Hamfors, O.; Holst, A.; Karlgren, J.; Olsson, F.; Persson, P.; Viswanathan, A. The Gavagai Living Lexicon. In Proceedings of the 10th International Conference on Language Resources and Evaluation, Portorož, Slovenia, 23–28 May 2016; pp. 344–350. [Google Scholar]
- Harrower, M.; Brewer, C.A. ColorBrewer.org: An Online Tool for Selecting Colour Schemes for Maps. Cartogr. J. 2003, 40, 27–37. [Google Scholar] [CrossRef]
- Laboratories, K. KEGG: Kyoto Encyclopedia of Genes and Genomes. Available online: http://www.genome.jp/kegg/ (accessed on 9 May 2017).
- Chau, D.H.; Kittur, A.; Hong, J.I.; Faloutsos, C. Apolo: Making Sense of Large Network Data by Combining Rich User Interaction and Machine Learning. In Proceedings of the SIGCHI Conference on Human Factors in Computing Systems, Vancouver, BC, Canada, 7–12 May 2011; pp. 167–176. [Google Scholar]
- Gladisch, S.; Schumann, H.; Tominski, C. Navigation Recommendations for Exploring Hierarchical Graphs. In Proceedings of the 9th International Symposium on Advances in Visual Computing, Part II, Crete, Greece, 29–31 July 2013; pp. 36–47. [Google Scholar]
- Roberts, J.C. State of the Art: Coordinated & Multiple Views in Exploratory Visualization. In Proceedings of the Fifth International Conference on Coordinated and Multiple Views in Exploratory Visualization, Zürich, Switzerland, 2 July 2007; pp. 61–71. [Google Scholar]
- yWorks. yFiles for Java. Available online: https://www.yworks.com/products/yfiles-for-java. (accessed on 9 May 2017).
- Khronos Group. WebGL Specification. Editor’s Draft 24 February 2017. Available online: http://www.khronos.org/registry/webgl/specs/latest (accessed on 9 May 2017).
Figure 1.
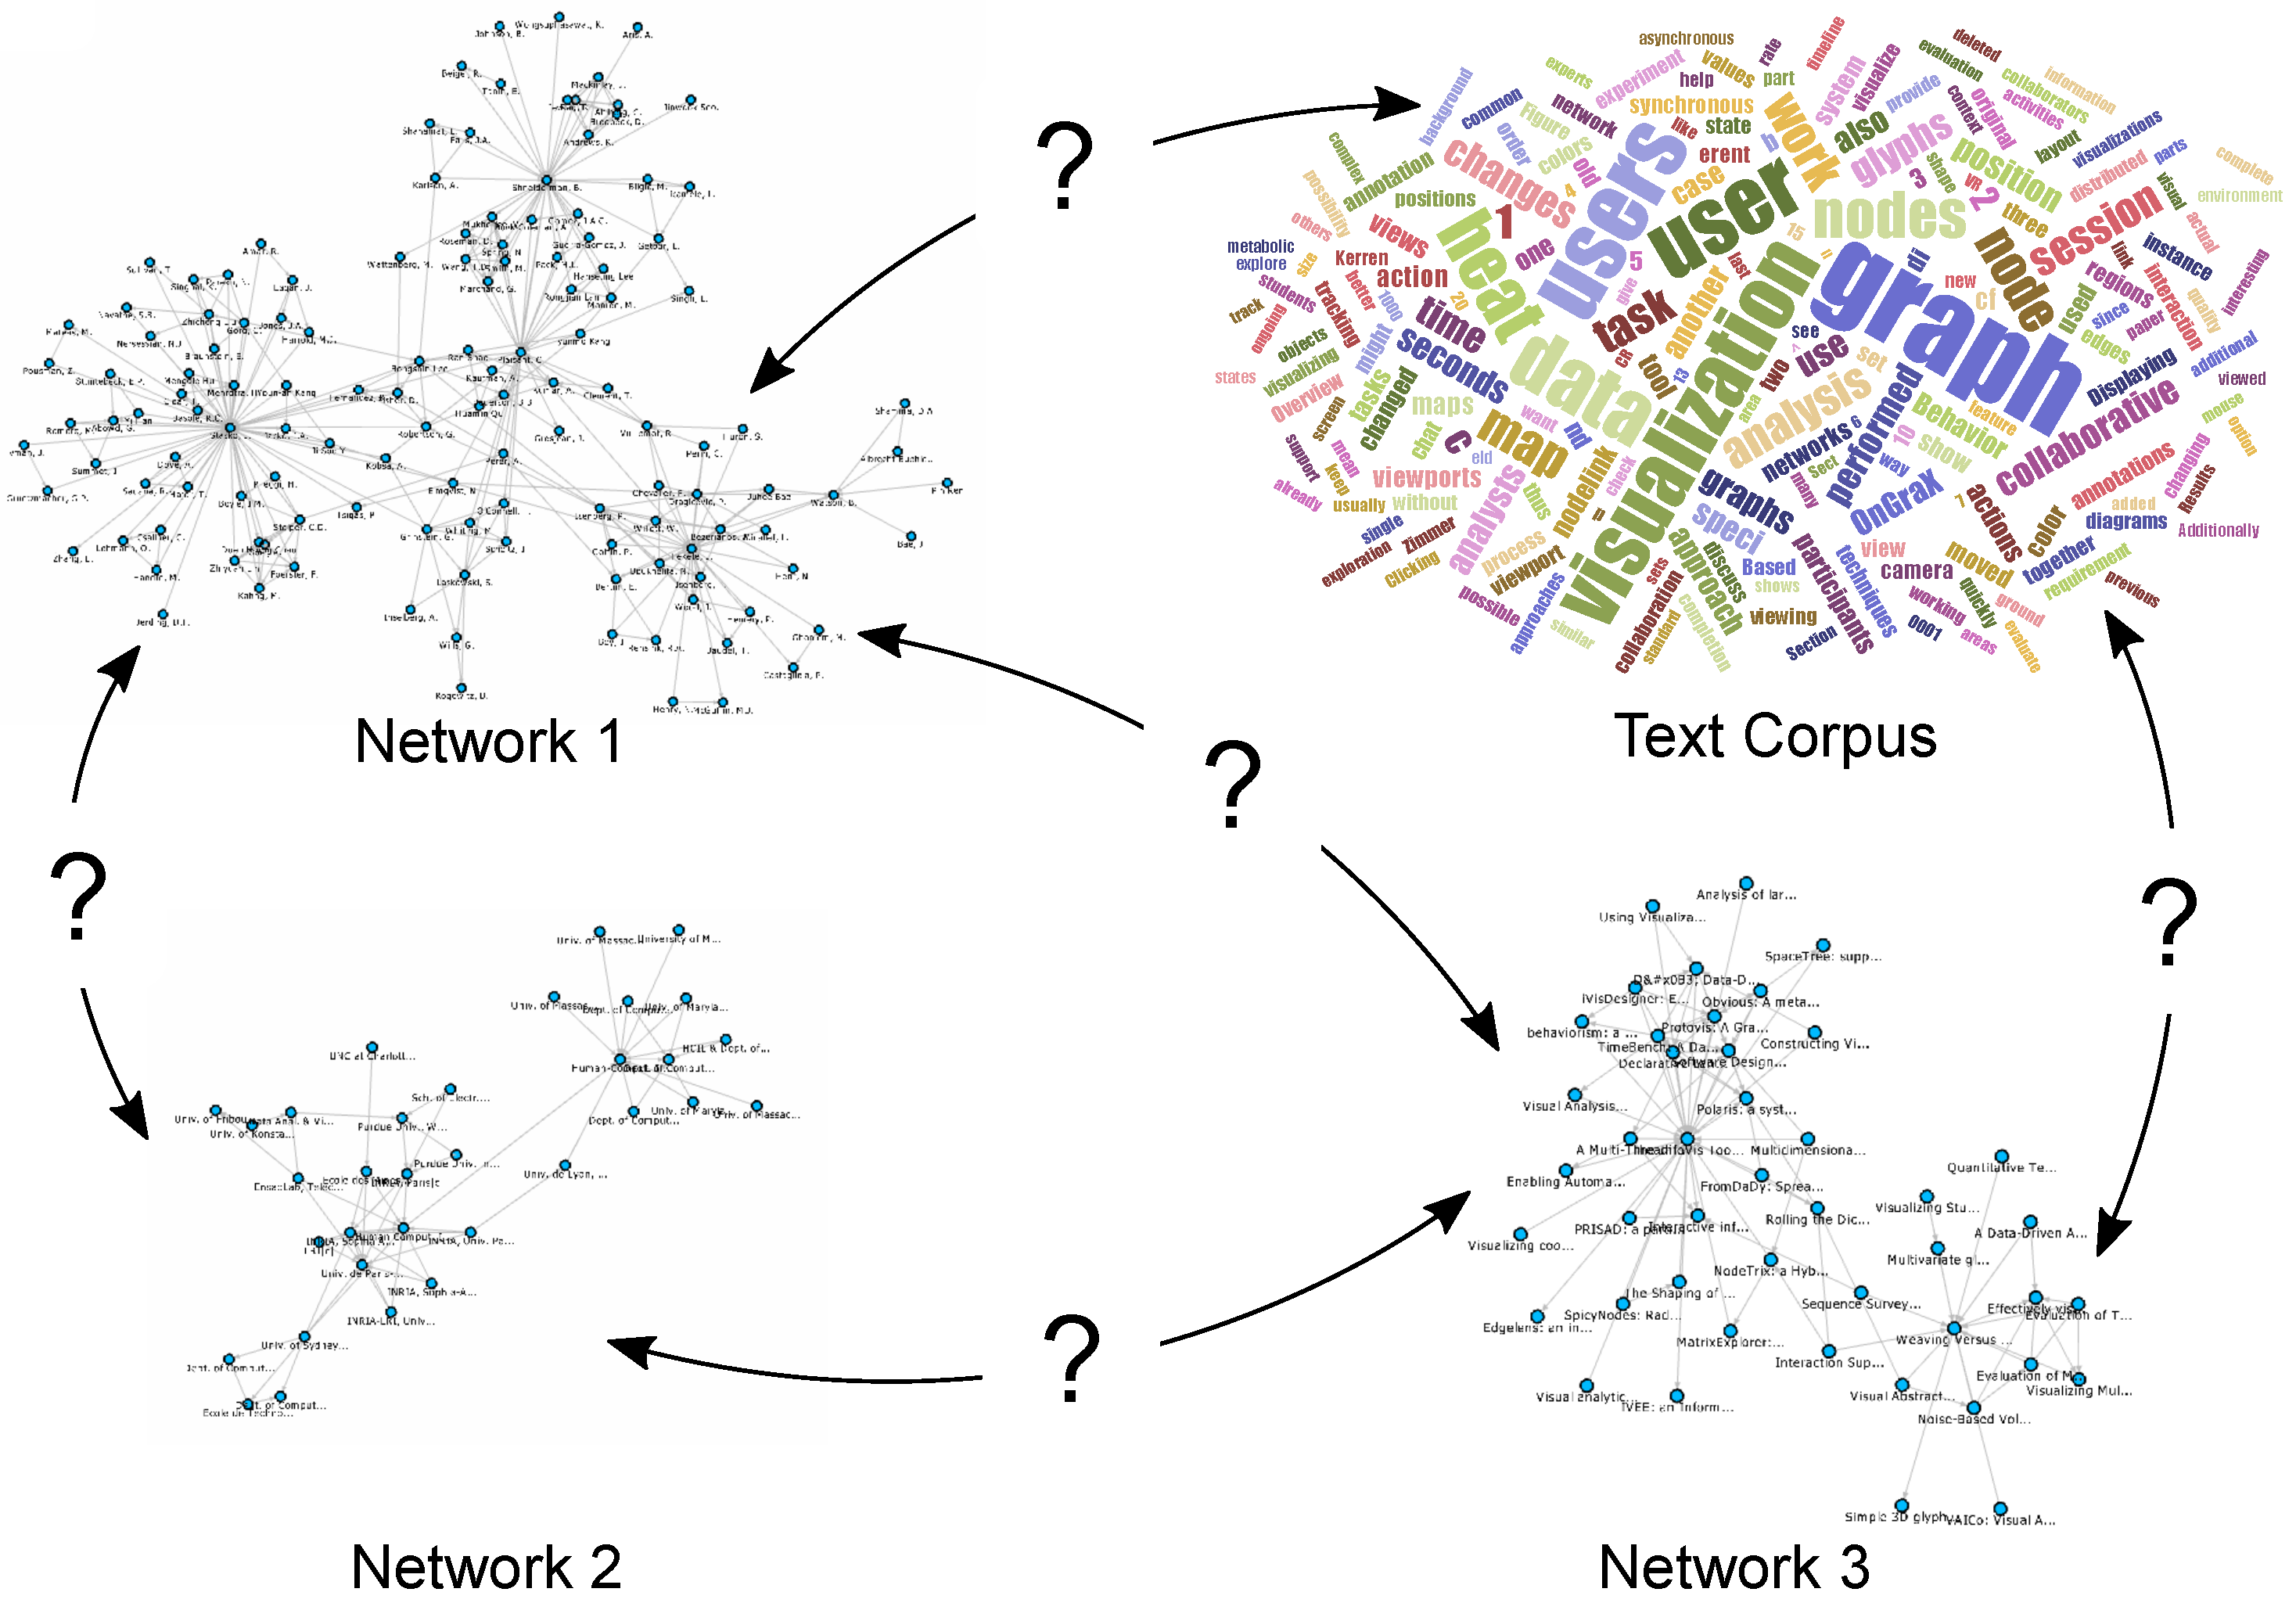
Different networks and datasets can be interconnected with each other, but these connections may not be immediately apparent. How can users visualize and explore them interactively?
Figure 1.
Different networks and datasets can be interconnected with each other, but these connections may not be immediately apparent. How can users visualize and explore them interactively?

Figure 2.
Overview of our dataset: all networks, node attributes and edge types were taken from the visualization publication dataset, with additional textual data derived from all papers in the IEEE Visualization Conference proceedings.
Figure 2.
Overview of our dataset: all networks, node attributes and edge types were taken from the visualization publication dataset, with additional textual data derived from all papers in the IEEE Visualization Conference proceedings.

Figure 3.
The dialog to configure the mapping between graphs and datasets. This figure shows four configured mappings between three networks and the BoW index.
Figure 3.
The dialog to configure the mapping between graphs and datasets. This figure shows four configured mappings between three networks and the BoW index.

Figure 4.
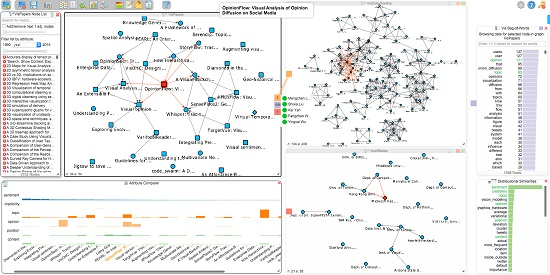
An analysis session in progress. Here, a mapping between a paper citation network (a), a co-authorship network (b) and an affiliation network (c) is explored. The bag-of-words chart (d) shows all terms for the currently-selected paper in the paper network, and the chart at (e) shows terms used in a similar context as the word “sentiment” throughout the complete text corpus of the IEEE conference proceedings. The attribute comparer (f) visualizes the occurrence of six terms over a selection of papers. The dialog at (g) contains the complete list of nodes for the active network that the user is currently exploring; in this case, the paper network. The three colored rectangles at (h) realize our interactive Hub2Go, which currently indicates matches from the paper “Opinion Flow”, which is selected in the paper network, to three other networks or datasets. The small rectangles at the top right of the three network views and the bag-of-words chart (marked with red arrows) represent the colors used for the Hub2Go instances (h) to indicate matches across networks and datasets.
Figure 4.
An analysis session in progress. Here, a mapping between a paper citation network (a), a co-authorship network (b) and an affiliation network (c) is explored. The bag-of-words chart (d) shows all terms for the currently-selected paper in the paper network, and the chart at (e) shows terms used in a similar context as the word “sentiment” throughout the complete text corpus of the IEEE conference proceedings. The attribute comparer (f) visualizes the occurrence of six terms over a selection of papers. The dialog at (g) contains the complete list of nodes for the active network that the user is currently exploring; in this case, the paper network. The three colored rectangles at (h) realize our interactive Hub2Go, which currently indicates matches from the paper “Opinion Flow”, which is selected in the paper network, to three other networks or datasets. The small rectangles at the top right of the three network views and the bag-of-words chart (marked with red arrows) represent the colors used for the Hub2Go instances (h) to indicate matches across networks and datasets.

Figure 5.
Usage of the Hub2Go instances: The user searched for the term “sentiment” in the BoW chart (a) and clicked on it. The resulting matches across the networks are shown as three Hub2Go instances at the border of the dialog (b). Hovering the blue hub shows a scrollable list with all related papers. Clicking the hub adds all papers to the paper network view (c).

Figure 6.
After searching for the author “Jarke J. van Wijk” in the node dialog (a), adding his corresponding node and all of his co-authors to the co-authorship network (b) and performing a matching over all graphs and datasets (c), the system also allows the exploration of all of van Wijk’s papers (e), affiliations (f) and the terms he used throughout his papers with the help of the TF-IDF(g) and BoW (h) charts. The attribute comparer (d) shows TF-IDF values of van Wijk’s papers for eight chosen terms, which are marked in green in the TF-IDF chart. Currently, the paper “Visualization, Selection, and Analysis of Traffic Flows” has been selected in the VisPapers and Attribute Comparer views.

Figure 7.
Distribution of eight selected terms in van Wijk’s papers. The terms “traffic_flows”, “masks” and “decision_tree” (marked by red ellipsoids) are each uniquely used in different papers.
Figure 7.
Distribution of eight selected terms in van Wijk’s papers. The terms “traffic_flows”, “masks” and “decision_tree” (marked by red ellipsoids) are each uniquely used in different papers.

Figure 8.
The network view shows all papers mentioning the term “traffic_flows”. The attribute comparer shows the distribution of that term among the papers.
Figure 8.
The network view shows all papers mentioning the term “traffic_flows”. The attribute comparer shows the distribution of that term among the papers.

Figure 9.
The TF-IDF chart now shows all values for the same focus paper ((7); currently selected in the paper network view) as in Figure 6. Adding all papers mentioning the term “traffic_flows” together with six related terms from the TF-IDF chart and the distributional similarities to the attribute comparer reveals five potentially interesting papers (1–5), which we added to van Wijk’s initial paper network view. Four of these papers are connected due to citations, and one of van Wijk’s papers (6) is also part of the resulting group.

© 2017 by the authors. Licensee MDPI, Basel, Switzerland. This article is an open access article distributed under the terms and conditions of the Creative Commons Attribution (CC BY) license (http://creativecommons.org/licenses/by/4.0/).
Share and Cite
MDPI and ACS Style
Zimmer, B.; Sahlgren, M.; Kerren, A. Visual Analysis of Relationships between Heterogeneous Networks and Texts: An Application on the IEEE VIS Publication Dataset. Informatics 2017, 4, 11. https://doi.org/10.3390/informatics4020011
AMA Style
Zimmer B, Sahlgren M, Kerren A. Visual Analysis of Relationships between Heterogeneous Networks and Texts: An Application on the IEEE VIS Publication Dataset. Informatics. 2017; 4(2):11. https://doi.org/10.3390/informatics4020011
Chicago/Turabian StyleZimmer, Björn, Magnus Sahlgren, and Andreas Kerren. 2017. "Visual Analysis of Relationships between Heterogeneous Networks and Texts: An Application on the IEEE VIS Publication Dataset" Informatics 4, no. 2: 11. https://doi.org/10.3390/informatics4020011
Note that from the first issue of 2016, this journal uses article numbers instead of page numbers. See further details here.