
AI-Based Smart Sensing and AR for Gait Rehabilitation Assessment
by
 , , , and
João Monge
1,2,† ,
,
Gonçalo Ribeiro
1,2,† ,
,
António Raimundo
1,2 ,
,
Octavian Postolache
1,2,* and
Joel Santos
1,2 1
Instituto de Telecomunicações (IT), Instituto Superior Técnico, North Tower, 10th Floor, Av. Rovisco Pais 1, 1049-001 Lisbon, Portugal
2
Department of Information Science and Technology, Iscte—Instituto Universitário de Lisboa, Av. das Forças Armadas, 1649-026 Lisbon, Portugal
*
Author to whom correspondence should be addressed.
†
These authors contributed equally to this work.
Information 2023, 14(7), 355; https://doi.org/10.3390/info14070355
Submission received: 1 May 2023
/
Revised: 18 June 2023
/
Accepted: 19 June 2023
/
Published: 22 June 2023
(This article belongs to the Section Information Applications)
Abstract
:Health monitoring is crucial in hospitals and rehabilitation centers. Challenges can affect the reliability and accuracy of health data. Human error, patient compliance concerns, time, money, technology, and environmental factors might cause these issues. In order to improve patient care, healthcare providers must address these challenges. We propose a non-intrusive smart sensing system that uses a SensFloor smart carpet and an inertial measurement unit (IMU) wearable sensor on the user’s back to monitor position and gait characteristics. Furthermore, we implemented machine learning (ML) algorithms to analyze the data collected from the SensFloor and IMU sensors. The system generates real-time data that are stored in the cloud and are accessible to physical therapists and patients. Additionally, the system’s real-time dashboards provide a comprehensive analysis of the user’s gait and balance, enabling personalized training plans with tailored exercises and better rehabilitation outcomes. Using non-invasive smart sensing technology, our proposed solution enables healthcare facilities to monitor patients’ health and enhance their physical rehabilitation plans.
1. Introduction
The rise in global average life expectancy presents a two-fold challenge: an increased demand for ongoing health monitoring and a strain on smaller, resource-limited medical facilities [1]. These institutions often depend heavily on healthcare professionals for manual patient monitoring, encompassing health status, position, and medical history. This reliance increases workload and introduces potential errors, which could be detrimental to patient care.
Emerging technologies offer a promising solution to these challenges. Internet of Things (IoT) networks and ambient assisted living (AAL) systems have made significant strides in personal healthcare monitoring [2]. When designed with a non-intrusive approach, these systems tend to find greater acceptance and integration [3]. Wearable technology, sensors, and virtual reality (VR) are further expanding the horizons of healthcare, transforming its delivery and potentially improving patient outcomes [4].
Physical rehabilitation, a crucial component of healthcare, is witnessing substantial benefits from these technological advancements. Tech-supported interventions have demonstrated increased effectiveness, efficiency, and patient-centered improvements [5]. In particular, smart sensing technology, which harnesses the power of sensors, data analytics, and machine learning, is proving to be a game-changer, significantly enhancing patient outcomes across various healthcare settings [6,7,8].
However, it is important to acknowledge the challenges that physical rehabilitation encounters. Psychological factors, such as depression and motivation deficits, can significantly impact the efficacy of physical rehabilitation [9,10]. To combat these issues, technologies like serious games, augmented reality (AR), and mixed reality (MR) are being introduced into the realm of physical rehabilitation. These technologies aim to boost patient motivation and engagement, thereby improving rehabilitation outcomes [5,11,12].
The advent of artificial intelligence (AI) heralds a new era in healthcare. AI’s ability to rapidly and accurately analyze vast amounts of data aids in precision decision-making, potentially leading to improved patient outcomes [13,14,15]. This work proposes an innovative system that merges AI and IoT, leveraging smart sensor data fusion to classify user equilibrium. The system comprises a SensFloor® smart carpet and an ESP32 microcontroller-based inertial measurement unit (IMU) and is designed to facilitate physical rehabilitation in a more precise and personalized manner.
The motivation for this research is the recognized need for an improved, precise, and non-invasive approach to gait rehabilitation assessment. Traditional methodologies frequently rely on manual observation, which can lead to inaccuracies and the inability to provide comprehensive real-time data. The novel AI-based smart sensing and AR system proposed herein directly addresses these shortcomings by providing a non-invasive and efficient means of monitoring and analyzing patients’ gait characteristics. This vital information is accessible to both physical therapists and patients.
Furthermore, this study introduces a unique data fusion approach, combining the data from the SensFloor® carpet and the IMU sensor, which allows for a more comprehensive and accurate assessment of gait and balance disorders compared to existing methods. The specific machine learning methods employed in the system further enhance the analysis and classification of user equilibrium.
The goals of this study are to develop this novel system, evaluate its efficacy, and demonstrate its potential to revolutionize patient care by facilitating personalized training plans and improving rehabilitation outcomes.
This article is structured as follows: Section 2 reviews related works in this domain. Section 3 details the developed system, including its SensFloor® and IMU sensors, as well as the AI algorithms employed for gait classification. Section 4 outlines how this solution can be effectively applied in a physical rehabilitation context. Section 4 shares experimental results and further discussion, and Section 5 concludes with future perspectives.
2. Related Work
This section discusses the technologies used in physical rehabilitation. Additionally, there is emphasis on the application of AI and smart sensing in healthcare, particularly recurrent neural networks (RNNs), long short-term memory networks (LSTMs), and gated recurrent unit networks (GRUs).
2.1. Background
Health monitoring forms a critical component of patient care in hospitals and rehabilitation centers. Access to accurate and reliable health data is paramount to ensure effective diagnosis, treatment, and rehabilitation. Unfortunately, there are a multitude of challenges that can compromise the integrity of these data. These challenges may arise from human error, patient compliance concerns, time constraints, financial limitations, technological issues, and environmental factors. To provide optimal care for their patients, healthcare providers must address these challenges head-on.
One way to overcome these challenges is through the adoption of non-intrusive smart sensing systems. These systems leverage cutting-edge technologies such as smart carpets and wearable sensors to monitor various health parameters, including position and gait characteristics. This approach minimizes human error and maximizes patient compliance by providing a non-intrusive and convenient method for health monitoring.
The use of ambient assistive living (AAL) technologies incorporating Internet of Things (IoT) and artificial intelligence (AI) holds great potential in healthcare. These technologies offer intelligent learning and support systems that can enhance patient care, improve outcomes, and promote independence. By leveraging smart buildings and wearable devices, healthcare providers can monitor patients remotely, collect real-time health data, and analyze the data using machine learning algorithms. This allows for early detection of health issues, personalized treatment plans, and timely interventions. AAL technologies also provide non-intrusive and convenient methods for health monitoring, reducing the burden on caregivers and maximizing patient compliance. With the ability to analyze patterns and insights from collected data, these technologies enable more informed decision-making and facilitate collaborative approaches to patient care. By integrating AAL technologies into healthcare systems, the quality of care can be enhanced, leading to improved patient outcomes and increased efficiency in healthcare delivery [16].
In addition to real-time monitoring, these smart sensing systems often incorporate machine learning (ML) algorithms to analyze the collected data. This allows the systems to uncover patterns and insights that may not be readily apparent, thus enhancing the value of the health data. The analyzed data can then be stored in the cloud where they are easily accessible to both physical therapists and patients. This facilitates a collaborative approach to patient care in which both the healthcare provider and the patient are kept informed and can actively participate in the treatment and rehabilitation process.
Furthermore, real-time dashboards provide a comprehensive analysis of the user’s gait and balance. This information is crucial for developing personalized training plans with tailored exercises, which can lead to better rehabilitation outcomes. By utilizing non-invasive smart sensing technology, healthcare facilities can more effectively monitor their patients’ health and enhance their physical rehabilitation plans.
2.2. Technology and Physical Rehabilitation
In recent years, the incorporation of technology into physical rehabilitation has emerged as an important field of study and development, with numerous cutting-edge solutions being introduced to improve rehabilitation practices. These technological advancements have enabled the development of novel rehabilitation systems and tools, such as wearable sensors, robotics, and immersive virtual environments, providing patients and therapists with new opportunities for more effective and engaging therapeutic interventions. As a result, the intersection of technology and physical rehabilitation continues to evolve, offering hopeful prospects for the future of patient care and the overall improvement of rehabilitation outcomes. To demonstrate the efficacy of using technology in rehabilitation, Rintala et al. conducted a study on six different databases from 2000 to 2018 on interventions in physical functioning in stroke and concluded that technology-based distance physical rehabilitation interventions may be comparable to traditional treatments in stroke [17].
Mukhopadhyay et al. [18] conducted a comprehensive review on the deployment of wearable sensors for healthcare applications, providing valuable insights into this rapidly evolving field. The paper emphasizes the critical role of wearable sensors in the microelectronics industry, particularly in monitoring physiological movements and signals. The authors discuss the various fabrication techniques used to develop these sensors, emphasizing the integration of communication modules for signal transmission. The review covers the entire life cycle of wearable sensors in the biomedical sector, from their fabrication in controlled environments to their integration with signal-conditioning circuits for specific applications. In addition, the paper provides a comparative analysis of sensing products currently on the market, allowing readers to evaluate their performance. Mukhopadhyay et al. also demonstrate the integration of sensing prototypes with the Internet of Things (IoT), leading to the development of fully functional sensorized systems. Finally, the review addresses the challenges that exist within current wearable systems and proposes potential solutions to overcome them. This paper is a comprehensive resource for researchers and practitioners interested in the advancements and future directions of wearable sensor technologies in healthcare [18].
Several nursing home facilities implemented smart sensing systems to accomplish the physical health monitoring of patients. In their opinion, the smart floor technology is an alternative to wearables or cameras, providing privacy and independence for residents and increasing the opportunity for smart personal engagement and monitoring while maintaining resident privacy [19].
2.3. Motivation Enhancement Systems for Physiotherapy
In contrast to traditional rehabilitation, projects utilizing gamification and serious games demonstrate a promising approach to enhance patient motivation and engagement during physical rehabilitation sessions. Users experience increased enjoyment, greater decision-making freedom, reduced physical demand and anxiety, and decreased pressure, all while improving their physical performance. These innovative strategies emphasize the positive aspects of rehabilitation, fostering a more engaging and effective recovery process [20]. Games should provide clear feedback, text, and audio instructions, so that the patient can be informed on how to achieve goals [21]. Some more intrusive solutions have been implemented with these objectives in scope, such as VR, MR, and AR systems, and have proven beneficial in upper- and lower-limb motor function, balance and gait [22,23,24,25]. Highly intrusive systems, which necessitate users to wear equipment such as goggles or multiple sensors attached to their body, may have an adverse effect on user experience. These systems can potentially discourage users by causing discomfort and, in some instances, even pain.
Virtual environments are transforming healthcare by delivering immersive experiences for a variety of applications such as physical rehabilitation, mental health, medical training, and patient education. These computer-generated simulations supplement traditional practices, resulting in better patient outcomes and more personalized healthcare solutions. The role of virtual environments in healthcare is expected to grow as technology advances.
According to a study conducted by Gumaa and Youssef in [26], the use of VR technology proved to be effective in the treatment of chronic neck pain, shoulder impingement syndrome, rheumatoid arthritis, knee arthritis, ankle instability, and post-anterior cruciate reconstruction and not effective or inconclusive in the treatment of fibromyalgia and back pain as well as knee arthroplasty. This leads to the conclusion that the use of this technology produces excellent outcomes in a variety of diseases.
Several VR applications are gaining popularity in the research field. Madeira et al. introduced PhysioMate, a software project. The system is a rigorous games-based physical rehabilitation system. PhysioMate is intended to encourage physical activity and fight physical and cognitive deterioration, acting as a supplement to physical therapists’ work, with or without their live supervision. Initially designed to aid in the rehabilitation of wheelchair-bound patients, the system employs the Microsoft Kinect sensor to detect and monitor patients’ upper-body movements while immersing them in a virtual situation via VR. PhysioMate uses game mechanics to improve the rehabilitation process by selecting five basic essential movements for balance training and motor coordination. The system is unobtrusive because users are not needed to wear anything or be connected to anything [27]. However, the problem with this type of system is that there is no continuous tracking of users, and data collected may be insufficient without supervision of a physiotherapist. There are several uses of VR and sensors that are similar to this study, as described in [25,28,29].
There are distinctions between VR and AR, as stated in the introduction section. AR may be more suitable or easier to implement in physiotherapy because the user is aware of their surroundings and can visualize the real world, thereby avoiding accidental collisions or falls. With this idea in mind, there are several research applications that use AR or MR. For example, Monge et al. demonstrated an innovative AR environment coupled with smart sensors capable of obtaining physiological parameters from the user in real-time by displaying an AR scenario and a gamification punctuation system [12]; the system encouraged users to engage in the exercises. Paredes et al. also showed a similar system [30] for gait rehabilitation using a structure sensor, an apple watch, and an RFduino Microcontroller-based motion sensor. Thus, an unobtrusive system, such as the work presented in [11], is preferable because the sensory part is part of the environment floor and does not require the patient to be physically attached, although the user still has to wear googles in order to visualize and interact with the environment, so it is not an optimal solution yet. Finally, a study performed by Gil et al. concluded that the use of augmented reality in physical rehabilitation has promising results, though as it is still a new technology, exact conclusions will be obtained soon [31].
2.4. Smart Sensing in Healthcare
By combining sensors and intelligent algorithms to collect and evaluate real-time patient health data, smart sensing is transforming healthcare. This technology offers personalized and proactive care, improving patient outcomes while reducing the strain on healthcare resources. Smart sensing applications in healthcare are anticipated to grow as the technology advances, opening up new avenues for more efficient healthcare systems. Obtaining accurate data and filtering out irrelevant information is a problem that smart sensors seek to address. Physiological parameters like heart rate variability (HRV) can reveal tension and emotional state, but they must be computed using photolethysmography (PPG) sensor or electrocardiogram (ECG) data. Smart sensors obtain precise data by running complex mathematical algorithms directly on the sensor’s microcontroller creating a smarter sensor.
New techniques and materials are constantly being developed, and wearable sensing has been successfully deployed in everyday life. By combining sensors on smart watches or bands, users can now analyze heart rate during the day, monitor sleep, and much more.
E-textiles are being used in physical rehabilitation with different applications. Several works discuss the potential benefits of smart textiles, such as wearable sensors and textile-based rehabilitation systems, in improving patient outcomes and enhancing the rehabilitation process. Some of the works present several approaches to e-textile use in the field of physical rehabilitation [32,33,34,35].
SensFloor® is a smart floor equipped with gait recording technology that provides useful data for health status assessments in neurology, geriatrics, and rehab. The data gathered by SensFloor® includes speed, average number of steps, and other relevant information which can be analyzed to recognize asymmetric and unstable gait patterns. The data is structured and saved for medical records, and according to FutureShape, SensFloor® is also suitable for rollators and other walking supports.
In addition to SensFloor®, other technologies such as e-textiles are being used to improve gait analysis and indoor location monitoring. Lauterbach et al. introduced the smart floor system as an alternative to users carrying sensors or devices, and it relies on e-textiles for conductive measurements. However, the use of pressure sensors can provide more critical information about foot plantar force distribution during gait [36]. As demonstrated by Monge et al. using a set of insoles embedded with an optical fiber sensor network that employs fiber Bragg gratings (FBGs). The system provides feedback to physiotherapists on the patient’s gait and motion patterns, with high accuracy and sensitivity. The device also comes with companion software tools that make gait analysis easier for the therapist. Although this proposed device provides a more accurate and sensitive approach to gait analysis than traditional systems, including the SensFloor®, it utilizes non-unobtrusive sensing since it requires the user to wear a set of hardware devices, which can affect the results in a rehabilitation scenario [37].
Sensors have become increasingly important in the field of healthcare in recent years. Many sensors are now Internet-connected and feature advanced processing, allowing them to provide smart functions that go beyond simple measurements. This has allowed for the unobtrusive, real-time monitoring of people’s lives as well as the collection of massive amounts of data in a natural setting. Studies have shown that using smart sensors in health research has high potential, but a deeper understanding of their underlying concepts is required to fully realize that potential. Garatva et al. provides a theoretical, non-technical overview of the fundamental concepts of smart sensors in mobile health sensing, with a focus on those that are currently embedded in smartphones. It provides a brief overview of available sensors, proposes a broad taxonomy, and discusses what can be sensed and how health can be predicted using sensor data. The paper also discusses current challenges, future research perspectives, and potential clinical applications, while providing examples of research projects based on smartphone sensors [38].
Unobtrusive systems such as Microsoft Kinect show promising results in incorporating the concepts of gamification and serious games to several rehabilitation and healthcare areas [39], from using hand gestures for elderly care [40] to post-stroke rehabilitation [41]. However, other non-hands-free similar devices, such as Nintendo Wii, showed several injuries related to overuse or incorrect use of handheld controller, amongst them tendinopathy and hand lacerations [42].
Another type of unobtrusive system is the sensing floor, which can be a alternative to wearable sensors. The PLEINAIR project developed outdoor park equipment called “outdoor smart objects” (OSO) which encourages physical activity and active lifestyles. OSO is a smart and sensitive flooring with pressure sensors and visual feedback for an interactive user experience. The project utilized distributed intelligence and connected the OSOs to the Cloud infrastructure. Challenges were addressed regarding pressure sensitivity and system scalability. Cocconcelli et al. further explored unobtrusive sensors in the form of smart sensing floors in their work [43].
2.5. AI in Healthcare
AI has shown tremendous potential in a wide range of applications, and healthcare is no exception. In recent years, the integration of AI in healthcare has revolutionized various aspects of patient care, diagnosis, and treatment. This section will discuss significant applications of AI in healthcare, more specifically on AAL applications:
- Activity recognition and monitoring: AI-powered activity recognition systems can automatically identify and analyze the activities of individuals in their living environment. These systems typically use sensors, cameras, or wearable devices to collect data and employ machine learning algorithms to recognize and interpret the patterns of daily living [44,45,46]. By monitoring the daily routines of individuals, AAL systems can detect unusual behaviors or changes in patterns, which may indicate health issues or potential risks, and alert caregivers or medical professionals accordingly.
- Fall detection and prevention: Falls are a significant concern for the elderly, as they can lead to severe injuries, loss of independence, and a decline in overall health. AI-based fall detection and prevention systems can analyze sensor data from wearable devices, cameras, or floor sensors to identify fall-related events and trigger alarms or notifications to caregivers or emergency services [47,48,49,49]. Furthermore, AI can also be employed to predict the risk of falling based on gait analysis, enabling the implementation of preventive measures to minimize the risk.
- Telemedicine and remote patient monitoring: AI can enhance telemedicine and remote patient monitoring by analyzing data collected from various sensors, wearable devices, and medical equipment in order to provide accurate and timely health assessments, personalized feedback, and recommendations for patients and healthcare professionals [53,54]. This enables the efficient and continuous monitoring of patients’ health, especially those with chronic conditions, reducing the need for frequent hospital visits.
In summary, the integration of AI in AAL is a promising avenue for enhancing the quality of life, safety, and well-being of individuals, particularly the elderly and those with disabilities. By providing continuous monitoring, personalized assistance, and timely interventions, AI-powered AAL solutions can enable individuals to maintain their independence, dignity, and health, while reducing the burden on caregivers and the healthcare system.
This following sections will discuss some machine learning (ML) techniques that are commonly applied in AAL applications.
2.5.1. Recurrent Neural Networks
Recurrent neural networks (RNN) are a type of artificial neural network (ANN) that is capable of processing sequential data or time series data. Traditional neural networks are not capable of processing sequential data because they process each input independently of previous inputs. However, RNNs have a memory element that allows them to remember information from previous inputs and use it to make predictions about future inputs in the sequence. RNNs are commonly used for time series analysis where the goal is to predict future values in a time series based on previous values. The network is trained on a dataset of time series values, and it learns the patterns and relationships between past inputs and future outputs. Once trained, the RNN can be used to predict future values in the time series with a certain level of accuracy [55,56,57].
The figure depicted in Figure 1 shows the unfolding of a unit (neuron) in an RNN, with the input state (x) at the bottom followed by the hidden state (h) and the output state (o) at the top. The weights of the network are denoted by U, V, and W, while the t refers to the recurring step. The figure shows a compressed diagram on the left and the unfolded version on the right [58,59].
Despite their usefulness, training RNNs can be challenging, mainly due to the vanishing gradients problem. When gradients become very small, it can be challenging for the network to learn. To overcome this challenge, advanced architectures such as long short-term memory (LSTM) networks and gated recurrent units (GRUs) have been proposed. These architectures use special types of artificial neurons and gates to control the flow of information through the network and prevent gradients from vanishing.
In this context, RNNs have become an increasingly popular tool in healthcare, particularly in the analysis of temporal health data. They have been employed in a variety of applications such as predicting patient outcomes and identifying the onset of health conditions. Overall, RNNs provide a promising approach for analyzing time-series data, making them a valuable tool for healthcare practitioners and researchers alike.
2.5.2. Long Short-Term Networks
Long short-term memory (LSTM) networks are a type of RNN that demonstrate capabilities in detecting long-term dependencies in data. LSTM networks are composed of LSTM cells, which are made up of multiple gates that control the flow of information through the network. These gates include the input, output, and forget gates, which allow the LSTM cell to selectively retain or discard information.
Figure 2 depicts an LSTM unit in an LSTM network, showing the input state (x), hidden state (h), and output state (o). The recurring step is denoted as t. The LSTM unit is equipped with a three-fold gate mechanism, namely the forget gate (), the update gate (), and the output gate (), to process the input variables , , and . The activation functions of the gates are either sigmoid functions () or hyperbolic tangents (), as indicated by sources [60,61].
The purpose of introducing LSTM networks was to address the vanishing gradient problem that affects traditional RNNs. The vanishing gradient problem arises when the gradients of the weights in the network become too small, making it difficult for the network to learn long-term dependencies. LSTM networks solve this issue by using a memory cell and three gates to control the flow of information through the network. The gates are employed to selectively update the internal state of the LSTM cell and prevent gradients from vanishing. By regulating these gates, LSTMs can store significant information for long periods and forget irrelevant information, enabling them to learn long-term dependencies. The benefits of LSTMs over traditional RNNs are discussed in [62].
2.5.3. Gated Recurrent Unit Networks
GRUs are a type of RNN architecture that were first proposed by Cho et al. in 2014 [63]. They are similar to LSTMs in that they are designed to overcome the vanishing gradient problem, but they are simpler and more computationally efficient than LSTMs. Like LSTMs, GRUs also have a gating mechanism that allows them to selectively retain or discard information as it flows through the network. However, GRUs only have two gates (an update gate and a reset gate) compared to LSTMs’ three gates (input, output, and forget gates).
Figure 3 depicts a GRU cell in a recurrent neural network, with the input state (x), hidden state (h), and output state (y) labeled. The time step is represented by t. The GRU unit has two gates, the reset gate () and the update gate (), to control the flow of information through the cell. The activation functions used are sigmoid () or hyperbolic tangent () functions.
One of the main advantages of GRUs over traditional RNNs is that they are able to learn long-term dependencies in data while avoiding the vanishing gradient problem. This problem occurs when the gradients used to update the weights in the network become very small, which makes it difficult for the network to learn long-term dependencies. GRUs address this problem by allowing the network to selectively store and discard information over time, which prevents the gradients from vanishing [65].
GRUs have been used in a wide range of applications, including natural language processing, speech recognition, and image captioning. In natural language processing, GRUs can be used to model the sequential structure of language and generate text. In speech recognition, GRUs can be used to process speech signals and recognize patterns in the signal. In image captioning, GRUs can be used to generate captions for images by modeling the sequential structure of language [65].
2.5.4. Multilayer Perceptron Networks
Multilayer perceptrons (MLPs) are a class of feedforward ANNs first introduced in the 1980s [66]. They consist of multiple layers of interconnected nodes or neurons, with each layer transforming the input data into a higher-level representation. MLPs can be used for various tasks such as classification, regression, and feature extraction. The architecture consists of an input layer, one or more hidden layers, and an output layer.
As depicted in Figure 4, an MLP network can be visualized as a directed graph with the input nodes (x) representing the features, hidden nodes (h) representing intermediate representations, and output nodes (y) representing the predictions or target variables. Activation functions, such as the sigmoid (), hyperbolic tangent (), or rectified linear unit (ReLU) functions, are used to introduce non-linearity into the network, enabling it to learn complex patterns.
One of the primary advantages of MLPs over simpler single-layer networks is their ability to learn non-linear relationships between input features and target variables. This is achieved through the incorporation of non-linear activation functions in the hidden layers. The backpropagation algorithm, a widely-used supervised learning technique, is employed to train MLPs. The algorithm adjusts the network’s weights iteratively to minimize the error between the network’s predictions and the actual target values [66].
3. Materials and Methods
The system developed and tested a novel system for categorizing users’ balance by analyzing data from a smart sensing floor called SensFloor® developed by Future-Shape GmbH, Hoehenkirchen-Siegertsbrunn nearby Munich fused with data from an IMU using neural networks. Based on the user’s position and motion, the system attempts to classify balance into three levels. It has the potential to be used in different environments and could be combined with other systems. Thanks to these features, the system is able to track the user’s balance and classify it.
This study’s theoretical foundation is based on the integration of AI and AR technologies in the field of gait rehabilitation. This framework is based on the understanding that current methods for gait analysis frequently rely on manual monitoring, which is prone to errors and does not provide comprehensive real-time data. With an AI-driven, non-intrusive method, it is possible to improve monitoring by providing continuous and accurate data collection, resulting in better patient outcomes.
This theoretical framework proposes a sequential process of data collection using smart sensing technology, data analysis and interpretation using AI algorithms, and feedback via an AR system. This novel method allows for real-time monitoring of patients’ gait characteristics which is accessible to both physical therapists and patients.
The primary goal of this framework is to enable the creation of personalized training plans based on accurate, real-time data, which has the potential to significantly improve rehabilitation outcomes. This theoretical perspective serves as the foundation of this research, providing a lens through which to comprehend its goals, methodology, and implications.
In summary, this theoretical framework can help one to understand the motivations driving this research as well as the context in which these findings should be interpreted.
In this section, a description of the hardware and software components of the system is presented.
3.1. System Architecture
The system’s architecture, as depicted in Figure 5, is divided into four blocks. Block 1 represents the applications where both the user and the physiotherapist interact with the system. This interface allows for visualization of the training performance and configuration of various training parameters.
Block 2 illustrates the sensing components of the system. The SensFloor system transmits data to a hat unit connected as a shield to the Raspberry Pi. A Node.js script then retrieves this data and forwards it to the database. A wearable motion sensor equipped with an ESP32 microcontroller also sends data directly to the database via its wireless capabilities.
Block 3 reveals the software components responsible for data handling and pre-processing. Within this block, the Node.js application plays a key role by incorporating a pre-processing mechanism specifically designed to address potential false positives that may arise during the training process. This mechanism operates by analyzing the distance between new and previous data points, automatically discarding any data points that exceed a predefined threshold. By implementing this approach, the Node.js application ensures the reliability and accuracy of the training data. Moreover, the Node.js application facilitates the seamless transfer of data to the database, streamlining the storage of pre-processed data for further analysis. As part of the pre-processing stage, a separate Python script retrieves the data from the database to apply machine learning algorithms. Currently, this Python software operates on a dedicated machine. It conducts essential pre-processing tasks on the data from the IMU, such as calculating the average, minimum, maximum, root-mean-square, and standard deviation. These calculated features are crucial for the subsequent classification performed by our models also included in this Python script.
Finally, Block 4 symbolizes the system’s database, which utilizes Amazon DynamoDB for data storage. By providing a comprehensive overview of the system’s architecture, we hope to enhance readers’ understanding of the relationship and interaction between its various components.
3.2. Hardware Description
This section provides an overview of the two main hardware components employed in our system: the sensor floor and the inertial measurement unit (IMU). Both components play a crucial role in data acquisition and processing, enabling effective monitoring and analysis of the environment and user movements.
3.2.1. SensFloor®
SensFloor®, by FutureShape, is a large area sensor floor, that can be installed beneath all kinds of flooring, making it invisible (Figure 6) and non-intrusive. It is made of a 3 mm thick underlay with capacitive sensor arrays that can detect people and conductive materials. This system, created by Future-Shape GmbH, is based on large-area capacitive sensor technology, which provides high spatial resolution and sensitivity (Figure 7). It is also incredibly flexible because it is made up of separate modules that can be combined in a variety of scenarios.
The SensFloor® system is composed several components:
- 1.
- Textile sensor layer: A grid of capacitive sensors is embedded within a thin, flexible textile in this layer. The sensor grid is made up of conductive fibers that have been woven into the fabric in a specific pattern to allow for precise foot position detection. The sensor grid’s size and resolution can be tailored to meet the needs of various applications.
- 2.
- SensFloor® Raspberry hat unit (Figure 8): This unit collects data from the textile sensor layer and communicates with external devices. The control unit contains analog-to-digital converters (ADCs) that convert capacitance signals into digital data. It also includes a microcontroller for data processing and a communication interface for sending processed data to external devices like the Raspberry Pi in our setup.
- 3.
- Raspberry Pi 3: The Raspberry Pi 3 is a credit card-sized single-board computer with a 1.2 GHz quad-core ARM Cortex-A53 CPU, 1GB LPDDR2 RAM, and a Broadcom VideoCore IV GPU. With a dual-band 802.11 n wireless LAN and Bluetooth 4.1 support, it has built-in wireless and Bluetooth connectivity. Four USB 2.0 ports, a full-size HDMI port, a 3.5 mm audio jack, a microSD card slot for storage, and a 40-pin GPIO header for connecting to other hardware are included on the board. The board is powered by a micro-USB port and is compatible with a variety of operating systems, including Linux distributions and Windows 10 IoT Core. In addition to camera and display interfaces, the Raspberry Pi 3 has a CSI camera port and a DSI display port for connecting to cameras and displays. Due to its small size, low cost, and extensive feature set, it is a popular choice for hobbyist projects, educational initiatives, and commercial applications.
- 4.
- Power supply: To ensure optimal performance, the SensFloor® system requires a stable power source. The power supply is typically connected to the control unit and supplies the voltage and current required to run the system.
- 5.
- Protective flooring: A high-density fiberboard (HDF) floor with AC5 resistance was used to guarantee durability and user safety. As demonstrated in Figure 9 the laminated floor was placed above the e-textile layer of SensFloor®. The laminated floor has an AC5 rating, indicating that the flooring is intended for heavy industrial use, with excellent durability and wear and tear resistance; while users engage with the system, this protective layer ensures that the SensFloor® textile sensor layer remains secure and functional. The 8mm HDF floor with AC5 resistance is an ideal protective surface for the SensFloor® system because it not only provides the required protection but also enables the capacitive sensors to detect foot positions and movements accurately and without hindrance. Due to the combination of these materials, the smart floor can effectively gather data for gait and posture analysis in a variety of settings, including residential and clinical settings.
The SensFloor® system detects capacitance changes produced by a user’s foot on the sensor grid. These capacitance variations are converted into digital data and are sent to the high-performance computational unit for further analysis and implementation in ML algorithms, virtual environment rendering, and user interaction via the mobile application. Sensor events are noticed by eight triangular sensor areas (enumerated from 1 to 8 in Figure 10) beneath the feet when a person walks across the floor. When a person positions their feet on a cell, an event will be emitted containing information regarding which of the eight cells were activated (for example in Figure 10 cell 1 is highligthed in green as it was the only cell to be activated). In the SensFloor® underlay, eight sensor regions are linked to each radio module. Sensor events are wirelessly relayed (868 MHz) from the radio module located in the middle of the SensFloor® tile highlighted in orange in Figure 10 to the SensFloor® transceiver hat connected to the Raspberry Pi. Its purpose is to process sensor events from sensor modules, analyze time sequences, and reconstruct the movement trajectories of individuals walking on the floor [69].
3.2.2. Motion Sensing System
Typically, sensors such as accelerometers and gyroscopes are used in the development of gait monitoring solutions; however, they are not ideal for obtaining precise data regarding the position of a body or object. Thus, for the purposes of this study, a wearable module containing an IMU (LSM9DS0) that combines accelerometer, gyroscope, and attitude data was developed as illustrated in Figure 11. The wearable module contains the following componets:
- 1.
- LSM9DS0 IMU Sensor: The LSM9DS0 is a 9-axis motion sensor module that incorporates in a single package a 3-axis accelerometer, a 3-axis gyroscope, and a 3-axis magnetometer. Accelerometers measure linear acceleration, gyroscopes measure angular velocity, and magnetometers measure magnetic field strength. By combining these three kinds of measurements, the LSM9DS0 can provide precise information regarding an object’s orientation and movement in three-dimensional space. The LSM9DS0 communicates with an ESP32 microcontroller via an I2C interface, and each of its sensors has a programmable full-scale range.
- 2.
- ESP32 Microcontroller: The ESP32 microcontroller is a 32-bit, dual-core processor that operates at speeds up to 240 MHz. It has built-in Wi-Fi and Bluetooth connectivity as well as a variety of other peripherals, such as GPIOs, UARTs, I2C, SPI, ADC, and DAC. Also included on the ESP32’s onboard memory are 520 KB of SRAM and 4 MB of flash memory. For the purposes of this project, the ESP32 is responsible for processing the IMU data, inserting timestamps, and transmitting the data to the database via HTTP protocol.
- 3.
- Battery: The wearable module is powered by an 850 mAh Li-Po battery, providing approximately 3.5 h of continuous measurements.
- 4.
- Charging Module: The adaptation of a powerbank module enables the battery to be charged and the operating voltage to be set to 5 V.
The user should use the motion measurement system on their back, securing it in place with a velcro tape as Figure 12 exemplifies.
Figure 13 depicts the motion device operation.
Data are acquired for the x, y, and z components of the accelerometer and gyroscope, incorporated in the LSM9DS0 sensor, with a periodicity of 10 seconds. The ESP32 filters and processes this data in order to extract information regarding the spatial orientation of the user, specifically roll (rotation around the front-to-back axis), pitch (rotation around the side-to-side axis), and yaw (rotation around the vertical axis). This information is complemented with a timestamp gathered through the communication established with an NTP (network time protocol) server. A method was also implemented to enhance the timestamp precision to the order of milliseconds.
3.3. Software Description
This section will provide a detailed understanding of the developed software. The software is an essential component of the system that enables data processing and evaluation as well as the execution of specific tasks and functions. This section will provide an overview of the software architecture and the various system components.
SensFloor® is connected to a Raspberry Pi 3 microcontroller via SensFloor® Shield (as previously explained). This microcontroller makes use of the SensFloor® API to gather, filter, and manipulate the data from this sensor. This API uses NodeJS version 18.16.1. A script was created to expose the SensFloor® data to our applications. Before exposure, the data are formatted and filtered according to what is more relevant.
In order to mitigate the possibility of process-related errors, a mechanism was implemented to prevent false positives. This mechanism compares two consecutive points through a predefined threshold assigned taking into account the feasibility of the movement, i.e., whenever the distance between points exceeds the threshold, it implies that the distance is too large to be traveled by a human, and as a result, the new point is discarded, ensuring data accuracy.
The healthcare professionals’ web application gets the data from DynamoDB and shows the corresponding user’s (x, y) position in an interface grid (Figure 14) that is updated in real-time. It is also possible to observe the motion sensor (yaw, pitch, and roll). To avoid potential position inaccuracies that could arise from false positive readings detected by the SensFloor® capacitive sensors, which may interfere with precise gait analysis, an error mitigation strategy has been incorporated into the system. This includes scenarios where assistive devices like crutches, commonly used in rehabilitation, could introduce false positives on the SensFloor® carpet. This strategy is specifically tailored to disregard sensor data points identified at a particular distance away from the user’s current position.
It is hypothesized that any contact made by an assistive device like a crutch would generate readings falling into this category of distant points. Therefore, even though crutches were not specifically tested in the study, the design of the system minimizes the impact of potential interference from such devices. This error mitigation strategy enhances the reliability of the system and broadens its applicability in real-world rehabilitation scenarios, where the use of assistive devices is commonplace.
The data collected can be accessed later through the aforementioned application, which features intuitive charts created using the Chart.js Library. These charts display various information, such as the user’s real-time position history during the current training session (allowing the user to monitor position changes and verify if they remain within the predefined green-highlighted zone), the IMU values over time throughout the training (offering a visual overview of the data acquired and the current status of the multi-component system), and the user’s overall position history since they began using the system (providing a comprehensive overview for physiotherapists to assess the user’s commitment to the training sessions) (Figure 14).
The use case of the system is demonstrated in Figure 15:
- 1.
- The healthcare professional selects the level for the user.
- 2.
- The user receives a notification and visualizes the path and its position in real-time on a monitor or tv.
- 3.
- User finishes the session and can visualize is score on the application.
If the patient is registered in the mobile application, data are also stored in a real-time cloud database, and they have access to some dashboards that allow them to check their progress over time or the scores obtained.
Considering that one key issue with the implementation of eHealth systems is the ability to keep an organized medical history record of patients, by storing and transmitting this data to be displayed in real-time, this functionality was considered in this work and is presented in Figure 16.
Using Google’s Firebase as a real-time database, with sole purpose to serve patients’ and health professionals’ data, the objectives can be accomplished, interconnecting both applications. Firebase is also a cloud-hosted, NoSQL database, which means that when a CRUD operation occurs (create, read, update, delete), all devices connected to the Firebase instance are updated in real-time—for example, when the healthcare professional prescribes a new exam, it is available in the patient’s mobile application immediately. Patients’ mobile application was developed using Google’s Flutter. The chosen software technology represents a cross-platform for mobile application development with high level of connectivity to Firebase.
According to Figure 16:
- 1.
- Mobile application uploads data to Firebase: The patient registers in the application, and their registration data is sent to Firebase’s cloud database (Cloud Firestore). The user is able to update their profile data and save it in the database. An optional profile picture can also be uploaded by the user, and will be stored in the Firebase storage. In addition, the patient can also register several personal physical measures, such as their weight, height, blood pressure and glucose level.
- 2.
- Mobile application retrieves data from Firebase: By sending their register and profile data to the cloud database, when the user accesses the application, it will automatically get the saved data (and optional profile picture from the Firebase Storage). If the user has any exams/medication prescribed by a healthcare professional, the files are loaded from the Firebase Storage and are shown in the mobile application; for this specific feature, a timeline-like interface was developed to ease the user’s point of view.
- 3.
- Web application uploads data to Firebase: Similarly to the mobile application, healthcare professionals can register in the web application, and their registration data is saved to Cloud Firestore. Then, it is possible for professionals to upload exam/medication files to patients; these files are then saved in the Firebase storage and are accessible in the patients’ application almost immediately. It is worth pointing out that when a healthcare professional prescribes any file, their profile information is aggregated to it, so that the patient knows who prescribed it and when.
- 4.
- Web application retrieves data from Firebase: After loading, the web application retrieves a list of all registered users from Firebase and offers the possibility to check what exams/medication each one has, keeping track of each patient’s medical history. Furthermore, the measurements users send to the cloud database are also automatically acquired.
After gathering data regarding users’ physical measures, the acquired information is stored in the MySQL database, cloud-hosted with AWS RDS, so that it may be stored permanently and later accessed. After these measurements have been saved, they are deleted from Firebase, which, for this case, acts as a temporary database. The generated dashboards are published in a workspace accessible only to those granted access by the application authentication.
Finally, the dashboards are embedded in the web application. It can also be accessed by the patient if he/she has been granted access to the workspace. The patient can track its progress and see its present location to create an AR scenario where the user can see and get feedback when they stray from the designated path (Figure 17).
3.4. ML Description
In this section, we discuss the ML techniques employed in our system to analyze and process the data collected by the hardware components, such as the SensFloor® and the IMU. ML plays a crucial role in extracting valuable insights from the sensor data, enabling the identification of patterns and anomalies in user behavior and movements, which can inform healthcare professionals and support personalized interventions. We had demonstrated our preliminiary system in [70] and we introduced now machine and a wearable sensor to enhance the accuracy of the presented system. For the training and model testing we used Edge Impulse software (Figure 18) which provide a user interface to facilitate embedded ML model training. It features Tensorflow and Keras which are suitable for the demands of this work.
3.4.1. Data Preprocessing
Due to the sensing principle of the SensFloor®, it is sometimes possible to observe false positives about users’ current positions, and as we had previously delimited an area of the floor, we removed some points that were incorrect. For the IMU values we had also remove initial and final seconds of the training to ensure that only movement was actually captured.
3.4.2. Feature Extraction
In the forthcoming findings section of this paper, we delve into a detailed exploration of numerous experiments we conducted, employing a variety of data pre-processing methodologies. In contrast to our previous study [70], where we derived key indicators without leveraging machine learning (ML), in this study, we experimented with the range of x and y values, specifically their maximum and minimum values, along with their standard deviations. We found that the utilization of ML techniques, in place of raw values, led to the discovery of certain metrics that yielded superior results.
Table 1 presents a summary of the features extracted based on the sensing elements used in the study. In terms of feature extraction from the IMU data, we pre-processed it and implemented a sliding window approach to extract average, minimum, maximum, root-mean square, and standard deviation. As we observed, the use of ML with these extracted features outperformed models that were trained purely on raw values.
The feature extraction method we employed is designed to distill salient features from the preprocessed data, which can accurately illustrate the underlying trends in user behavior and mobility. These features may take the form of statistical measures, frequency-domain features, or time-domain features, all of which are derived from the sensor data. The chosen features are then utilized as input for ML algorithms.
In the context of synthesizing features from different sensors, we have refined the data integration process. Data from the SensFloor® smart carpet and the IMU wearable sensor are merged and processed using ML algorithms designed to handle different data types. The algorithms effectively integrate the positional and movement data from the SensFloor® with the detailed movement data from the IMU, providing a nuanced and comprehensive overview of the patient’s gait and balance. This sophisticated synthesis of data from multiple sensors allows for a more accurate interpretation of the patient’s movements, subsequently informing the creation of personalized training plans for more effective rehabilitation.
3.4.3. Model Selection and Training
In our study, we applied various ML models to the extracted features with the aim of classifying and predicting balance. We considered several models and selected the most suitable one based on the specific problem, data characteristics, and desired performance. During the model training process, we divided the dataset into training and validation sets. The training set was utilized to fine-tune the model’s parameters, whereas the validation set served as a means to evaluate the model’s performance and mitigate overfitting.
To clarify the determination of classes before the start of the training process, a predefined classification scheme was followed for gait analysis. The system defines three classes to represent different gait patterns:
- Class 1 is associated with an abnormal gait pattern, indicating a deviation from the expected or typical gait. This class represents instances where individuals exhibit significant deviations in their walking pattern, potentially indicating a gait impairment or dysfunction.
- Class 2 is assigned to a less-abnormal gait pattern. It represents instances where individuals demonstrate some deviations from the optimal gait but to a lesser extent compared to Class 1. This class may include individuals with mild gait abnormalities or those in the early stages of recovery from a gait-related condition.
- Last, Class 3 represents the optimal gait pattern. It represents instances where individuals exhibit a normal, healthy gait without significant deviations or abnormalities. This class serves as a reference point to compare against the other classes and provides a benchmark for the ideal gait pattern.
By defining these three classes, the system is able to capture and classify various gait patterns observed in the dataset. This classification scheme allows the system to differentiate between different levels of abnormality and assess the degree of deviation from the optimal gait.
Moreover, the models can be optimized by repeating the training process while adding new and relevant data. However, the frequency at which the training process should be repeated depends on several factors, including the stability of the underlying data and the dynamic nature of the gait patterns being analyzed. In the context of this study, it is recommended to periodically retrain the model to ensure its accuracy and adaptability over time.
The training process should be repeated when there are significant changes in the dataset or when new data becomes available that could potentially enhance the model’s performance. For instance, if there are updates to the dataset with a larger and more diverse set of gait patterns, it is beneficial to incorporate this new information into the training process.
Additionally, if there are changes in the target population or if individuals with different characteristics are included in the dataset, retraining the model becomes crucial to capture these variations and improve the model’s generalizability.
It is important to strike a balance between the frequency of training and the computational resources required, while regular retraining can ensure the model’s accuracy, it can also be resource-intensive. Therefore, it is recommended to assess the stability of the data and the potential impact of any changes before determining the appropriate frequency for retraining. By periodically revisiting the training process, researchers and practitioners can maintain the model’s relevance and optimize its performance, allowing it to adapt to new data and provide accurate gait analysis results over time.
3.4.4. Model Evaluation and Optimization
Once the model is trained, its performance is evaluated using various evaluation metrics such as accuracy (), precision (P), recall (R) and F1-score (), and their values can be obtained by using the following equations:
Accuracy () is a commonly used evaluation metric that calculates the proportion of correct predictions (true positives, TP, and true negatives, TN) out of the total number of predictions, including false positives (FP) and false negatives (FN). Precision (P) measures the fraction of true positives (TP) out of the sum of true positives (TP) and false positives (FP), providing insight into how well the model identifies positive instances among all instances predicted as positive. Recall (R), also known as sensitivity or true positive rate, calculates the fraction of true positives (TP) out of the sum of true positives (TP) and false negatives (FN), indicating the ability of the model to correctly identify positive instances among all actual positive instances. The F1-score is the harmonic mean of P and R, providing a balanced measure that considers both P and R, especially when dealing with imbalanced datasets where one class dominates the other [71].
3.4.5. Deployment and Monitoring
After achieving satisfactory performance, the trained ML model is deployed to analyze the real-time data collected by the hardware components. The model’s performance should be continuously monitored and updated as needed to ensure its effectiveness in providing accurate and meaningful insights into user behavior and movements.
In summary, the integration of ML techniques in our system enhances the analysis and interpretation of the data collected by the SensFloor® and IMU. These techniques enable the identification of patterns and anomalies, informing healthcare professionals and supporting personalized interventions for improved patient outcomes.
4. Results and Discussion
In this section, we present the findings and insights derived from the application of various ML models to the previously presented work [70]. The results highlight the effectiveness of the selected models in classifying and predicting user balance. Additionally, we discuss the implications of a new IMU unit sensing system to provide more metrics and features to the systems. Using the developed system, including hardware and software, we defined a straight virtual path with positions the user needs to follow, and coordinate intervals to evaluate if the user stays in the correct path and maintains the balance. In this developed prototype, the virtual path and current user position is displayed in a TV screen for the user to visualize.
4.1. Participant Selection
For the evaluation of the system, a total of fourteen volunteers participated in the study. Each volunteer was instructed to follow a line with was marked on the floor. During the test sessions, the participants wore the wearable sensing system, which collected their motion. A total of 10 trials per volunteer were conducted, and all the data captured were stored in a database for further analysis. Specific biometric information for the volunteers is presented in Table 2 below. All of the participants were informed about the experiments and gave their verbal consent. None of the participants reported any mental, cardiac, respiratory, or other disturbances. However due to a failure between the sensing system communications with internet one of the trials were excluded.
4.2. Experimental Protocol
The experimental protocol for this study included recruiting fourteen users of various ages to participate in the experiments. The participants were informed about the study’s objectives and given a thorough explanation of the experimental procedure.
Each participant was asked to try to follow a straight line several times going forward and then turn and repeat.
During the testing phase, the system was used to record several motion parameters such as x and y position according to the SensFloor® and yaw, pitch and roll. The data gathered during the testing phase was later used to train and evaluate the ML models.
The experimental protocol was created to ensure the accuracy and reliability of the data collected during the experiments. The data collection process was meticulously monitored to ensure that all relevant parameters were recorded.
4.3. Preliminary Assessment
Initially the presented system evaluated the user performance following some metrics based on statistics, resulting in two different mathematical relations. The first metric consists of obtaining the total number of measurements during the time the user takes to complete the exercise (N), the number of measurements out of the virtual path’s bounds (NO), the real SensFloor® dimensions, in meters (in this case, and ) and the maximum X and Y deviations ( and ). It is also possible to calculate the average X and Y deviations, and , respectively, as follows:
in which represents the array with all deviations. By doing so, the final score formula is achieved, shown in Equation (6).
In an ideal scenario, variables , , , and are equal to zero, corresponding to a perfect score (100%) however, in the worst-case scenario, if , , or , the score is automatically 0%. By analyzing the first term of the equation, if the user spends most of the time outside bounds, the score tends to be lower.
As to the second solution, it makes use of RMSE (root-mean square error), as a way to measure differences between the correct values and the deviations. RSME is calculated as follows:
The term
corresponds to the deviations calculated previously. This gives an estimation of how deviated the measurements are from the ideal. corresponds to a perfect scenario, where no deviations were made throughout the path. By testing the IoT system, the worst-case scenarios reached to a of 0.15. These values can be converted to a percentage, so as to generate the final score, using Equation (8).
It is possible to conclude that if , , thus for a bigger the value, the score is lower. By incrementing/decrementing the parameter k, the score is less/more sensible to the value, respectively.
Although this technique can provide a metric it is not possible to correctly evaluate gait or balance only based on the users’ position. Therefore, we had included in this work one more sensing system capable of monitoring users’ lateral motion and thus we can now obtain more parameters but we cannot use this scoring system. With the new parameters we had implemented ML. From the previous work mentioned in [70] we still concluded that some of the metrics referred on this section such as , , , and were important features when training the ML modules.
4.4. ML Application
In this study, we evaluated the performance of three different ANN architectures (MLP, LSTM and GRU) to classify the balance of the users in three different levels. To assess their performance, we measured various performance metrics such as accuracy, loss, and F1-score. Both architectures were trained on a dataset using the same training and validation processes. During training, we monitored the model’s accuracy and loss on both training and validation data to prevent overfitting and ensure generalization performance. In addition, we evaluated the models’ performance using the F1-score metric, which takes into account both P and R in order to provide a balanced measure of the model’s effectiveness.
The network hyperparameters that were configured for the training process are shown in Table 3.
The table presents the network hyperparameters used in the study. These hyperparameters are settings that were manually set before training the neural network in order to optimize its performance. The hyperparameters include the number of epochs, which was set to 100, indicating that the network was trained for a total of 100 cycles. The optimizer used was the adaptive moment estimation (ADAM), which is a popular optimization algorithm for DL models. The loss function employed was sparse categorical cross entropy (SCCE), which is suitable for multi-class classification problems.
The selection of the SCCE as the loss function in this study is justified by the categorical nature of the target variable, which has a cardinality of more than two. The use of this loss function allows us to effectively handle multi-class classification tasks and preserve the non-ordinality of the target variable. It also avoids the need for creating dummy variables by directly encoding the target labels [72]. This approach is particularly advantageous when dealing with a large number of classes, as it helps to reduce the computational complexity associated with one-hot encoding. Moreover, by using SCCE, we can leverage the inherent structure of the target variable and train the model to make predictions based on the actual class labels, without introducing any artificial ordering of the classes. This is especially important in this case, as we want to preserve the categorical nature of the gait classification problem and avoid any assumptions of an inherent order among the classes.
The initial learning rate (LR) was set to , which is a small value commonly used to prevent the model from diverging during training. The batch size was set to 512, which indicates that the model was trained on batches of 512 samples at a time. Batch normalization was also used, which is a technique to normalize the input data to the network to prevent overfitting and improve training stability. Overall, these hyperparameters were chosen to optimize the network’s performance and balance between underfitting and overfitting.
In order to capture the complex relationships and patterns in the gait data, the MLP model employs a total of 9 hidden layers. With multiple hidden layers, the model can learn hierarchical representations and abstract features from the input data, potentially improving its performance.
The MLP model’s inclusion of various hidden layers allows the network to learn increasingly complex and abstract representations of the input data. This depth may aid the model’s ability to capture fine details and intricate patterns that may exist within gait patterns, resulting in improved performance.
It is important to note, however, that the optimal number of layers in a neural network depends on the specific problem and dataset, while deeper models may perform better, there is a trade-off between model complexity and the risk of overfitting. In our case, 9 hidden layers struck a balance between model complexity and generalization capability.
The Rectified Linear Unit (ReLU) activation function has been used for the hidden layers, while the softmax function has been employed for the output layer. The ReLU activation function is a popular choice for hidden layers in neural networks. It avoids the vanishing gradient problem and can accelerate the convergence of the learning process.
For the output layer, the softmax activation function was selected. The softmax function is commonly used in multi-class classification problems, such as gait classification, as it normalizes the output scores into probabilities that represent the likelihood of each class. By using the softmax function, we obtain a probability distribution over the different gait classes, enabling us to make confident predictions and assign a class label to each gait pattern.
Different activation functions serve different purposes and are suited for different types of problems. In the case of the MLP model for gait classification, the ReLU activation function in the hidden layers allows the model to learn and represent complex features, while the softmax activation function in the output layer provides a probabilistic interpretation of the predictions.
Performance Evaluation
In this section, we present the performance evaluation of the three models—MLP, LSTM, and GRU—which were developed to analyze and classify the given dataset. The models were trained on the same dataset, comprising x, y, , , and data. The primary objective of this performance evaluation is to assess the capabilities of each model and compare their effectiveness in terms of accuracy, P, R, and -score for each class. By providing a comprehensive analysis of the models’ performance, we aim to identify the strengths and weaknesses of each approach and offer insights into their suitability for the given problem domain.
Figure 19 depicts the confusion matrices for the three models: MLP, LSTM, and GRU.
The performance of the three models, MLP, LSTM, and GRU, was evaluated using the confusion matrices shown in Figure 19a–c. These confusion matrices provide insights into the classification accuracy and misclassification patterns for each class.
Starting with the MLP model (Figure 19a), the results indicate that it achieves a relatively high accuracy of 66.9% for Class 1. However, the model encounters difficulties in correctly classifying instances from Classes 2 and 3. It misclassifies 19% of Class 2 instances as Class 1, indicating a certain degree of confusion between these two classes. Similarly, it misclassifies 13.7% of Class 3 instances as Class 1, further highlighting the challenge in distinguishing between these classes.
In the case of the LSTM model (Figure 19b), some improvements were observed in the classification accuracy for Class 1, which reaches 82.7%. The model shows a better ability to differentiate Class 1 instances from the other classes. However, it still faces challenges in correctly classifying instances from Classes 2 and 3. Specifically, it misclassifies 30.8% of Class 2 instances as Class 1, indicating a significant confusion between these two classes. It also misclassifies 23.6% of Class 3 instances as Class 1, further highlighting the difficulty in distinguishing between these two classes.
Lastly, the GRU model (Figure 19c) demonstrates a higher classification accuracy for Class 1, achieving 86.2%. This indicates its better ability to correctly classify Class 1 instances compared to the other models. However, similar to the previous models, it struggles with differentiating between Classes 2 and 3. It misclassifies 32.7% of Class 2 instances as Class 1, suggesting a considerable overlap between these two classes. Additionally, it misclassifies 30.8% of Class 3 instances as Class 1, further emphasizing the challenge in distinguishing between these classes.
In summary, the evaluation of the three models reveals a higher classification accuracy for Class 1 compared to Classes 2 and 3. The LSTM and GRU models demonstrate improvements in classification performance compared to the MLP model, particularly in terms of accurately classifying Class 1 instances. However, they still face challenges in differentiating between Classes 2 and 3. These misclassifications suggest an inherent difficulty in distinguishing certain patterns or characteristics of the data related to these classes. Further investigation and optimization of the model architectures, training parameters, and potentially incorporating additional features may help enhance the classification performance for all classes.
Figure 20 shows the training behavior over time on accuracy and loss values.
Figure 20 presents the training behavior over time for the MLP, LSTM, and GRU models in terms of accuracy and loss values. It can be observed that all three models exhibit similar results, but the MLP model shows a slower convergence in loss values compared to the LSTM and GRU models.
The LSTM and GRU models display very similar training behavior, which can be attributed to their similar underlying architectures.
In summary, the similar training behavior observed in the LSTM and GRU models can be attributed to their comparable network architectures and gating mechanisms, which enable them to efficiently learn temporal dependencies in sequence data. The MLP model, on the other hand, has a slower convergence in loss values, possibly due to its less sophisticated architecture and inability to capture long-range dependencies in the data.
Table 4 demonstrates the evaluation metrics and their values for the models.
Table 4 provides a comprehensive performance evaluation of the three models: MLP, LSTM, and GRU. All models were trained on the same dataset, which includes x, y, , , and data. The table displays the precision (P), recall (R), and -score for each class.
The MLP model achieved a validation accuracy of 69%. For Class 1, the model showed a P of 0.84 and an R of 0.67, resulting in an -score of 0.75. The model performed moderately well in correctly identifying instances from Class 1. However, it exhibited lower performance in distinguishing instances from Class 2, misclassifying 19% of them as Class 1, and instances from Class 3, misclassifying 13.7% of them as Class 1.
Comparatively, the LSTM model showcased superior performance compared to the MLP model, achieving a validation accuracy of 75.1%. For Class 1, the model demonstrated a P of 0.80, an R of 0.83, and an -score of 0.81, indicating a strong ability to correctly identify instances from Class 1, while the model faced challenges in distinguishing between Classes 2 and 3, it showed improved performance compared to the MLP model.
Lastly, the GRU model also demonstrated excellent performance, achieving a validation accuracy of 75.7%. For Class 1, the model exhibited a P of 0.78, an R of 0.86, and an -score of 0.82, indicating its proficiency in correctly classifying instances from Class 1. The model faced similar challenges as the LSTM model in distinguishing between Classes 2 and 3 but showcased improved performance compared to the MLP model.
In conclusion, the LSTM and GRU models demonstrated superior performance compared to the MLP model. This improvement can be attributed to the LSTM and GRU architectures’ ability to effectively capture temporal dependencies present in the data. The use of the same dataset for all three models ensures a fair comparison, highlighting the strengths of the LSTM and GRU architectures in modeling time series data. These findings validate the significance of incorporating sophisticated recurrent neural network models for accurate and reliable predictions in our task.
5. Conclusions
The proposed non-intrusive IoT-based smart sensing system, which combines a virtual reality application, IMU data, and machine learning algorithms, has the potential to significantly enhance physical rehabilitation efficacy. The system’s ability to detect and analyze users’ gait and physiological health characteristics in real-time provides invaluable insights to physical therapists and patients, allowing them to adapt their gait and posture during rehabilitation exercises.
By incorporating IMU data in the previous work mentioned in Reference [70], the system can now capture more detailed information on the users’ movements and orientations. This additional data, when combined with machine learning algorithms, enables the precise classification of users’ balance in three levels. As a result, therapists can provide more targeted and personalized interventions to improve patients’ gait and overall rehabilitation outcomes.
Furthermore, the system’s use of real-time cloud database storage allows for the development of tailored analysis, which can be paired with essential metrics and graphics to provide a report based on traditional physical rehabilitation reports. Overall, this system has the potential to improve physical therapy by shortening the time required by existing procedures, giving real-time feedback, and enabling a planned and organized approach to monitoring and improving users’ health status and gait during rehabilitation exercises.
In the face of growing demand for healthcare services worldwide, innovative technologies like this non-intrusive Internet of Things-based smart sensing system can play a crucial role in optimizing rehabilitation procedures and improving patient outcomes.
Several potential directions for future work can further enhance our system. First, we plan to expand the number of participants in our experiments in order to validate the system’s effectiveness on a larger sample size. Moreover, we intend to address limitations, such as movement artifacts and sensor floor capacitance characteristics, so as to increase the accuracy of our wearable sensing system. Another possible future approach is to include additional modalities, such as audio or visual feedback, to increase the patient’s engagement with the rehabilitation exercises. Last, we seek to investigate the remote patient monitoring capabilities of our system, which could significantly increase access to physical therapy for individuals who are unable to attend in-person sessions.
Author Contributions
Conceptualization, J.M. and G.R.; methodology, J.M. and G.R; software, J.M., G.R. and A.R.; validation, O.P.; formal analysis, O.P.; investigation, O.P. and J.S.; resources, J.M. and G.R.; data curation, J.M., G.R. and A.R.; writing—original draft preparation, J.S.; writing—review and editing, J.M., G.R. and A.R.; visualization, O.P.; supervision, O.P.; project administration, O.P.; funding acquisition, G.R. and O.P. All authors have read and agreed to the published version of the manuscript.
Funding
This work was funded by the Instituto de Telecomunicações and by FCT/MCTES through national funds and, when applicable, from EU funds co-financed under the UIDB/50008/2020 project. In addition, this work was also funded by ISCTE-Instituto Universitário de Lisboa, in the form of a merit scholarship awarded to G.R.
Data Availability Statement
Not applicable.
Acknowledgments
We would like to thank Iscte—Instituto Universitário de Lisboa—and IT—Telecommunications Institute—for providing the hardware resources used to perform this research work.
Conflicts of Interest
The authors declare no conflict of interest.
Abbreviations
The following abbreviations are used in this manuscript:
| AI | Artificial Intelligence |
| ADAM | Adaptive Moment Estimation |
| ALL | Ambient Assisted Living |
| ANN | Artificial Neural Network |
| AR | Augmented Reality |
| DL | Deep Learning |
| ECG | Electrocardiogram |
| FBG | Fiber Bragg Gratings |
| GRU | Gated Recurrent Unit Networks |
| HDF | High-density fiberboard |
| HRV | Heart Rate Variability |
| LSTM | Long-Short Term Memory |
| ML | Machine Learning |
| MR | Mixed Reality |
| PPG | Photoplethysmography |
| RMSE | Root Mean Square Error |
| RNN | Recurrent Neural Networks |
| MLP | Multi-Layer Perceptron |
| VR | Virtual Reality |
| IMU | Inertial Measurement Unit |
| IoT | Internet of Things |
References
- Elhoseny, M.; Ramírez-González, G.; Abu-Elnasr, O.M.; Shawkat, S.A.; Arunkumar, N.; Farouk, A. Secure Medical Data Transmission Model for IoT-Based Healthcare Systems. IEEE Access 2018, 6, 20596–20608. [Google Scholar] [CrossRef]
- Mimi, M.; Tang, S.K.; Wan, V.T.; Vong, S.K. The effectiveness of physical exercise training in pain, mobility, and psychological well-being of older persons living in nursing homes. Pain Manag. Nurs. 2014, 15, 778–788. [Google Scholar]
- Fan, Y.J.; Yin, Y.H.; Da Xu, L.; Zeng, Y.; Wu, F. IoT-based smart rehabilitation system. IEEE Trans. Ind. Inform. 2014, 10, 1568–1577. [Google Scholar]
- Shine, K.I. Technology and health. Technol. Soc. 2004, 26, 137–148. [Google Scholar] [CrossRef]
- Postolache, O.; Monge, J.; Alexandre, R.; Geman, O.; Jin, Y.; Postolache, G. Virtual Reality and Augmented Reality Technologies for Smart Physical Rehabilitation. In Smart Sensors, Measurement and Instrumentation; Springer: Berlin/Heidelberg, Germany, 2021; Volume 39, pp. 155–180. [Google Scholar] [CrossRef]
- Spencer, B.F.; Ruiz-Sandoval, M.E.; Kurata, N. Smart sensing technology: Opportunities and challenges. Struct. Control Health Monit. 2004, 11, 349–368. [Google Scholar] [CrossRef]
- Formica, D.; Schena, E. Smart Sensors for Healthcare and Medical Applications. Sensors 2021, 21, 543. [Google Scholar] [CrossRef]
- Eysenbach, G. What is e-health? J. Med Internet Res. 2001, 3, e20. [Google Scholar] [CrossRef]
- Hammen, C. Stress and Depression. Annu. Rev. Clin. Psychol. 2005, 1, 293–319. [Google Scholar] [CrossRef] [Green Version]
- Maclean, N.; Pound, P. Discussion. Soc. Sci. Med. 2000, 50, 495–506. [Google Scholar] [CrossRef]
- Jin, Y.; Monge, J.; Postolache, O.; Niu, W. Augmented Reality with Application in Physical Rehabilitation. In Proceedings of the 2019 International Conference on Sensing and Instrumentation in IoT Era (ISSI), Lisbon, Portugal, 29–30 August 2019; Volume 8, pp. 1–6. [Google Scholar] [CrossRef]
- Monge, J.; Postolache, O. Augmented Reality and Smart Sensors for Physical Rehabilitation. In Proceedings of the EPE 2018—10th International Conference and Expositions on Electrical Furthermore, Power Engineering, Iasi, Romania, 18–19 October 2018. [Google Scholar] [CrossRef]
- Hamet, P.; Tremblay, J. Artificial intelligence in medicine. Metabolism 2017, 69, S36–S40. [Google Scholar] [CrossRef]
- Gunning, D.; Stefik, M.; Choi, J.; Miller, T.; Stumpf, S.; Yang, G.Z. XAI—Explainable artificial intelligence. Sci. Robot. 2019, 4, hleaay7120. [Google Scholar] [CrossRef] [PubMed] [Green Version]
- Bohr, A.; Memarzadeh, K. The rise of artificial intelligence in healthcare applications. In Artificial Intelligence in Healthcare; Elsevier: Amsterdam, The Netherlands, 2020; pp. 25–60. [Google Scholar] [CrossRef]
- Gao, X.; Alimoradi, S.; Chen, J.; Hu, Y.; Tang, S. Assistance from the Ambient Intelligence: Cyber-physical system applications in smart buildings for cognitively declined occupants. Eng. Appl. Artif. Intell. 2023, 123, 106431. [Google Scholar] [CrossRef]
- Rintala, A.; Päivärinne, V.; Hakala, S.; Paltamaa, J.; Heinonen, A.; Karvanen, J.; Sjögren, T. Effectiveness of Technology-Based Distance Physical Rehabilitation Interventions for Improving Physical Functioning in Stroke: A Systematic Review and Meta-analysis of Randomized Controlled Trials. Arch. Phys. Med. Rehabil. 2019, 100, 1339–1358. [Google Scholar] [CrossRef]
- Mukhopadhyay, S.C.; Suryadevara, N.K.; Nag, A. Wearable sensors for healthcare: Fabrication to application. Sensors 2022, 22, 5137. [Google Scholar] [CrossRef] [PubMed]
- Lauterbach, C.; Steinhage, A.; Techmer, A. A large-area sensor system underneath the floor for ambient assisted living applications. In Pervasive and Mobile Sensing and Computing for Healthcare; Springer: Berlin/Heidelberg, Germany, 2013; pp. 69–87. [Google Scholar]
- Kern, F.; Winter, C.; Gall, D.; Käthner, I.; Pauli, P.; Latoschik, M.E. Immersive virtual reality and gamification within procedurally generated environments to increase motivation during gait rehabilitation. In Proceedings of the 2019 IEEE Conference on Virtual Reality and 3D User Interfaces (VR), Osaka, Japan, 23–27 March 2019; pp. 500–509. [Google Scholar]
- Tamayo-Serrano, P.; Garbaya, S.; Bouakaz, S.; Blazevic, P. A game-based rehabilitation therapy for post-stroke patients: An approach for improving patient motivation and engagement. IEEE Syst. Man, Cybern. Mag. 2020, 6, 54–62. [Google Scholar] [CrossRef]
- Zhang, B.; Li, D.; Liu, Y.; Wang, J.; Xiao, Q. Virtual reality for limb motor function, balance, gait, cognition and daily function of stroke patients: A systematic review and meta-analysis. J. Adv. Nurs. 2021, 77, 3255–3273. [Google Scholar] [CrossRef]
- Jin, Y. Augmented Reality System with Application in Physical Rehabilitation. Ph.D. Thesis, Iscte—University Institute of Lisbon, Lisboa, Portugal, 2019. [Google Scholar]
- Postolache, O.; Teixeira, L.; Cordeiro, J.; Lima, L.; Arriaga, P.; Rodrigues, M.; Girão, P. Tailored virtual reality for smart physiotherapy. In Proceedings of the 2019 11th International Symposium on Advanced Topics in Electrical Engineering (ATEE), Bucharest, Romania, 28–30 March 2019; pp. 1–6. [Google Scholar]
- Alexandre, R.; Postolache, O.; Girão, P.S. Physical rehabilitation based on smart wearable and virtual reality serious game. In Proceedings of the 2019 IEEE International Instrumentation and Measurement Technology Conference (I2MTC), Auckland, New Zealand, 20–23 May 2019; pp. 1–6. [Google Scholar]
- Gumaa, M.; Rehan Youssef, A. Is Virtual Reality Effective in Orthopedic Rehabilitation? A Systematic Review and Meta-Analysis. Phys. Ther. 2019, 99, 1304–1325. [Google Scholar] [CrossRef] [Green Version]
- Madeira, R.N.; Costa, L.; Postolache, O. PhysioMate—Pervasive physical rehabilitation based on NUI and gamification. In Proceedings of the 2014 International Conference and Exposition on Electrical and Power Engineering (EPE), Iasi, Romania, 16–18 October 2014; Volume 10, pp. 612–616. [Google Scholar] [CrossRef]
- Ma, M.; Zheng, H. Virtual Reality and Serious Games in Healthcare. In Studies in Computational Intelligence; Springer: Berlin/Heidelberg, Germany, 2011; Volume 337, pp. 169–192. [Google Scholar] [CrossRef]
- Ferreira, D.; Oliveira, R.; Postolache, O. Physical rehabilitation based on kinect serious games. In Proceedings of the 2017 Eleventh International Conference on Sensing Technology (ICST), Sydney, Australia, 4–6 December 2017; Volume 12, pp. 1–6. [Google Scholar] [CrossRef] [Green Version]
- Paredes, T.V.; Postolache, O.; Monge, J.; Girao, P.S. Gait Rehabilitation System based on Mixed Reality. In Proceedings of the 2021 Telecoms Conference (ConfTELE), Leiria, Portugal, 11–12 February 2021; Volume 2, pp. 1–6. [Google Scholar] [CrossRef]
- Vinolo Gil, M.J.; Gonzalez-Medina, G.; Lucena-Anton, D.; Perez-Cabezas, V.; Ruiz-Molinero, M.D.C.; Martín-Valero, R. Augmented Reality in Physical Therapy: Systematic Review and Meta-analysis. JMIR Serious Games 2021, 9, e30985. [Google Scholar] [CrossRef]
- Fleury, A.; Sugar, M.; Chau, T. E-textiles in Clinical Rehabilitation: A Scoping Review. Electronics 2015, 4, 173–203. [Google Scholar] [CrossRef] [Green Version]
- Pantelopoulos, A.; Bourbakis, N. A Survey on Wearable Sensor-Based Systems for Health Monitoring and Prognosis. IEEE Trans. Syst. Man Cybern. Part C Appl. Rev. 2010, 40, 1–12. [Google Scholar] [CrossRef] [Green Version]
- Chen, G.; Xiao, X.; Zhao, X.; Tat, T.; Bick, M.; Chen, J. Electronic textiles for wearable point-of-care systems. Chem. Rev. 2021, 122, 3259–3291. [Google Scholar] [CrossRef] [PubMed]
- Ismar, E.; Kurşun Bahadir, S.; Kalaoglu, F.; Koncar, V. Futuristic clothes: Electronic textiles and wearable technologies. Glob. Challenges 2020, 4, 1900092. [Google Scholar] [CrossRef] [Green Version]
- Abdul Razak, A.H.; Zayegh, A.; Begg, R.K.; Wahab, Y. Foot Plantar Pressure Measurement System: A Review. Sensors 2012, 12, 9884–9912. [Google Scholar] [CrossRef] [Green Version]
- Monge, J.; Postolache, O.; Alexandre, R.; Fatima Domingues, M.d.; Antunes, P.; Viegas, V. Fiber Bragg Gratings Solution for Gait Assessement. In Proceedings of the 2020 IEEE International Instrumentation and Measurement Technology Conference (I2MTC), Dubrovnik, Croatia, 25–28 May 2020; Volume 5, pp. 1–6. [Google Scholar] [CrossRef]
- Garatva, P.; Terhorst, Y.; Messner, E.M.; Karlen, W.; Pryss, R.; Baumeister, H. Smart Sensors for Health Research and Improvement; Springer: Cham, Switzerland, 2023; pp. 395–411. [Google Scholar] [CrossRef]
- Duarte, N.; Postolache, O.; Scharcanski, J. KSGphysio-Kinect serious game for physiotherapy. In Proceedings of the 2014 International Conference and Exposition on Electrical and Power Engineering (EPE), Iasi, Romania, 16–18 October 2014; pp. 606–611. [Google Scholar]
- Oudah, M.; Al-Naji, A.; Chahl, J. Hand gestures for elderly care using a microsoft Kinect. Nano Biomed. Eng 2020, 12, 197–204. [Google Scholar] [CrossRef]
- Luca, C.; Fuior, R.; Corciovă, C.; Andriţoi, D. Development of an Interactive Post-stroke Rehabilitation Tool based on Microsoft Kinect. In Proceedings of the 2019 E-Health and Bioengineering Conference (EHB), Iasi, Romania, 21–23 November 2019; pp. 1–4. [Google Scholar]
- Tseng, C.M.; Lai, C.L.; Erdenetsogt, D.; Chen, Y.F. A Microsoft Kinect based virtual rehabilitation system. In Proceedings of the 2014 International Symposium on Computer, Consumer and Control, Taichung, Taiwan, 10–12 June; pp. 934–937.
- Cocconcelli, F.; Matrella, G.; Mora, N.; Casu, I.; Vargas Godoy, D.A.; Ciampolini, P. IoT Smart Flooring Supporting Active and Healthy Lifestyles. Sensors 2023, 23, 3162. [Google Scholar] [CrossRef]
- Ordóñez, F.; Roggen, D. Deep Convolutional and LSTM Recurrent Neural Networks for Multimodal Wearable Activity Recognition. Sensors 2016, 16, 115. [Google Scholar] [CrossRef] [PubMed] [Green Version]
- Demrozi, F.; Pravadelli, G.; Bihorac, A.; Rashidi, P. Human activity recognition using inertial, physiological and environmental sensors: A comprehensive survey. IEEE Access 2020, 8, 210816–210836. [Google Scholar] [CrossRef]
- Dang, L.M.; Min, K.; Wang, H.; Piran, M.J.; Lee, C.H.; Moon, H. Sensor-based and vision-based human activity recognition: A comprehensive survey. Pattern Recognit. 2020, 108, 107561. [Google Scholar] [CrossRef]
- Igual, R.; Medrano, C.; Plaza, I. Challenges, issues and trends in fall detection systems. BioMed. Eng. OnLine 2013, 12, 66. [Google Scholar] [CrossRef] [Green Version]
- Alam, E.; Sufian, A.; Dutta, P.; Leo, M. Vision-based human fall detection systems using deep learning: A review. Comput. Biol. Med. 2022, 146, 105626. [Google Scholar] [CrossRef]
- Şengül, G.; Karakaya, M.; Misra, S.; Abayomi-Alli, O.O.; Damaševičius, R. Deep learning based fall detection using smartwatches for healthcare applications. Biomed. Signal Process. Control 2022, 71, 103242. [Google Scholar] [CrossRef]
- Cavallo, F.; Aquilano, M.; Arvati, M. An Ambient Assisted Living Approach in Designing Domiciliary Services Combined With Innovative Technologies for Patients with Alzheimer’s Disease. Am. J. Alzheimer’s Dis. Other Dementias 2015, 30, 69–77. [Google Scholar] [CrossRef] [PubMed]
- Sai, Y.P.; Kumari, L.R. Cognitive assistant DeepNet model for detection of cardiac arrhythmia. Biomed. Signal Process. Control 2022, 71, 103221. [Google Scholar]
- Xu, W.; Ouyang, F. A systematic review of AI role in the educational system based on a proposed conceptual framework. Educ. Inf. Technol. 2022, 27, 4195–4223. [Google Scholar] [CrossRef]
- Bashshur, R.L.; Howell, J.D.; Krupinski, E.A.; Harms, K.M.; Bashshur, N.; Doarn, C.R. The Empirical Foundations of Telemedicine Interventions in Primary Care. Telemed. E-Health 2016, 22, 342–375. [Google Scholar] [CrossRef] [Green Version]
- Shaik, T.; Tao, X.; Higgins, N.; Li, L.; Gururajan, R.; Zhou, X.; Acharya, U.R. Remote patient monitoring using artificial intelligence: Current state, applications, and challenges. Wiley Interdiscip. Rev. Data Min. Knowl. Discov. 2023, 13, e1485. [Google Scholar] [CrossRef]
- Sherstinsky, A. Fundamentals of Recurrent Neural Network (RNN) and Long Short-Term Memory (LSTM) network. Phys. D Nonlinear Phenom. 2020, 404, 132306. [Google Scholar] [CrossRef] [Green Version]
- Grossberg, S. Recurrent neural networks. Scholarpedia 2013, 8, 1888. [Google Scholar] [CrossRef] [Green Version]
- Pearlmutter, B.A. Learning State Space Trajectories in Recurrent Neural Networks. Neural Comput. 1989, 1, 263–269. [Google Scholar] [CrossRef]
- Wikimedia Commons. File:Recurrent Neural Network Unfold.svg—Wikimedia Commons. 2017. Available online: https://commons.wikimedia.org/wiki/File:Recurrent_neural_network_unfold.svg (accessed on 4 May 2023).
- Linus Schilpp. Phoneme Classification and Alignment through Recognition on TIMIT. Ph.D. Thesis, Institute for Anthropomatics and Robotics Interactive Systems Lab, Karlsruhe, Germany, 2021. [Google Scholar]
- Wikimedia Commons. File:Long Short-Term Memory.svg—Wikimedia Commons. 2017. Available online: https://commons.wikimedia.org/wiki/File:Long_Short-Term_Memory.svg (accessed on 4 May 2023).
- Conti, P.; Guo, M.; Manzoni, A.; Hesthaven, J.S. Multi-fidelity surrogate modeling using long short-term memory networks. Comput. Methods Appl. Mech. Eng. 2022, 404, 115811. [Google Scholar] [CrossRef]
- Van Houdt, G.; Mosquera, C.; Nápoles, G. A review on the long short-term memory model. Artif. Intell. Rev. 2020, 53, 5929–5955. [Google Scholar] [CrossRef]
- Cho, K.; van Merrienboer, B.; Gulcehre, C.; Bahdanau, D.; Bougares, F.; Schwenk, H.; Bengio, Y. Learning Phrase Representations using RNN Encoder–Decoder for Statistical Machine Translation. In Proceedings of the 2014 Conference on Empirical Methods in Natural Language Processing (EMNLP), Stroudsburg, PA, USA, 25–29 October 2014; Volume 6, pp. 1724–1734. [Google Scholar] [CrossRef]
- Wikimedia Commons. File:Gated Recurrent Unit.svg—Wikimedia Commons. 2017. Available online: https://commons.wikimedia.org/wiki/File:Gated_Recurrent_Unit.svg (accessed on 4 May 2023).
- Shewalkar, A.; Nyavanandi, D.; Ludwig, S.A. Performance Evaluation of Deep Neural Networks Applied to Speech Recognition: RNN, LSTM and GRU. J. Artif. Intell. Soft Comput. Res. 2019, 9, 235–245. [Google Scholar] [CrossRef] [Green Version]
- Rumelhart, D.E.; Hinton, G.E.; Williams, R.J. Learning representations by back-propagating errors. Nature 1986, 323, 533–536. [Google Scholar] [CrossRef]
- SensFloor®: A Smart Floor to Detect Falls. 2015. Available online: https://www.silvereco.org/en/sensfloor-a-smart-floor-to-detect-falls/ (accessed on 1 June 2023).
- New Flooring Technology Helps Improve Outcomes at Senior Care Community. Available online: https://www.iands.design/interior-design/technology/article/10180655/new-flooring-technology-helps-improve-outcomes-at-senior-care-community (accessed on 1 June 2023).
- Lauterbach, C.; Steinhage, A.; Techmer, A. Large-area wireless sensor system based on smart textiles. In Proceedings of the International Multi-Conference on Systems, Sygnals & Devices, Chemnitz, Germany, 20–23 March 2012; Volume 3, pp. 1–2. [Google Scholar] [CrossRef]
- Santos, J.; Postolache, O.; Mendes, D. Ambient Assisted Living using Non-intrusive Smart Sensing and IoT for Gait Rehabilitation. In Proceedings of the 2022 IEEE International Conference on Metrology for Extended Reality, Artificial Intelligence and Neural Engineering (MetroXRAINE), Milano, Italy, 25–27 October 2022; pp. 489–494. [Google Scholar] [CrossRef]
- Handelman, G.S.; Kok, H.K.; Chandra, R.V.; Razavi, A.H.; Huang, S.; Brooks, M.; Lee, M.J.; Asadi, H. Peering into the black box of artificial intelligence: Evaluation metrics of machine learning methods. Am. J. Roentgenol. 2019, 212, 38–43. [Google Scholar] [CrossRef] [PubMed]
- Chatterjee, S.; Keprate, A. Predicting Remaining Fatigue Life of Topside Piping Using Deep Learning. In Proceedings of the International Conference on Applied Artificial Intelligence (ICAPAI 2021), Halden, Norway, 19–21 May 2021. [Google Scholar] [CrossRef]
Figure 1.
Unfolding example and structure of a one-unit RNN [58].
Figure 1.
Unfolding example and structure of a one-unit RNN [58].

Figure 2.
A LSTM network structure [60].
Figure 2.
A LSTM network structure [60].

Figure 3.
GRU network structure [64].
Figure 3.
GRU network structure [64].

Figure 4.
An MLP network structure.

Figure 5.
Overview of the system’s architecture.

Figure 6.
Example of a SensFloor® use case. To provide additional protection, flooring is positioned above a sensory layer.
Figure 6.
Example of a SensFloor® use case. To provide additional protection, flooring is positioned above a sensory layer.

Figure 7.
Example of a SensFloor® detecting a person’s fall and the user’s position [67].
Figure 7.
Example of a SensFloor® detecting a person’s fall and the user’s position [67].

Figure 8.
Raspberry Pi 3 equipped with a SensFloor® hat.

Figure 9.
SensFloor® technology with laminated flooring [68].
Figure 9.
SensFloor® technology with laminated flooring [68].

Figure 10.
SensFloor® module.

Figure 11.
Wearable Motion Measurement Unit.

Figure 12.
Wearable Motion Device. (a) Device with velcro tape to facilitate the use. (b) User example using the wearable device.
Figure 12.
Wearable Motion Device. (a) Device with velcro tape to facilitate the use. (b) User example using the wearable device.

Figure 13.
Motion Device Operation.

Figure 14.
Physiotherapist application homepage dashboards.

Figure 15.
User application flow.

Figure 16.
Application data flow.

Figure 17.
Users’ side application.

Figure 18.
Edge Impulse Software.

Figure 19.
Confusion matrix of MLP, LSTM and GRU, respectively.

Figure 20.
Training behavior over time of accuracy and loss values.


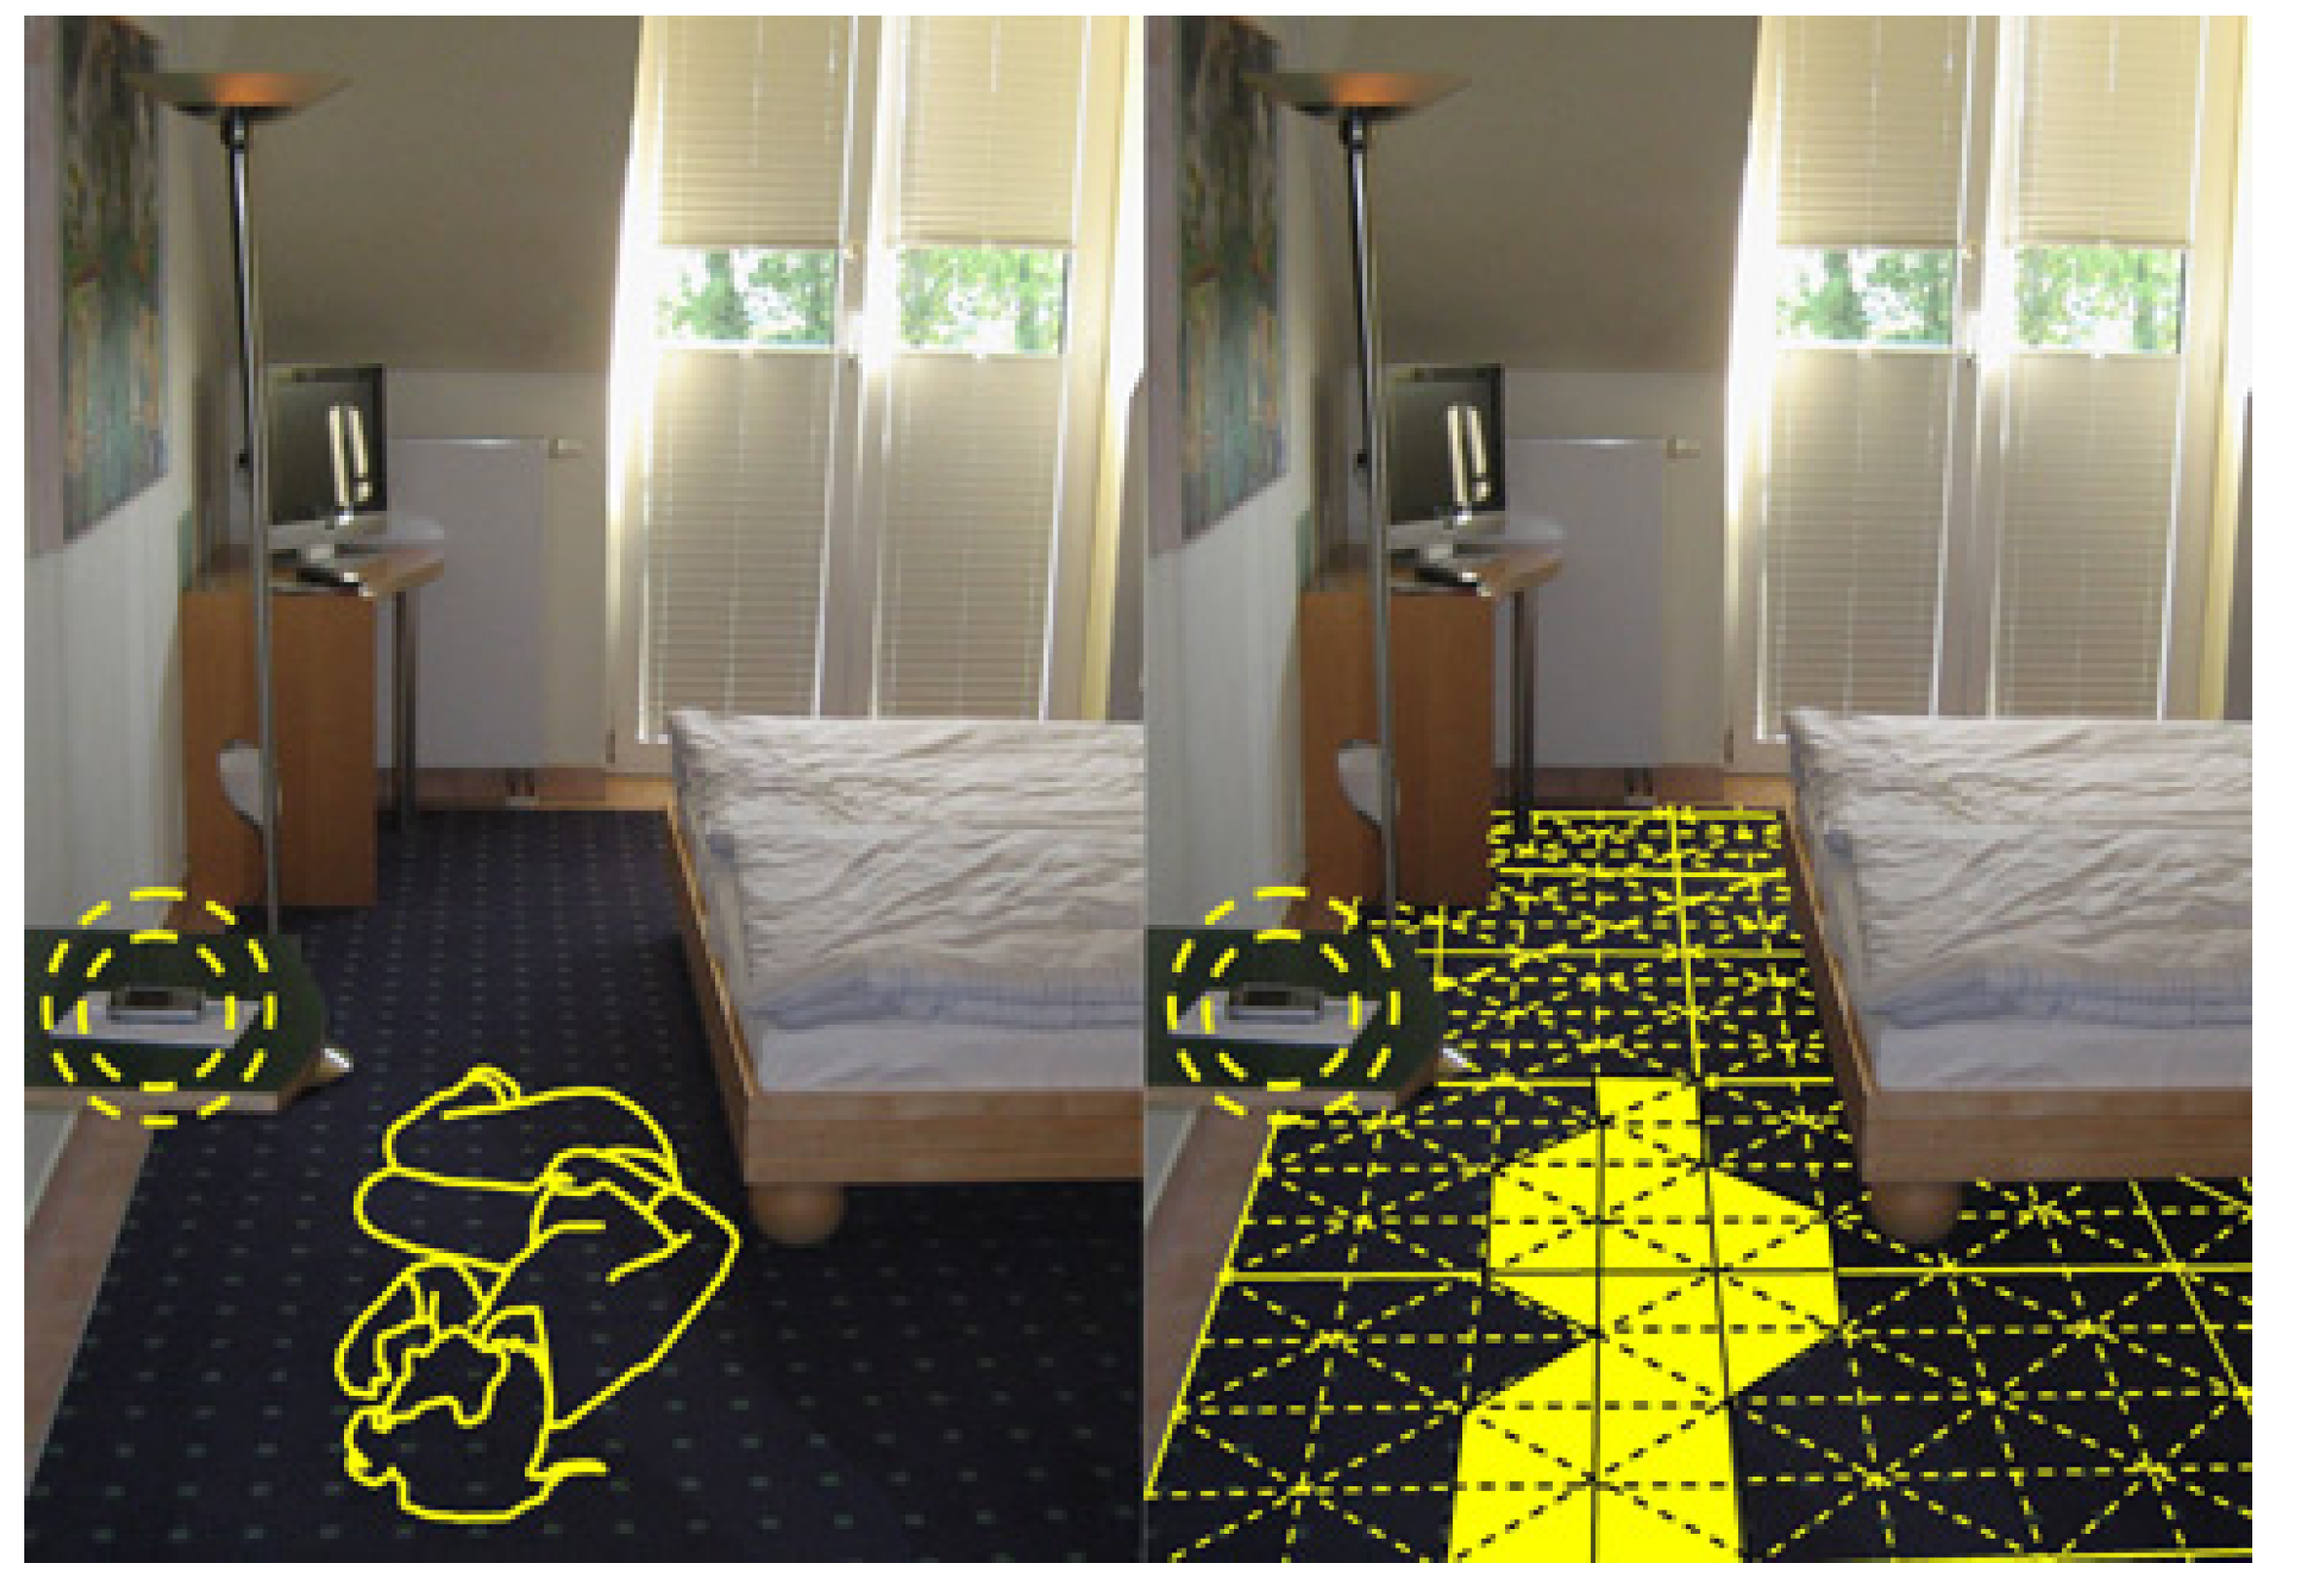
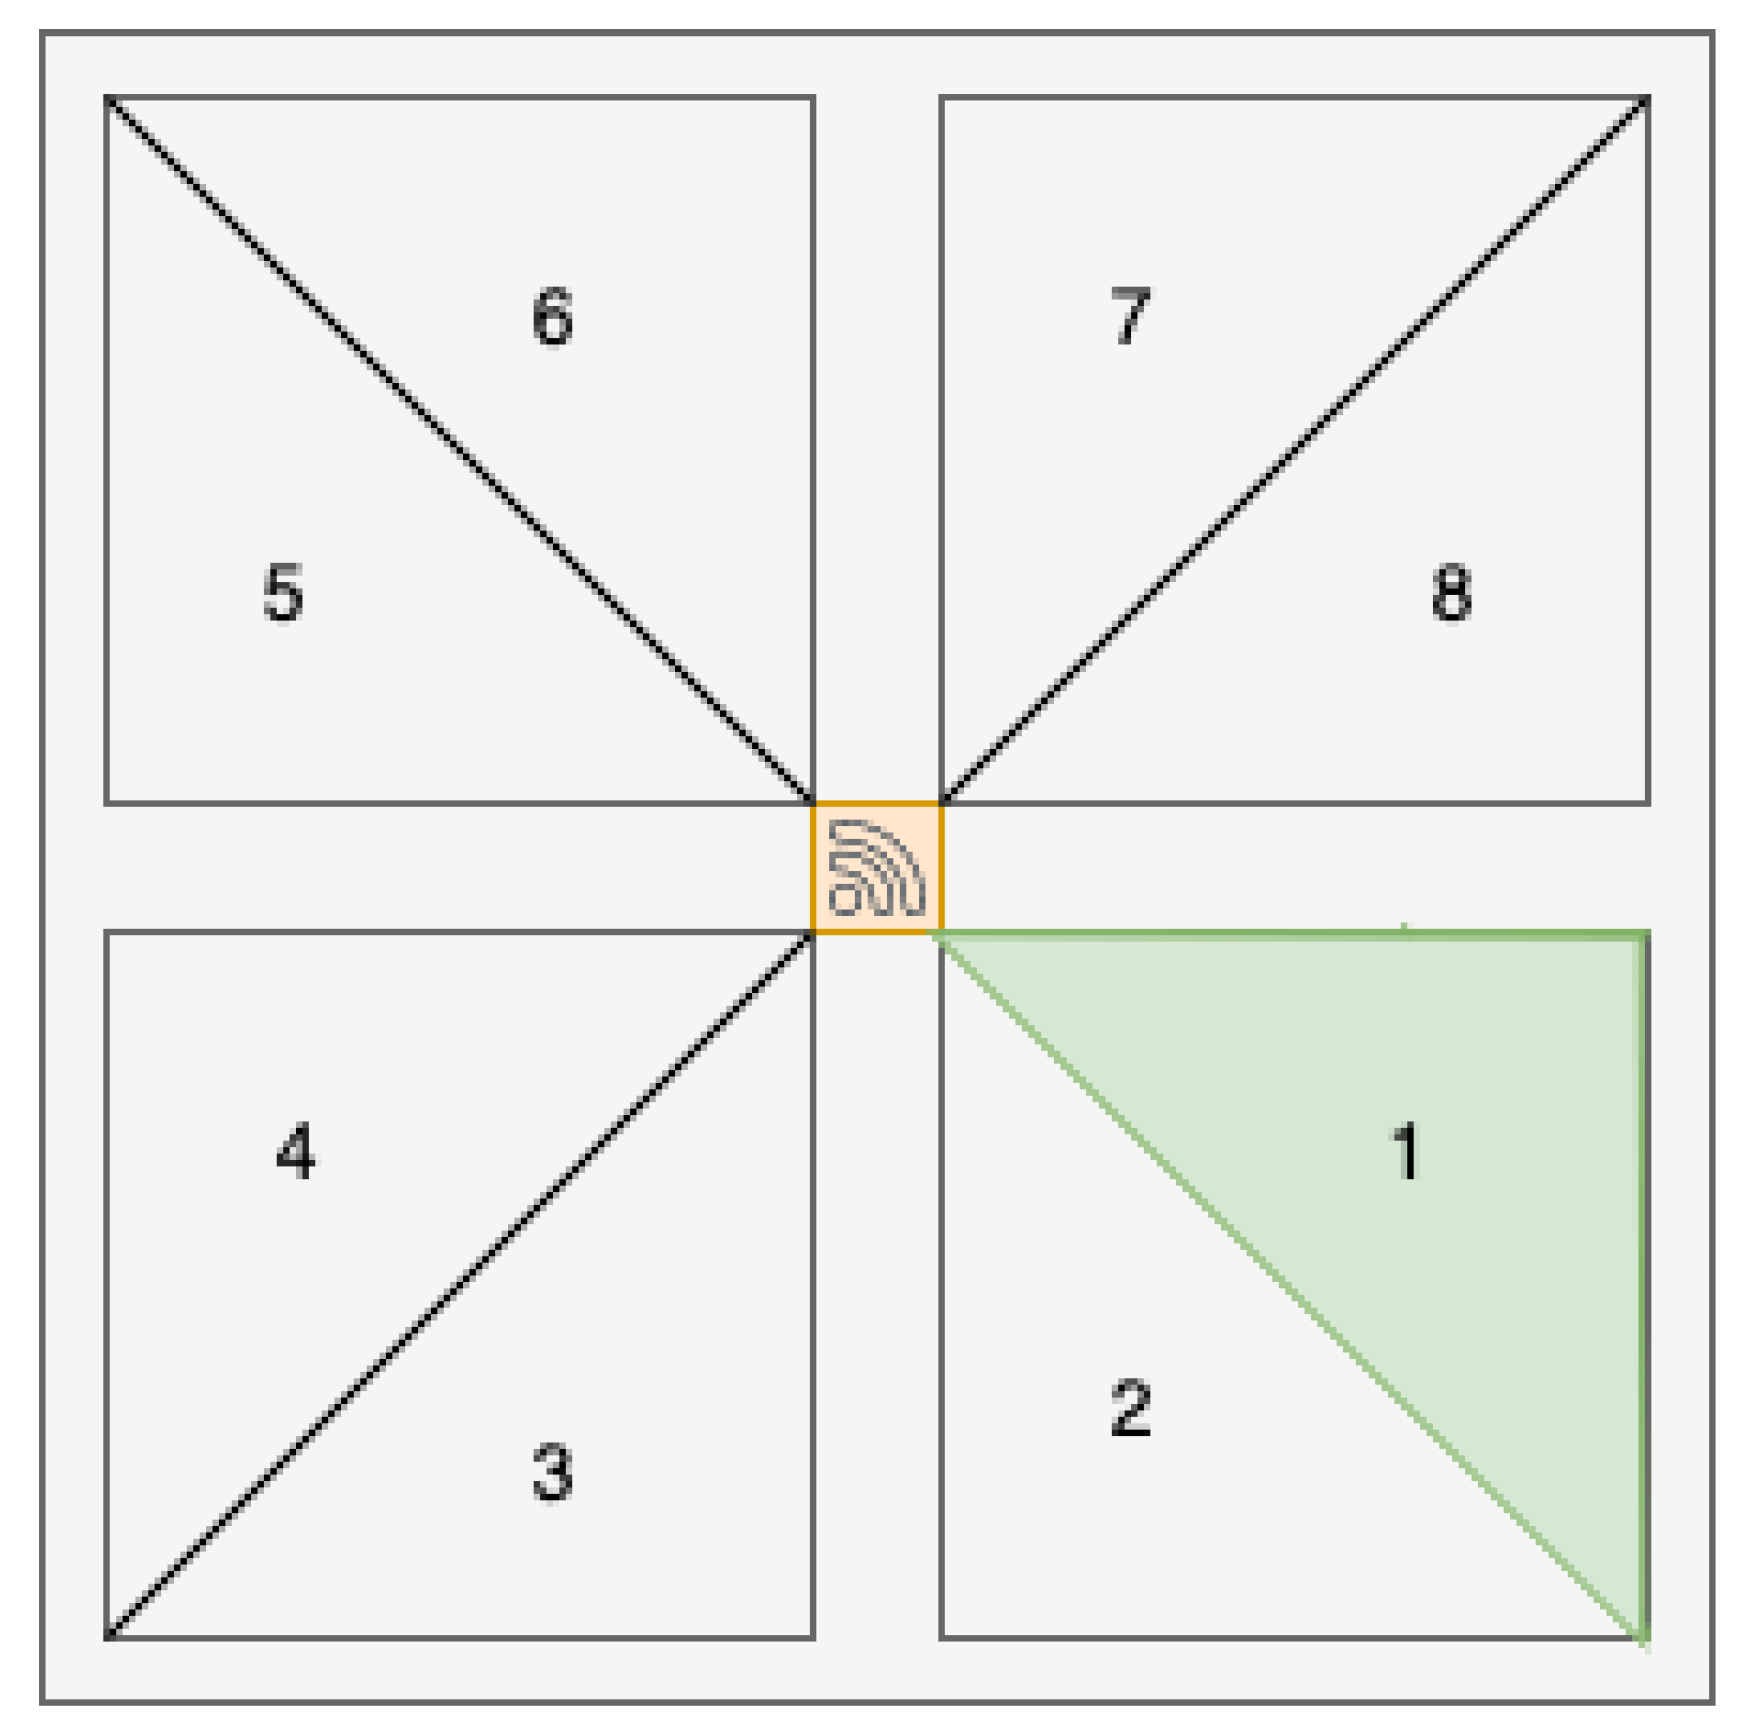
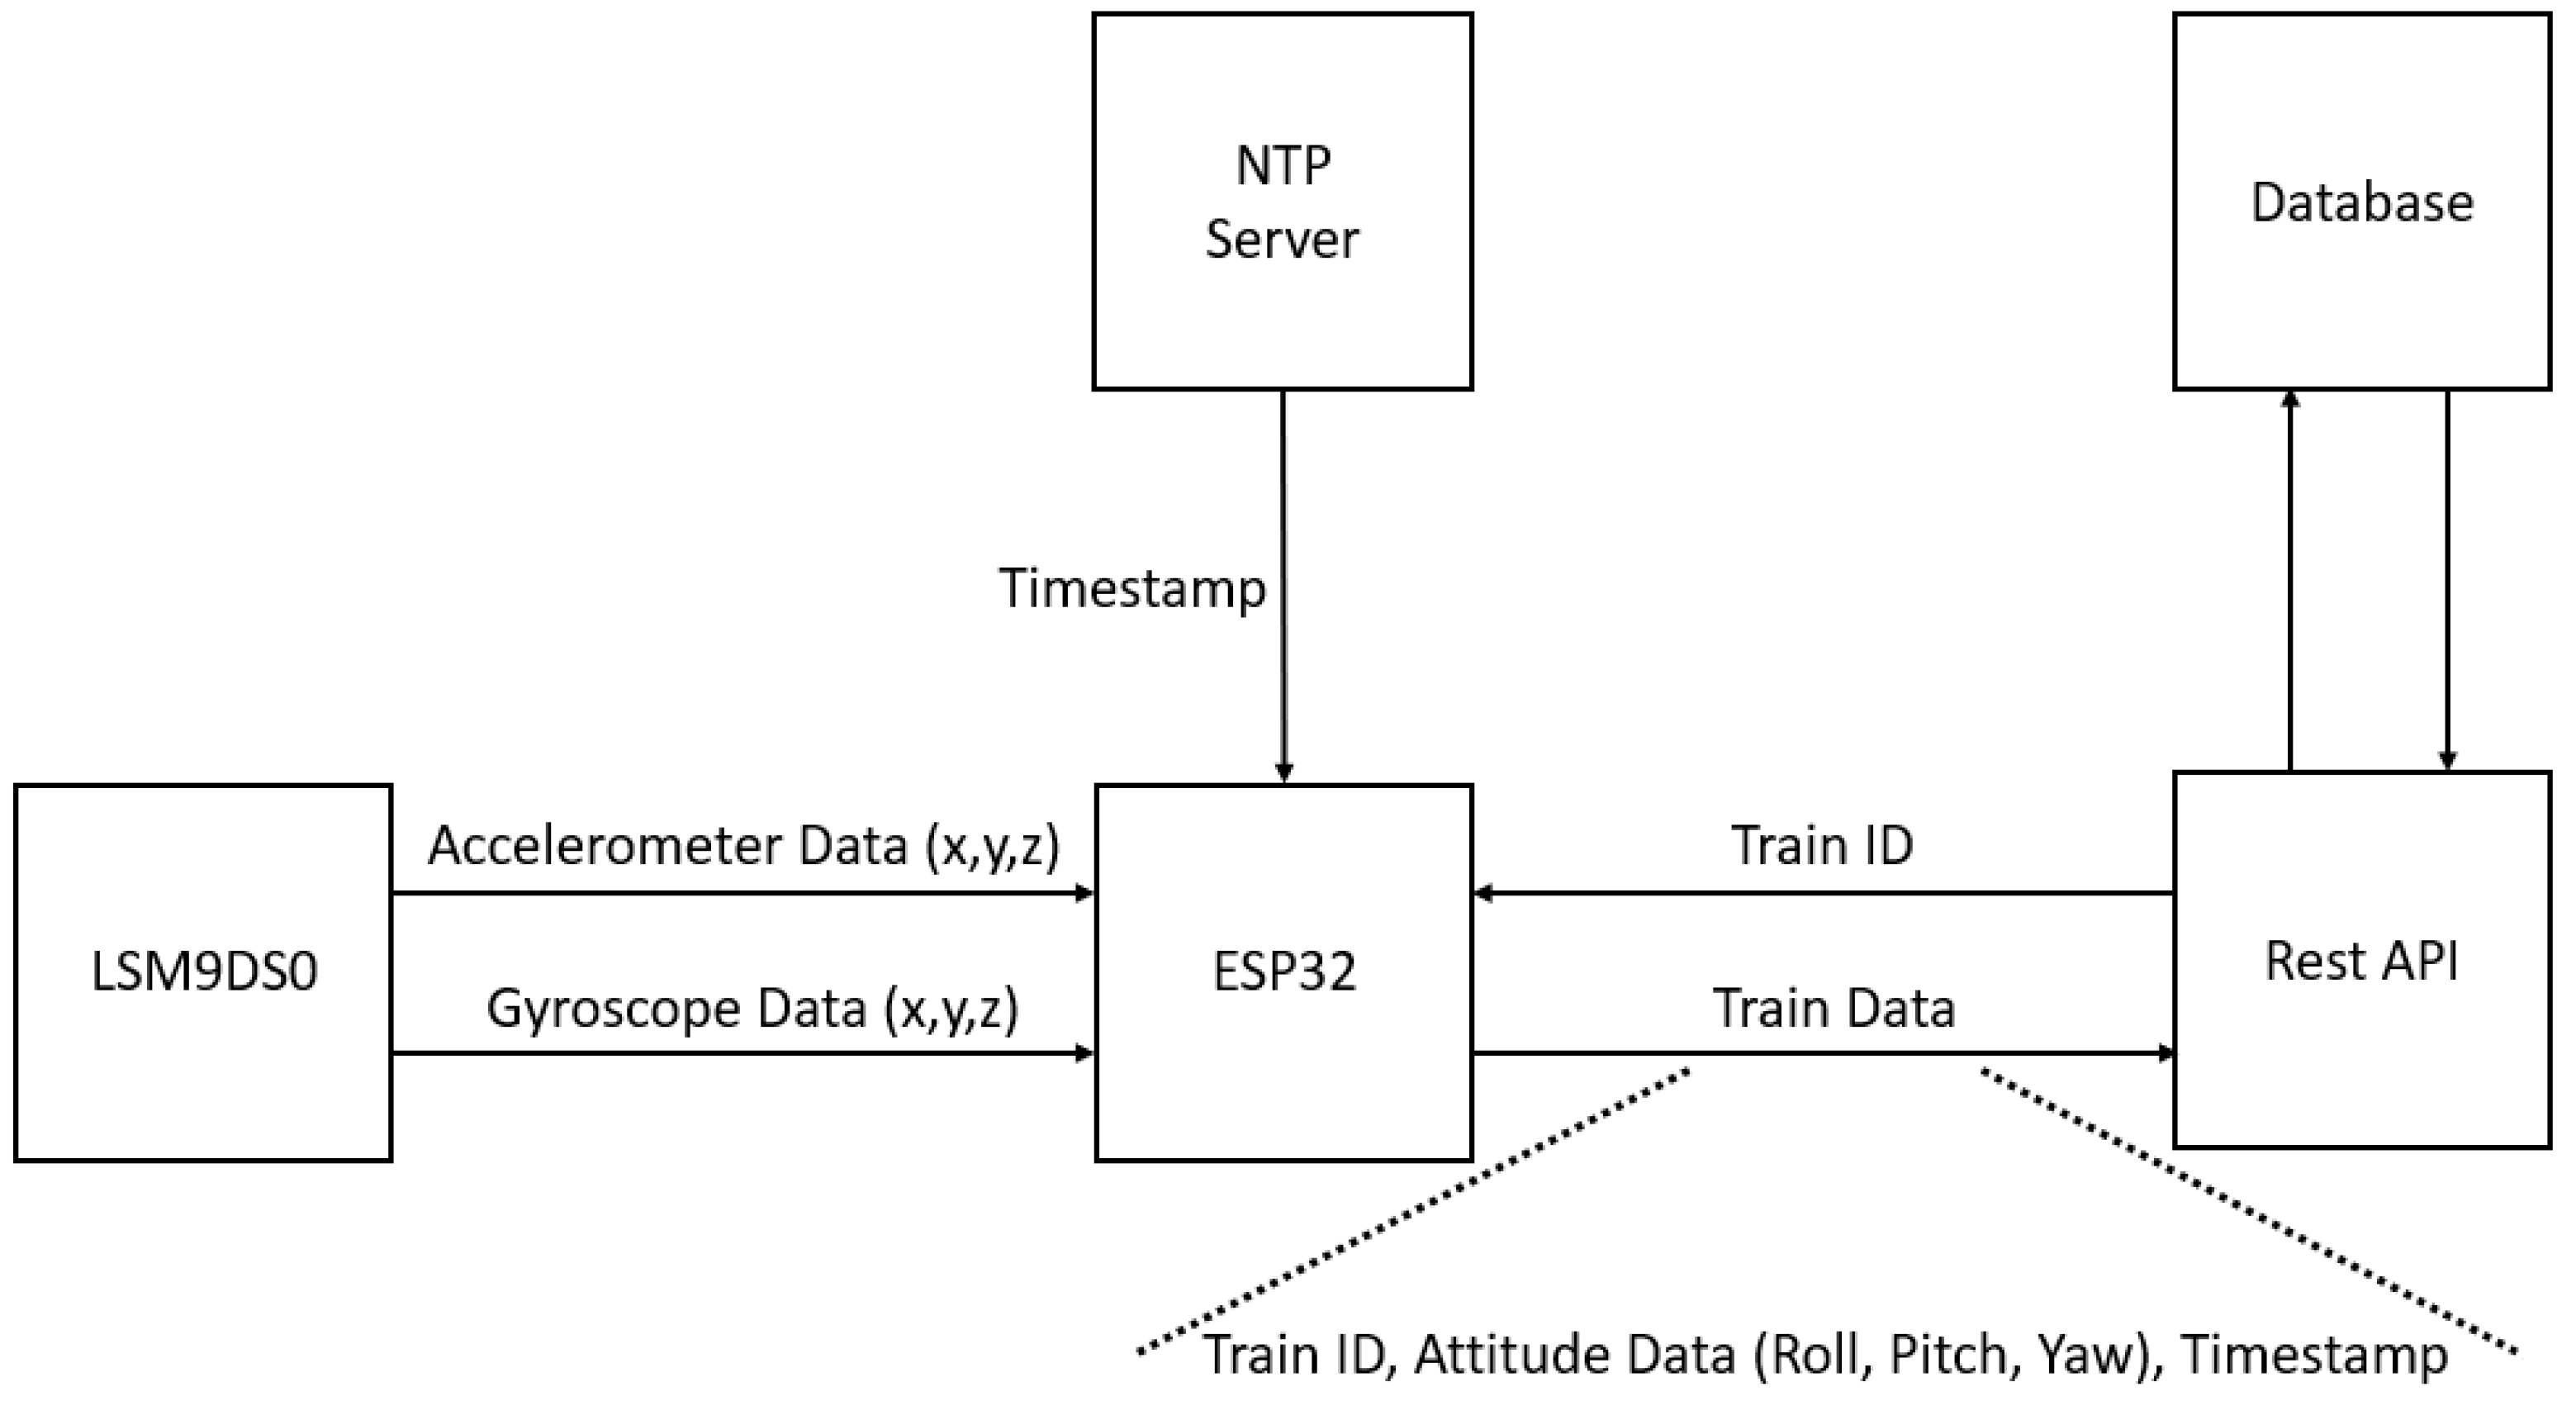
Table 1.
Summarised features extracted according to sensing element.
| Sensing Unit | Features Extracted |
|---|---|
| LSM9DS0 | yaw, pitch, roll, |
| average, minimum, maximum, | |
| root-mean square and standard deviation | |
| SensFloor® | x, y |
Table 2.
Volunteers’ Specific Biometric Information.
| Male | Female | Total | |
|---|---|---|---|
| Participants | 7 | 9 | 15 |
| Age Range | 21–32 | 18–28 | 18–32 |
| Average Range | 26 | 23 | 25 |
| Standard Deviation of Ages | 3.34 | 3.5 | 3.77 |
Table 3.
Network hyperparameters.
| Hyperparameter | Value |
|---|---|
| Epochs | 100 |
| Optimizer | ADAM |
| Loss | Sparse Categorical Cross Entropy |
| Initial LR | 0.0001 |
| Batch size | 512 |
| Batch Normalization | Yes |
| Activation Function | ReLU & Softmax |
Table 4.
Models’ performance evaluation.
| Class 1 | Class 2 | Class 3 | ||||||||
|---|---|---|---|---|---|---|---|---|---|---|
| Model | P | R | F1 | P | R | F1 | P | R | F1 | Acc |
| MLP | 0.84 | 0.67 | 0.75 | 0.56 | 0.71 | 0.62 | 0.58 | 0.72 | 0.64 | 0.69 |
| LSTM | 0.80 | 0.83 | 0.81 | 0.69 | 0.6 | 0.64 | 0.68 | 0.70 | 0.69 | 0.751 |
| GRU | 0.78 | 0.86 | 0.82 | 0.69 | 0.62 | 0.65 | 0.75 | 0.63 | 0.68 | 0.757 |
Disclaimer/Publisher’s Note: The statements, opinions and data contained in all publications are solely those of the individual author(s) and contributor(s) and not of MDPI and/or the editor(s). MDPI and/or the editor(s) disclaim responsibility for any injury to people or property resulting from any ideas, methods, instructions or products referred to in the content. |
© 2023 by the authors. Licensee MDPI, Basel, Switzerland. This article is an open access article distributed under the terms and conditions of the Creative Commons Attribution (CC BY) license (https://creativecommons.org/licenses/by/4.0/).
Share and Cite
MDPI and ACS Style
Monge, J.; Ribeiro, G.; Raimundo, A.; Postolache, O.; Santos, J. AI-Based Smart Sensing and AR for Gait Rehabilitation Assessment. Information 2023, 14, 355. https://doi.org/10.3390/info14070355
AMA Style
Monge J, Ribeiro G, Raimundo A, Postolache O, Santos J. AI-Based Smart Sensing and AR for Gait Rehabilitation Assessment. Information. 2023; 14(7):355. https://doi.org/10.3390/info14070355
Chicago/Turabian StyleMonge, João, Gonçalo Ribeiro, António Raimundo, Octavian Postolache, and Joel Santos. 2023. "AI-Based Smart Sensing and AR for Gait Rehabilitation Assessment" Information 14, no. 7: 355. https://doi.org/10.3390/info14070355
Note that from the first issue of 2016, this journal uses article numbers instead of page numbers. See further details here.