Article

A miRNA-Disease Association Identification Method Based on Reliable Negative Sample Selection and Improved Single-Hidden Layer Feedforward Neural Network

1
School of Computer Engineering and Applied Mathematics, Changsha University, Changsha 410022, China
2
College of Computer Science and Electronic Engineering, Hunan University, Changsha 410082, China
3
College of Life Science, Anhui Agriculture University, Hefei 230036, China
*
Author to whom correspondence should be addressed.
These authors contributed equally to this work.
Information 2022, 13(3), 108; https://doi.org/10.3390/info13030108
Submission received: 17 December 2021 / Revised: 20 February 2022 / Accepted: 21 February 2022 / Published: 24 February 2022
(This article belongs to the Special Issue Recent Advances in Video Compression and Coding)

Abstract

:
miRNAs are a category of important endogenous non-coding small RNAs and are ubiquitous in eukaryotes. They are widely involved in the regulatory process of post-transcriptional gene expression and play a critical part in the development of human diseases. By utilizing recent advancements in big data technology, using bioinformatics methods to identify causative miRNA becomes a hot spot. In this paper, a method called RNSSLFN is proposed to identify the miRNA-disease associations by reliable negative sample selection and an improved single-hidden layer feedforward neural network (SLFN). It involves, firstly, obtaining integrated similarity for miRNAs and diseases; next, selecting reliable negative samples from unknown miRNA-disease associations via distinguishing up-regulated or down-regulated miRNAs; then, introducing an improved SLFN to solve the prediction task. The experimental results on the latest data sets HMDD v3.2 and the framework of 5-fold cross-validation (CV) show that the average AUC and AUPR of RNSSLFN achieve 0.9316 and 0.9065 m, respectively, which are superior to the other three state-of-the-art methods. Furthermore, in the case studies of 10 common cancers, more than 70% of the top 30 predicted miRNA-disease association pairs are verified in the databases, which further confirms the reliability and effectiveness of the RNSSLFN model. Generally, RNSSLFN in predicting miRNA-disease associations has prodigious potential and extensive foreground.

1. Introduction

miRNAs are a kind of small fragment genetic material that widely regulate gene expression in human and other animal cells [1,2]. Since the discovery of miRNA in 1993 [3], scientists have accumulated the regulatory mechanisms between hundreds of miRNAs and their targets, as well as the role of miRNAs in development, physiology, and disease [4,5,6]. These studies not only shed light on the internal workings of cells but also lay the foundation to develop new methods to fight infectious diseases, cancers, and a host of other human diseases. With the massive accumulation of miRNA-disease associations data, time-consuming and high-cost biological wet experiments cannot meet the needs of scientific research well. Therefore, researchers began to explore flexible computing models to accelerate the prediction of the connections between miRNAs and human diseases.
In recent years, computational models for inferring disease-related miRNAs have been constantly proposed, among which network-based and machine learning-based methods are most popular [7,8,9,10,11,12,13,14]. The premise of the network-based method is to assume that functionally associated miRNAs are closely relevant to diseases with comparable phenotypes, and vice versa [15]. For example, Ji et al. [16] created a heterogeneous information network with a global structural information model to prioritize potential miRNA-disease associations. Xu et al. [17] implemented a method LRMCMDA based on low-rank matrix completion to infer the correlation between miRNA-disease associations. Specifically, LRMCMDA constructed a mapping network from the known miRNA-disease associations, filtered the negative samples by using the invariance of the mapping network and, finally, transformed the prediction task into a low-rank matrix completion problem. Moreover, Chen et al. [18] realized a model called BNPMDA for predicting the potential miRNA-disease associations. BNPMDA achieves the prediction task by evaluating the bias ratings and assigning the transfer weight to the resource allocation links between the miRNA-disease bilayer network. Considering the bipartite nature of the association network, Li et al. [19] proposed a collaborative filtering model (CFMDA) to solve the problem of miRNA-disease associations prediction. Besides, Peng et al. [20] applied a heterogeneous network and random walk with a restart algorithm to help find the best projection from miRNA space to disease space to discover new miRNA-disease associations (HNMDA).
Due to the rapid accumulation of data and the improvement of computing power, machine learning has undoubtedly ushered in an unprecedented golden development period in the last few years and achieved great success in various industries and fields [21,22,23], including miRNA-disease relationships prediction [24,25,26]. For example, Zhao et al. [27] designed ABMDA, which innovatively utilized k-means clustering to adjust positive and negative samples, and integrated the corresponding weight of each weak classifier to create a strong classifier to enhance the precision of miRNA-disease association prediction. Different from ABMDA, Meng et al. [28] developed the degree-based similarity indexes methods DCNMDA and DJMDA without using negative samples and other external prior information. Furthermore, Chen et al. [29] obtained the potential disease-associated miRNAs via a ranking-based KNN computational model (RKNNMDA). Xuan et al. [30] applied random walk on an miRNA-disease bilayer network for prioritizing candidate disease-related miRNAs. In addition, Chen et al. [31] presented a regularized least squares method (RLSMDA) without negative samples to reconstruct the missing associations for all diseases. Zhang et al. [32] adopted a multiple meta-paths fusion graph embedding approach to infer unidentified miRNA-disease associations.
Although current models have made great contributions in revealing potential miRNA-disease associations, most of them still have some limitations. For instance, some approaches’ prediction performance is not satisfactory, some of them randomly select negative samples from unknown miRNA-disease associations, which is unreliable, and some of them cannot predict isolated disease-associated miRNAs. So, more effective strategies and methods need to be put forward to solve these problems. In this paper, a novel model called RNSSLFN is proposed to predict unverified miRNA-disease associations. RNSSLFN makes full use of the complex structure and wealthy semantic information in the interaction network of miRNA and disease to integrate disease synthetic similarity and miRNA synthetic similarity. Then, up-regulated and down-regulated miRNAs are distinguished to obtain reliable negative samples from unknown miRNA-disease associations. Finally, an improved SLFN is applied to get the final predicted association scores between miRNAs and diseases. Compared with other cutting-edge methods, RNSSLFN achieves excellent prediction performance. The results of 5-fold CV show that the AUC and AUPR of RNSSLFN are 0.9316 and 0.9065, respectively. To further prove the superiority of RNSSLFN, we analyzed several common diseases in the case study part. According to the analysis results, we found that more than 80% of the top 30 candidate miRNAs for these common diseases in our study are confirmed by dbDEMC and miRcancer databases.

2. Materials and Methods

2.1. Datasets

Among the manually collected miRNA-disease association databases, HMDD [33], miRCancer [34], dbDEMC [35], and miR2Disease [36] are most frequently used. In these four databases, HMDD has the largest amount of data, the most powerful function, and the highest recognition. According to the literature [37], the first version of HMDD was established in December 2007, which also represents the emergence of the world’s first miRNA-disease association database. Besides, it has been updated more than 30 times over the past decade to ensure that it can keep pace with recent research advances. Currently, the latest version of HMDD v3.2 manually collected 35,547 miRNA-disease related items from 19,280 papers, covering 1206 miRNAs and 893 diseases. Compared with HMDD v2.0, the amount of data in HMDD v3.2 increased about two times [38].
The miRNA-disease association data used in RNSSLFN comes from HMDD v3.2 data sets. To obtain dense data, we deleted duplicate items, wrong data, and the miRNA (disease) with less known association. Then, a total of 16,341 known miRNA-disease associations were obtained, involving 713 miRNAs and 447 diseases [39]. According to all known correlations, a 713 × 447 adjacency matrix A was built to depict the relationship between disease d i and miRNA m j ; particularly, if the association between them was known, the value of entity A i , j would be 1, and otherwise it would be 0. Besides, in the case studies part, two independent databases, dbDEMC and miRCancer, have been used to verify the miRNA-disease association prediction list.

2.2. Disease Semantic Similarity

2.2.1. Disease Semantic Similarity Model 1

Mesh (available at: https://www.ncbi.nlm.nih.gov/mesh, accessed on 16 February 2022) is a standardized Medical Subject Headings. It makes a systematic and strict classification of diseases and has been extensively applied to obtain the association between diseases. Based on Mesh, Wang et al. [40] described the relationship between different diseases with directed acyclic graph ( D A G ), where D A G nodes represent diseases and edges represent the relationship between nodes. Thus, disease D can be described as D A G D = D , T D , E D , and T D is a set of nodes consisting of all ancestor nodes of disease D . E D is a set of edges from parent nodes to child nodes. They additionally proposed a semantic value measure strategy by considering the relative position of any two diseases in D A G . Then, we defined the contribution of disease d to the semantic value of disease D in D A G as D 1 D d , which can be calculated by taking following formula:
D 1 D d = 1                                                                                 i f   d = D D 1 D d = max D 1 D d | d ϵ   c h i l d r e n   o f   d                 i f   d D
In Formula (1), Δ is semantic contribution decay factor; referring to previous literature [41], its value is generally set to 0.5. It also can be seen from the above formula that the contribution of disease D to its own semantic value is 1, while the contribution of other ancestor diseases decreases with the enlargement of distance. So, the semantic value of disease D can be calculated as follows:
D V 1 D = d T D D 1 D d
It is generally agreed that the more nodes two diseases share in the D A G s , the higher the semantic similarity of the two diseases will be. Therefore, the semantic similarity between d i and d j can be calculated as follows:
S S 1 d i , d j = t T d i T d j D 1 d i t + D 1 d j t D V 1 d i + D V 1 d j

2.2.2. Disease Semantic Similarity Model 2

The above model has been proven to be effective in measuring the semantic similarity between diseases, but Xuan et al. [42] found its shortcomings. Wang et al.’s calculation method shows that the disease terms within the same layer produce identical semantic contribution values, while Xuan et al. observed that “digestive system tumor” appeared in 40 kinds of disease D A G s , and “liver disease” appeared in 73 kinds of disease D A G s . Obviously, the latter appeared more frequently than the former. Therefore, Xuan et al. believed that, if two diseases are at the same layer, it should be considered that their contributions to disease D are different. In other words, the semantic contribution value of disease terms with a high frequency should be higher than that of disease terms with a low frequency. In view of this, it is not sensible to give equal contribution values to diseases in the same layer, so we presented model 2 as a complement to model 1, and the calculation of semantic value contribution is as follows:
D 2 D d = l o g t h e   n u m b e r   o f   D G A s   i n c l u d i n g   d   t h e   n u m b e r   o f   d i s e a s e s
Then, the calculation of the semantic value is similar to model 1, as follows:
D V 2 D = d T D D 2 D d
S S 2 d i , d j = t T d i T d j D 2 d i t + D 2 d j t D V 2 d i + D V 2 d j
Finally, to fully utilize model 1 and model 2 and make them reach a relative balance, we take the mean value of them as the final disease semantic similarity; the calculation can be expressed as follows:
S S d i , d j = S S 1 d i , d j + S S 2 d i , d j 2

2.3. miRNA Functional Similarity

After calculating the disease semantic similarity, the functional similarity of miRNAs can be quantified by combining the known miRNA-diseases associations and the disease semantic similarity matrix. We first define d t as a certain disease, D T as a group of diseases that have semantic similarities to d t , and D T = d t 1 , d t 2 ,   ,   d t k . Then, the maximum similarity S d t , D T between d t and D T can be expressed as follows:
  S d t , D T = max 1 i k S d t , d t i
To better describe how to measure miRNA functional similarity, this paper takes hsa-mir-28 and hsa-mir-97 as examples. Assuming that D T 1 represents a group with m diseases related to hsa-mir-28 and D T 2 represents another group with n diseases related to hsa-mir-97, the functional similarity between two miRNAs can be calculated according to the following formula:
  MISIM M 1 , M 2 = 1 i m S d t 1 i , D T 2 + 1 j n S d t 2 i , D T 1 m + n
According to the above formula, we calculated miRNA functional similarities and constructed the symmetric matrix F S of miRNA functional similarity. In matrix F S , entity F S i , j represents the score of functional similarity between m i and m j .

2.4. Gaussian Interaction Profile Kernel Similarity for Diseases

In order to comprehensively consider and calculate disease-related similarity networks, we further introduced the disease gaussian interaction profile (GIP) kernel similarity [43]. Using the i-th row vector of the adjacency matrix A to construct the vector I P d i to represent the interaction between disease d i and all miRNAs, the calculation of disease GIP similarity is as follows:
K D d i , d j = exp r d I P d i I P d j 2
In Formula (10), K D is a symmetric matrix composed of disease GIP kernel similarity, and r d is a tunable parameter of the kernel bandwidth, which can be normalized by another kernel bandwidth parameter r d . The calculation formula is as follows:
  r d = r d / ( 1 n d i = 1 n d I P d i 2 )
In Formula (11), n d is the quantity of diseases, and the value of r d is set to 1 based on the work of previous researchers.

2.5. Gaussian Interaction Profile Kernel Similarity for miRNAs

Equally, for the sake of fully considering the similarity network of miRNAs, we also introduced miRNA GIP kernel similarity; the specific calculation is as follows:
  K M m i , m j = exp ( r m I P m i I P m j 2 )
r m = r m / ( 1 n m i = 1 n m I P m j 2 )
In the above formulas, K M is a symmetric matrix composed of miRNA GIP similarity, and vector I P m i is the i-th column of adjacency matrix A that represents the interaction between miRNA m i and all diseases. n m represents the quantity of miRNAs, and the value of r m is also set to 1.

2.6. Integrated Similarity for miRNAs and Diseases

Considering that not all miRNA-miRNA pairs have functional similarities, at the same time, to prevent the miRNA similarity matrix from being too sparse, we combined the miRNA functional similarity matrix with the miRNA GIP similarity matrix. Specifically, if there is no functional similarity between two miRNAs, the final similarity between them is characterized as GIP similarity; conversely, the final similarity between them is defined as the average of GIP similarity and miRNA functional similarity. The overall similarity matrix of miRNA is calculated as follows:
S M m i , m j = K M m i , m j + F S m i , m j 2 ,   i f   e x i s t   f u n c t i o n a l   s i m i l a r i t y K M m i , m j ,   o t h e r w i s e          
Likewise, not all disease-disease pairs have semantic similarities. We also calculated the overall similarity of diseases by combining the disease semantic similarity matrix and disease GIP similarity. The formula is as follows:
S D d i , d j = K D d i , d j + S S d i , d j 2 ,   i f   e x i s t   s e m a n t i c   s i m i l a r i t y   K D d i , d j ,   o t h e r w i s e        

2.7. RNSSLFN Prediction Model

The main framework of the RNSSLFN model has four key points, including the acquisition of diseases and the miRNAs integration similarity matrix, the construction of positive and negative training samples, the training of improved SLFN model, and the scoring and ranking of the final prediction results. The source code of this paper is freely available at https://github.com/Pualalala/SLFN (accessed on 17 December 2021).The overall framework of the RNSSLFN model is shown in Figure 1.
Before model training, the focus is on how to obtain reliable negative samples. Based on MISIM v2.0, this paper proposes a novel and reliable negative sample selection strategy. In 2019, Li et al. [44] updated the MISIM v2.0 server innovatively. They quantified the miRNA functional similarity into negative, positive, or zero values for the first time. However, all previous studies can only produce positive and zero values when calculating miRNA functional similarity. In addition, MISIM v2.0 can predict the directional miRNA-disease associations via distinguishing up-regulated and down-regulated miRNAs, that is, the positive and negative value of the prediction scores can decide whether the association between miRNA and disease is positive or negative. It is acknowledged that some miRNAs are negatively correlated in function. For example, some miRNAs prompt apoptosis, while others repress apoptosis. Therefore, MISIM v2.0 quantifies the miRNA functional similarity score as a negative value, which other models and MISIM v1.0 did not achieve this. Based on this, we think that it is more reliable to select the association pairs with negative scores from the prediction list of the MISIM v2.0 server as negative samples than to randomly select negative samples from unknown association samples. So, the RNSSLFN model manually collected negative samples from the MISIM v2.0 server (http://www.lirmed.com/misim/, accessed on 17 December 2021). Specifically, we inputted 447 target diseases into the MISIM v2.0 server to extract the miRNA-disease association pairs with negative scores from the prediction list and then sorted the final 26000 association pairs in descending order and selected the first 16,341 samples as the final negative samples to construct the 1:1 positive and negative training samples.
After solving the problem of how to pick out negative samples, next, an improved SLFN is introduced to forecast the potential association between miRNAs and diseases. In the traditional SLFN, the quantity of hidden layer nodes has an extraordinary impact on the performance of the neural network model. Too few hidden layer nodes will lead to poor network performance, whereas numerous hidden layer nodes will make the network spend too much training time, resulting in the training results being easy to fall into local minima. However, there is no scientific and universal method to decide the range of hidden layer nodes numbers. Therefore, how to allocate the quantity of hidden nodes is a critical issue that needs to be solved.
Considering the inherent shortcomings of the traditional SLFN [45], RNSSLFN uses the particle swarm optimization (PSO) algorithm to initialize the network, adds adaptive an mechanism to the hidden layer, and, finally, combines the redundant nodes with similar functions to fulfill the dynamic adjustment of the hidden layer nodes. As shown in Figure 1, x = x 1 , x i , x L T is the input vector, where x i is the i-th feature of sample x ; h = h 1 , h s , h M T is the hidden layer output vector, where M is the number of hidden layer nodes; y = y 1 , y k , y N T is the output vector of the output layer and he prediction task in this paper can be viewed as a binary classification, so N is 2; p = p 1 , p k , p N T is the probability vector mapped by softmax from y; in addition, ( W h , b h ) and ( W o , b o ) are the learnable parameters from the input layer to the hidden layer and the hidden layer to the output layer, respectively, where W is the weight matrix and b is the bias vector. Then, the output of the s-th node within the hidden layer can be calculated by the following formula:
  h s = f i = 1 L x i w i s h + b s h
In Formula (16), f(·) is the activation function ReLU, w i s h and b s h are weight and bias from the i-th node within the input layer to the s-th node within the hidden layer. The above formula can also be replaced by the following formula in vector form:
  h = f x T W h + b h
Finally, the output vector can be expressed as:
  y = f x T W h + b h T W o + b o
Three key points need to be considered when adding an adaptive mechanism to the hidden layer: (i) when to add nodes; (ii) how to update the learnable parameters of new nodes; (iii) when to terminate node self-growth.
(i)
when to add nodes
Traditional neural networks generally adopt a fixed network structure and a fixed nodes number of the hidden layer. Although it can achieve rapid convergence, the network performance is usually not very satisfactory. Besides, long-time training in a steady state may also lead to excessive learning. Therefore, the RNSSLFN model introduces an improved SLFN, which sets the initial quantity of hidden nodes to 1, and then gradually increases the number of hidden nodes through a self-growing mechanism. The definition of self-growing condition of hidden layer nodes is when the loss function does not decrease, and the value of the loss function needs to satisfy the following formulas:
        l o s s n 2 l o s s n 1 < l o s s n 1 l o s s n
l o s s n = l o s s n 1 l o s s n
where l o s s n is the loss value generated during the n-th iteration, and Formulas (19) and (20) can be integrated as follows:
S T = l o s s n 2 2 l o s s n 1 l o s s n
Therefore, the self-growing condition of hidden layer nodes can be briefly described as S T < 0 .
(ii)
how to update the learnable parameters of new nodes
The key of self-growing mechanisms is to update the learnable parameters of new nodes, including weights and bias. In deep learning, the most common method to initialize learnable parameters is random initialization. Because deep learning has a complicated structure and comparatively more iteration processes, random initialization has less effect on the network. For SLFN, the restricted number of nodes and iterations will increase the effect of random initialization on the network performance. Therefore, we adopted a new initialization method based on PSO. The PSO algorithm is a powerful swarm intelligence optimization algorithm that can track and obtain the individual extremum P i and global extremum X i generated in the iterative process to constantly update the particle position and velocity. The update of particle velocity in the t-th iteration can be expressed as:
  V i t + 1 = w t V i t + c 1 r 1 P i t X i t + c 2 r 2 G t X i t
where V i is the velocity vector of the i-th particle; w is the inertia weight; P i is the individual optimal position of the i-th particle; G is the global optimal position; r 1 and r 2 are random numbers between 0 and 1; and c 1 and c 2 are learning factors which often set to 0.1. The update of particle position in the t-th iteration can be expressed as:
          X i t + 1 = X i t + V i t + 1
where X i is the position vector of the i-th particle. The technique of using the PSO algorithm to initialize a new node is to require the learnable parameters as its decision vector and take the model loss function as the fitness value and then make the minimum optimization result as the initial value of the new node learnable parameters.
(iii)
when to terminate node self-growth
As mentioned earlier, the self-growing condition is defined as S T < 0 . However, in general, with the progress of network training, when the network converges, the value of S T will become smaller gradually or even tend to 0 but cannot guarantee S T 0 . Therefore, if there is no termination condition, the network is likely to unlimitedly increase the number of hidden nodes and eventually lead to training failure. Based on this, the RNSSLFN model defines the termination condition as the value of loss function and does not decrease for three consecutive times.
In addition, on the premise of ensuring the accuracy of the model, the simpler the network structure is, the stronger the generalization ability is. Therefore, RNSSLFN further combines redundant hidden nodes with similar outputs to simplify the network structure. When the Euclidean Distance between two nodes in the hidden layer is shorter than other nodes, they can be called a pair of similar nodes and be expressed as h u h v . Specifically, nodes h u and h v need to satisfy the following formulas:
d n h u , h v = M I N D n   A n d   d n h u , h v < M E A N D n α · S T D D n
d n h u , h v = W : , u h n b u h n W : , v h n b v h n 2
D n = d n h i , h j | i j , i , j 1 , 2 , M
where α 0 , 3 is a hyper-parameter, indicating the aggregation level of nodes within the hidden layer.
According to Formulas (16)–(26), when h u h v is satisfied,
y = h W o + b o = , h u , , h v , , W u , : o , , W v , : o , T + b o , 1 2 ( h u + h v ) , , W u , : o + W v , : o , T + b o
So, the output value h c o m of the hidden layer node after combination can be calculated as follows:
h com = 1 2 ( h u + h v ) = f i = 1 L x i W i u h + W i v h 2 + b u h + b v h 2 = f i = 1 L x i W i , c o m h + b c o m h
Then,
W : , c o m h = W : , u h + W : , v h 2 ,   b c o m h = b u h + b v h 2 ,   W c o m , : o = W u , : o + W v , : o

3. Results

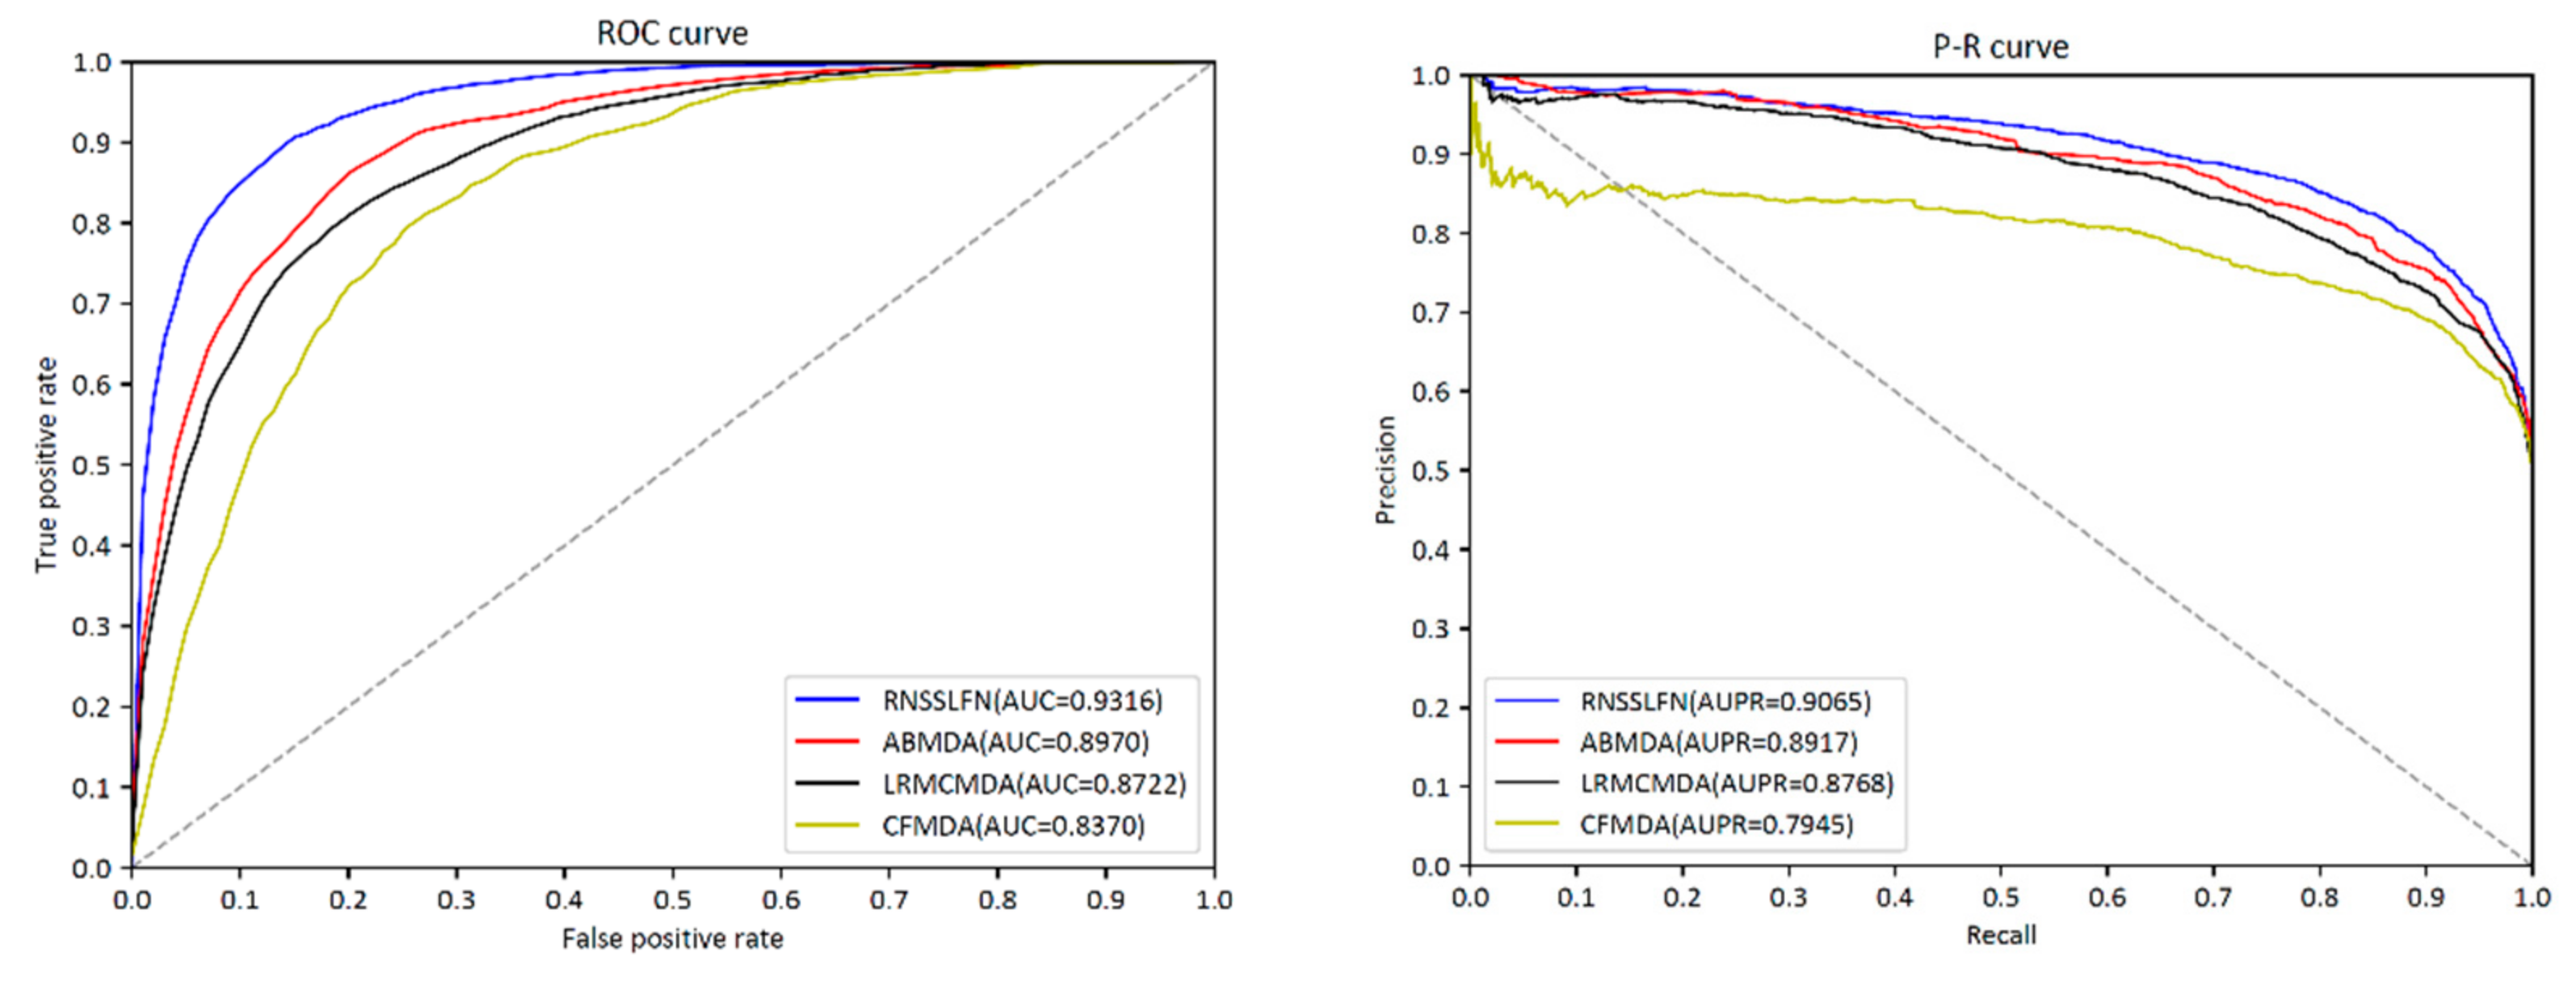
3.1. Performance Evaluation
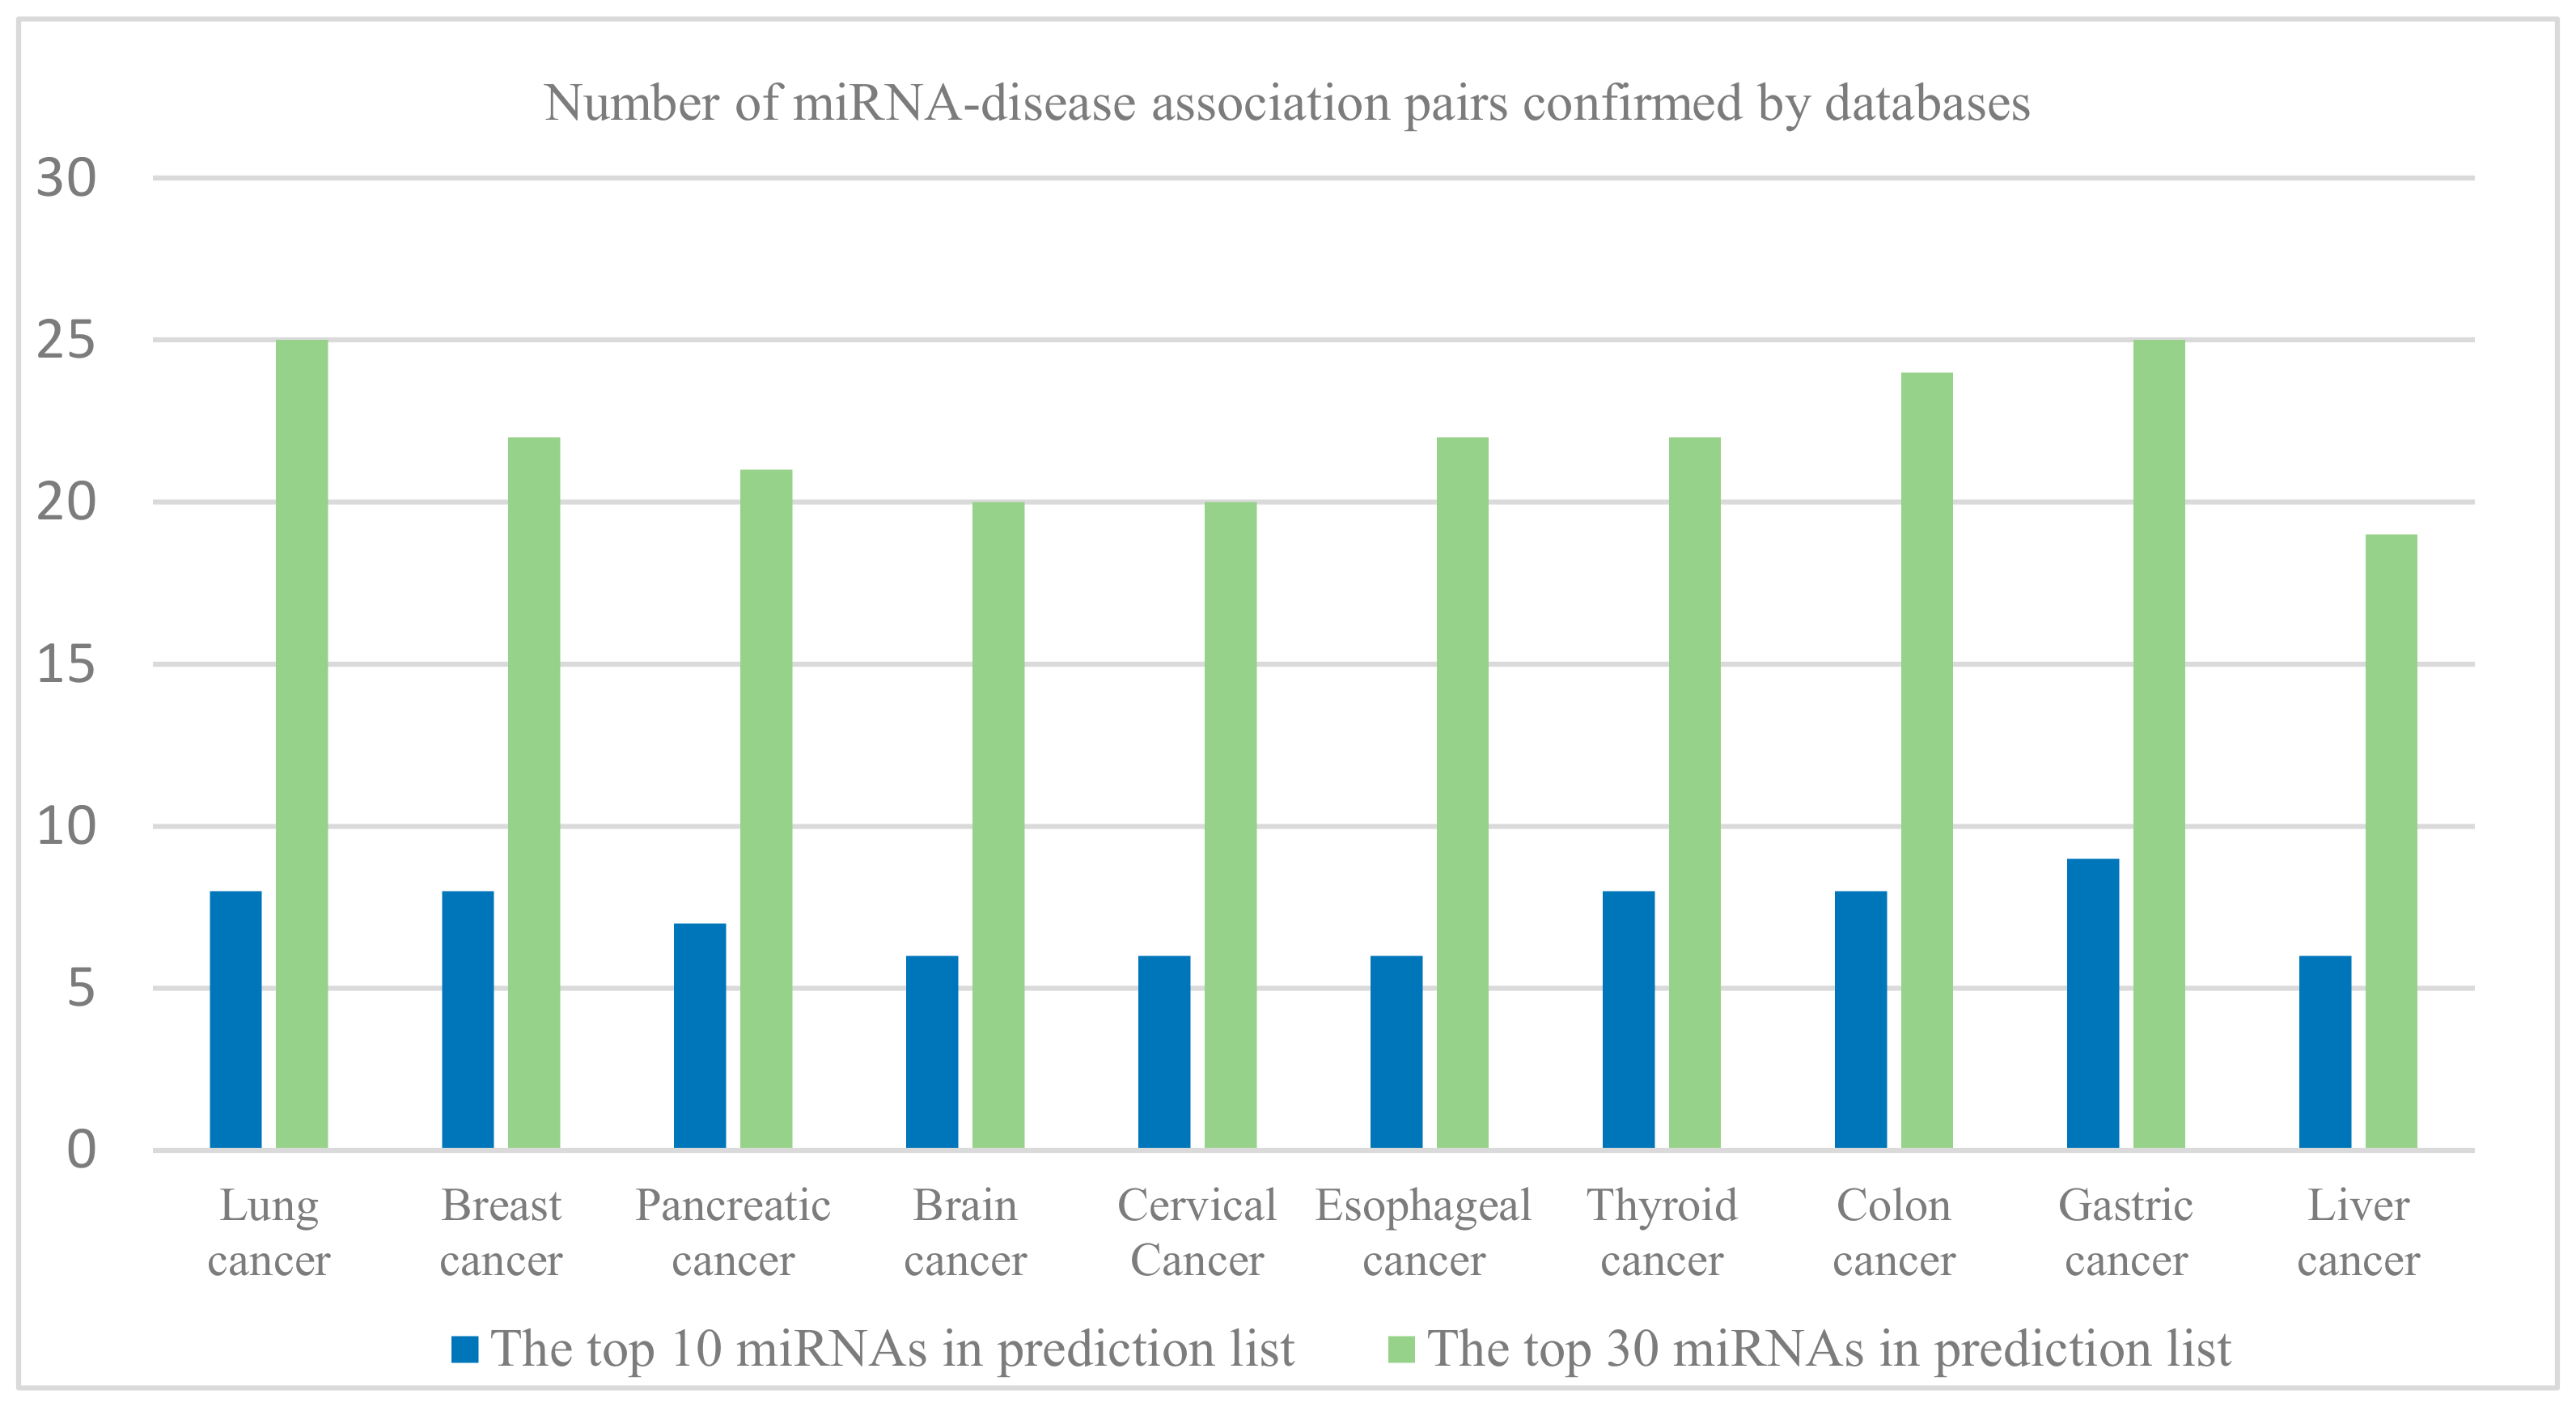
Under the framework of 5-fold CV, we assessed the performance of the RNSSLFN model and three advanced models (ABMDA, LRMCMDA, CFMDA). The comparison of evaluation indexes shows that the performance of RNSSLFN is superior to three different methods (see Table 1 and Figure 2). As can be seen from Figure 2, the average AUC of the RNSSLFN model is 0.9316, which is appreciably higher than the ABMDA model (0.8970), LRMCMDA model (0.8722), and CFMDA model (0.8370). In addition, the average AUPR of the RNSSLFN model is as high as 0.9065, while those of the ABMDA, LRMCMDA, and CFMDA models are 0.8917, 0.8768, and 0.8014, respectively. Other different comparison indexes are shown in Table 1, from which we can see that RNSSLFN also outperforms the other three methods. All of the experimental results demonstrate that the RNSSLFN model has significant advantages in revealing the potential associations between miRNAs and diseases.

3.2. Case Studies

To further evaluate the availability and effectiveness of the RNSSLFN model, we conducted case studies on 10 common cancers, including lung cancer, breast cancer, brain cancer, cervical cancer, gastric cancer, and so on. Specifically, we ranked the miRNAs related to specific diseases in the prediction list based on the prediction score and then searched for supporting evidence in the dbDEMC and miRCancer databases to verify the top 10 and top 30 miRNAs. As shown in Figure 3, for 10 specific diseases, at least 6 of the top 10 miRNAs have been verified in the databases; in particular, 25 of the top 30 miRNAs related to lung cancer and gastric cancer were verified by databases. In addition, this paper also introduced the case studies of thyroid cancer and liver cancer in detail.
Thyroid cancer used to be considered relatively rare in the general population; now it is one of the most prevalent cancers among women under the age of 45. Although thyroid cancer accounts for only 4% of human cancers, the incidence rate has been rising since the early 1980s. The incidence rate of women is higher than that of men; this difference is highest between 15 and 39 years old and then decreases with age. In general, the absolute incidence rate of thyroid cancer in women is almost 4 times that of men. Recommendations for the initial treatment of thyroid cancer include thyroid cancer screening, staging, risk assessment, surgical treatment, radioiodine ablation, and thyroid stimulating hormone inhibition. At present, a new targeted therapy to stunt the growth of tumor cells by inhibiting the tyrosine kinase of thyroid cancer has been used in the treatment of advanced thyroid cancer. Many researchers have proven that some miRNAs are involved in the development of thyroid cancer. In this paper, the RNSSLFN model has been utilized to uncover the potential relationship between miRNAs and thyroid cancer. As shown in Table 2, 22 of the top 30 miRNAs are confirmed by databases. The study of Sondermann et al. [46] shows that the expression level of miR-9 and miR-21 are prognostic factors for the recurrence of thyroid cancer, and they have potential clinical value as biomarkers for predicting the recurrence of thyroid cancer. Wang et al. [47] found that the overexpression of mir-497 can inhibit the proliferation, colony formation, migration, and invasion of cancer cells in vitro and can also inhibit the tumorigenesis in vivo. More importantly, miR-145, miR-106b, miR-210, and other miRNAs that have not been confirmed by databases need to be further explored, and they are expected to be used as new auxiliary biomarkers for the diagnosis of thyroid cancer.
Liver cancer is a common and highly dangerous malignancy. It mainly occurs in middle-aged men, and the incidence rate of men is usually 2 to 4 times that of women. At present, some studies have provided clear evidence that miRNAs are plentiful in the liver and regulate a variety of liver functions. A clear understanding of the miRNAs regulation mechanism will provide a new strategy for the therapy and prognosis of liver diseases. However, the expression pattern of miRNAs and their role in the pathogenesis of liver cancer are not very clear. Therefore, to elucidate the pathogenesis of liver cancer and the potential clinical application value of miRNA replacement therapy, the RNSSLFN model has been used to uncover the potential relationship between miRNAs and liver cancer. As shown in Table 3, 19 of the top 30 potential miRNAs have been proven by databases. Coulouarn et al. [48] evaluated the function of miR-122 and found that the loss of miR-122 in hepatoma cells greatly increased the possibility of the migration and invasion of cancer cells; on the contrary, the recovery of miR-122 could reverse this phenotype. From a clinical application point of view, miR-122 is an important determinant of cancer cell migration and invasion and is also a diagnostic and prognostic marker of liver cancer progression. Besides, the research of Liang et al. [49] showed that miR-125b has certain application value in the treatment of liver cancer due to it being able to inhibit the expression of oncogene LIN28B. Targeting carcinogenic miRNAs is a promising strategy for cancer therapy; the top 30 miRNAs related to liver cancer, which have not been confirmed by databases, may become new targets for early therapeutic intervention.

4. Conclusions

Based on the reliable negative sample selection and improved SLFN, RNSSLFN is proposed to identify the correlation between miRNAs and diseases. RNSSLFN is the first model to select negative samples from unknown miRNA-disease associations by distinguishing up-regulated and down-regulated miRNAs from the MISIM v2.0 server. This is a great innovation, and we think that this strategy of selecting negative samples is more reliable than the previous strategy of randomly selecting negative samples from unknown associations. Furthermore, the improved SLFN realized the adaptive adjustment of hidden layer nodes to resolve the problem of the mutual restraint relationship between the hidden nodes numbers and network performance. Compared with the other three advanced methods under the 5-fold CV, the experimental results confirmed the superiority of RNSSLFN in finding a potential association between miRNAs and diseases. In addition, the case studies on 10 common cancers further demonstrate the ability of RNSSLFN to identify potential candidate miRNAs. RNSSLFN will be helpful to screen promising candidates, accelerate the research on the potential association between miRNAs and diseases, and facilitate follow-up research on the pathological mechanism of diseases.

Author Contributions

Conceptualization, Q.T. and S.Z.; Methodology, Q.T., S.Z. and Q.W.; Software, Q.T. and S.Z.; Writing—original draft, Q.T. and S.Z.; Writing—review & editing, Q.T., S.Z. and Q.W. All authors have read and agreed to the published version of the manuscript.

Funding

This work was funded by the Scientific Research Project of Hunan Province Department of Education (No.20C0480, No.17C0133) and the Project of Science and Technology Plan of Changsha (No.ZD1601071, No.K1705025).

Informed Consent Statement

Not applicable.

Conflicts of Interest

The authors declare no conflict of interest.

References

  1. Fabian, M.R.; Sonenberg, N.; Filipowicz, W. Regulation of mRNA translation and stability by microRNAs. Annu. Rev. Biochem. 2010, 79, 351–379. [Google Scholar] [CrossRef] [PubMed] [Green Version]
  2. Bartel, D.P. MicroRNAs: Target Recognition and Regulatory Functions. Cell 2009, 136, 215–233. [Google Scholar] [CrossRef] [PubMed] [Green Version]
  3. Lee, R.C.; Feinbaum, R.L.; Ambros, V. The C. elegans heterochronic gene lin-4 encodes small RNAs with antisense complementarity to lin-14. Cell 1993, 75, 843–854. [Google Scholar] [CrossRef]
  4. Siomi, H.; Siomi, M.C. Posttranscriptional Regulation of MicroRNA Biogenesis in Animals. Mol. Cell 2010, 38, 323–332. [Google Scholar] [CrossRef]
  5. Sayed, D.; Abdellatif, M. MicroRNAs in Development and Disease. Physiol. Rev. 2011, 91, 827–887. [Google Scholar] [CrossRef]
  6. Chang, T.-C.; Mendell, J.T. microRNAs in Vertebrate Physiology and Human Disease. Annu. Rev. Genom. Hum. Genet. 2007, 8, 215–239. [Google Scholar] [CrossRef] [Green Version]
  7. Xu, J.; Cai, L.; Liao, B.; Zhu, W.; Wang, P.; Meng, Y.; Lang, J.; Tian, G.; Yang, J. Identifying Potential miRNAs–Disease Associations With Probability Matrix Factorization. Front. Genet. 2019, 10, 1234. [Google Scholar] [CrossRef]
  8. Chen, X.; Yin, J.; Qu, J.; Huang, L.; Wang, E. MDHGI: Matrix Decomposition and Heterogeneous Graph Inference for miRNA-disease association prediction. PLoS Comput. Biol. 2018, 8, e1006418. [Google Scholar] [CrossRef]
  9. Ha, J.; Park, C.; Park, C.; Park, S. Improved Prediction of miRNA-Disease Associations Based on Matrix Completion with Network Regularization. Cells 2020, 3, 881. [Google Scholar] [CrossRef] [Green Version]
  10. Ha, J.; Park, C. MLMD: Metric Learning for predicting miRNA-Disease associations. IEEE Access 2021, 5, 78847–78858. [Google Scholar] [CrossRef]
  11. Li, J.-Q.; Rong, Z.-H.; Chen, X.; Yan, G.-Y.; You, Z.-H. MCMDA: Matrix completion for miRNA-disease association prediction. Oncotarget 2017, 28, 21187–21199. [Google Scholar] [CrossRef] [PubMed] [Green Version]
  12. Ha, J.; Park, C.; Park, C.; Park, S. IMIPMF: Inferring miRNA-disease interactions using probabilistic matrix factorization. J Biomed Inform. 2020, 102, 103358. [Google Scholar] [CrossRef] [PubMed]
  13. Hussain, I.; Park, S.J. Big-ECG: Cardiographic Predictive Cyber-Physical System for Stroke Management. IEEE Access 2021, 9, 123146–123164. [Google Scholar] [CrossRef]
  14. Hussain, I.; Park, S.J. HealthSOS: Real-Time Health Monitoring System for Stroke Prognostics. IEEE Access 2020, 8, 213574–213586. [Google Scholar] [CrossRef]
  15. Perez-Iratxeta, C.; Wjst, M.; Bork, P.; Andrade, M.A. G2D: A tool for mining genes associated with disease. BMC Genet. 2005, 6, 45. [Google Scholar] [CrossRef] [Green Version]
  16. Ji, B.-Y.; You, Z.-H.; Cheng, L.; Zhou, J.-R.; Alghazzawi, D.; Li, L.-P. Predicting miRNA-disease association from heterogeneous information network with GraRep embedding model. Sci. Rep. 2020, 10, 6658. [Google Scholar] [CrossRef] [Green Version]
  17. Xu, J.; Zhu, W.; Cai, L.; Liao, B.; Meng, Y.; Xiang, J.; Yuan, D.; Tian, G.; Yang, J. LRMCMDA: Predicting miRNA-Disease Association by Integrating Low-Rank Matrix Completion With miRNA and Disease Similarity Information. IEEE Access 2020, 8, 80728–80738. [Google Scholar] [CrossRef]
  18. Chen, X.; Xie, D.; Wang, L.; Zhao, Q.; You, Z.-H.; Liu, H. BNPMDA: Bipartite Network Projection for MiRNA–Disease Association prediction. Bioinformatics 2018, 34, 3178–3186. [Google Scholar] [CrossRef] [Green Version]
  19. Li, Z.; Liu, B.; Yan, C. CFMDA: Collaborative filtering-based miRNA-disease association prediction. Multimed. Tools Appl. 2019, 78, 605–618. [Google Scholar] [CrossRef]
  20. Peng, L.-H.; Sun, C.-N.; Guan, N.-N.; Li, J.-Q.; Chen, X. HNMDA: Heterogeneous network-based miRNA–disease association prediction. Mol. Genet. Genom. 2018, 293, 983–995. [Google Scholar] [CrossRef]
  21. Luo, J.; Long, Y. NTSHMDA: Prediction of Human Microbe-Disease Association Based on Random Walk by Integrating Network Topological Similarity. IEEE/ACM Trans. Comput. Biol. Bioinforma. 2018, 17, 1341–1351. [Google Scholar] [CrossRef] [PubMed]
  22. Badillo, S.; Banfai, B.; Birzele, F.; Davydov, I.I.; Hutchinson, L.; Kam-Thong, T.; Siebourg-Polster, J.; Steiert, B.; Zhang, J.D. An Introduction to Machine Learning. Clin. Pharmacol. Ther. 2020, 107, 871–885. [Google Scholar] [CrossRef] [PubMed] [Green Version]
  23. Zhang, X.; Yin, J.; Zhang, X. A Semi-Supervised Learning Algorithm for Predicting Four Types miRNA-Disease Associations by Mutual Information in a Heterogeneous Network. Genes 2018, 9, 139. [Google Scholar] [CrossRef] [PubMed] [Green Version]
  24. Liu, Y.; Wang, S.-L.; Zhang, J.-F.; Zhang, W.; Li, W. A neural collaborative filtering method for identifying miRNA-disease associations. Neurocomputing 2021, 422, 176–185. [Google Scholar] [CrossRef]
  25. Xuan; Zhang; Zhang; Li; Zhao Predicting miRNA-Disease Associations by Incorporating Projections in Low-Dimensional Space and Local Topological Information. Genes 2019, 10, 685. [CrossRef] [Green Version]
  26. Che, K.; Guo, M.; Wang, C.; Liu, X.; Chen, X. Predicting miRNA-Disease Association by Latent Feature Extraction with Positive Samples. Genes 2019, 10, 80. [Google Scholar] [CrossRef] [Green Version]
  27. Zhao, Y.; Chen, X.; Yin, J. Adaptive boosting-based computational model for predicting potential miRNA-disease associations. Bioinformatics 2019, 35, 4730–4738. [Google Scholar] [CrossRef]
  28. Meng, Y.; Jin, M.; Tang, X.; Xu, J. Degree-Based Similarity Indexes for Identifying Potential miRNA-Disease Associations. IEEE Access 2020, 8, 133170–133179. [Google Scholar] [CrossRef]
  29. Chen, X.; Wu, Q.-F.; Yan, G.-Y. RKNNMDA: Ranking-based KNN for miRNA-Disease Association prediction. RNA Biol. 2017, 14, 952–962. [Google Scholar] [CrossRef] [Green Version]
  30. Xuan, P.; Han, K.; Guo, Y.; Li, J.; Li, X.; Zhong, Y.; Zhang, Z.; Ding, J. Prediction of potential disease-associated microRNAs based on random walk. Bioinformatics 2015, 31, 1805–1815. [Google Scholar] [CrossRef]
  31. Chen, X.; Yan, G.-Y. Semi-supervised learning for potential human microRNA-disease associations inference. Sci. Rep. 2015, 4, 5501. [Google Scholar] [CrossRef] [PubMed] [Green Version]
  32. Zhang, L.; Liu, B.; Li, Z.; Zhu, X.; Liang, Z.; An, J. Predicting miRNA-disease associations by multiple meta-paths fusion graph embedding model. BMC Bioinform. 2020, 21, 470. [Google Scholar] [CrossRef] [PubMed]
  33. Li, Y.; Qiu, C.; Tu, J.; Geng, B.; Yang, J.; Jiang, T.; Cui, Q. HMDD v2.0: A database for experimentally supported human microRNA and disease associations. Nucleic Acids Res. 2014, 42, D1070–D1074. [Google Scholar] [CrossRef] [PubMed]
  34. Xie, B.; Ding, Q.; Han, H.; Wu, D. miRCancer: A microRNA-cancer association database constructed by text mining on literature. Bioinformatics 2013, 29, 638–644. [Google Scholar] [CrossRef] [PubMed]
  35. Yang, Z.; Wu, L.; Wang, A.; Tang, W.; Zhao, Y.; Zhao, H.; Teschendorff, A.E. dbDEMC 2.0: Updated database of differentially expressed miRNAs in human cancers. Nucleic Acids Res. 2017, 45, D812–D818. [Google Scholar] [CrossRef]
  36. Jiang, Q.; Wang, Y.; Hao, Y.; Juan, L.; Teng, M.; Zhang, X.; Li, M.; Wang, G.; Liu, Y. miR2Disease: A manually curated database for microRNA deregulation in human disease. Nucleic Acids Res. 2009, 37, D98–D104. [Google Scholar] [CrossRef] [Green Version]
  37. Lu, M.; Zhang, Q.; Deng, M.; Miao, J.; Guo, Y.; Gao, W.; Cui, Q. An Analysis of Human MicroRNA and Disease Associations. PLoS ONE 2008, 3, e3420. [Google Scholar] [CrossRef] [Green Version]
  38. Huang, Z.; Shi, J.; Gao, Y.; Cui, C.; Zhang, S.; Li, J.; Zhou, Y.; Cui, Q. HMDD v3.0: A database for experimentally supported human microRNA–disease associations. Nucleic Acids Res. 2019, 47, D1013–D1017. [Google Scholar] [CrossRef] [Green Version]
  39. Huang, F.; Yue, X.; Xiong, Z.; Yu, Z.; Liu, S.; Zhang, W. Tensor decomposition with relational constraints for predicting multiple types of microRNA-disease associations. Brief. Bioinform. 2021, 22, bbaa140. [Google Scholar] [CrossRef]
  40. Wang, D.; Wang, J.; Lu, M.; Song, F.; Cui, Q. Inferring the human microRNA functional similarity and functional network based on microRNA-associated diseases. Bioinformatics 2010, 26, 1644–1650. [Google Scholar] [CrossRef] [Green Version]
  41. Zhou, S.; Wang, S.; Wu, Q.; Azim, R.; Li, W. Predicting potential miRNA-disease associations by combining gradient boosting decision tree with logistic regression. Comput. Biol. Chem. 2020, 85, 107200. [Google Scholar] [CrossRef] [PubMed]
  42. Xuan, P.; Han, K.; Guo, M.; Guo, Y.; Li, J.; Ding, J.; Liu, Y.; Dai, Q.; Li, J.; Teng, Z.; et al. Prediction of microRNAs Associated with Human Diseases Based on Weighted k Most Similar Neighbors. PLoS ONE 2013, 8, e70204. [Google Scholar] [CrossRef] [PubMed]
  43. van Laarhoven, T.; Nabuurs, S.B.; Marchiori, E. Gaussian interaction profile kernels for predicting drug-target interaction. Bioinformatics 2011, 27, 3036–3043. [Google Scholar] [CrossRef] [PubMed] [Green Version]
  44. Li, J.; Zhang, S.; Wan, Y.; Zhao, Y.; Shi, J.; Zhou, Y.; Cui, Q. MISIM v2.0: A web server for inferring microRNA functional similarity based on microRNA-disease associations. Nucleic Acids Res. 2019, 47, W536–W541. [Google Scholar] [CrossRef] [PubMed] [Green Version]
  45. Cheng, Q.; Zhang, M.; Li, Z.; Cao, Y.; He, B.; Feng, W. A Classfication Algorithm based on Self-organizing Neural Network Using Growing-Combination Structure. In Proceedings of the 2020 39th Chinese Control Conference (CCC), Shenyang, China, 27–29 July 2020. [Google Scholar]
  46. Sondermann, A.; Andreghetto, F.M.; Moulatlet, A.C.B.; da Silva Victor, E.; de Castro, M.G.; Nunes, F.D.; Brandão, L.G.; Severino, P. MiR-9 and miR-21 as prognostic biomarkers for recurrence in papillary thyroid cancer. Clin. Exp. Metastasis 2015, 32, 521–530. [Google Scholar] [CrossRef]
  47. Wang, P.; Meng, X.; Huang, Y.; Lv, Z.; Liu, J.; Wang, G.; Meng, W.; Xue, S.; Zhang, Q.; Zhang, P.; et al. MicroRNA-497 inhibits thyroid cancer tumor growth and invasion by suppressing BDNF. Oncotarget 2017, 8, 2825–2834. [Google Scholar] [CrossRef] [Green Version]
  48. Coulouarn, C.; Factor, V.M.; Andersen, J.B.; Durkin, M.E.; Thorgeirsson, S.S. Loss of miR-122 expression in liver cancer correlates with suppression of the hepatic phenotype and gain of metastatic properties. Oncogene 2009, 28, 3526–3536. [Google Scholar] [CrossRef] [Green Version]
  49. Liang, L.; Wong, C.-M.; Ying, Q.; Fan, D.N.-Y.; Huang, S.; Ding, J.; Yao, J.; Yan, M.; Li, J.; Yao, M.; et al. MicroRNA-125b suppressesed human liver cancer cell proliferation and metastasis by directly targeting oncogene LIN28B2. Hepatology 2010, 52, 1731–1740. [Google Scholar] [CrossRef]
Figure 1. The main framework of the RNSSLFN prediction model.
Information 13 00108 g001
Figure 2. The average ROC curve and average P-R curve of RNSSLFN and the other three methods.
Information 13 00108 g002
Figure 3. Number of top 10 and top 30 miRNA-disease association pairs of 10 cancers confirmed by databases.
Information 13 00108 g003
Table 1. The comparison results of four models under different evaluation indexes.
AUCAUPRAccuracyPrecisionRecallF1-Score
RNSSLFN0.93160.90650.83190.82380.84810.8358
ABMDA0.89700.89170.82870.81600.78320.7993
LRMCMDA0.87220.87680.81560.81050.82730.8219
CFMDA0.83700.80140.79780.74430.74210.7434
Table 2. The top 30 thyroid cancer-related miRNAs predicted by the RNSSLFN model. (Column 1: top 1–15 miRNA names; Column 3: top 16–30 miRNA names. I and II represent the association between the miRNA and thyroid cancer, which has been verified in the databases dbDEMC and miRCancer, respectively).
miRNAEvidencemiRNAEvidence
hsa-mir-137I, IIhsa-let-497I
hsa-mir-17Ihsa-mir-210unconfirmed
hsa-mir-18aIhsa-mir-214I, II
hsa-mir-16IIhsa-mir-223I
hsa-mir-150Ihsa-mir-29aunconfirmed
hsa-mir-143IIhsa-mir-29cI
hsa-mir-145unconfirmedhsa-let-7aII
hsa-mir-106bunconfirmedhsa-mir-15aI, II
hsa-mir-19bIhsa-let-21I
hsa-mir-20aIhsa-mir-30aI
hsa-let-7cunconfirmedhsa-let-9I, II
hsa-mir-142I, IIhsa-mir-101II
hsa-mir-29bIhsa-mir-34cunconfirmed
hsa-mir-34aunconfirmedhsa-mir-195II
hsa-mir-199aunconfirmedhsa-mir-203I
Table 3. The top 30 liver cancer-related miRNAs predicted by the RNSSLFN model. (Column 1: top 1–15 miRNA names; Column 3: top 16–30 miRNA names. I and II represent the association between the miRNA and liver cancer, which has been verified by the databases dbDEMC and miRCancer, respectively).
miRNAEvidencemiRNAEvidence
hsa-mir-155I, IIhsa-mir-142unconfirmed
hsa-mir-145IIhsa-mir-15bI
hsa-mir-19aunconfirmedhsa-mir-194I, II
hsa-mir-222Ihsa-mir-141unconfirmed
hsa-mir-16unconfirmedhsa-mir-203II
hsa-mir-146aunconfirmedhsa-mir-101I, II
hsa-mir-126IIhsa-mir-107I
hsa-mir-17unconfirmedhsa-mir-125bI, II
hsa-mir-221Ihsa-mir-106aunconfirmed
hsa-mir-200bIhsa-mir-132II
hsa-mir-20aunconfirmedhsa-mir-100unconfirmed
hsa-mir-122I, IIhsa-mir-375I, II
hsa-mir-1unconfirmedhsa-mir-22II
hsa-mir-181aIhsa-mir-9unconfirmed
hsa-let-7cIhsa-mir-181bI
Publisher’s Note: MDPI stays neutral with regard to jurisdictional claims in published maps and institutional affiliations.

