
UGRansome1819: A Novel Dataset for Anomaly Detection and Zero-Day Threats


1
Department of Informatics, Faculty of Engineering, Built Environment and Information Technology, University of Pretoria, Pretoria 0028, South Africa
2
Department of Industrial Engineering, School of Data Science & Computational Thinking, Stellenbosch University, Stellenbosch 7600, South Africa
*
Authors to whom correspondence should be addressed.
Information 2021, 12(10), 405; https://doi.org/10.3390/info12100405
Submission received: 4 September 2021
/
Revised: 26 September 2021
/
Accepted: 28 September 2021
/
Published: 30 September 2021
Abstract
:This research attempts to introduce the production methodology of an anomaly detection dataset using ten desirable requirements. Subsequently, the article presents the produced dataset named UGRansome, created with up-to-date and modern network traffic (netflow), which represents cyclostationary patterns of normal and abnormal classes of threatening behaviours. It was discovered that the timestamp of various network attacks is inferior to one minute and this feature pattern was used to record the time taken by the threat to infiltrate a network node. The main asset of the proposed dataset is its implication in the detection of zero-day attacks and anomalies that have not been explored before and cannot be recognised by known threats signatures. For instance, the UDP Scan attack has been found to utilise the lowest netflow in the corpus, while the Razy utilises the highest one. In turn, the EDA2 and Globe malware are the most abnormal zero-day threats in the proposed dataset. These feature patterns are included in the corpus, but derived from two well-known datasets, namely, UGR’16 and ransomware that include real-life instances. The former incorporates cyclostationary patterns while the latter includes ransomware features. The UGRansome dataset was tested with cross-validation and compared to the KDD99 and NSL-KDD datasets to assess the performance of Ensemble Learning algorithms. False alarms have been minimized with a null empirical error during the experiment, which demonstrates that implementing the Random Forest algorithm applied to UGRansome can facilitate accurate results to enhance zero-day threats detection. Additionally, most zero-day threats such as Razy, Globe, EDA2, and TowerWeb are recognised as advanced persistent threats that are cyclostationary in nature and it is predicted that they will be using spamming and phishing for intrusion. Lastly, achieving the UGRansome balance was found to be NP-Hard due to real life-threatening classes that do not have a uniform distribution in terms of several instances.
1. Introduction
Network traffic is infected by a plethora of malware and security threats to be managed [1,2]. Security issues to be resolved and managed emanate from the complexity and vulnerability of the network architecture [3,4]. To protect the network, different preventive techniques such as Intrusion Detection Systems (IDSs) were implemented [1,2,3,4]. In essence, an IDS can be stratified as a network-based intrusion detection system (NIDS) that controls networking events such as firewall logs or netflow, and host-based intrusion detection system (HIDS), which monitors events related to the network such as systems logs [5]. Moreover, both NIDS and HIDS can be classified into a tripartite manner: anomaly, hybrid, and signature-based intrusion detection systems (SIDSs) [5,6]. Anomaly-based intrusion detection systems (AIDSs) scrutinize computer networks under normal settings and any divergence will be tagged as intrusions [6]. In turn, the SIDS depends on a prearranged repository of known intrusions to track down a network threat by relying on predefined parameters that determined if a networking event is malicious or not [5]. Consequently, Kasongo and Sun [6] have argued that the SIDS repository should be updated manually by the computer network operator. Lastly, hybrid-based IDSs can be defined as a juxtaposition of both AIDSs and SIDSs [6,7]. For consistency, this article will use the term NIDS to represent an IDS because they have been used interchangeably in the literature [3,4,6,7]. The term “zero-day” attack refers to any and cyclostationary network threat carried out without the knowledge of the network administrator. James P. Anderson wrote the first article about NIDSs in 1980, and his research concentrated on computer surveillance and security threats, and he categorized network threats into internal and external [8]. Then to monitor the network security, the information system (IS) should provide the network administrator with a mechanism that detects unusual network behaviours, such as abnormal connection, and identify the internal/external intruder strategy [7]. However, enough network features should be utilised to train Machine Learning algorithms to be able to detect network threats in real-time and real-life settings [9]. During the attack detection process, the network administrator will then be able to detect the issue based on results produced by trained Machine Learning algorithms [3,5]. The problem faced by Machine Learning is the inability to detect novel network threatening behaviours because its algorithms have been trained with legacy datasets such as the Knowledge Discovery and Data Mining 1999 (KDD99) and the Network Security Laboratory–Knowledge Discovery and Data Mining (NSL-KDD) [9]. With this in mind, this article intends to propose a new dataset to detect zero-day threats. In addition, the research aims to suggest the production methodology of the new dataset. An Ensemble Learning approach has been used to assess this methodology using the Gini Importance, Out-of-Bag (OOB) error, and the Receiver Operating Characteristic curve (ROC). This research demonstrates that the implementation of the Random Forest algorithm applied to the proposed dataset can facilitate accurate results to enhance zero-day threats detection and proposes an approach that detects novel network threatening behaviour captured in the given dataset, but were not captured in previous legacy datasets. The classification problem addressed in this article is to stratify well-known from unknown network attacks. The pivotal contribution of this article can be stated as follows:
- A new dataset production methodology using fuzzy merging.
- The proposition and introduction of a new dataset that contains modern network flow (netflow) and zero-day attacks.
The article is structured as follows: Previous investigations, including ample criticism of existing datasets utilised for the Network Intrusion Detection Problem (NIDP), are debated in Section 2. The employed methodology to build and evaluate UGRansome is explained in Section 3. Section 4 discusses results achieved using Decision Tree and Random Forest classifiers. In Section 5, the conclusions of this research are given.
2. Related Works
This section reviews journals, conference proceedings, and articles on various approaches, techniques, and insights used to design Intrusion Detection datasets for classifying and detecting malware. The demerits and merits of these approaches are also raised during the discussion. The research uses the term legacy datasets or legacy malware to describe the first datasets and aged network threats to be utilised and detected in the NIDL enabling the cybersecurity community to conduct various experiments. Two legacy datasets have been extensively used for the NIDP:
- The Defense Advanced Research Projects Agency (DARPA) dataset. This dataset is compressed into binary and is four GB in size and includes synthetic netflow having approximately 7 M of connection features—where 2 M represents the testing corpus [10]. The DARPA 1999 incorporates tcpdump netflow files extracted from a synthetic network system. One outside the network and the other inside. Additional host-based features have been retrieved from four victimized network systems that include various network threats between Internet Protocols (IPs) [10]. This dataset is outdated because it was created in 1998.
- The KDD99 dataset. It has been derived from the DARPA98 dataset and it is made of 49 M of single connection features with 41 attributes [10,11]. These features are labelled as normal network threats or not. Mohd et al. [12] stated that they have been classified into User to Root (U2R), Denial of Service (DoS), Probing, and Remote to Local (R2L). Similarly, the testing corpus also includes 14 attacks and features that have been stratified into (i) network traffic and basic connection of Transmission Control Protocols (TCPs) [12]. (ii) Content of features collected from the payload information and (iii) number of logins that failed. This dataset is also outdated because it was fabricated in 1999 by the DARPA.
The network traffic flows of the two aforementioned datasets lacked efficient statistical attestation having low rates, victimize hosts have skewed proportion or distribution, only four main attacks types have been categorised with unbalanced distribution (U2R, DoS, Probing, and R2L). The DARPA dataset presents statistical issues and could not enable the detection of novel malware with high accuracy [9]. These limitations have motivated the cybersecurity community to create the NSL-KDD dataset as an improved version of the DARPA and KDD99 datasets. With the NSL-KDD dataset, redundancy has been reduced compared to the KDD99, KDD98, and DARPA datasets [3,13]. Even though current studies in the NIDL still utilise these legacy datasets due to inherent issues and criticisms pointed out, other scientists have also created updated and novel datasets. For instance, the centre for cybersecurity in Australia has created and published the UNSW-NB15 dataset [14]. The Coburg Network Intrusion Detection Dataset (CIDDS-001) has been published by the University of Coburg while the CICIDS dataset was published by the University of New Brunswick. These published datasets aim to provide various types of features such as those relying on updated malware, namely DoS and Bonet, or to retrieve current and realistic netflow under the assumption that netflow features in the current NIDL have changed and evolved since the creation of the DARPA datasets. Hence, building novel datasets such as UGRansome that incorporate cyclostationary and zero-day attack features are becoming crucial. Some of these recent datasets are chronologically listed in Table 1 with a short description of their types and demerits. SDN stands for Software-Defined Networking and IoT means Internet of Things.
2.1. Requirements to Evaluate IDS Datasets
We have mentioned the existence of additional datasets that have been used in the NIDL [9]. This article has just discussed those that are slightly related to the one that we intend to create. We have also identified desirable requirements to evaluate Anomaly Detection datasets and discuss ten relevant prerequisites:
- The year of creation. This requirement represents the date or year in which malware, as well as netflow, were collected. It is more relevant than the year of publication since netflow and novel intrusions appear daily. The UGRansome dataset is created in 2021.
- Availability. With this requirement, one can determine if datasets are publicly available to enable a third party to utilise and assess them. The UGRansome is available on ResearchGate.
- Normal behaviour. This requirement determines if the dataset is made of abnormal and/or normal behaviours. The UGRansome includes normal and anomalous behaviours because it has been built for anomaly detection. If UGRansome does not include instances of normal behaviours, this will represent a severe methodological bias because any dataset intended to support research on anomaly detection must also include instances of normal behaviours. The category of normal behaviour is made of various well-known threats such as SSH, Port Scanning, Bonet, DoS, UDP Scan, and NerisBonet. The authors refer to “well-known” threats as to normal behaviour because these types of network attacks are known by the network administrator and they can also be detected in the current intrusion detection landscape [23,24,25]. The dataset does not incorporate instances of non-threatening behaviour.
- Abnormal behaviour. The requirement specifies the inclusion of abnormality within the dataset. The UGRansome incorporates abnormal netflow patterns. The category of abnormal behaviour includes zero-day threats such as JigSaw, APT, EDA2, Flyper, TowerWeb, NoobCrypt, DMALockerv3, and Globe. The authors refer to “unknown” threats as to abnormal behaviour because these types of network attacks are by the network administrator and they cannot also be easily recognised in the current intrusion detection landscape [26].
- Features. This requirement is relevant to train or test the NIDS. The category consists of 91,360 patterns, whereas the abnormal stands at 56,598. The remaining category (59,576) represents the total of cyclostationary feature patterns in the UGRansome. These patterns are recorded in the normal and abnormal categories.
- Updated attack-flow. A NIDS dataset should at least incorporate real network features updated with a methodology such as Deep Packet Inspection (DPI) that focuses on network traffic management. Managed traffic of the DPI can be extracted and stored in a repository to build the IDS dataset that will include various anomalies detected by the DPI. The UGRansome incorporates real malware and netflow patterns extracted from publicly available datasets. The University of Granada 16 (UGR’16) dataset was used because it was designed in 2018 [27]. The ransomware dataset built in 2019 was also utilised to retrieve salient malware patterns [28].
- Labelling. Records should be accurately labelled as normal or not and the malware category is an important requirement for classification and prediction. The UGRansome features are accurately labelled into three predictive categories such as anomaly (abnormal), signature (normal), and synthetic signature (abnormal and normal). Ransomware families represent abnormal classes while well-known network threats are recorded as a normal category.
- Duration. Datasets are created during a specific period (hours, days, weeks, months, and years). This requirement can also represent the time taken to record a specific network pattern. The UGRansome was produced using extracted malware and netflow patterns from publicly available datasets relinquished in 2018 and 2019.
- Documentation. A dataset description is an important requirement to understand its characteristics, merits, and demerits. This article serves as the UGRansome documentation.
- Format. Usually, datasets have been built into different formats such as csv, pcap, and tcpdump [9]. The UGRansome is formatted in a csv format.
Figure 1 illustrates various outdated datasets that failed to solve the problem of novel network threats detection in the current NIDL [9]. These datasets (DARPA, KDD99, and NSL-KDD) have been published and extensively used, but they systematically incorporate legacy malware that no longer attacks current network systems [9] (see Figure 2). As such, this research is attempting to utilise a novel palliative, such as the creation of a new dataset that includes novel anomalies with cyclostationary behaviours to address the issue of zero-day threats recognition.
2.2. Novel Network Threats
This section presents a recent taxonomy of novel network threats whilst trying to differentiate them from legacy malware included in outdated datasets presented in Figure 2 and discussed by Hindy et al. [9] or Moustafa et al. [29]. These network threats might be stratified as presented in the following Figure 3 (SSL stands for Secure Socket Layer).
In this article, ransomware can be thought of as novel malware or zero-day attacks, and they are stratified into different families incorporated in the UGRansome. It is important to note that ransom software (commonly referred to as “ransomware”) can attack different platforms, especially computer networks (Figure 4). Recently, the Internet of Things (IoT) has also been infiltrated by this kind of malware and will continue to infiltrate other platforms such as schools, universities, governments, and hospitals [30]. It is, therefore, imperative to understand different ransomware families and their infiltration mechanisms. There are two types of ransomware, the first encrypts the victim’s data and the second prevents them from accessing the system [28,30,31]. An overview of the ransomware infiltration process is shown in Figure 4, where it has been subdivided into four phases (infection, command, destruction, and extortion). The network and server circles represent the vulnerable platforms, while the encryption circle illustrates the attack technique that can also lock the platform. The bitcoins circle represent the ransom payment mode in cryptocurrency.
2.3. The Evolution of Ransomware
PC Cyborg is the first documented ransomware that used encryption of files. Nevertheless, malware of this kind appeared. Examples such as “Robbinhood,” “Ekans,” “Ryuk,” and “Seftad,” among others, have evolved exponentially since 1990 (Figure 5). Similarly, novel infiltration strategies were implemented, and new algorithms based on encryption were created thereafter. Moreover, variants such as Advanced Persistent Threats (APT) were appearing from 2015 to 2020 (Figure 5) (“CryptoLocker”, “Locky”, “JigSaw”, “LockerGaga” and “SamSam”). With the COVID-19 pandemic since 2020, zero-day malware are even switching to COVID-19 themes and use various tactics to launch different attacks on hospitals, and a novel ransomware-type named CovidLocker was created [30] (see Figure 5 that depicts the year distribution of ransomware from 1989 to 2021). Most of these attacks use various infiltration approaches such as phishing or spamming [28,30].
According to Oz et al. [30], the financial damages caused by ransomware amounted to over 1 Billion USD. However, the actual financial damages are probably much higher than this number because victims remain silent about the attack and pay ransoms without divulging the incident, while hackers do not often publish datasets from victimised networks. A descriptive statistic of the ransomware dataset used in [28] is illustrated in Figure 6 with the Locky malware generating the most significant financial damages recorded in bitcoins (BTC) and USD [28].
Generally, email links and attachments are the most common infiltration techniques use by ransomware. If the victim downloads the attachment or clicks on the link provided, which contains the threats, all files might be made inaccessible via encryption until the victim pays the ransom. Therefore, this type of infiltration will need various features to operate, such as addresses use for transactions, the ransom cost, type/cluster, behaviour (cyclostationarity), directory and much more (see Figure 7, where the most common ransomware features have been presented). UGRansome involves specific features, such as the financial damages caused by the zero-day threats, seed/expended addresses, each threat cluster and cyclostationary netflow patterns retrieved with the principal component analysis (PCA) (Figure 7).
Figure 8 presents the virus total/share datasets as the most used in the NIDL. These types of datasets are build from online scan search engines and incorporate features presented in Figure 7, namely, opcodes, malicious files, registries, malicious directories, API calls, and noise or entropy. The personal wallet and bitcoin datasets are mostly used in the blockchain field. The Alexa/MACCDC traffic datasets contain recent threatening behaviours of various websites. These datasets include various patterns: (i) the popularity of the victimised website and the number of visitation. Other malicious operations can also be incorporated. For instance, (ii) the malicious , which generally hijack CPU consumption to mine cryptocurrency; (iii) abnormal external links that are malicious by redirecting victims to malicious websites; and (iv) web threats, that are implemented to steal payment card information from checkout forms.
2.4. Cyclostationarity of Zero-Day Threats
In 1996, the concept of netflow was created to extract IP flows when they exit or penetrate a network [32]. By this means, it became possible for the network administrator to (i) assess the destination and source of networking traffic, (ii) determine the category of services, and (iii) understand the causes of intrusion. A cyclostationary netflow can then be thought of as network traffic with statistical characteristics that vary with time [32]. A cyclostationary malware can be defined as any zero-day threat that changes its behaviour based on the system constraints. For instance, the intrusion methods used by ransomware can varies by using different intrusion techniques such as phishing, spam, and infected files. However, it is realistic to posit that the ransomware might have constant properties that can be utilised to detect it. For instance, the address used for anonymous transactions might be identical for certain attacks. The UGR’16 dataset includes cyclostationary netflow and it is made of well-known (normal) malware extracted from an internet service provider (ISP) [27]. UGR’16 is subdivided into two corpora (Calibration and TEST). The Calibration corpus was created in 2016 from March to June, while the TEST corpus was designed from July to August. UGR’16 integrates various malware categories, namely secure shell (SSH), scan, spam, Bonet, DoS, and port scanning [27]. The UGRansome dataset integrates them as normal behaviours. All pattern categories of the UGRansome have been stratified as follows:
- The category of synthetic and signature malware. It represents characteristics of well-known as well as unknown attacks. A considerable number of signatures have been implemented to detect well-known malware, but there is still ongoing work towards the design of signatures or keys detecting unknown ones. This category exhibits both normality and abnormality.
- The category of signature malware. It depicts well-known malware with available keys that have been released and updated regularly. This type of malware can be effectively detected using specific signatures because their behaviours are known. The signature category portrays normality.
- The category of anomaly malware. It is a set of unknown malware for which signatures or keys do not yet exist. Abnormality is illustrated by this category that includes the most zero-day attacks.
A numerical description of the UGR’16 netflow is illustrated in Figure 9, which demonstrates that this dataset is imbalanced because of the Spam malware that has the highest representation in the TEST corpus. Similarly, the UGR’16 has four types of source ports (5068, 5066, 5062, and 5061) scanned from 5000 to 5059 [27]. Table 2 portrays relevant features of this dataset, while Section 3 delves deeper into the feature selection and engineering process.
Various researches, such as [33,34,35], have revealed a decrease in the effectiveness of IDS frameworks. Association rule techniques are usually implemented to select the most efficient properties from IDS datasets, and Machine Learning algorithms are utilised to assess both false alarm rates and precision. Results demonstrate that the UNSW-NB15 dataset has better properties than the KDD99 dataset. Three benchmark datasets used for the NIDP that use Machine Learning algorithms have also been scrutinized in the current NIDL [36]. The experiment is conducted with supervised algorithms, such as Neural Network, which segregates the differences between actual and synthetic netflow. A rapid Feature Selection algorithm that pinpoints minor data source quality of features has also been used [37]. The differences in arbitrary variables are applied to discover the integrity of features. The NSL-KDD and KDD99 datasets use a legacy version of the malware, thereby negatively impacting their sureness. The UNSW-NB15 dataset is then suggested for testing and training the AIDS model performance [38,39,40]. Nonetheless, the UNSW-NB15 dataset has few disadvantages, namely the inclusion of unrealistic malware, reliability problems, and imbalanced features. The CICIDS 2017 dataset [21,41] is proposed as the most reliable data source for testing and training NIDS models, especially the AIDS due to its user’s profile comportment, which focused on SSH, FTP, emails protocols, HTTPS, and HTTP. Similarly, the CICIDS 2017 dataset is reasonable and uses updated malware [42]. Analytical research based on the CIC-IDS-2017 dataset with Machine Learning algorithms has used the K-Means and K-Nearest Neighbour algorithms to assess the Machine Learning model complexity [43]. Detection techniques are trained to identify anomalous features dependent on Machine Learning and Artificial Intelligence for anomaly detection and illustrate an autonomous capacity to differentiate abnormal from normal system actions. The AIDS framework has been suggested using Deep Learning and Machine Learning for stratifying lines connection into binary or multi-classes [43,44]. An attempt is made to enhance the AIDS Accuracy for performing the stratification of binary class. The problem appears in multi-class malware. Predominantly, most of the data sources in cybersecurity are imbalanced. So, it is necessary to use robust metrics to assess a NIDS based on the nature of testing and training data. Although, the performance accuracy enhancement reaches up to 99.00% in some of the current work. In whatever way, depending only on accuracy does not mimic the actual NIDS performance because the model is prone to empirical errors for the minority than the majority class and vice versa. Disregarding the norm of the classification error, sensitivity, confusion matrix, and recall, affect the evaluation efficiency. Besides, very little studies concentrate on IDS efficiency, such as testing time, training time, detection time, memory consumption, and CPU overload. Thus, the selection of the most suitable performance evaluation criterion is becoming crucial for the NIDP [45,46]. In turn, Data Science techniques implement feature selection by utilising a tripartite methodology, such as Filter, Hybrid, and Wrapper [47]. The anomaly detection algorithms can spot relevant features to detect malware when used in combination with Feature Selection algorithms. The aim of using Feature Selection techniques is to enhance the malware detection performance of NIDS models and optimise their detection rate and time [48]. Most of the studies opt for a Feature Selection over enhancing the Intrusion Detection algorithms to resolve the false alarm problem in the NIDL. However, downgrading the parameters or features can lead to overfitting that biases Machine Learning algorithms toward specific malware categories [49]. Additionally, Feature Selection cannot detect certain malware if the subset is not normalised with labelled features and some parameter functions that substantiate the results. Setting up the Feature Selection for novel malware detection might be challenging due to the lack of features [50]. The examination of current researches of NIDSs reveals that existing studies are not meant for gauging IDS models using Ensemble Learning, but concentrate on enhancing the recognition of specific algorithms. In addition, the current Machine Learning algorithms are yet to produce optimal performance. Table 3 has identified various demerits and aspects of different existing studies that focused on the selection of datasets, validation problems, and evaluation metrics. Table 3 depicts that most of the current studies only depend on accuracy to assess the performance of NIDSs. Furthermore, validation problems in which very few existing studies have contrasted their work with the trending AIDS. Lastly, a standardized benchmarking approach is lacking in the current literature for Ensemble Learning models. For that reason, it is necessary to come up with a concise benchmarking approach for assessing and testing the performance of the Ensemble Learning models in the current NIDL. For instance, the degree of freedom of the Machine Learning model was not considered in [3] to evaluate the number of adjustable parameters or weights and [51] suggested to fine-tune “hyper-parameters” in the framework doing the learning, but it is still not an optimal evaluation approach. In [52,53], various assessment methods have been suggested to test and assess Machine Learning models without mentioning the confusion matrix. Recently, Maseer et al. [54] have used the CICIDS 2017 dataset to evaluate the Machine Learning model but the time complexity and confusion matrix were not considered. The discussion of the validation drawbacks presented in [3,51,52,53,54] is summarised in Table 3.
3. Materials and Methods
The identification of zero-day threats using Ensemble Learning techniques can be implemented in two phases—namely, Feature Extraction and classification. The Feature Extraction retrieves relevant patterns from a given dataset by providing features that best represent the original data source while the classification technique aims at providing zero-day threats taxonomy. Our proposed framework relies on Ensemble Learning algorithms, which can detect ransomware and also provide precise predictions of cyclostationary zero-day attacks. Ensemble Learning refers to a specific Machine Learning method of training a model of weak classifiers. The model is in the following form:
where each is a Machine Learning algorithm that takes an observation x as input and returns a value indicating the class of that observation. The sample classifier is positive if the sample is in a positive cluster and negative otherwise. Each weak algorithm produces an output or hypothesis for each sample in the training set. At each iteration, a specific weak algorithm is selected and assigned a coefficient such that the sum of the training error of the resulting ensemble classifiers is optimized:
is the ensemble classifiers that have been built up to the previous stage of training, is the error function and
is the algorithm that is being considered for addition to the final classifier. The Feature Extraction and classification steps required data gathering, dimensionality reduction with PCA, model building/testing, and model evaluation to produce final results. Figure 10 portrays processes required in the proposed methodology that begins with data gathering and ends with the model assessment phase.
3.1. Data Gathering
The gathering of features from the UGR’16 and ransomware datasets is a crucial step for the Machine Learning algorithms to achieve successful results. In this research, extracted features from the aforementioned datasets are triangulated and the Decision Tree and Random Forest algorithms are trained on them to accurately delineate the requirements for implementable applications of the Ensemble Learning model. This Ensemble Learning model uses the UGR’16 files presented in Table 4. However, Table 4 shows that the selected corpus is imbalanced with the blacklist malware having the highest proportion. The collector rel-outgoing.csv file is used to extract ransomware features. This file is also imbalanced due to the CryptXXX malware proportion (Figure 11).
The UGR’16 dataset is obtained from Maciá-Fernández et al. [27] (https://nesg.ugr.es/nesg-ugr16/). In turn, the ransomware dataset was obtained from Paquet-Clouston et al. [28], but Zenodo was utilised to retrieve it (https://zenodo.org/record/1238041#.YQ5wPogzbIU). A description of the UGR’16 features has already been provided in Table 2 (Section 2.4). The features of the ransomware dataset include the following:
- BTC: this refers to the total amount of Bitcoins paid for the ransomware.
- USD: this is also the total amount of USD paid for the ransomware.
- Cluster: this represents the cluster assigned per ransomware. This cluster is a numerical value that has been assigned for each ransomware.
- Seed and expended addresses. An address used by the ransomware to anonymously receive bitcoins or USD. This address is a string with an alphanumeric.
- Ransomware. The name of the zero-day threat. For instance, WannaCry, Locky, APT, Globe, JigSaw, EDA2, and SamSam.
The class labels of the Machine Learning model (signature, synthetic signature, and anomaly) and the presented features are utilised to build the stratification framework.
3.2. Principal Component Analysis
Machine Learning algorithms are widely used to address a range of classification and prediction issues. The unsatisfactory performance of Ensemble Learning techniques originates from underfitting or overfitting features. This study confirmed that the elimination of irrelevant features has guaranteed the performance of selected algorithms and sped up their computation. PCA was used on the UGR’16 and ransomware datasets to extract relevant features. The features produced by the PCA was manually triangulated and merged in the final and normalised UGRansome dataset. The PCA algorithm can be viewed as the sampling method of this research and can be formulated as follows:
where and are stochastic having n-dimensional input features x with a matrix having zero mean, the mathematical formulation of the covariance is stated in Equation (4). The computation of into output features is linearly implemented:
Q represents orthogonality of the n*n matrix type with i columns viewed as eigenvectors of that matrix. The mathematical formulation of eigenvalues that need to be solved is:
Equation (5) ranges from 1…n with as the new component representing the ith principal component. The PCA algorithm relies on data factorisation that uses a set of parameters that maximize feature variance and can be utilised to classify relevant information from un-normalized datasets. However, the disadvantage of PCA is that features should be standardised before its implementation for the algorithm to produce accurate results. Table 5 depicts the PCA results where the most relevant features are the timestamps, IP address, network protocol, malware extraction date, and network flag.
It has been found that there is a timestamp fluctuation of most scan threats (Figure 12). The timestamp is used to determine the moment a threat packet is flooded through various access devices of the system. The Scan malware timestamp is inferior to one minute.
IP addresses have been classified into different classes during the data labelling process and each valid IP address belongs to a specific range (Class A: 1-126, class B: 128-191, class C: 192-223, and class D: 224-239). Nonetheless, class A and C are the most dominant IP addresses in this corpus (Figure 13). Masking IP addresses into four classes is not an arbitrary choice, but the aim is to secure the identity of the host by protecting its personal information from hackers, advertisers, and unknown third parties.
Lastly, the UDP and TCP are also the most important network protocols used by various network threats (Figure 14 and Table 5).
The overall experiment indicates that the selected UGR’16 files are imbalanced. The expanded rel-outgoing.csv file was the second file used to extract ransomware features. This file has 28,104 rows and eight columns. Features extracted from this file are shown in Table 6 with the Locky malware classified as the most relevant ransomware (27,423).
Extracted seed/expended addresses are condensed to eight strings during the data labelling process. This is beneficial in terms of data privacy and the computation of Machine Learning algorithms. For instance, an address type 1Q8vibLr8Tora3jtSVUBj1yjF presented in Figure 15 is shortened to 1Q8vibLz.
Results of the Feature Extraction reveals that the address type 1DA11mPS generates more financial damages (Figure 16).
This corpus was unclean, messy and prone to error. It was thus crucial to perform a presence checking while building UGRansome to check that features have been captured properly and null or empty fields were not used or considered in the sample. The length checking checked for the length of the field. The range checking checked for a field range: for instance, the port number, and timestamp ranges. The PCA algorithm extracted additional zero-day attacks, namely EDA2 and Globe. New addresses have been extracted for the Locky family (1dice8EM) and DMALockerv3 (1dice6Yg). In general, most zero-day threats use different addresses for anonymous transactions. The challenge is the use of heterogeneous, imbalanced, and noisy data that complicates the implementation of Machine Learning algorithms to classify, predict, and detect novel network anomalies. To resolve this issue, features have been pre-processed using a Feature Engineering approach that constructs the most structured and sustainable dataset suitable for processing (Figure 17). Hence, Feature Engineering can be defined as the main solution used to design the UGRansome dataset. It consists of translating structured or unstructured feature variables into new variables that can be processed by Machine Learning algorithms. Extracted features of the UGRansome have been manually reduced, merged, tabulated, and transformed during the Feature Engineering phase (Figure 18). The format of the final dataset is presented in Table 7 with quantitative and qualitative data that can be view as numeric and categorical features.
The VIM package of RStudio has been used to detect missing values of the dataset. In Figure 17, missing values should be indicated with a red colour. Hence, the UGRansome is created without missing values since it contains no attributes marked with red (see Figure 17). The VIM package can be used in RStudio to visualize imputed and missing values that pose a serious problem in every Machine Learning project. VIM, on the contrary, helps not only to spot missing values but also to extract insights into other properties of the quality of features.
Three RStudio functions have been used during the data pre-processing phase to translate instances of attributes presented in Table 7. The suppressWarnings (column) suppresses bias in the transformation of numeric features. The factor (column) translates a variable data type into a categorical feature while the numeric (column) transforms it into a numerical value. The numeric ( ) and factor ( ) functions are used in R to transform and distinguish feature patterns (numeric and categorical). The transformation of extracted features using the aforementioned R functions improves the Machine Learning efficiency. The source code used in this research and the UGRansome dataset has been made available to support reproducible experiments in cybersecurity (https://www.researchgate.net/publication/342200905_An_Ensemble_Learning_Framework_for_Anomaly_Detection_in_the_Existing_NetworkIntrusionDetectionLandscape, Public files/Ugransome.zip). The data pre-processing unit has been commented out in the given code.
3.3. UGRansome Model
The research followed the approach given in Figure 19 to build the UGRansome dataset. The UGR’16 and ransomware datasets are considered as sources from which relevant network patterns are extracted using the PCA algorithm (Figure 18). The fuzzy merging has been utilised as a manual and intuitionistic Feature Engineering method that uses these patterns and triangulates them to achieve the UGRansome balance (Figure 18 and Figure 19).
The advantage of using triangulation is that drawbacks of one dataset (UGR’16) can be compensated by the advantages of the other dataset (ransomware) because they share similarities. As such, the reliability and credibility of results can be improved to minimise false interpretation of zero-day threats behaviours. The fuzzy merging approach is an important paradigm that enables the combination of normal and abnormal attack classes. Data points are first extracted from their original repositories which contained the aforementioned csv files (this extraction methodology is similar to Feature Selection). Extracted data points are then translated via Feature Engineering into a format that makes them suitable for Machine Learning computation. The fuzzy merging transformation and selection technique include: (i) dimensionality reduction that removed irrelevant columns and row-data from original data sources, (ii) applying data fusion and processing, (iii) and loading processed features in a specific directory. This study demonstrates that extremely complex data improves the classification performance of the Random Forest algorithm. Hence, this fuzzy merging approach incorporates two stages—namely, data cleansing and modelling.
3.4. Data Cleaning
The data cleaning process requires the deletion of inaccurate, redundant, and obsolete features as well as correcting typos and detecting erroneous data. With data modelling, features are labelled with three predictive outputs (anomaly, signature, and synthetic signature). Network flags have been cleaned because they contained dots that have been removed for certain flags. These dots could bias the computation of Machine Learning algorithms. Files used to extract relevant network patterns contained missing values that have been excluded from the UGRansome dataset (Figure 17). Lastly, the predictive classes of various malware have been also condensed, the anomaly category is labelled with A, the synthetic signature category with SS, and the signature category with S (Figure 18 and Figure 20).
3.5. Data Modelling
This section introduces and proposes the new dataset, which is derived from these two aforementioned datasets. Normal features have been retrieved from the UGR’16 and merged with zero-day threats of the ransomware dataset (Figure 18 and Figure 20). The UGRansome data structure is presented in Table 8.
This data structure is divided into three predictive classes: SS, S, and A. Similarly, these classes are also subdivided into 16 zero-day attacks that represent abnormality: Locky, APT, WannaCry, TowerWeb, Globev3, EDA2, JigSaw, Cryptohitman, CryptXXX, CryptoLocker2015, CryptoLocker, NoobCrypt, DMALocker, Flyper, SamSam, and Globe. Lastly, instances of normal behaviours correspond to a specific well-known malware: DoS, Bonet, Spam, Scan, SSH, Port Scanning, Blacklist, UDP Scan, and Nerisbonet. Figure 20 and Table 8 present the UGRansome model with well-known malware, zero-day attacks, and their category (S, SS, and A). This is the most important model of the dataset as it will be used to train and test the recognition and predictions of cyclostationary and zero-day malware. Figure 21 visualises the UGRansome features in terms of network protocols. The TCP remains the network protocol with the highest proportion because it is widely used for web applications and to verify the quality of packets travelling between two network nodes.
Figure 22 visualises the UGRansome features in terms of zero-day threats and their respective timestamps. CryptXXX and Globe can be thought of as the ransomware that required the most timestamp constraints. The association between ransomware families and timestamps is justified by keeping the attack records when the packet is being created, exchanged or deleted. The timestamp is valuable to record the time taken by the network threat.
Lastly, Figure 23 depicts the most relevant features of the UGRansome with IP addresses of class C having the highest proportion. The required amount of data entailed for a successful Machine Learning model relies on different factors, such as the complexity of algorithms used and the problem that depends on functions utilised to receive various inputs and compute corresponding output values. In turn, the complexity of selected algorithms results from attempting to identify hidden relationships or correlations between output and input pairs. The UGRansome dataset has 207,534 rows and 14 attributes, and this determines how much data is required to train and test the Machine Learning model, but it is the number of rows that matter as well as the sampling frequency.
The UGRansome data structure has a uniform distribution that can be summarised as follows:
- The TCP has the highest number of features (92,157) in terms of network protocols.
- AF has the highest number of features (72,814) in terms of network flags.
- Locky has the highest number of features (33,870) in terms of ransomware.
- The address type 1DA11mPS has the highest number of features (82,048) in terms of seed/expended addresses.
- IP addresses of class C have the highest number of features (95,508) compared to class A, B, and D.
- The SSH attack has the highest number of features (34,972) compared to Spam, Blacklist, UDP Scan, DoS, and Bonet attacks.
- The signature (S) attack prediction has the highest number of features (91,360) compared to the anomaly (A), and synthetic signature (SS). This can be seen in Figure 24.
Figure 25 illustrates the behaviours of normal attacks in the UGRansome dataset. The UDP Scan uses the lowest degree of netflow because it allows fast packets flooding. However, this process can also cause data loss by creating vulnerability endpoints for DoS attacks.
Figure 26 depicts the proportion of abnormal attacks in the UGRansome dataset. These network attacks represent zero-day threats. The Razy malware utilises the highest degree of netflow. It is a zero-day threat that uses asymmetric encryption techniques to encrypts files by appending the “.razy1337 ” or “.razy ” extension to the name of the file that has been encrypted.
Figure 27 shows the uniform distribution of the UGRansome dataset. Normal and abnormal attacks represent 9% of the dataset.
3.6. The Final Construction of the UGRansome Dataset
The final construction of the UGRansome dataset is explained in this section. The dataset is designed for Anomaly Detection and should contain a mixture of normal and abnormal network behaviours. Normal features patterns represent 41% of the dataset (9 + 18 + 14) while abnormality constitutes 44% (9 + 19 + 16). The remaining 15% reflects the prediction attribute that can be normal or abnormal (44 + 41 + 15 = 100%). The category of normal class attacks such as UDP Scan and Bonet represents 9%, while this is also true for the category of abnormal class (ransomware). This uniform distribution was achieved manually by compensating the number of extracted features that were not equally distributed in the original data sources. The IP addresses (18%) and network flags (19%) are less uniformed with a slight difference. The network protocols (14%) and seed/expended addresses (16%) have a discrepancy of two percent. Each feature pattern was manually recorded in the UGRansome dataset to belong to the abnormal or normal category (see Figure 28).
3.7. The Balance of the UGRansome
When discussing the dataset balance, one should not reduce the notion of balance to the notion of uniform distribution. For a dataset to be considered balanced, the proportions of different types of network behaviours captured in the dataset should correspond with informed and intuitive judgments. For instance, the proportions in which different classes of threatening network behaviour occur in real-life should correspond to proportions in which they occur in the UGRansome dataset. This section discusses the balance of the UGRansome concerning this understanding. First, the proportion in which different classes of threatening network behaviour occurred was extracted from real-life using two existing datasets, but contained imbalanced patterns [27,28] (see Figure 3 and Figure 13, Figure 14 and Figure 15 where each of the threatening network behaviour classes has a different number of instances). Second, to solve this problem, a fuzzy merging method was utilised on extracted patterns to implement the dataset balance (Figure 29). Third, this research reveals that getting a perfectly balanced dataset with the same number of instances for each category can be view as an NP-Hard problem in Data Science.
3.8. Testing UGRansome
This research uses cross-validation that can be thought of as a Machine Learning technique utilised to approximate the skill of a model on unseen features. It uses a set of limited records to approximate how the Machine Learning model performed during the training stage. It is a well-known Machine Learning method due to its simplicity and generally produces less biased estimation/prediction compared to other methods [6,20]. In short, cross-validation splits the data source into a training partition (80%) and the remaining partition (20%) is used as a testing set. This research is also using the concept of Ensemble Learning that requires training the data and test features in various ways [55]. The first step is to build an ensemble of Machine Learning classifiers. The second step is to integrate the decisions given by these classifiers into a novel ensemble classifier. The final-step model learns by combining the most suitable and optimal predictions/accuracy from various first-step models [55]. The bagging approach has been used with two phases. First, the Decision Tree and Random Forests algorithms are trained on the UGRansome dataset. The prediction of the Decision Tree and Random Forest is then stored. However, each observation in the UGRansome dataset is connected to the value it is expected to predict or estimate. The second phase derives the expected prediction [55]. This ensemble approach aggregates the Decision Tree and Random Forest into a base learner to output the expected results. A Decision Tree algorithm utilises a supervised learning approach to resolve Machine Learning classification problems. Other tree models can also be used as classification trees when targeted variables accept inputs as discrete values. The major parts of a Decision Tree are branches, leaves, and nodes. The set of attributes resulting in a class label are represented by branches while leaves depict each class label [54]. These branches operate with continuous and discrete data. The Decision Tree technique splits the samples into homogeneous categories based on predefined splitter parameters. Nonetheless, this algorithm faces an overfitting problem that can be solved by implementing boosting and bagging algorithms. Discrete data are well suited for the Decision Tree algorithm [54]. As already stated, it faces an overfitting problem that can be rectified by the Random Forest algorithm which averages various deep Decision Trees. The Random Forest is also an Ensemble Learning technique that solves regression and classification problems [54]. This Machine Learning algorithm constructs various Decision Trees within the training time scale and outputs the category of a specific feature by executing a stratification function to produce enhanced results [54,55].
3.9. Evaluation of the Machine Learning Method
This study is using the accuracy metric to assess the Machine Learning method. The formula computing this metric is given (FP stands for False Positive and FN is the False Negative):
this metric refers to the difference of accurate predictions for both TP (True Positive) and TN (True Negative) of malware compared with all tested cases. The sensitivity metric is also used to compute the number of accurate classifications penalized by the occurrence of missed observations:
The specificity metric is used to measure the proportion of misclassified features. The mathematical formulation computing the specificity is as follows:
The confusion matrix is also used to visualise the performance of selected Ensemble Learning algorithms. It is a matching matrix with each row representing the observations in a specific category and each column portraying the observations in a predicted category, or vice versa (Figure 30). In Figure 30, FP and FN represent the occurrence of misclassified observations belonging to a specific category. TN and TP represent correct classification.
The classification error is used to present the incorrect prediction rate. The mathematical formulation of the classification error is given in Equation (10). Lastly, the ROC curve is also utilised to plot the sensitivity against the specificity.
4. Results
4.1. Computing Environment
The Decision Tree and Random Forest algorithms were trained with the UGRansome features using Rstudio with the library. Experiments were executed on a Windows 10 Operating System computer with a 64-bit Intel CPU (1600 Mhz).
Results of the Ensemble Learning Algorithms
The testing set has 186,780 observations with 14 variables. It was important to drop the level for both training and testing sets before the construction of the Machine Learning model. The number of variables tried at each split (mtry) is three and the Random Forest model is using 10 trees. Its confusion matrix result is presented in Table 9 with a decrease of the classification error for synthetic signature (SS) categories indicating accurate recognition of various threatening behaviour for which signature keys are anomalous (known and unknown).
The results of the Random Forest prediction are illustrated in Table 10 with signature (S) categories having an occurrence of 81,602. This result confirms that the Random Forest can still accurately detects well-known network threats such SSH, Bonet, and UDP Scan.
The Accuracy of the prediction presented in Table 10 is depicted in Table 11. The anomaly (A) category has been accurately predicted with 99% of accuracy. This indicates that the Random Forest can still accurately recognise threatening behaviour that is unknown to the network administrator.
The overall Accuracy of the Random Forest model is 99%, which is similar to the results obtained by [56,57,58,59,60]. The most important features are depicted in Figure 31 that presents the Mean Decrease value that measures the importance of a variable to estimate the target variable values of all the trees used by the Random Forest model [54]. It shows a higher Mean Decrease in Gini, indicating higher variable relevance. These variables are displayed and sorted in the variable relevance plot implemented for the Random Forest. The most relevant variables to this model are the highest in Figure 31 and have the greatest Mean Decrease in Gini values (Financial damages (USD and BTC), network status (flag), zero-day group (clusters), normal attacks (threats), network traffic (netflow bytes), port number (port), and ransomware-type (family)). Similarly, the least relevant variables are the lowest in Figure 31 and have the least Mean Decrease values (Network protocol (protocol), IP address classes (IP address), and the timestamps (time)). The final construction of the UGRansome dataset can be more or less extracted from Figure 31 where the prediction attribute has been ignored in the plot because it was used to compute the Mean Decreased value (see the given code).
Figure 32 illustrates the satisfactory ROC-Accuracy value between specificity and sensitivity that is equal to one. This result indicates that there is a 100% of probability that the Random Forest model can identify zero-day threats behaviours by building different Decision Trees and the output will be the attack categories selected by most trees which can either be normal (S) or abnormal (A and SS).
The OOB error represents the mean of the prediction error for a specific training set. The Random Forest model produced a null OBB error with the best mtry of three (Figure 33). This result shows the minimisation rate of false alarms (false positive and negative) in terms of detecting threatening behaviours of network threats.
4.2. Decision Tree Results
The RStudio library is used as the classification tree and the UGRansome dataset is divided into training (80%) and testing (20%). The training set has 166,188 features with 14 variables while the testing set has only 41,346 features. The overall performance of the Decision Tree is not impressive due to the bias-variance dilemma [61] (various Machine Learning algorithms will have different results on the UGRansome dataset). Signature (S) malware categories are classified with an accuracy of 44% and this indicates that the Decision Tree is not the most suitable algorithm for malware behaviour recognition. Figure 34 shows the classification results of the Decision Tree algorithm where different addresses (17dcMo4v, 1AEoiHYZ, 1DA11mPS, and 1NKi9Ak5) have been plotted against various well-known threats such as SSH, Spam, Nerisbonet, and DoS. It can be seen that the Spam malware uses all the address types in the UGRansome corpus. This result is a strong prediction that the majority of zero-day attacks will still be using spamming/phishing for intrusion. It can also be seen that most of the zero-day threats that use seed and expended addresses shown in Figure 34 share similarities with the Bonet and SSH attacks. As such, the Bonet and SSH attacks can be thought of as hybrid and cyclostationary network threats that will vary with time.
As shown in Figure 35, most of the blacklist and SSH attacks use an IP address of class C. Figure 36 illustrates a strong prediction of zero-day attacks such as Advanced Persistent Threats (APT) namely EDA2, and Razy. These persistent threats have been strongly predicted to belong to anomalous categories such as synthetic signature (SS) and anomaly (A) because they are either known or unknown and a key has not yet been implemented to decrypt them. Until their mitigation, intruders/hackers will exploit the exposed network system vulnerability to adversely steal important data. APT is generally undetected once it has accessed the network system. It can be thought of as a state-sponsored group of attackers that gain access to the system to steal data.
4.3. A Deeper Comparison of the UGRansome Dataset
In this section, the Random Forest and Decision Tree algorithms have been used on the KDD99 and NSL-KDD datasets to compare their performances with the ones obtained with the UGRansome dataset (see Table 12, where the overall accuracy of the Ensemble Learning has been used to evaluate the Machine Learning models). The Accuracy metric of the Random Forest algorithm is impressive for both datasets. However, the performance of the Decision Tree on the UGRansome dataset was not sufficient because the algorithm is well suited for discrete features. The KDD99 (http://kdd.ics.uci.edu/databases/kddcup99/kddcup99.html) and NSL-KDD (http://www.unb.ca/cic/datasets/nsl.html) are publicly available for reproducible experiments. Figure 37 portrays attacks detected in the KDD99 dataset. These are legacy network threats that can also be detected in the NSL-KDD dataset (Figure 38). Figure 37 exhibits imbalanced properties of the KDD99 dataset that contains disproportional distribution between normal and abnormal attack classes. It also illustrates redundant patterns of the KDD99 that generate false alarms.
Figure 38 shows various features of the NSL-KDD dataset (src bytes, dst host diff srv rate, count, dst host srv diff host rate, dst host same srv rate, protocol type, and srv count.) predicted by the Decision Tree algorithm with the ICMP, TCP, and UDP protocols as the most used in the corpus (Figure 38). However, this dataset suffers from the lack of cyclostationary and zero-day threats. The cyclostationarity of zero-day threats is then illustrated in Figure 39 with various network flags that have been predicted to be anomalous due to the A and SS predictions. The AP flag demonstrates a strong prediction of anomalous behaviours. For instance, a zero-day attack depicted in Figure 40 could exploit a network connection state (flag) for malicious operation such as encryption of relevant files or relinquishment of synchronisation anomalies. These zero-day threats do not match known signatures and this makes them difficult to be detected by traditional NIDSs.
Figure 40 demonstrates the proportionality and cyclostationarity of zero-day threats behaviour detected in the UGRansome dataset. Globe is the zero-day threat that portrays the most anomalous (A) behaviour, while EDA2 mimics the least synthetic signature (SS) behaviour (Figure 40). EDA2 can be defined as the most abnormal and Advanced Persistent Threat (APT) in the corpus. It is a that encrypts multivariate user data with different formats, namely archive, video, audio, multimedia documents and much more.
Lastly, we have compared the experimental results obtained by [56,57,58,59,60] to ours because of the Ensemble Learning approach that has been utilised on the fly of malware recognition. The Accuracy of the Ensemble Learning models utilised in [56,57,58,59,60] is illustrated in Table 13 where the performance achieved by selected algorithms is similar to the one obtained in this article. We can then argue that implementing the Ensemble Learning algorithms applied to the UGRansome dataset can facilitate accurate results to improve zero-day threats recognition for NIDSs.
5. Conclusions
There is a need for smart techniques to detect cyclostationary zero-day threats since the current approaches are error-prone and tedious. This article introduced a novel dataset for Anomaly Detection incorporating cyclostationary zero-day threats behaviours. The Ensemble Learning approach has been used with the Random Forest and Decision Tree algorithms to assess the Machine Learning model. Two existing datasets have been utilised to retrieve salient features with a PCA and triangulate them in the created dataset using a fuzzy merging technique. The experiments have been performed on the created dataset and the results obtained demonstrate that the Random Forest achieved the most acceptable Accuracy value for the prediction and recognition of zero-day threats behaviours. This research focused on the fuzzy merging and Feature Engineering process to build the final dataset. The advantage of the created dataset is the inclusion of normal and abnormal netflow traffic patterns that are cyclostationary and threatening in nature. Thus, this dataset can be used for zero-day attacks recognition. However, the created artefact is restricted to supervised learning, which required the identification and labelling of various features patterns. Some zero-day attacks may not be detected in a real-life setting, and thus the Ensemble Learning cannot be trained to detect them. This increases the need for future works in the NIDL. One can use the created artefact for real-world testing and interpret results using Deep Learning algorithms. The authors also intend to create a real-world application of these research results and plan to continue researching the problem of network traffic management for 0-day threats recognition using Anomaly Detection.
Author Contributions
Conceptualization, M.N. and J.P.v.D.; writing—original draft preparation, M.N.; supervision, J.P.v.D. and S.M.K.; writing-review and editing, S.M.K. and M.N. All authors have read and agreed to the published version of the manuscript.
Funding
This research received no external funding.
Institutional Review Board Statement
Not applicable.
Informed Consent Statement
Not applicable.
Data Availability Statement
Not applicable.
Conflicts of Interest
The authors declare no conflict of interests.
References
- Edwards, S. Network Intrusion Detection Systems: Important ids Network Security Vulnerabilities. White Paper Top Layer Networks, Inc. Available online: http://www.toplayer.com/pdf/WhitePapers/wp_network_intrusion_system (accessed on 16 August 2021).
- Abdelrahman, A.M.; Rodrigues, J.J.; Mahmoud, M.M.; Saleem, K.; Das, A.K.; Korotaev, V.; Kozlov, S.A. Software-defined networking security for private data center networks and clouds: Vulnerabilities, attacks, countermeasures, and solutions. Int. J. Commun. Syst. 2021, 34, e4706. [Google Scholar] [CrossRef]
- Sharafaldin, I.; Gharib, A.; Lashkari, A.H.; Ghorbani, A.A. Towards a reliable intrusion detection benchmark dataset. Softw. Netw. 2018, 2018, 177–200. [Google Scholar] [CrossRef]
- Cordero, C.G.; Vasilomanolakis, E.; Wainakh, A.; Mühlhäuser, M.; Nadjm-Tehrani, S. On generating network traffic datasets with synthetic attacks for intrusion detection. ACM Trans. Priv. Secur. 2021, 24, 1–39. [Google Scholar] [CrossRef]
- Dang, Q.V.; Vo, T.H. Studying the Reinforcement Learning techniques for the problem of intrusion detection. In Proceedings of the 2021 4th International Conference on Artificial Intelligence and Big Data (ICAIBD), Chengdu, China, 28–31 May 2021; pp. 87–91. [Google Scholar]
- Kasongo, S.M.; Sun, Y. A deep learning method with wrapper based feature extraction for wireless intrusion detection system. Comput. Secur. 2020, 92, 101752. [Google Scholar] [CrossRef]
- Otoum, Y.; Nayak, A. AS-IDS: Anomaly and Signature Based IDS for the Internet of Things. J. Netw. Syst. Manag. 2021, 29, 1–26. [Google Scholar] [CrossRef]
- Ashoor, A.S.; Gore, S. Importance of intrusion detection system (IDS). Int. J. Sci. Eng. Res. 2011, 2, 1–4. [Google Scholar]
- Hindy, H.; Brosset, D.; Bayne, E.; Seeam, A.K.; Tachtatzis, C.; Atkinson, R.; Bellekens, X. A taxonomy of network threats and the effect of current datasets on intrusion detection systems. IEEE Access 2020, 8, 104650–104675. [Google Scholar] [CrossRef]
- Kilincer, I.F.; Ertam, F.; Sengur, A. Machine learning methods for cyber security intrusion detection: Datasets and comparative study. Comput. Netw. 2021, 188, 107840. [Google Scholar] [CrossRef]
- Larriva-Novo, X.; Villagrá, V.A.; Vega-Barbas, M.; Rivera, D.; Sanz Rodrigo, M. An IoT-Focused Intrusion Detection System Approach Based on Preprocessing Characterization for Cybersecurity Datasets. Sensors 2021, 21, 656. [Google Scholar] [CrossRef]
- Mohd, N.; Singh, A.; Bhadauria, H. Intrusion Detection System Based on Hybrid Hierarchical Classifiers. Wirel. Pers. Commun. 2021, 1–28. [Google Scholar] [CrossRef]
- Panwar, S.S.; Raiwani, Y. Performance analysis of NSL-KDD dataset using classification algorithms with different feature selection algorithms and supervised filter discretization. In Intelligent Communication, Control and Devices; Springer: Singapore, 2020; pp. 497–511. [Google Scholar] [CrossRef]
- Pacheco, Y.; Sun, W. Adversarial Machine Learning: A Comparative Study on Contemporary Intrusion Detection Datasets. In Proceedings of the Information Systems Security and Privacy, Vienna, Austria, 11–13 February 2021; pp. 160–171. [Google Scholar] [CrossRef]
- Noorbehbahani, F.; Fanian, A.; Mousavi, R.; Hasannejad, H. An incremental intrusion detection system using a new semi-supervised stream classification method. Int. J. Commun. Syst. 2017, 30, e3002. [Google Scholar] [CrossRef]
- Chockwanich, N.; Visoottiviseth, V. Intrusion detection by deep learning with tensorflow. In Proceedings of the 21st International Conference on Advanced Communication Technology, PyeongChang, Korea, 17–20 February 2019; pp. 654–659. [Google Scholar] [CrossRef]
- Yavanoglu, O.; Aydos, M. A review on cyber security datasets for machine learning algorithms. In Proceedings of the 2017 IEEE International Conference on Big Data, Boston, MA, USA, 11–14 December 2017; pp. 2186–2193. [Google Scholar] [CrossRef]
- Mighan, S.N.; Kahari, M. A novel scalable intrusion detection system based on deep learning. Int. J. Inf. Secur. 2021, 20, 387–403. [Google Scholar] [CrossRef]
- Al-Hadhrami, Y.; Hussain, F.K. Real time dataset generation framework for intrusion detection systems in IoT. Future Gener. Comput. Syst. 2020, 108, 414–423. [Google Scholar] [CrossRef]
- Kasongo, S.M.; Sun, Y. Performance analysis of intrusion detection systems using a feature selection method on the UNSW-NB15 dataset. J. Big Data 2020, 7, 1–20. [Google Scholar] [CrossRef]
- Stiawan, D.; Idris, M.Y.B.; Bamhdi, A.M.; Budiarto, R. CICIDS-2017 dataset feature analysis with information gain for anomaly detection. IEEE Access 2020, 8, 132911–132921. [Google Scholar]
- Sarica, A.K.; Angin, P. A Novel SDN Dataset for Intrusion Detection in IoT Networks. In Proceedings of the 2020 16th International Conference on Network and Service Management (CNSM), Vitual Online, 2–6 November 2020; pp. 1–5. [Google Scholar] [CrossRef]
- Wang, H.; Zhang, D.; Shin, K.G. Change-point monitoring for the detection of DoS attacks. IEEE Trans. Dependable Secur. Comput. 2004, 1, 193–208. [Google Scholar] [CrossRef]
- Najafabadi, M.M.; Khoshgoftaar, T.M.; Calvert, C.; Kemp, C. Detection of ssh brute force attacks using aggregated netflow data. In Proceedings of the 2015 IEEE 14th International Conference on Machine Learning and Applications (ICMLA), Miami, FL, USA, 9–11 December 2015; pp. 283–288. [Google Scholar]
- Zaidi, R.A.; Tanveer, S. Reviewing Anatomy of Botnets and Botnet Detection Techniques. Int. J. Adv. Res. Comput. Sci. 2017, 8. [Google Scholar]
- McIntosh, T.; Kayes, A.; Chen, Y.P.P.; Ng, A.; Watters, P. Dynamic User-Centric Access Control for Detection of Ransomware Attacks. Comput. Secur. 2021, 111, 102461. [Google Scholar] [CrossRef]
- Maciá-Fernández, G.; Camacho, J.; Magán-Carrión, R.; García-Teodoro, P.; Therón, R. UGR’16: A new dataset for the evaluation of cyclostationary-based network IDSs. Comput. Secur. 2018, 73, 411–424. [Google Scholar] [CrossRef] [Green Version]
- Paquet-Clouston, M.; Haslhofer, B.; Dupont, B. Ransomware Payments in the Bitcoin Ecosystem; Oxford University Press: Oxford, UK, 2019; Volume 5, p. tyz003. [Google Scholar] [CrossRef]
- Moustafa, N.; Hu, J.; Slay, J. A holistic review of network anomaly detection systems: A comprehensive survey. J. Netw. Comput. Appl. 2019, 128, 33–55. [Google Scholar] [CrossRef]
- Oz, H.; Aris, A.; Levi, A.; Uluagac, A.S. A Survey on Ransomware: Evolution, Taxonomy, and Defense Solutions. arXiv 2021, arXiv:2102.06249. [Google Scholar]
- Kumar, P.R.; Ramlie, R.E.B.H. Anatomy of Ransomware: Attack Stages, Patterns and Handling Techniques. In International Conference on Computational Intelligence in Information System; Springer: Cham, Switzerland, 2021; pp. 205–214. [Google Scholar] [CrossRef]
- Hofstede, R.; Čeleda, P.; Sadre, R.; Sperotto, A.; Pras, A. Flow monitoring explained: From packet capture to data analysis with netflow and ipfix. IEEE Commun. Surv. Tutor. 2014, 16, 2037–2064. [Google Scholar] [CrossRef] [Green Version]
- Sahu, S.; Mehtre, B.M. Network intrusion detection system using J48 Decision Tree. In Proceedings of the 2015 International Conference on Advances in Computing, Communications and Informatics (ICACCI), Kerala, India, 10–13 August 2015; pp. 2023–2026. [Google Scholar]
- Subba, B.; Biswas, S.; Karmakar, S. Enhancing performance of anomaly based intrusion detection systems through dimensionality reduction using principal component analysis. In Proceedings of the 2016 IEEE International Conference on Advanced Networks and Telecommunications Systems (ANTS), Bangalore, India, 6–9 November 2016; pp. 1–6. [Google Scholar]
- Hajisalem, V.; Babaie, S. A hybrid intrusion detection system based on ABC-AFS algorithm for misuse and anomaly detection. Comput. Netw. 2018, 136, 37–50. [Google Scholar] [CrossRef]
- Kayacık, H.G.; Zincir-Heywood, N. Analysis of three intrusion detection system benchmark datasets using machine learning algorithms. In International Conference on Intelligence and Security Informatics; Springer: Berlin/Heidelberg, Germany, 2005; pp. 362–367. [Google Scholar] [CrossRef]
- Parsazad, S.; Saboori, E.; Allahyar, A. Fast feature reduction in intrusion detection datasets. In Proceedings of the 35th International Convention MIPRO, Opatija, Croatia, 21–25 May 2012; pp. 1023–1029. [Google Scholar]
- Khammassi, C.; Krichen, S. A GA-LR wrapper approach for feature selection in network intrusion detection. Comput. Secur. 2017, 70, 255–277. [Google Scholar] [CrossRef]
- Moustafa, N.; Slay, J.; Creech, G. Novel geometric area analysis technique for anomaly detection using trapezoidal area estimation on large-scale networks. IEEE Trans. Big Data 2017, 5, 481–494. [Google Scholar] [CrossRef]
- Wang, C.R.; Xu, R.F.; Lee, S.J.; Lee, C.H. Network intrusion detection using equality constrained-optimization-based extreme learning machines. Knowl.-Based Syst. 2018, 147, 68–80. [Google Scholar] [CrossRef]
- Raman, M.G.; Somu, N.; Jagarapu, S.; Manghnani, T.; Selvam, T.; Krithivasan, K.; Sriram, V.S. An efficient intrusion detection technique based on support vector machine and improved binary gravitational search algorithm. Artif. Intell. Rev. 2019, 53, 3255–3286. [Google Scholar] [CrossRef]
- Panigrahi, R.; Borah, S. A detailed analysis of CICIDS2017 dataset for designing Intrusion Detection Systems. Int. J. Eng. Technol. 2018, 7, 479–482. [Google Scholar]
- Ranga, V. On Evaluation of Network Intrusion Detection Systems: Statistical Analysis of CIDDS-001 Dataset Using Machine Learning Techniques; Universiti Putra Malaysia Press: Serdang, Selangor, Malaysia, 2018; pp. 1–35. [Google Scholar]
- Carrasco, R.S.M.; Sicilia, M.A. Unsupervised intrusion detection through skip-gram models of network behavior. Comput. Secur. 2018, 78, 187–197. [Google Scholar] [CrossRef]
- Cepheli, Ö.; Büyükçorak, S.; Karabulut Kurt, G. Hybrid intrusion detection system for ddos attacks. J. Electr. Comput. Eng. 2016. [Google Scholar] [CrossRef] [Green Version]
- Lee, J.; Park, K. GAN-based imbalanced data intrusion detection system. Pers. Ubiquitous Comput. 2019, 1–8. [Google Scholar] [CrossRef]
- Balasaraswathi, V.R.; Sugumaran, M.; Hamid, Y. Feature selection techniques for intrusion detection using non-bio-inspired and bio-inspired optimization algorithms. J. Commun. Inf. Netw. 2017, 2, 107–119. [Google Scholar] [CrossRef] [Green Version]
- Mehmod, T.; Rais, H.B.M. Ant colony optimization and feature selection for intrusion detection. In Advances in Machine Learning and Signal Processing; Springer: Cham, Switzerland, 2016; pp. 305–312. [Google Scholar] [CrossRef]
- Rampure, V.; Tiwari, A. A rough set based feature selection on KDD CUP 99 data set. Int. J. Database Theory Appl. 2015, 8, 149–156. [Google Scholar] [CrossRef]
- Janarthanan, T.; Zargari, S. Feature selection in UNSW-NB15 and KDDCUP’99 datasets. In Proceedings of the 2017 IEEE 26th International Symposium on Industrial Electronics (ISIE), Edinburgh, UK, 19–21 June 2017; pp. 1881–1886. [Google Scholar] [CrossRef]
- Dang, Q.V. Studying machine learning techniques for intrusion detection systems. In International Conference on Future Data and Security Engineering; Springer: Cham, Switzerland, 2019; pp. 411–426. [Google Scholar]
- Meira, J.; Andrade, R.; Praça, I.; Carneiro, J.; Bolón-Canedo, V.; Alonso-Betanzos, A.; Marreiros, G. Performance evaluation of unsupervised techniques in cyber-attack anomaly detection. J. Ambient. Intell. Humaniz. Comput. 2020, 11, 4477–4489. [Google Scholar] [CrossRef]
- Ahmad, A.; Harjula, E.; Ylianttila, M.; Ahmad, I. Evaluation of machine learning techniques for security in SDN. In Proceedings of the 2020 IEEE Globecom Workshops, Virtual Online, 7–11 December 2020; pp. 1–6. [Google Scholar] [CrossRef]
- Maseer, Z.K.; Yusof, R.; Bahaman, N.; Mostafa, S.A.; Foozy, C.F.M. Benchmarking of machine learning for anomaly based intrusion detection systems in the CICIDS2017 dataset. IEEE Access 2021, 9, 22351–22370. [Google Scholar] [CrossRef]
- Azeez, N.A.; Odufuwa, O.E.; Misra, S.; Oluranti, J.; Damaševičius, R. Windows PE Malware Detection Using Ensemble Learning. Informatics 2021, 8, 10. [Google Scholar] [CrossRef]
- Aljawarneh, S.; Aldwairi, M.; Yassein, M.B. Anomaly-based intrusion detection system through feature selection analysis and building hybrid efficient model. J. Comput. Sci. 2018, 25, 152–160. [Google Scholar] [CrossRef]
- Cvitić, I.; Peraković, D.; Periša, M.; Husnjak, S. An overview of distributed denial of service traffic detection approaches. Promet-Traffic Transp. 2019, 31, 453–464. [Google Scholar] [CrossRef]
- HaddadPajouh, H.; Khayami, R.; Dehghantanha, A.; Choo, K.K.R.; Parizi, R.M. AI4SAFE-IoT: An AI-powered secure architecture for edge layer of Internet of things. Neural Comput. Appl. 2020, 32, 16119–16133. [Google Scholar] [CrossRef]
- Cvitić, I.; Peraković, D.; Gupta, B.; Choo, K.K.R. Boosting-based DDoS Detection in Internet of Things Systems. IEEE Internet Things J. 2021. [Google Scholar] [CrossRef]
- Cvitić, I.; Peraković, D.; Periša, M.; Gupta, B. Ensemble machine learning approach for classification of IoT devices in smart home. Int. J. Mach. Learn. Cybern. 2021, 1–24. [Google Scholar] [CrossRef]
- He, H.; Garcia, E.A. Learning from imbalanced data. IEEE Trans. Knowl. Data Eng. 2009, 21, 1263–1284. [Google Scholar] [CrossRef]
Figure 1.
Outdated datasets for the NIDP. The DARPA, KDD99, and NSL-KDD datasets are the most utilised in the current NIDL.
Figure 1.
Outdated datasets for the NIDP. The DARPA, KDD99, and NSL-KDD datasets are the most utilised in the current NIDL.

Figure 2.
Legacy network threats for the NIDP. The U2R, R2L, DoS and Probing are the most recurrent network threats detected for the NIDP.
Figure 2.
Legacy network threats for the NIDP. The U2R, R2L, DoS and Probing are the most recurrent network threats detected for the NIDP.

Figure 3.
Recent malware detected in the current NIDL.

Figure 4.
Ransomware processes and infiltration techniques.

Figure 5.
The year distribution of ransomware. RAAS stands for ransomware as a service.

Figure 6.
The financial damages caused by ransomware.

Figure 7.
Ransomware features.

Figure 8.
Ransomware datasets for the NIDP.

Figure 9.
The TEST corpus of the UGR’16 dataset.

Figure 10.
An overview of the suggested zero-day threats detection framework.

Figure 11.
Imbalanced features of the ransomware dataset. APT stands for Advanced Persistent Threat.
Figure 11.
Imbalanced features of the ransomware dataset. APT stands for Advanced Persistent Threat.

Figure 12.
The timestamp fluctuation of the Scan malware.

Figure 13.
Imbalanced IP addresses of the Bonet malware.

Figure 14.
Imbalanced network protocols of the Bonet malware.

Figure 15.
Imbalanced seed and expended addresses in the ransomware dataset.

Figure 16.
The total of the financial damages generated per address type.

Figure 17.
The cleaned UGRansome dataset with no missing values.

Figure 18.
The nine phases followed during the UGRansome construction process. Data collection, feature extraction, feature selection, fuzzy merging, data pre-processing, prediction subdivision, data visualisation, Machine Learning, and evaluation.
Figure 18.
The nine phases followed during the UGRansome construction process. Data collection, feature extraction, feature selection, fuzzy merging, data pre-processing, prediction subdivision, data visualisation, Machine Learning, and evaluation.

Figure 19.
The UGRansome model.

Figure 20.
An instance of the UGRansome dataset.

Figure 21.
The UGRansome network protocols.

Figure 22.
The timestamp of ransomware in the UGRansome dataset.

Figure 23.
The most relevant features of the UGRansome dataset.

Figure 24.
The proportion of signature (S) malware types in the UGRansome dataset. This proportion represents normal attacks because it incorporates threats that match well-known malware signatures. The abnormal attacks are recorded in the anomaly (A) and synthetic signature (SS) categories.
Figure 24.
The proportion of signature (S) malware types in the UGRansome dataset. This proportion represents normal attacks because it incorporates threats that match well-known malware signatures. The abnormal attacks are recorded in the anomaly (A) and synthetic signature (SS) categories.

Figure 25.
The proportion of normal malware in the UGRansome dataset.

Figure 26.
The proportion of abnormal malware in the UGRansome.

Figure 27.
The uniform distribution of the UGRansome balanced with 9% of normal or well-known threats and 9% of abnormal or unknown threats (ransomware).
Figure 27.
The uniform distribution of the UGRansome balanced with 9% of normal or well-known threats and 9% of abnormal or unknown threats (ransomware).

Figure 28.
The construction of the UGRansome dataset based on normal and abnormal category.

Figure 29.
Achieving the dataset balance.

Figure 30.
The confusion matrix.

Figure 31.
The Mean Decreased value with only 13 attributes of the 14 which are in the UGRansome dataset.
Figure 31.
The Mean Decreased value with only 13 attributes of the 14 which are in the UGRansome dataset.

Figure 32.
The ROC result.

Figure 33.
The best mtry result.

Figure 34.
The stratification results of the Decision Tree algorithm that predict that zero-day threats will be using spamming for intrusion in the near future. Nevertheless, phishing might also be used.
Figure 34.
The stratification results of the Decision Tree algorithm that predict that zero-day threats will be using spamming for intrusion in the near future. Nevertheless, phishing might also be used.

Figure 35.
The predictive results of the Decision Tree model.

Figure 36.
The prediction of the Decision Tree model.

Figure 37.
Evaluation of the KDD99 dataset.

Figure 38.
Decision Tree results of the NSL-KDD dataset.

Figure 39.
Cyclostationarity of zero-day threats in the UGRansome dataset.

Figure 40.
Evaluation of the UGRansome dataset.


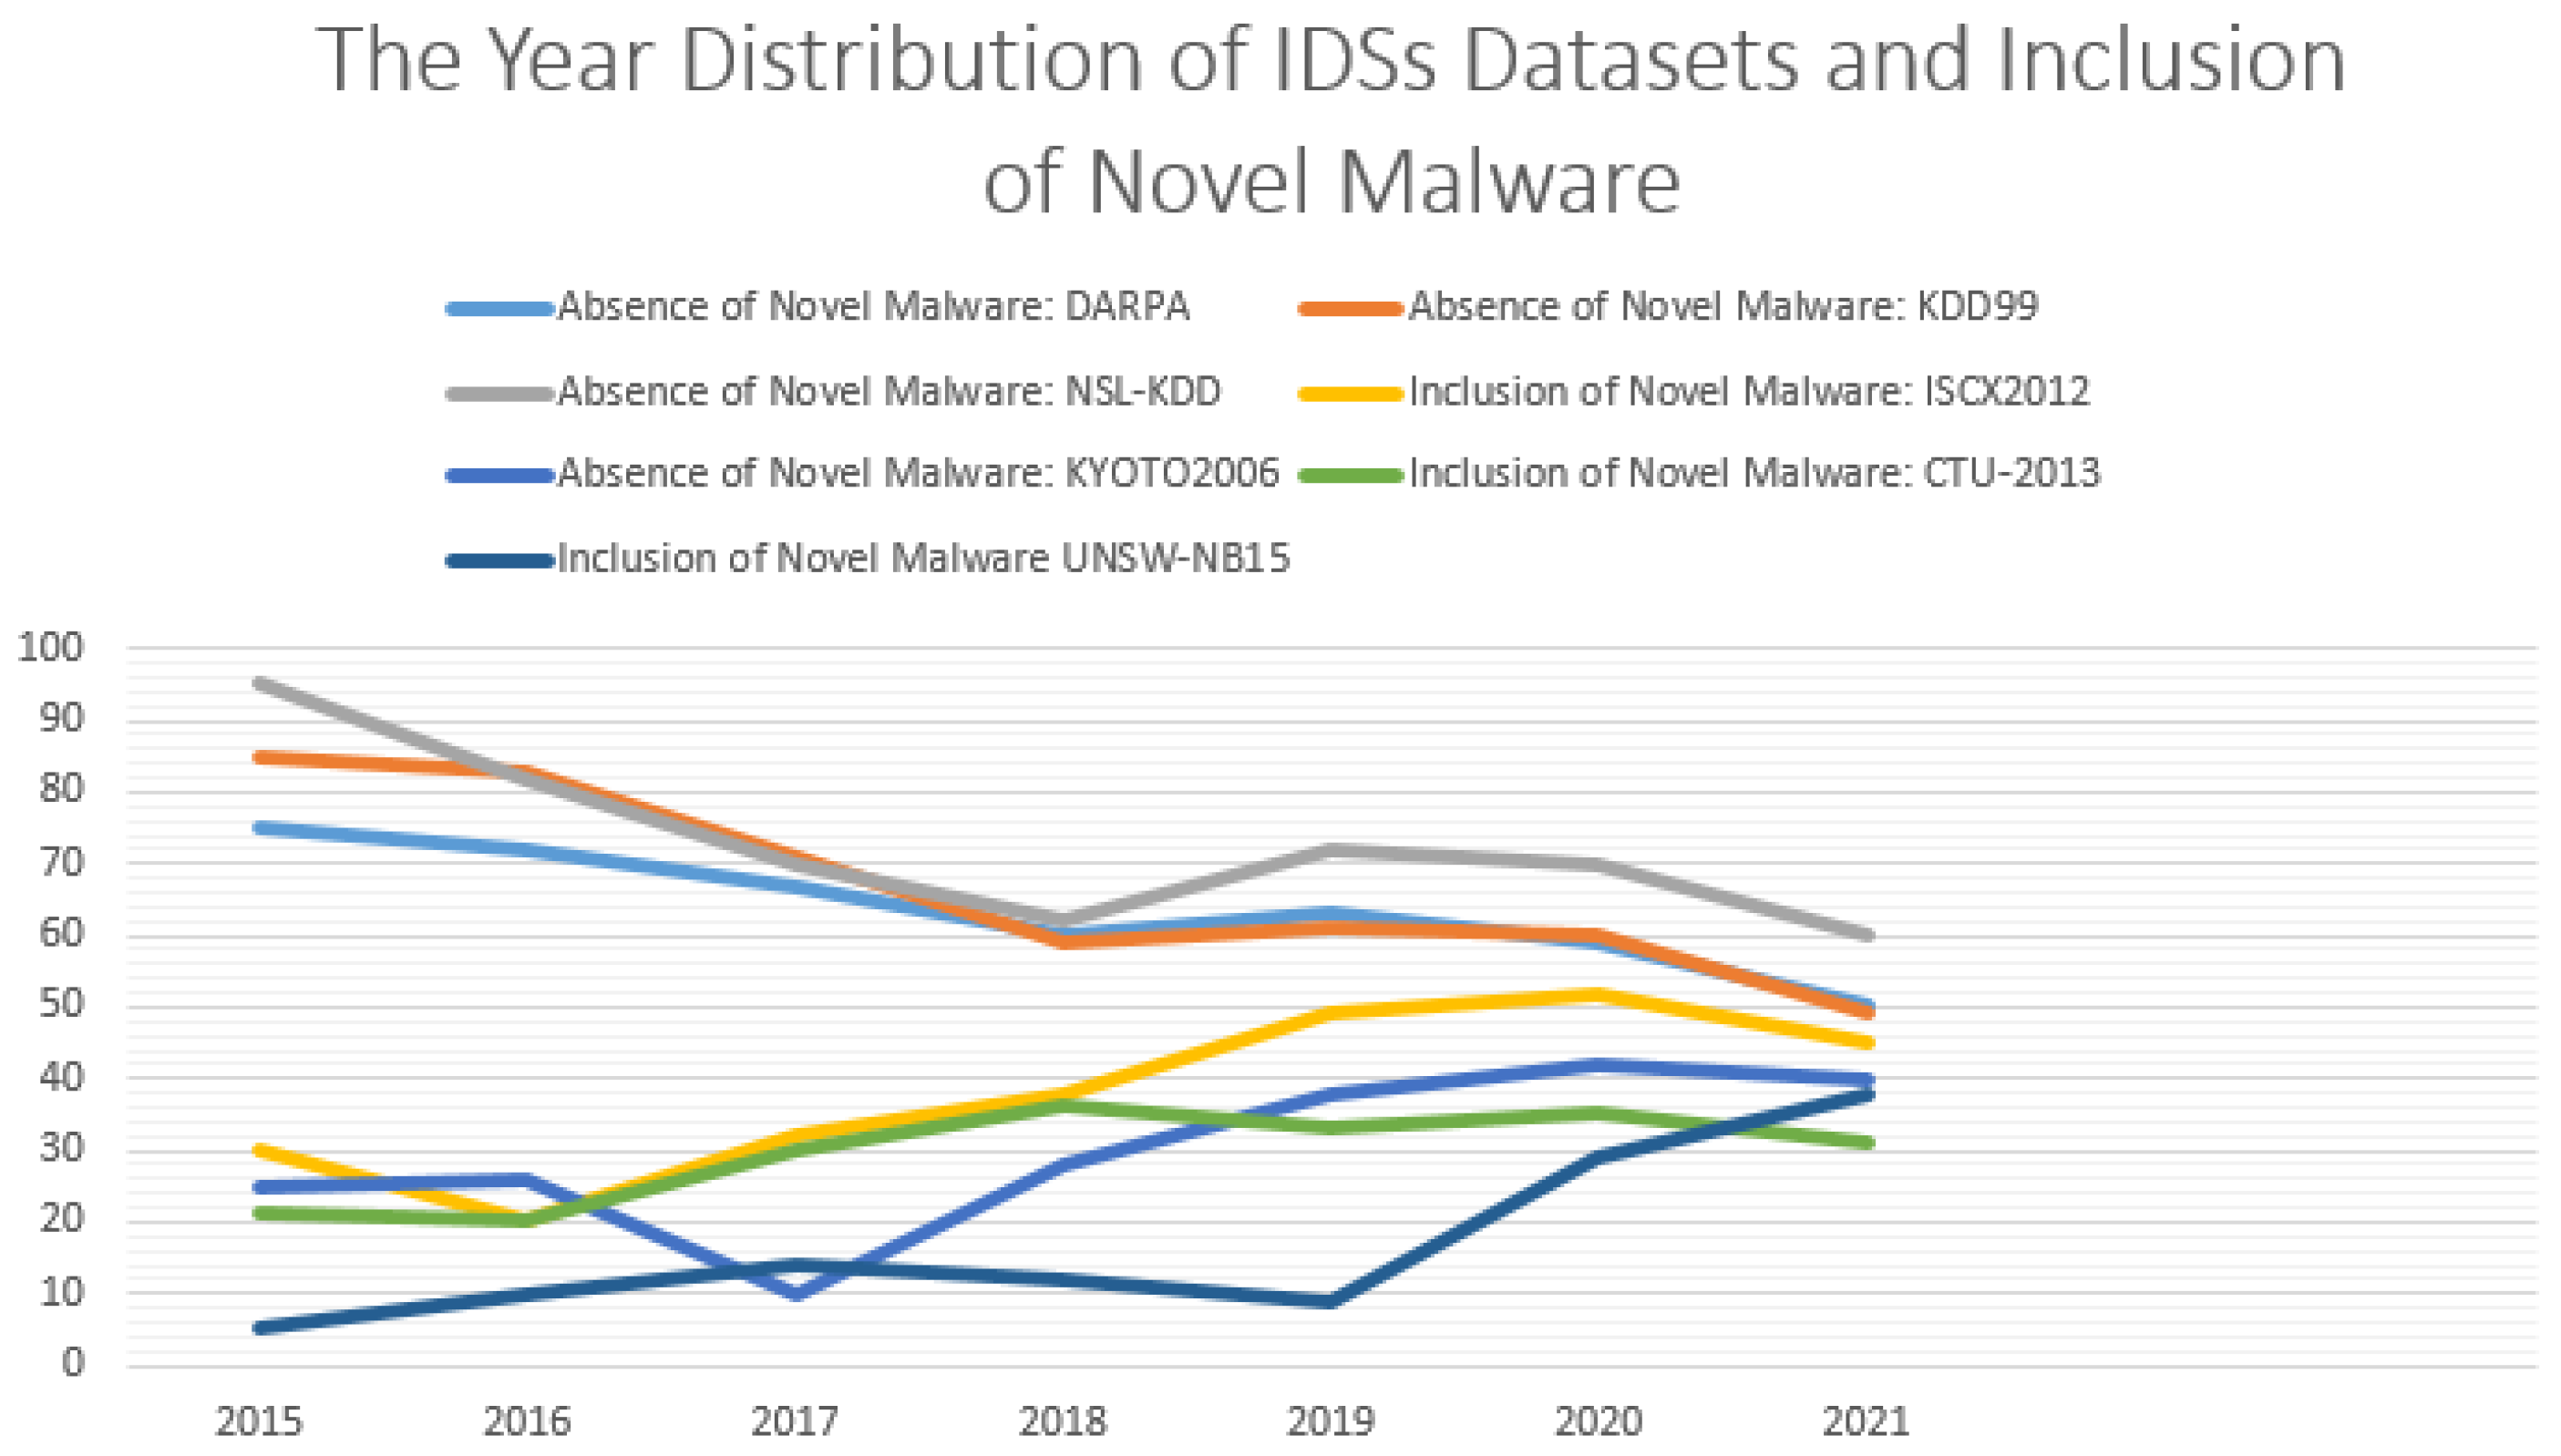
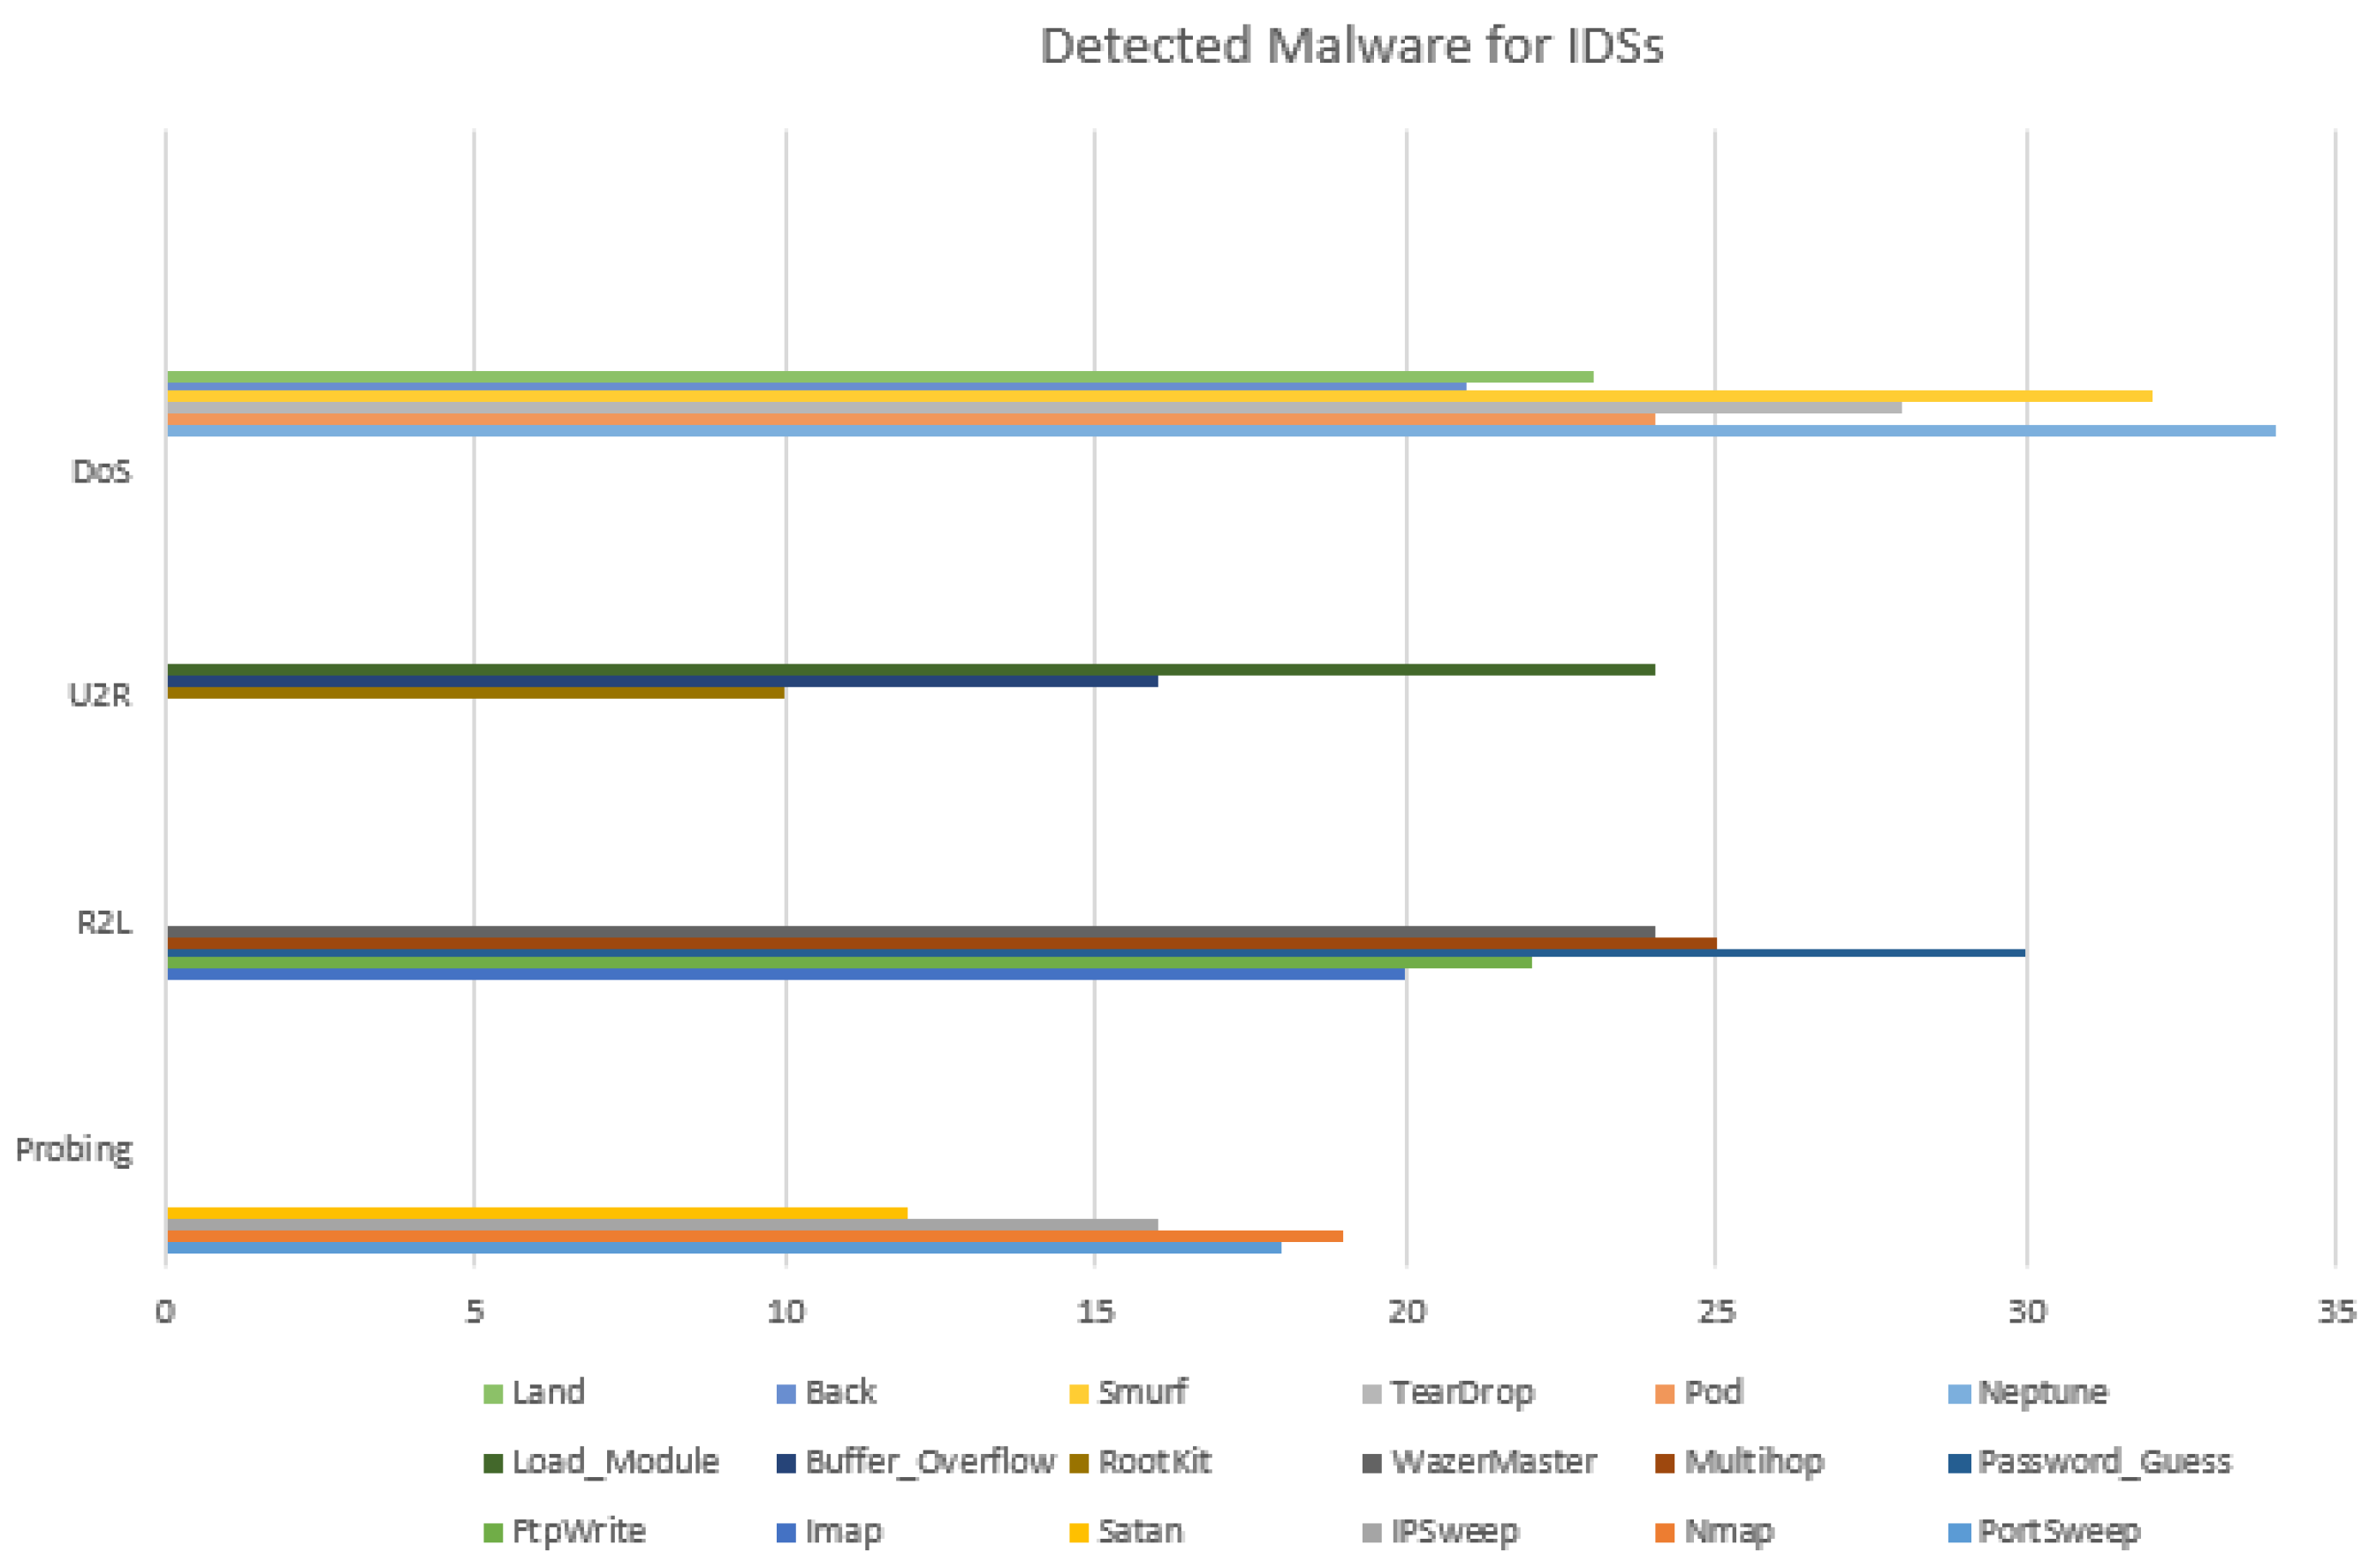
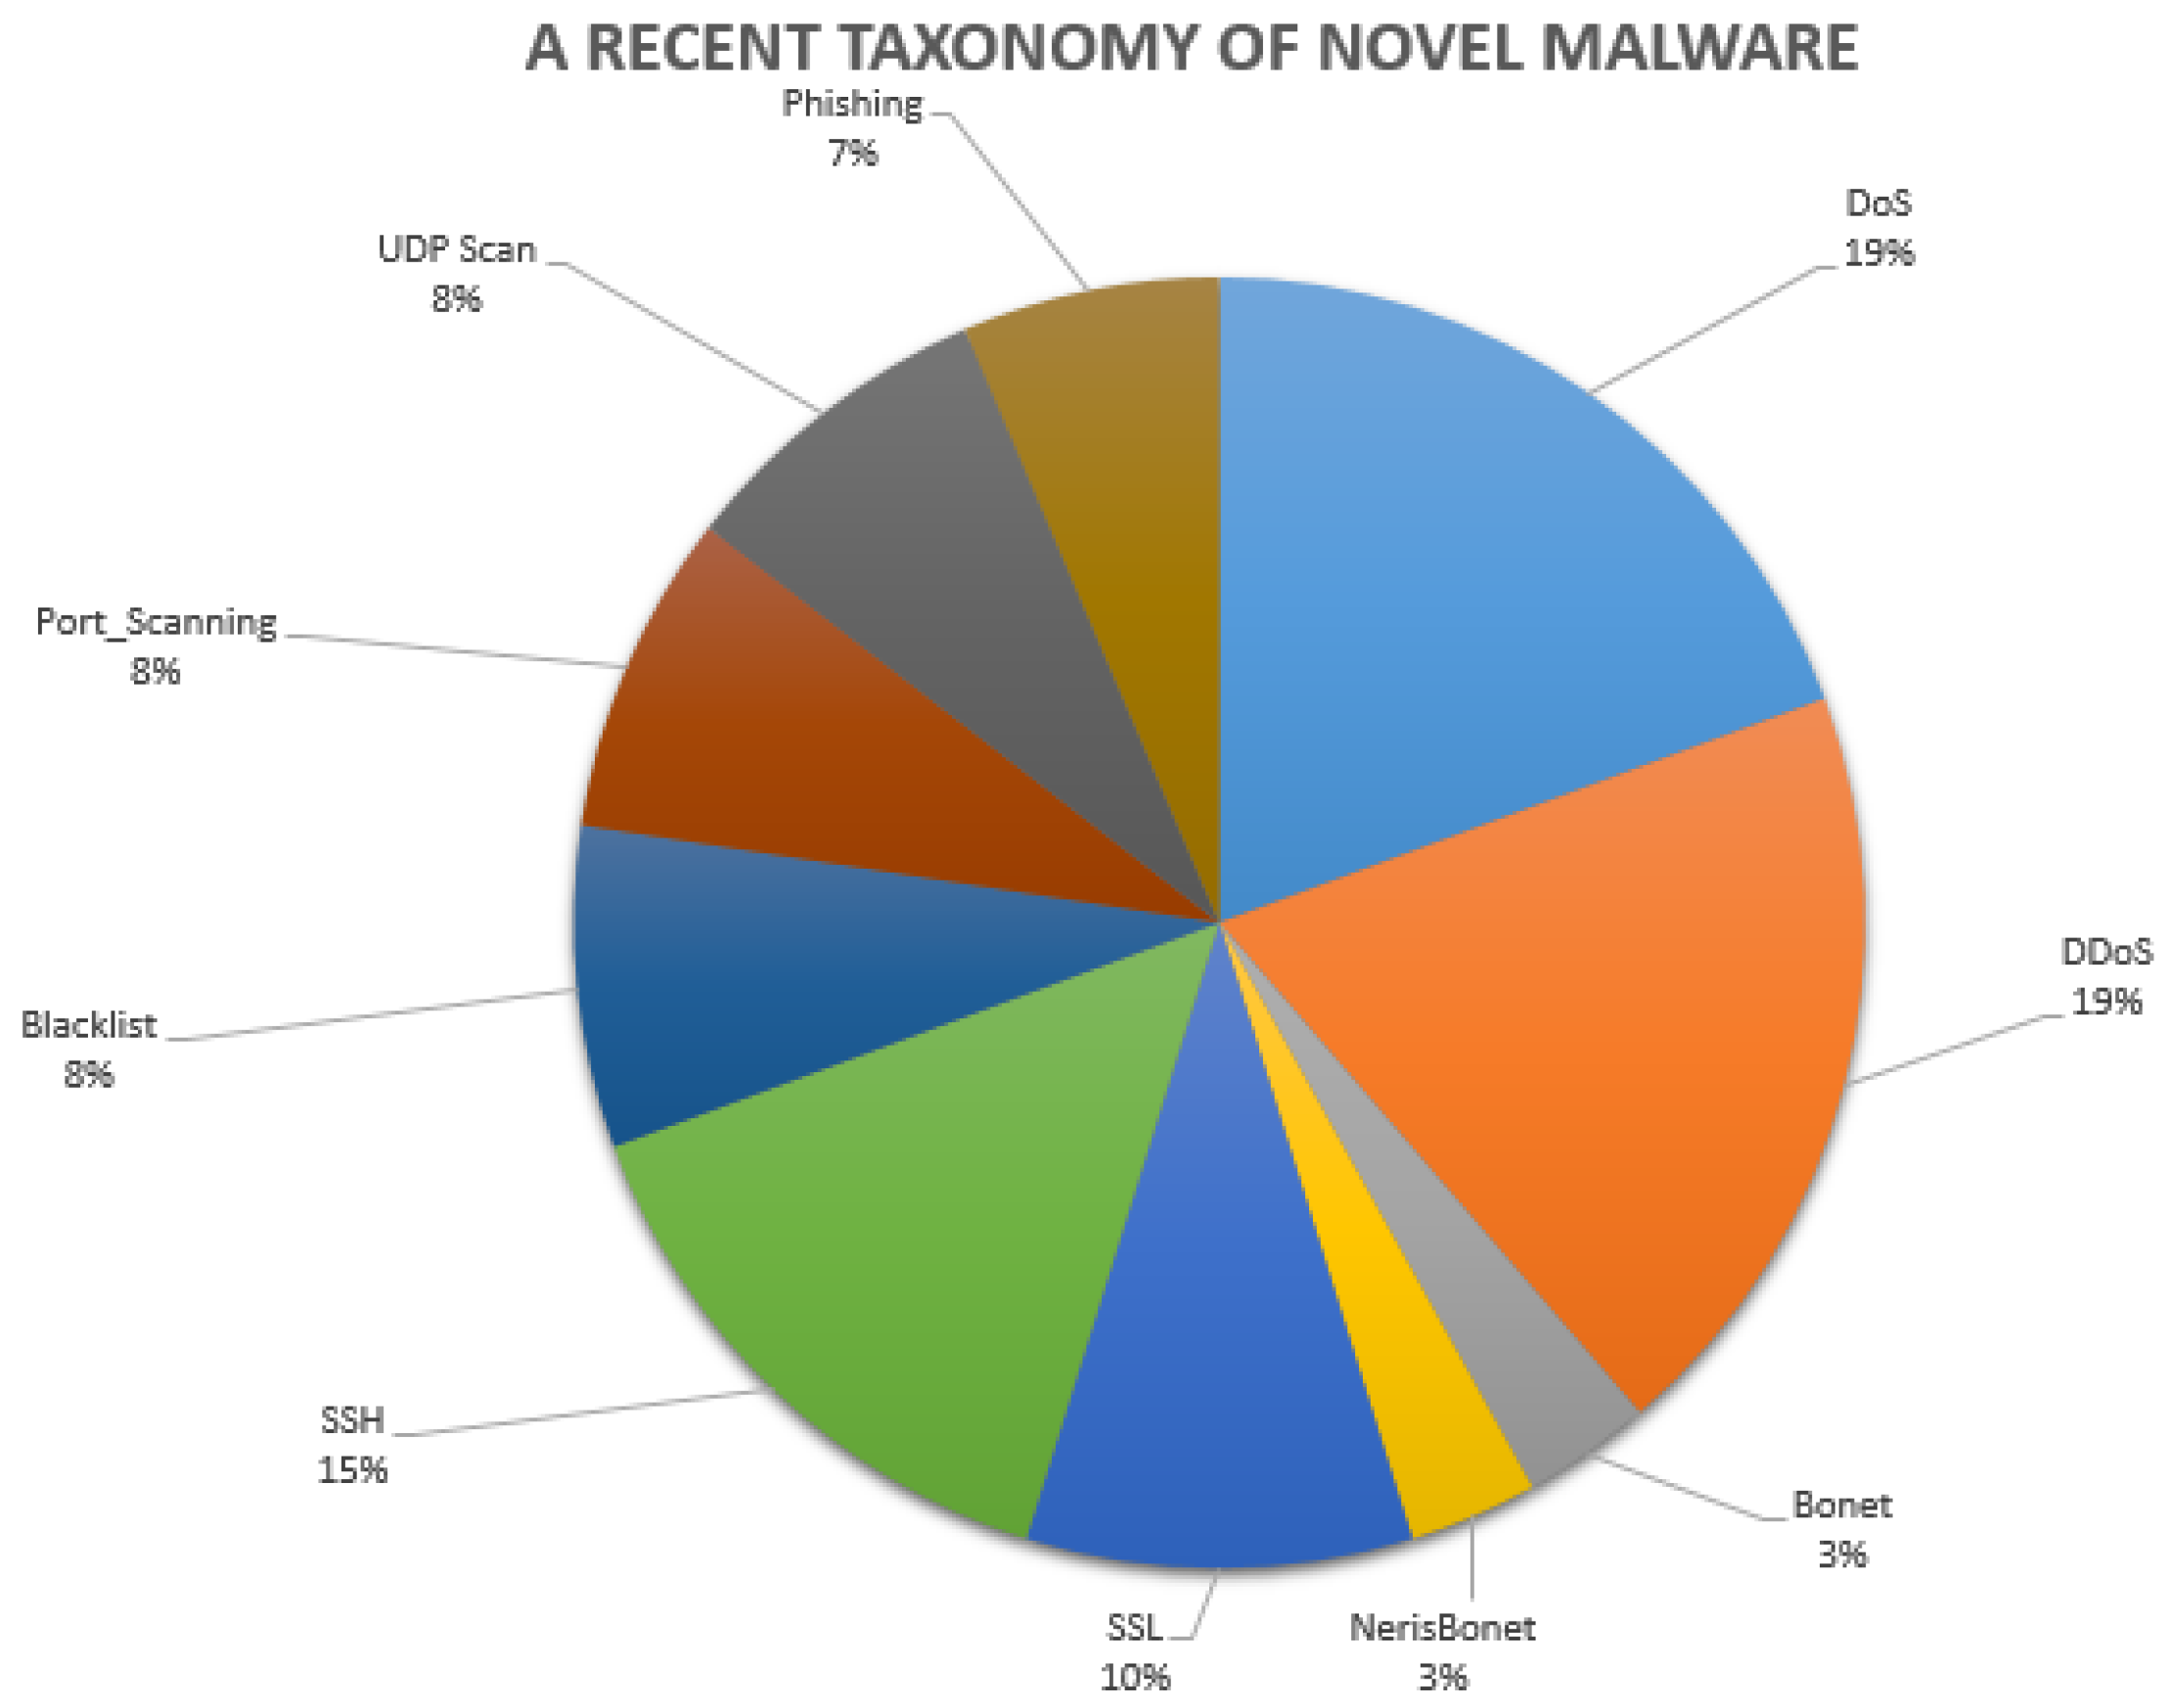
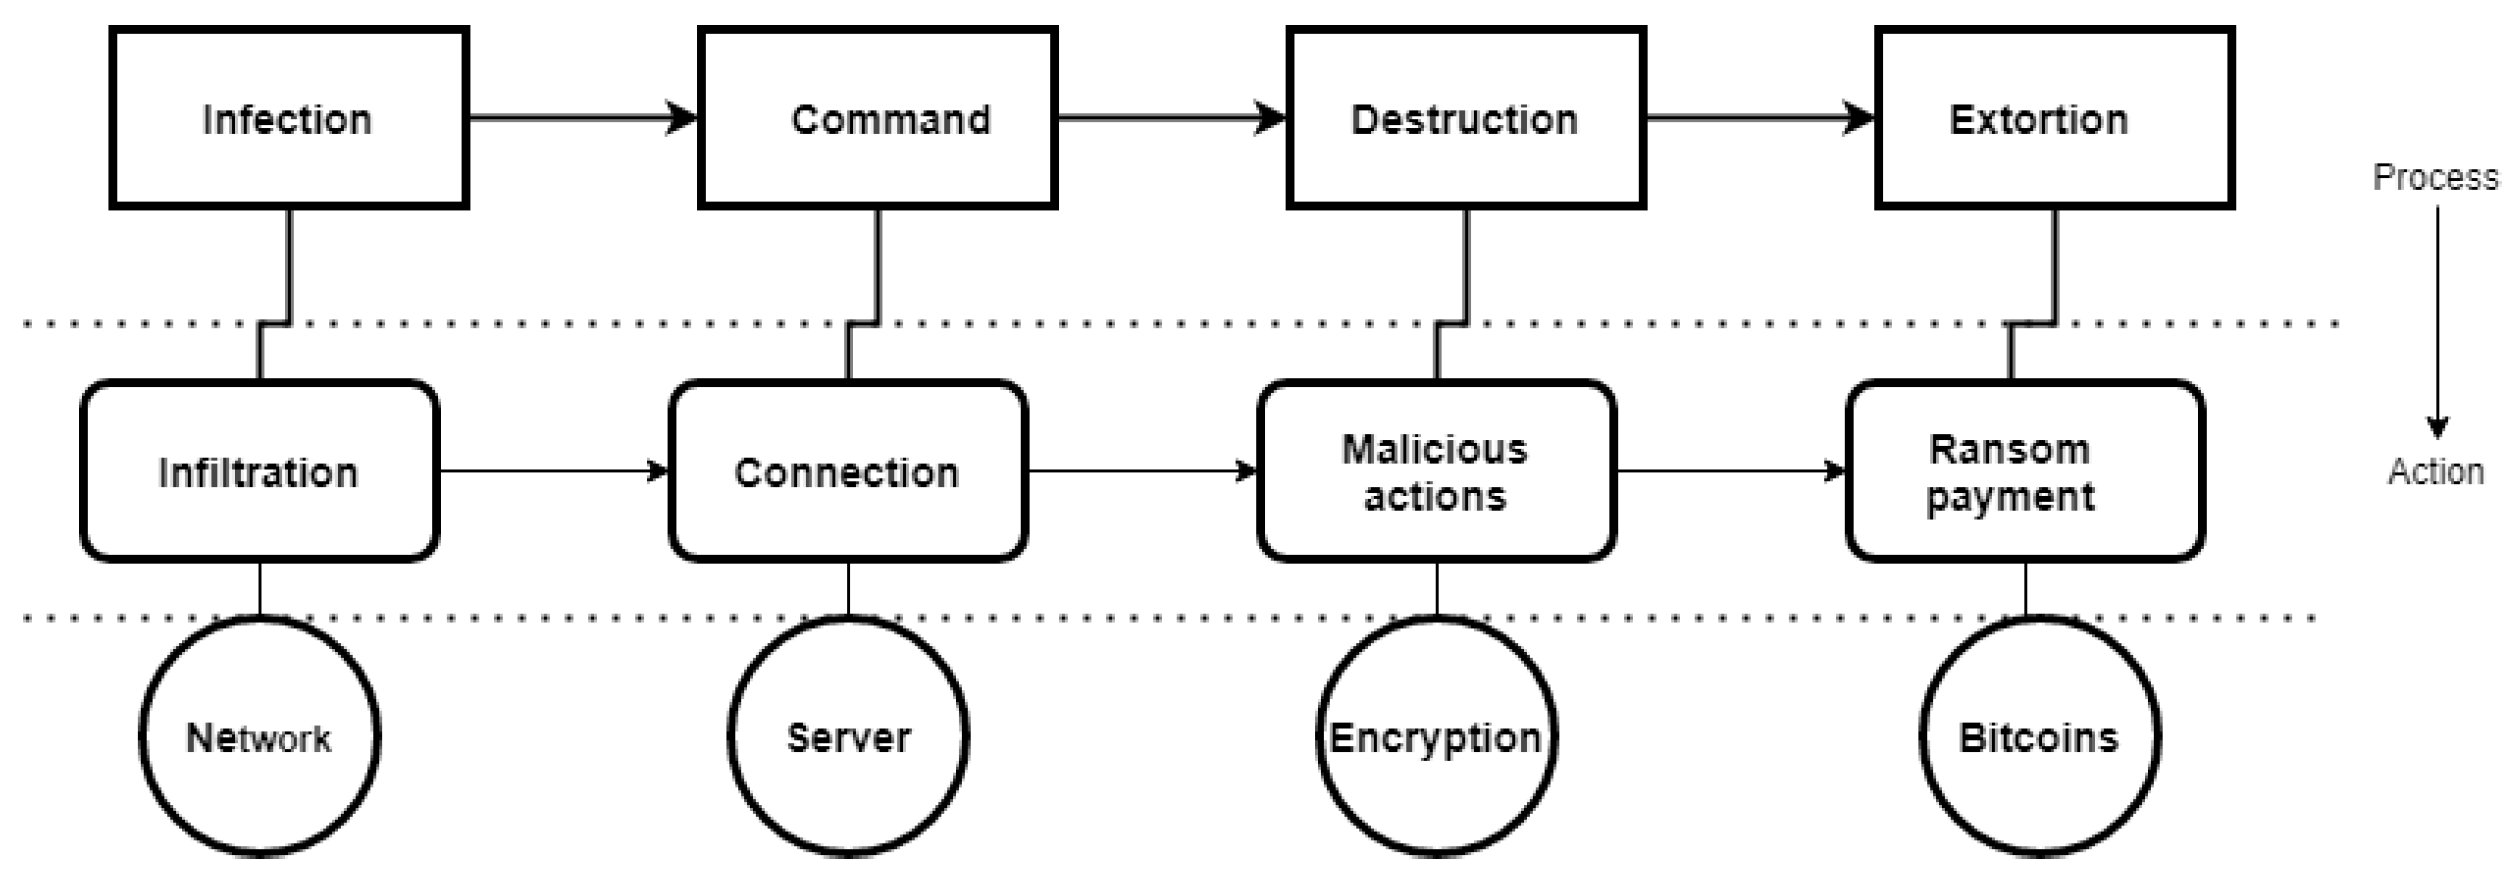
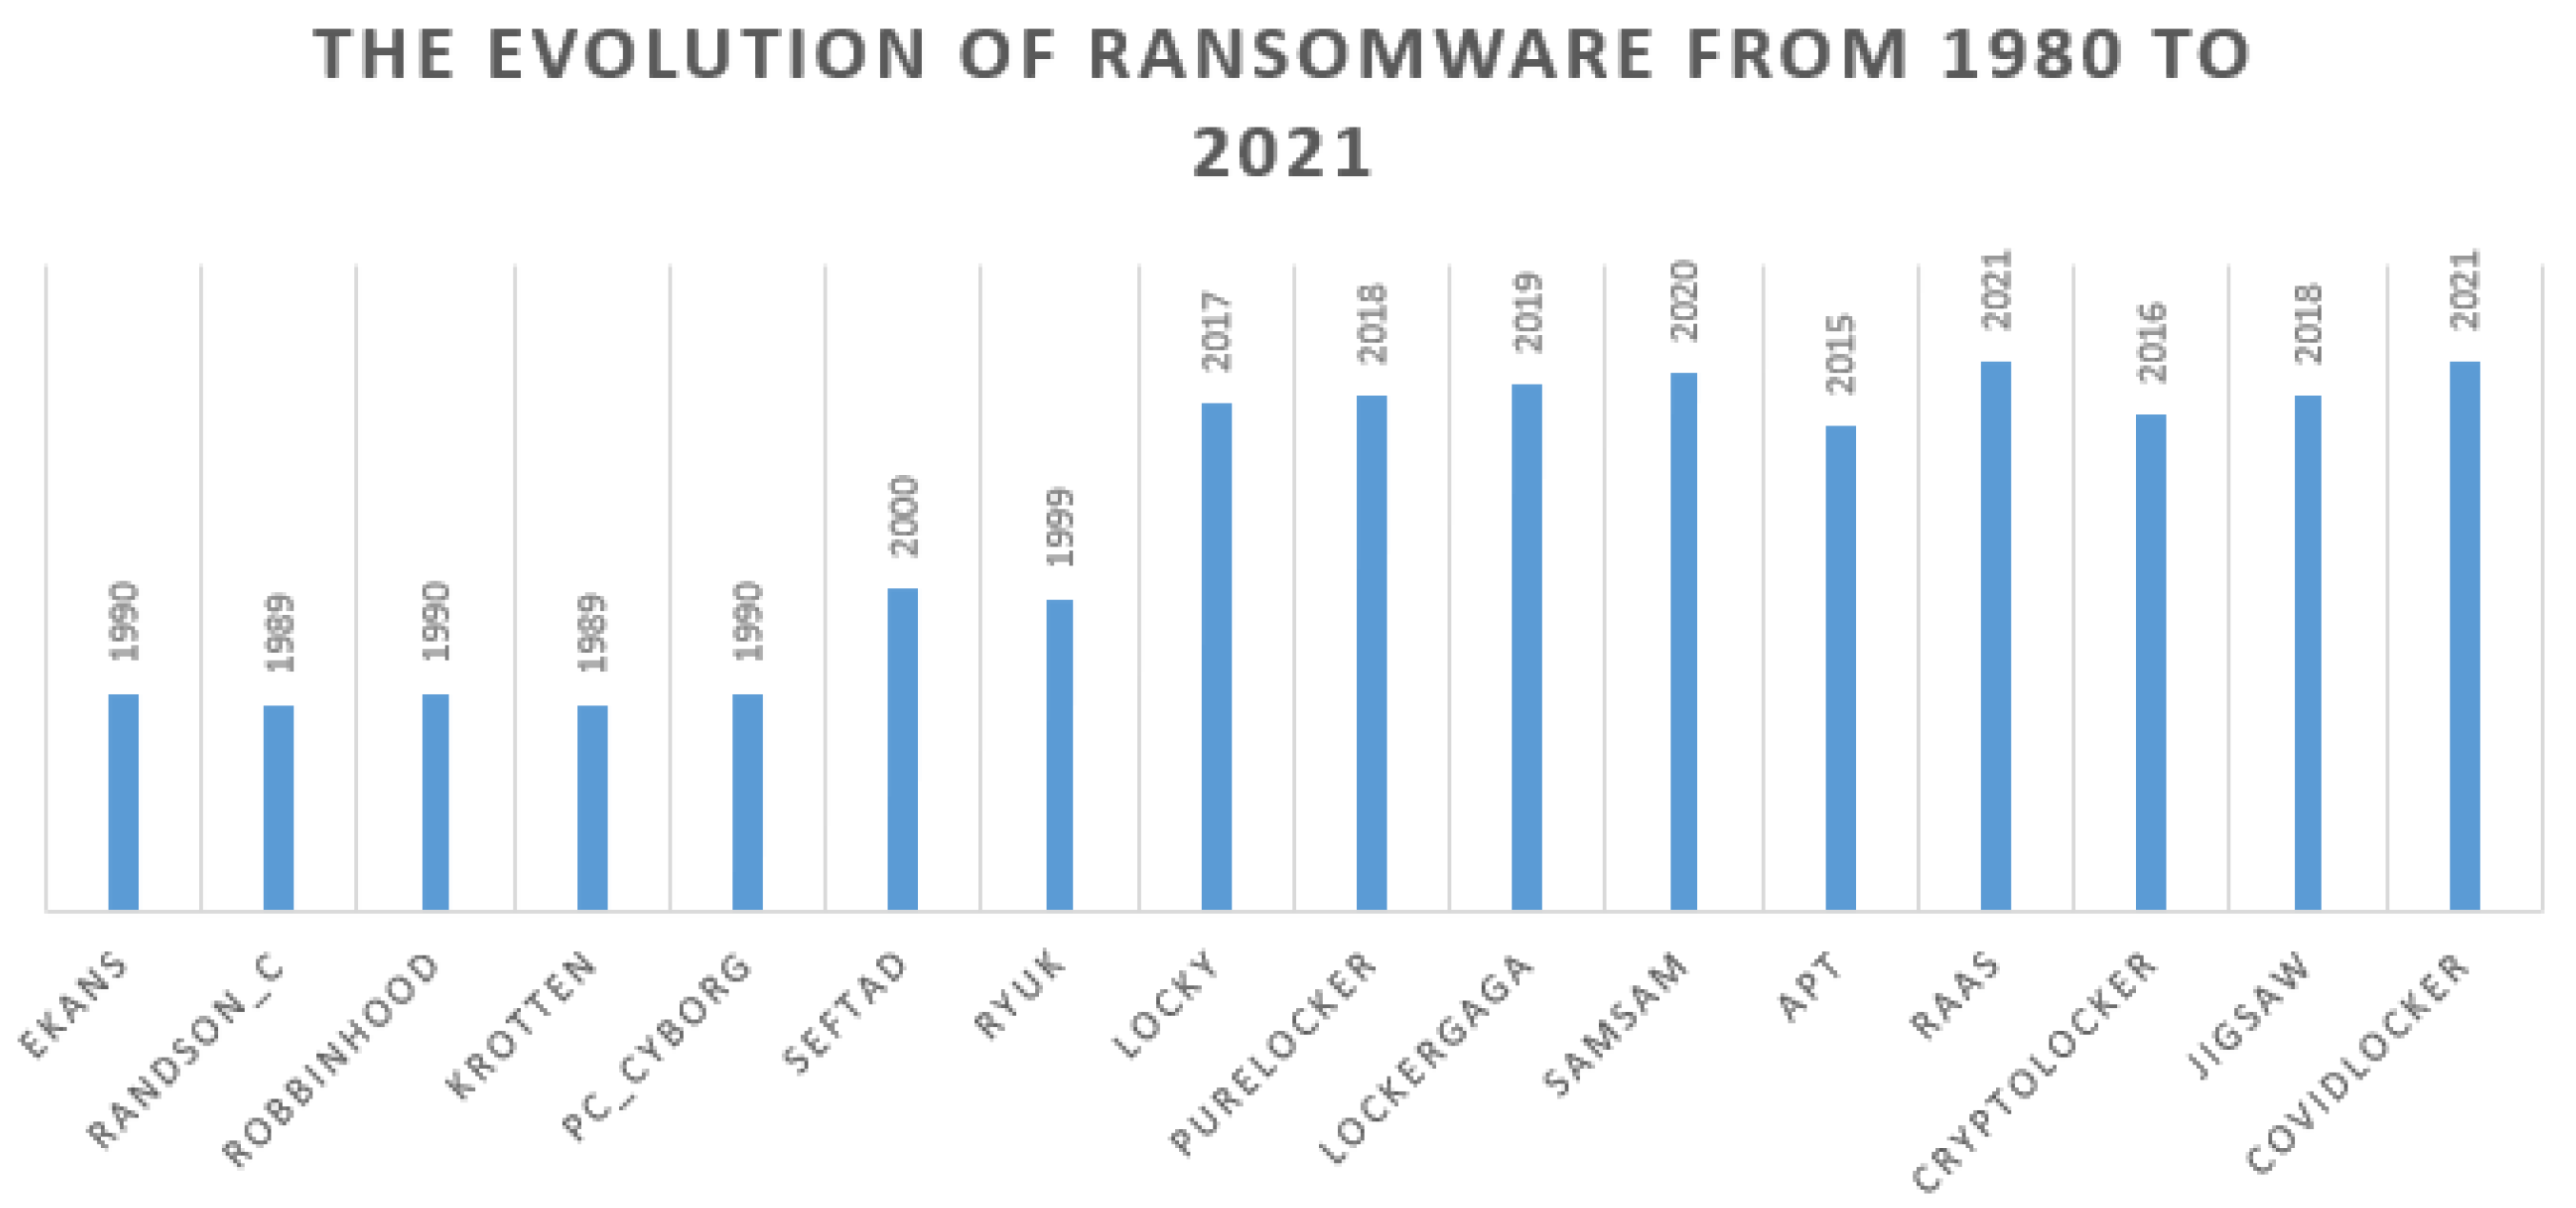
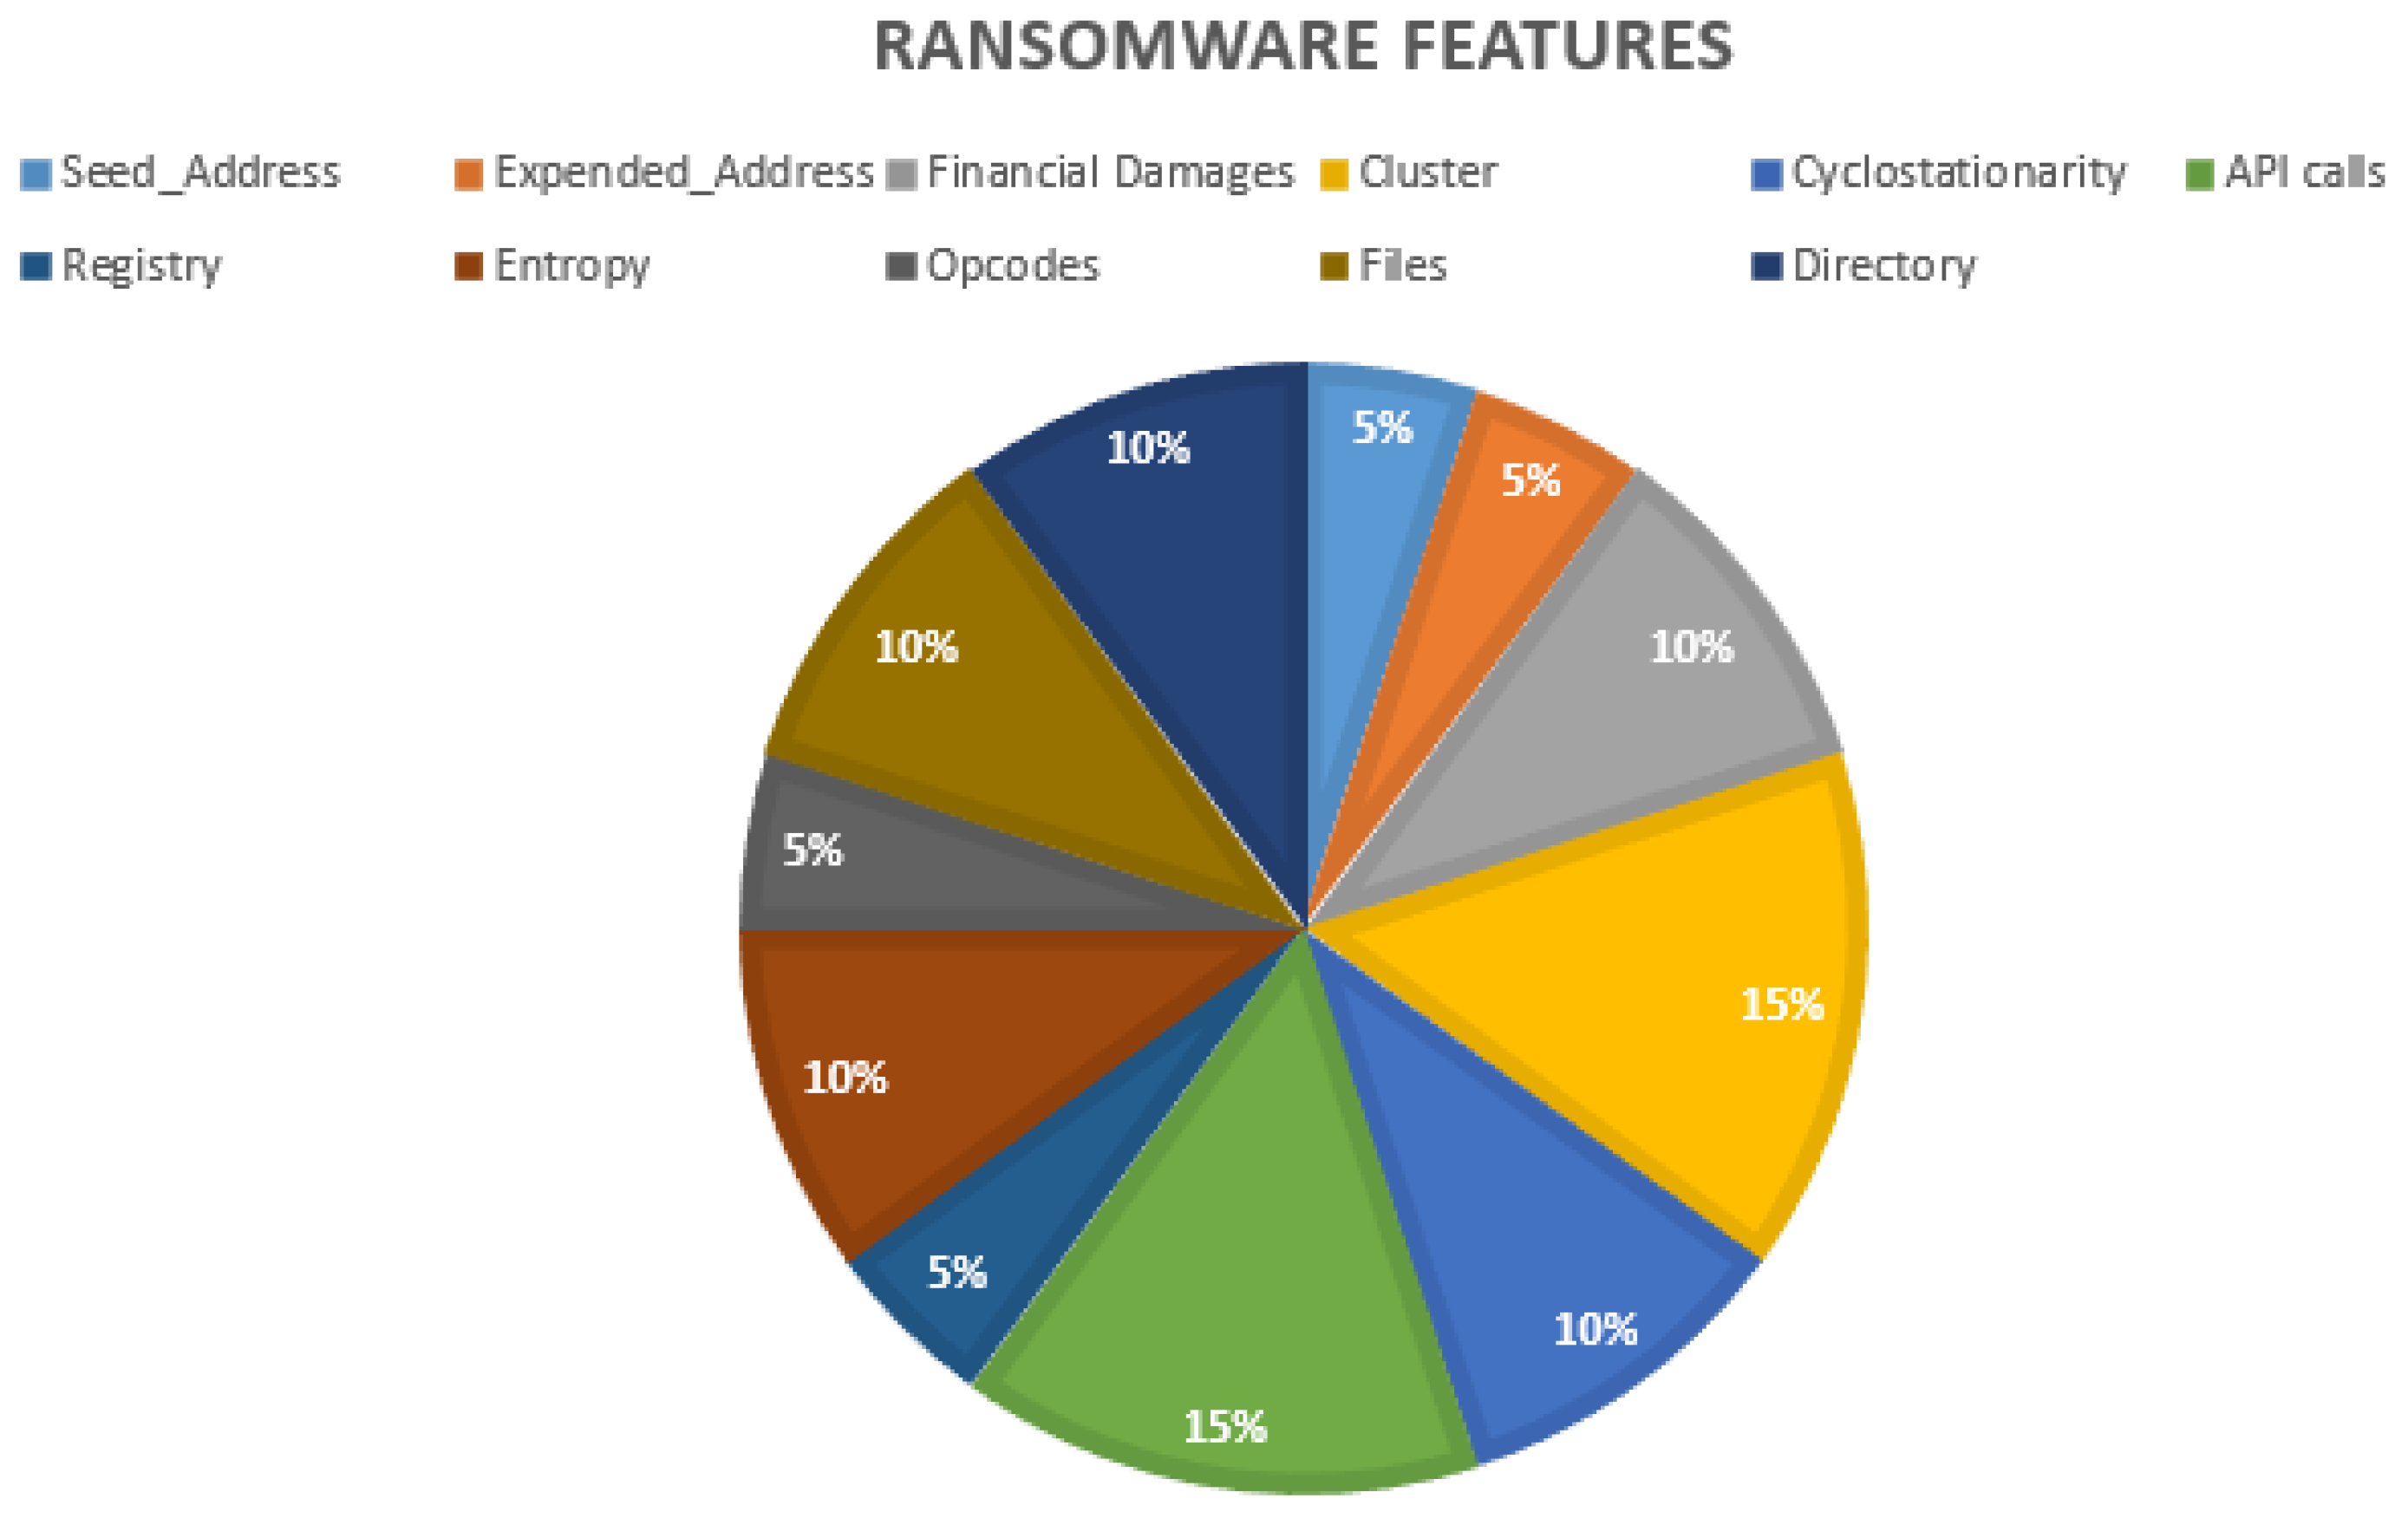
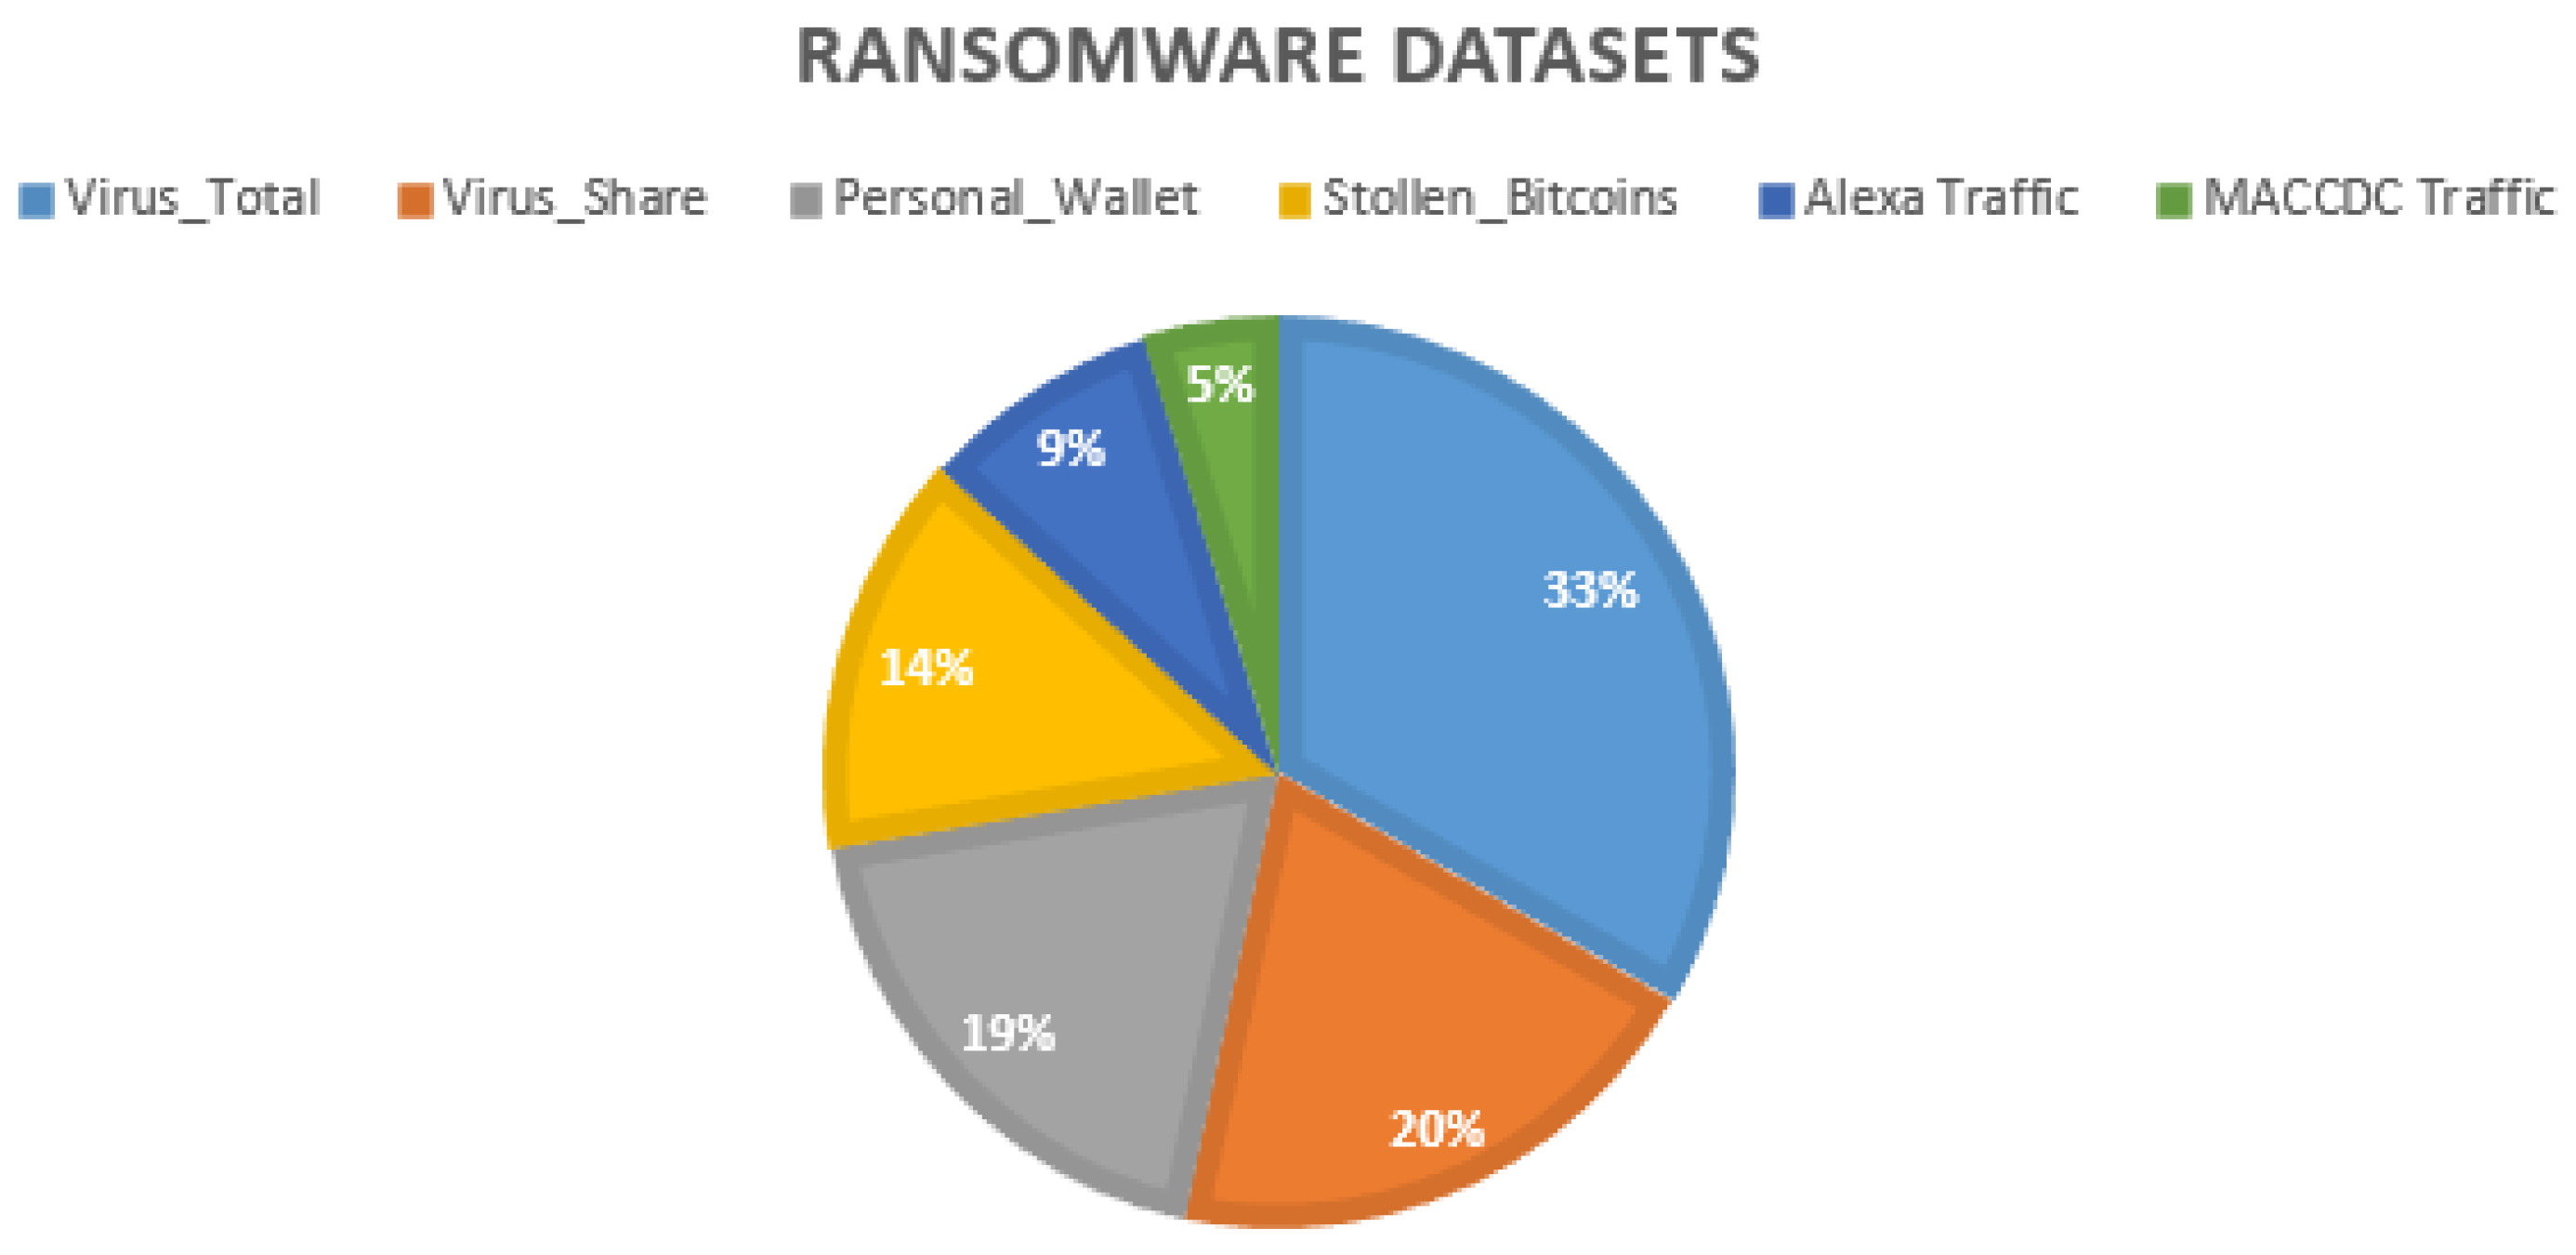
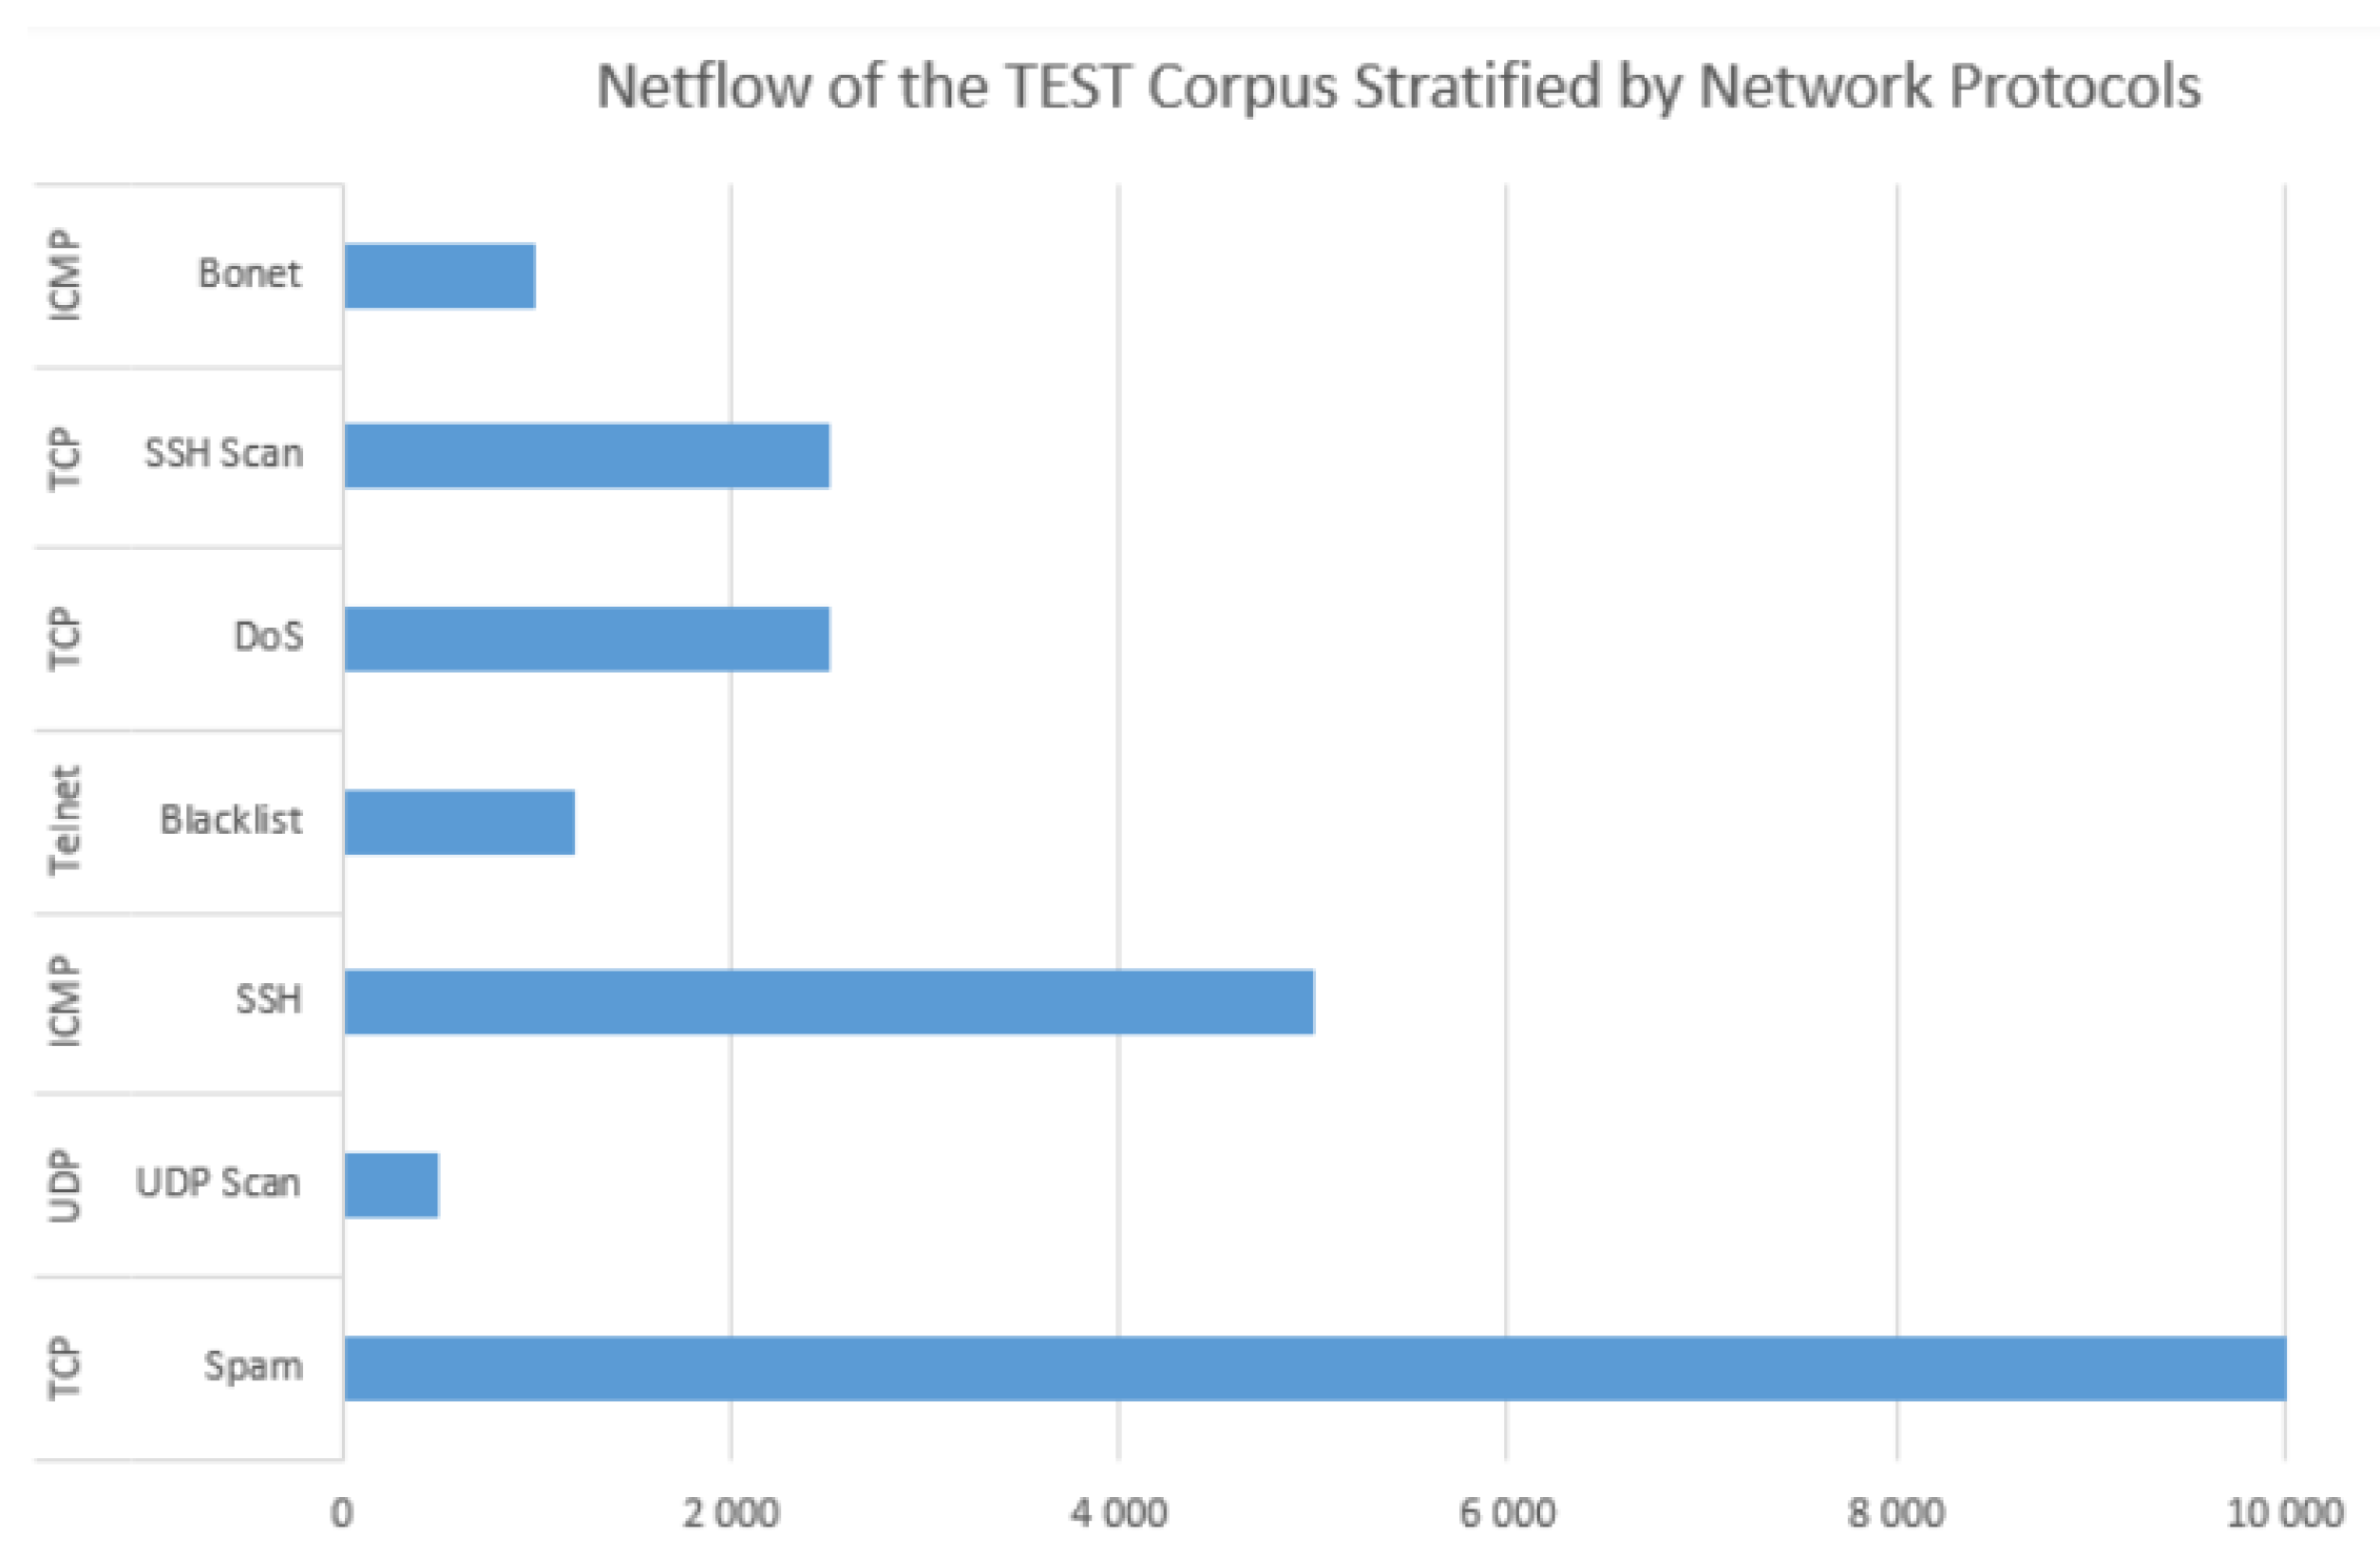
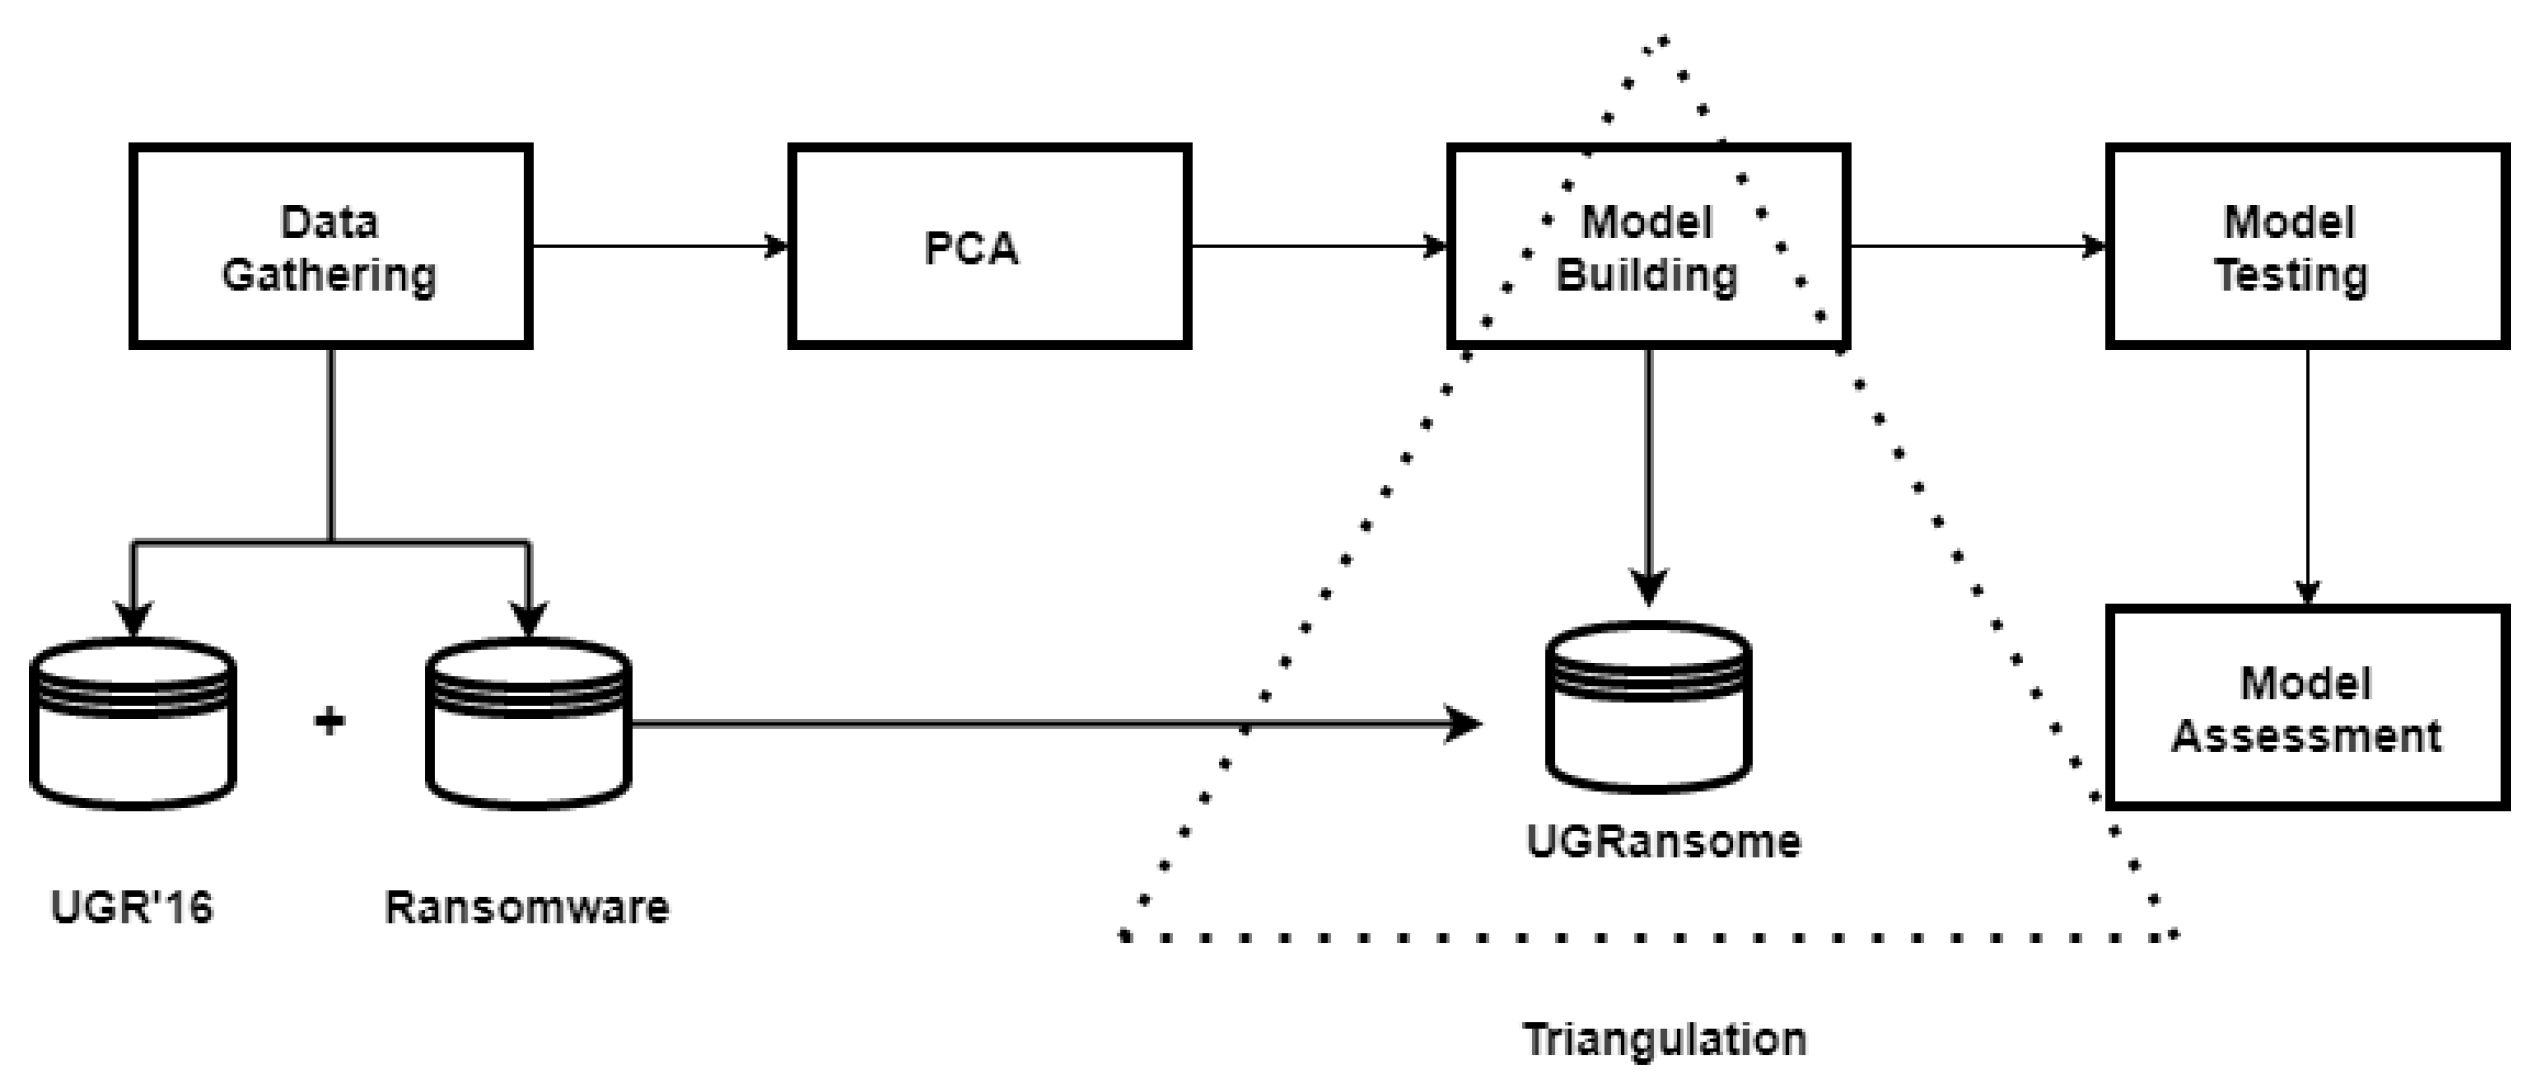
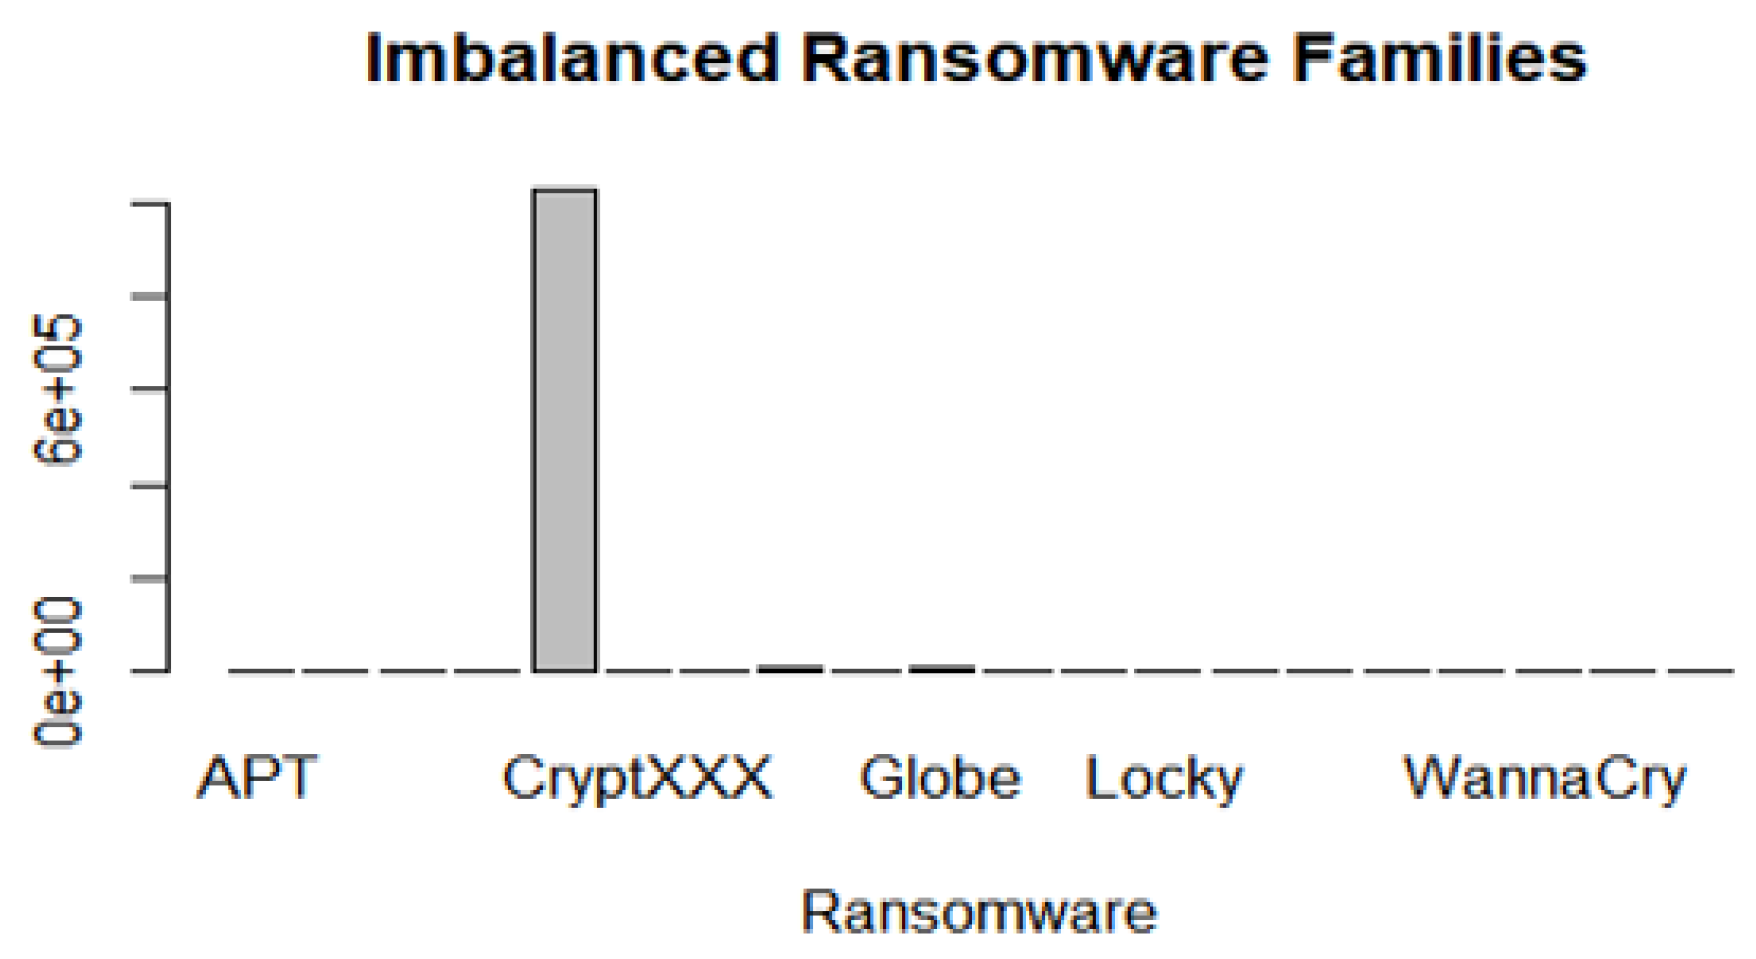
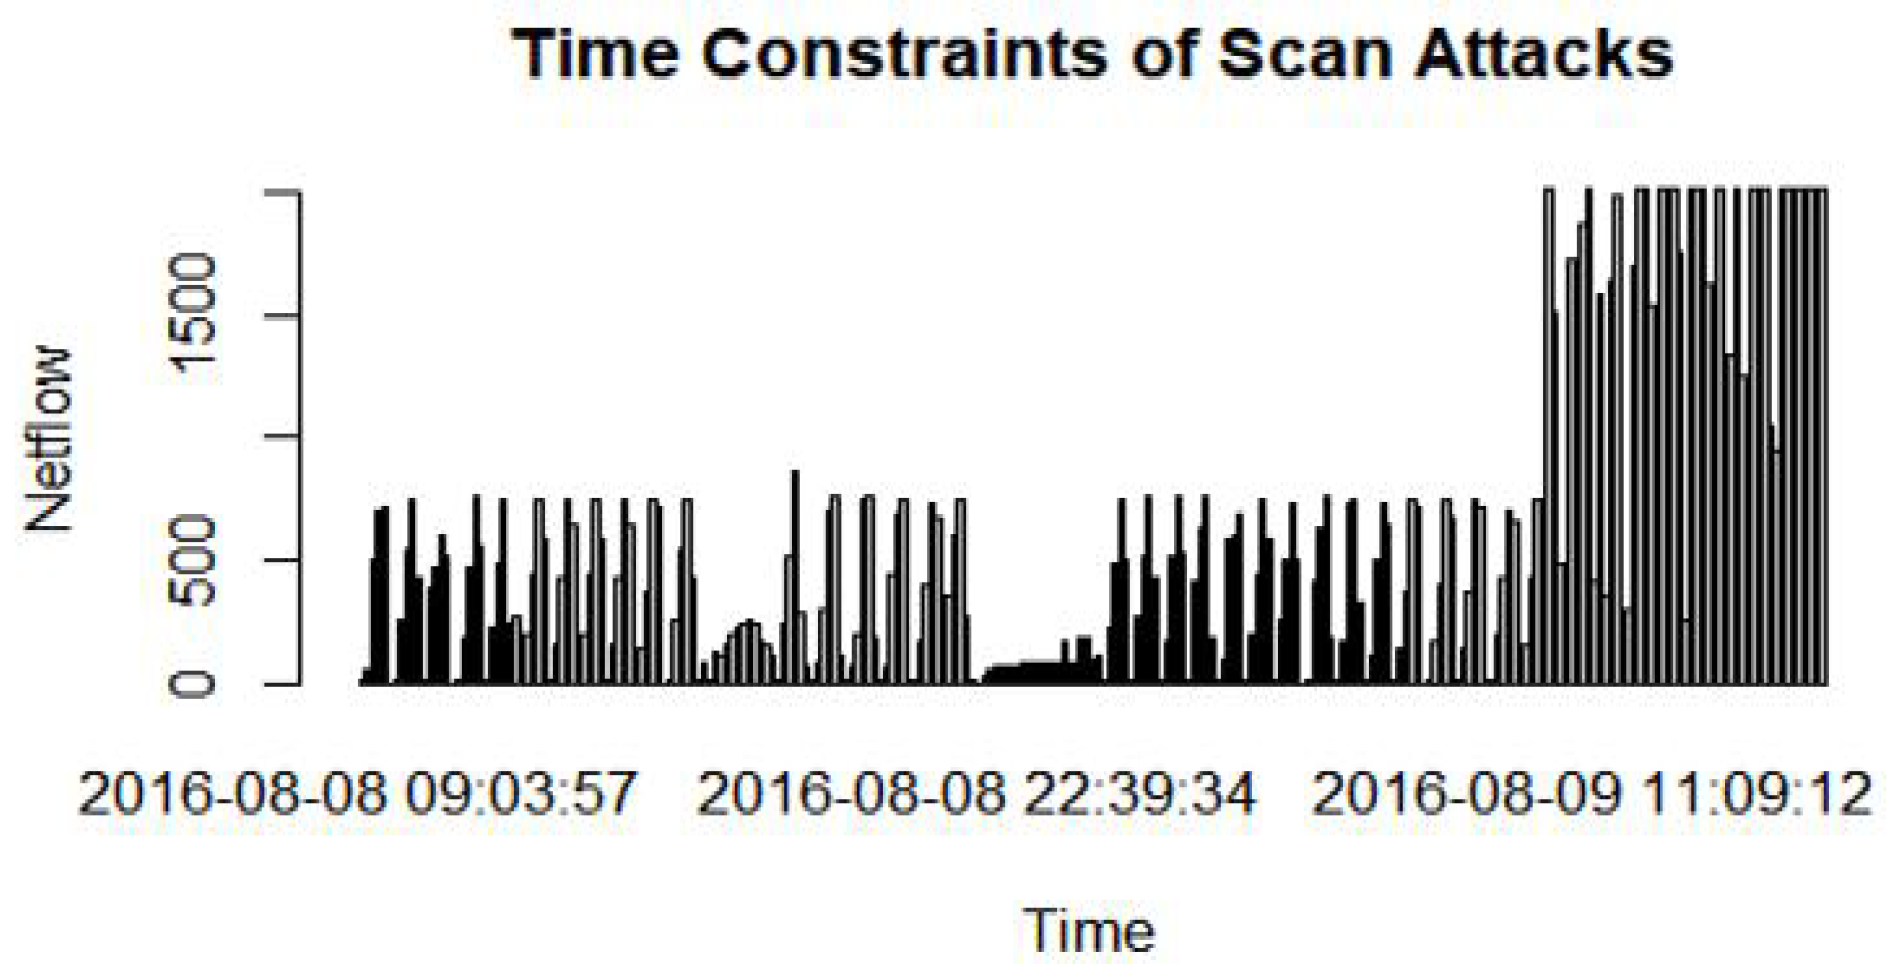
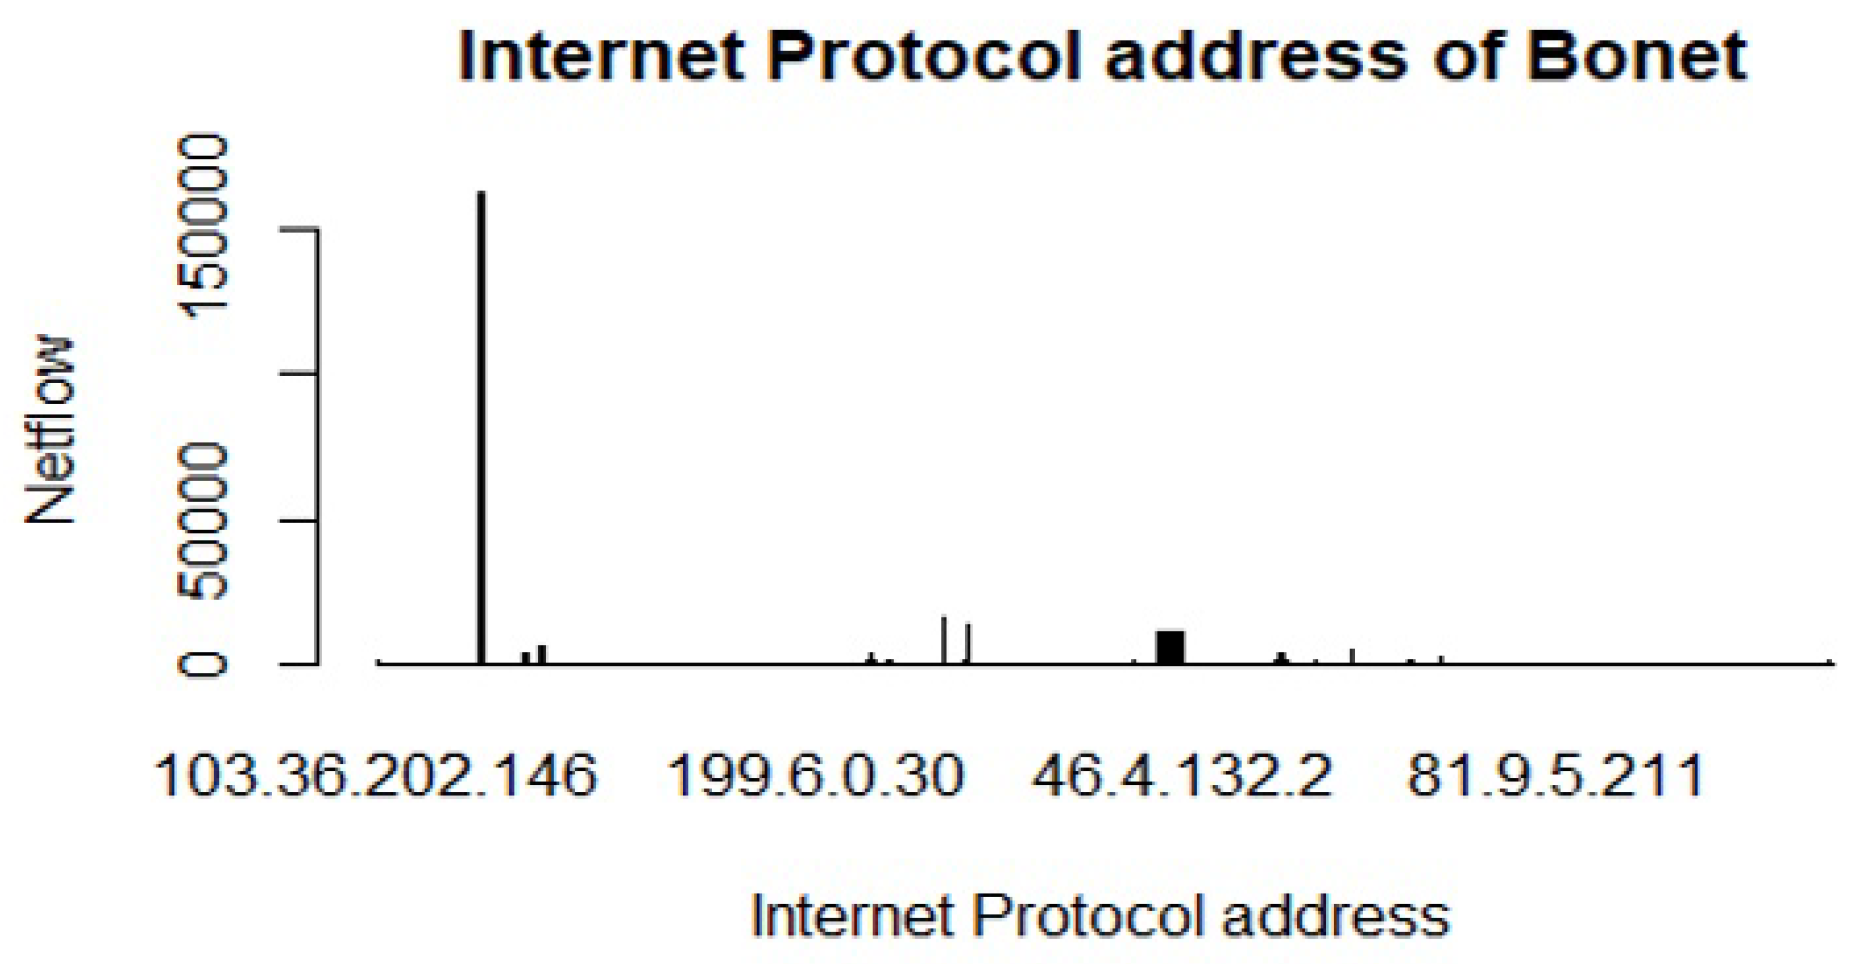
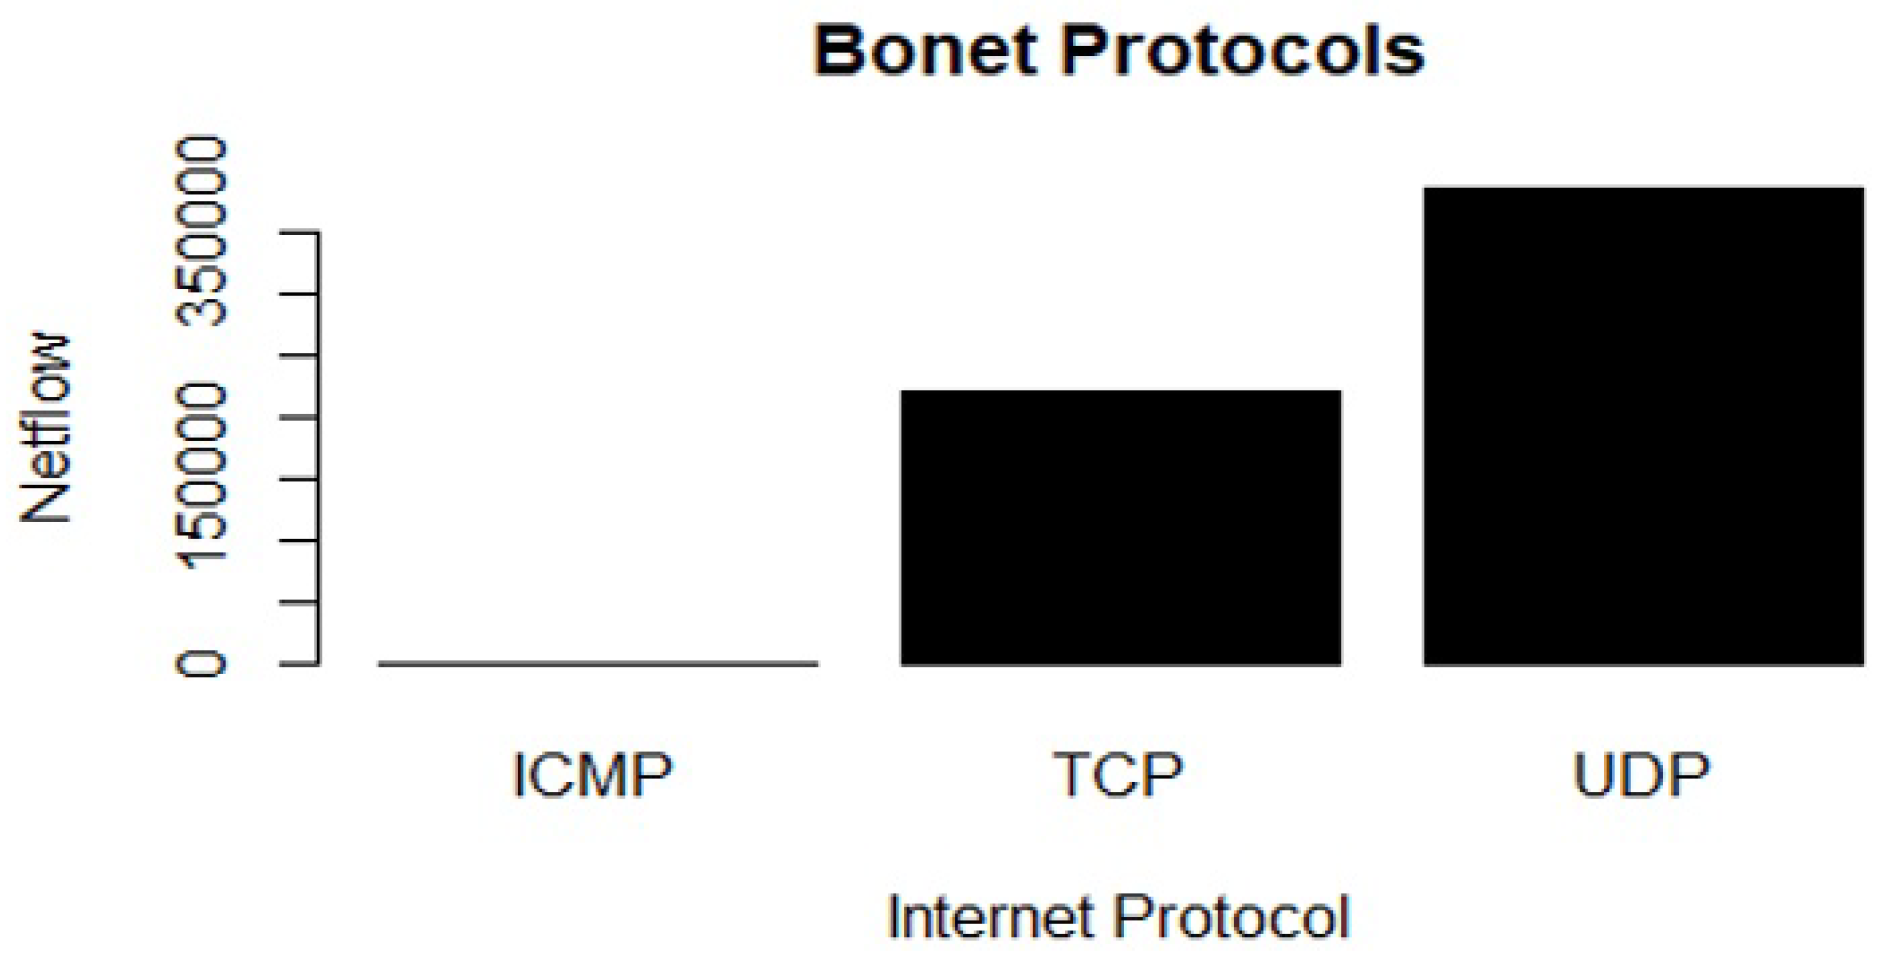
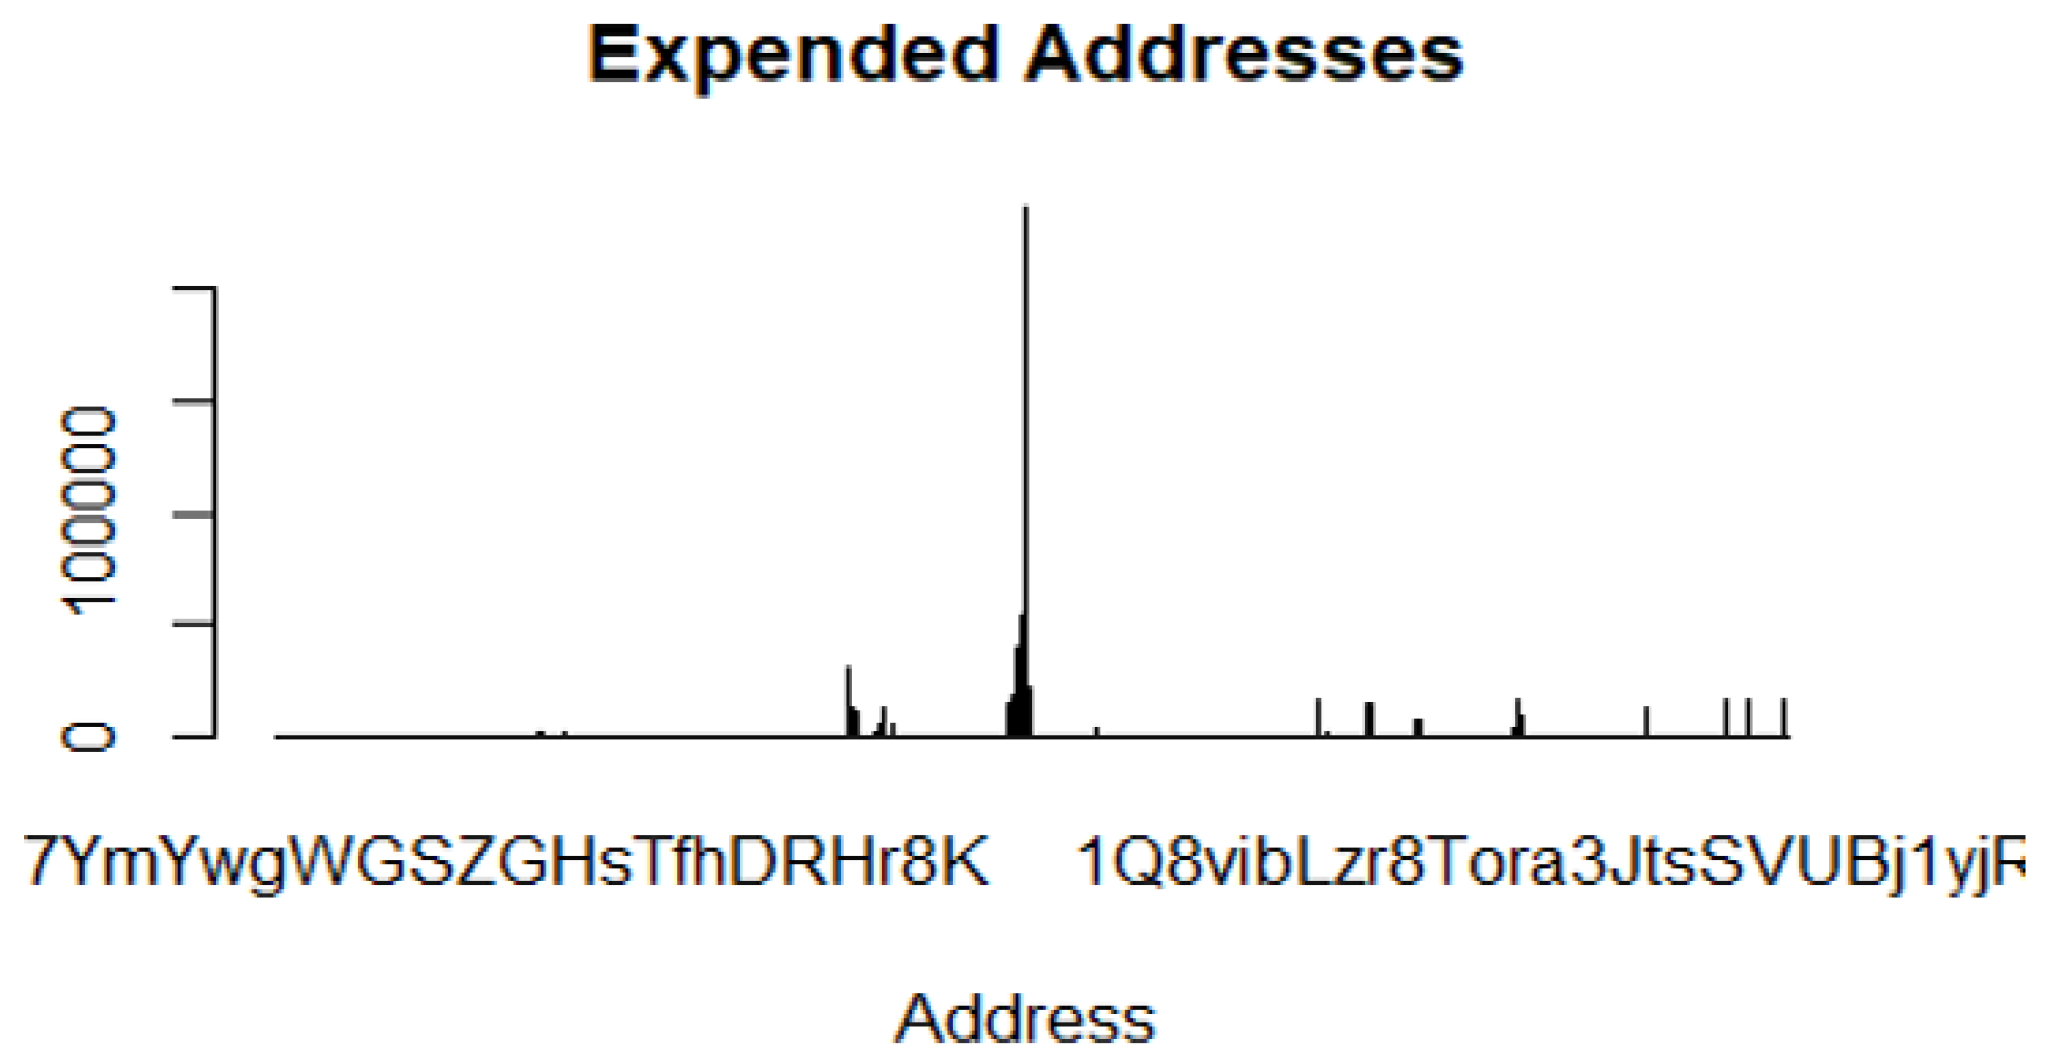
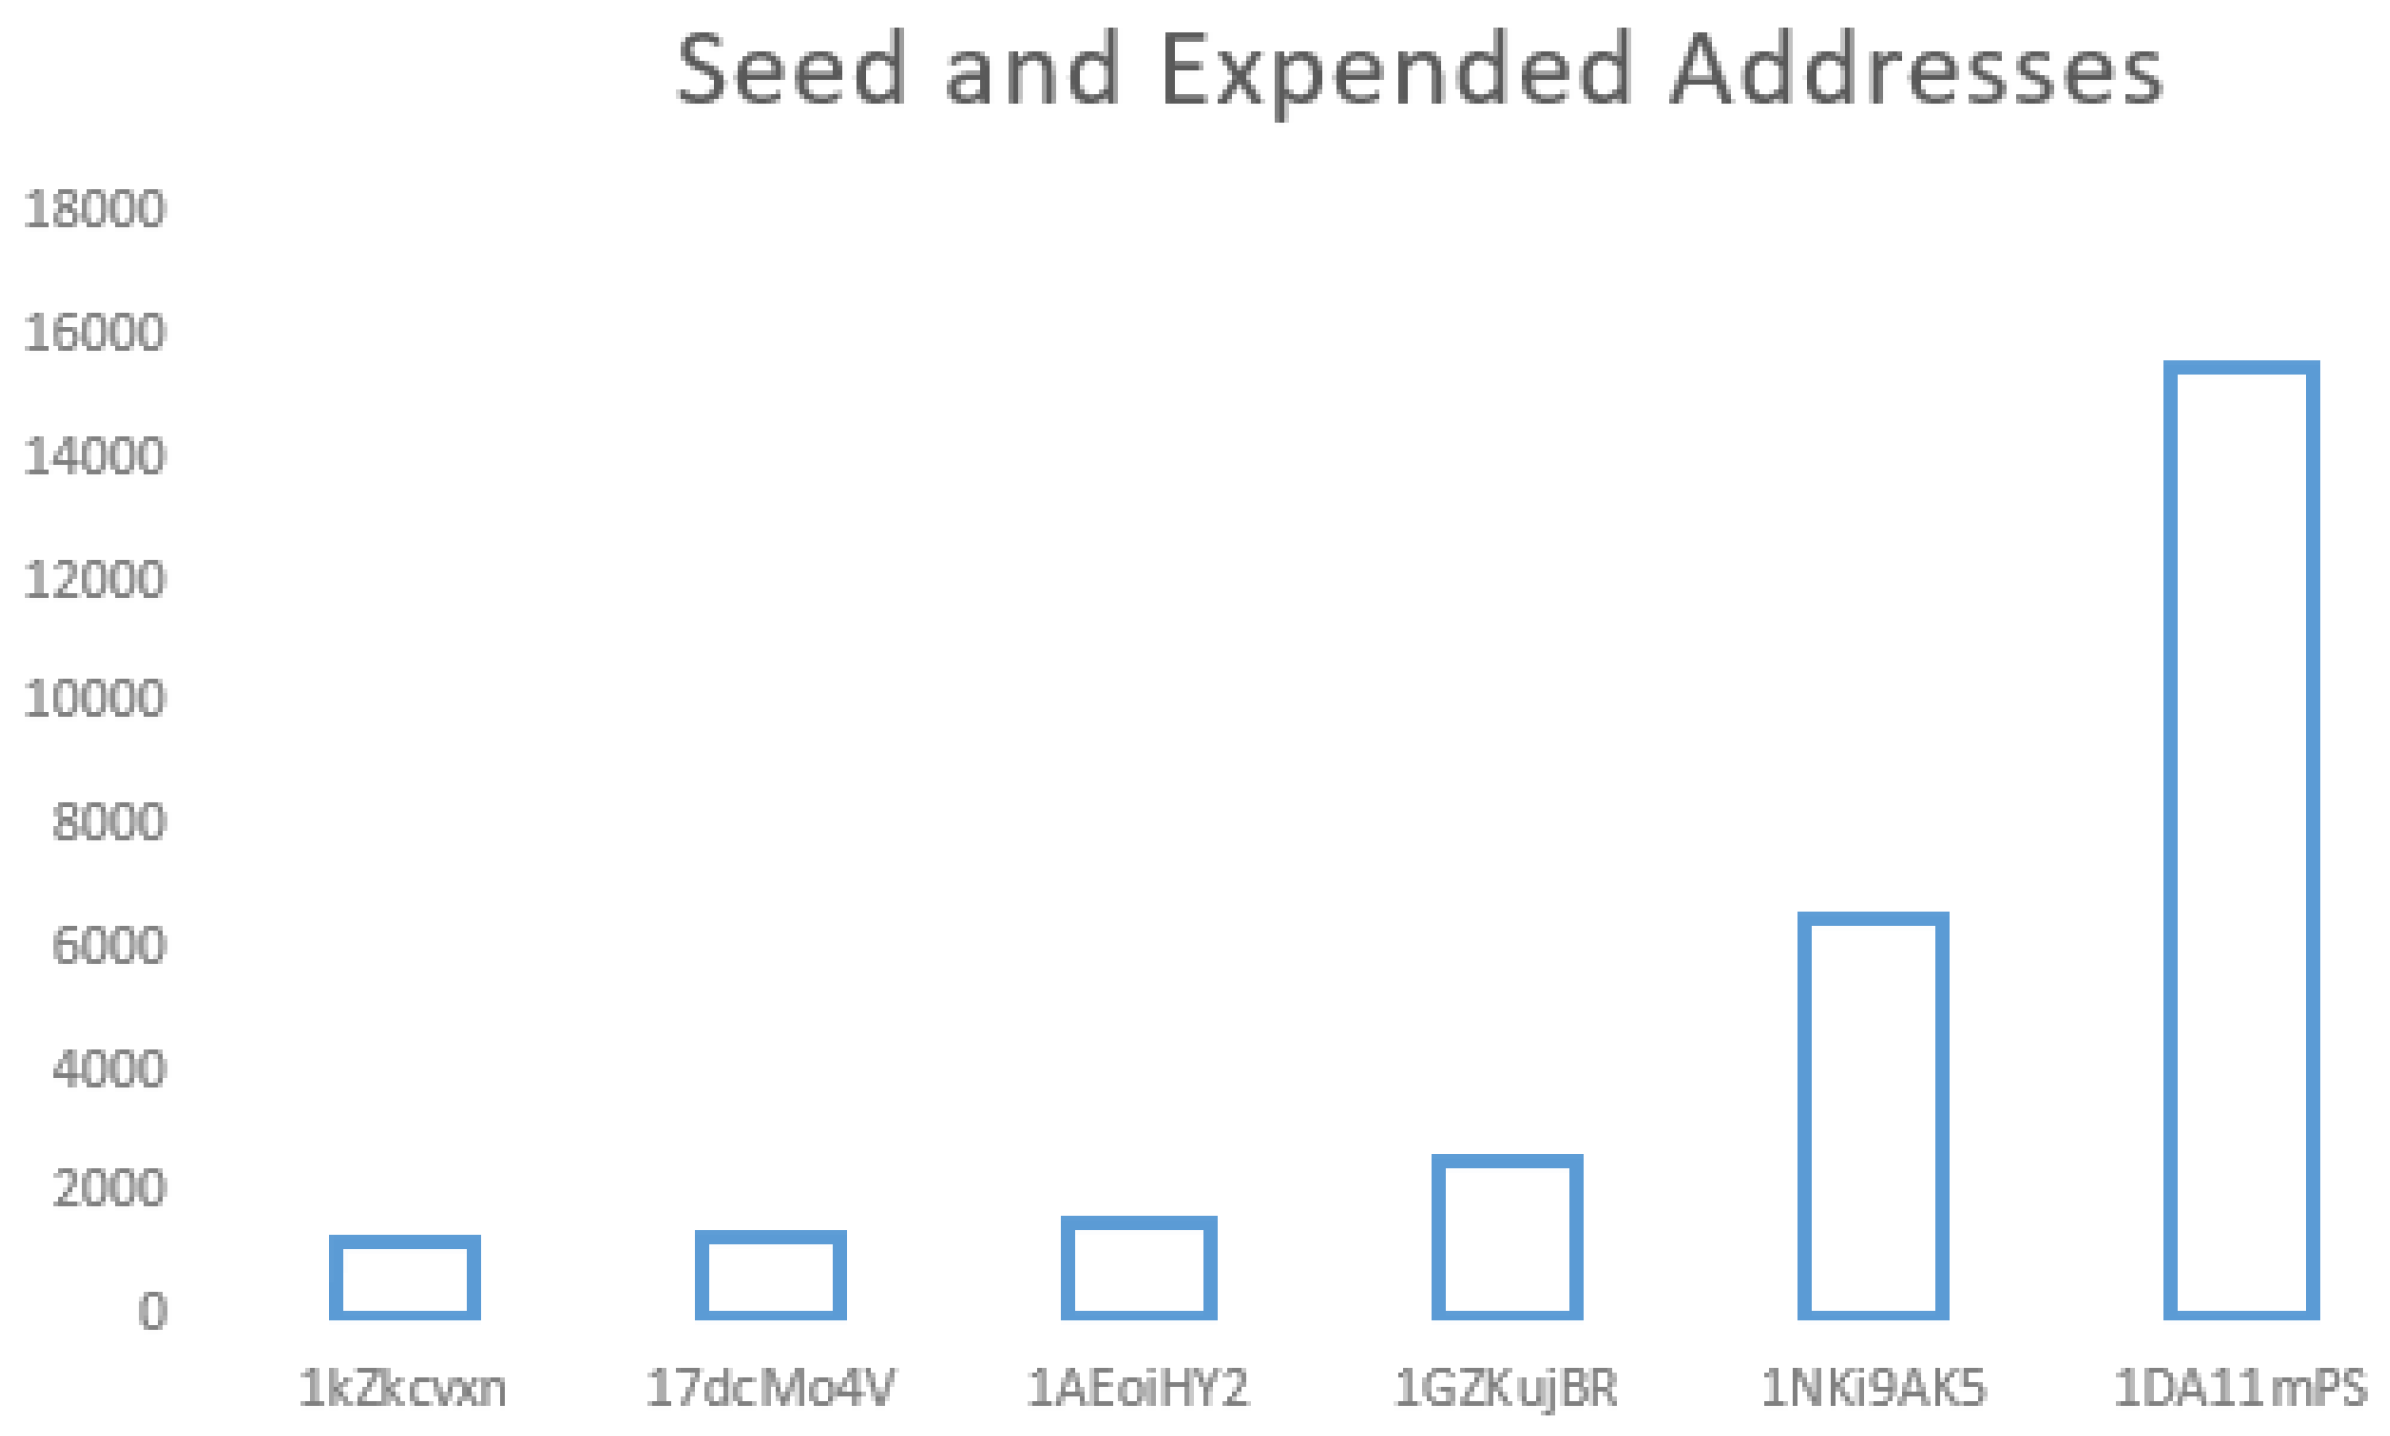
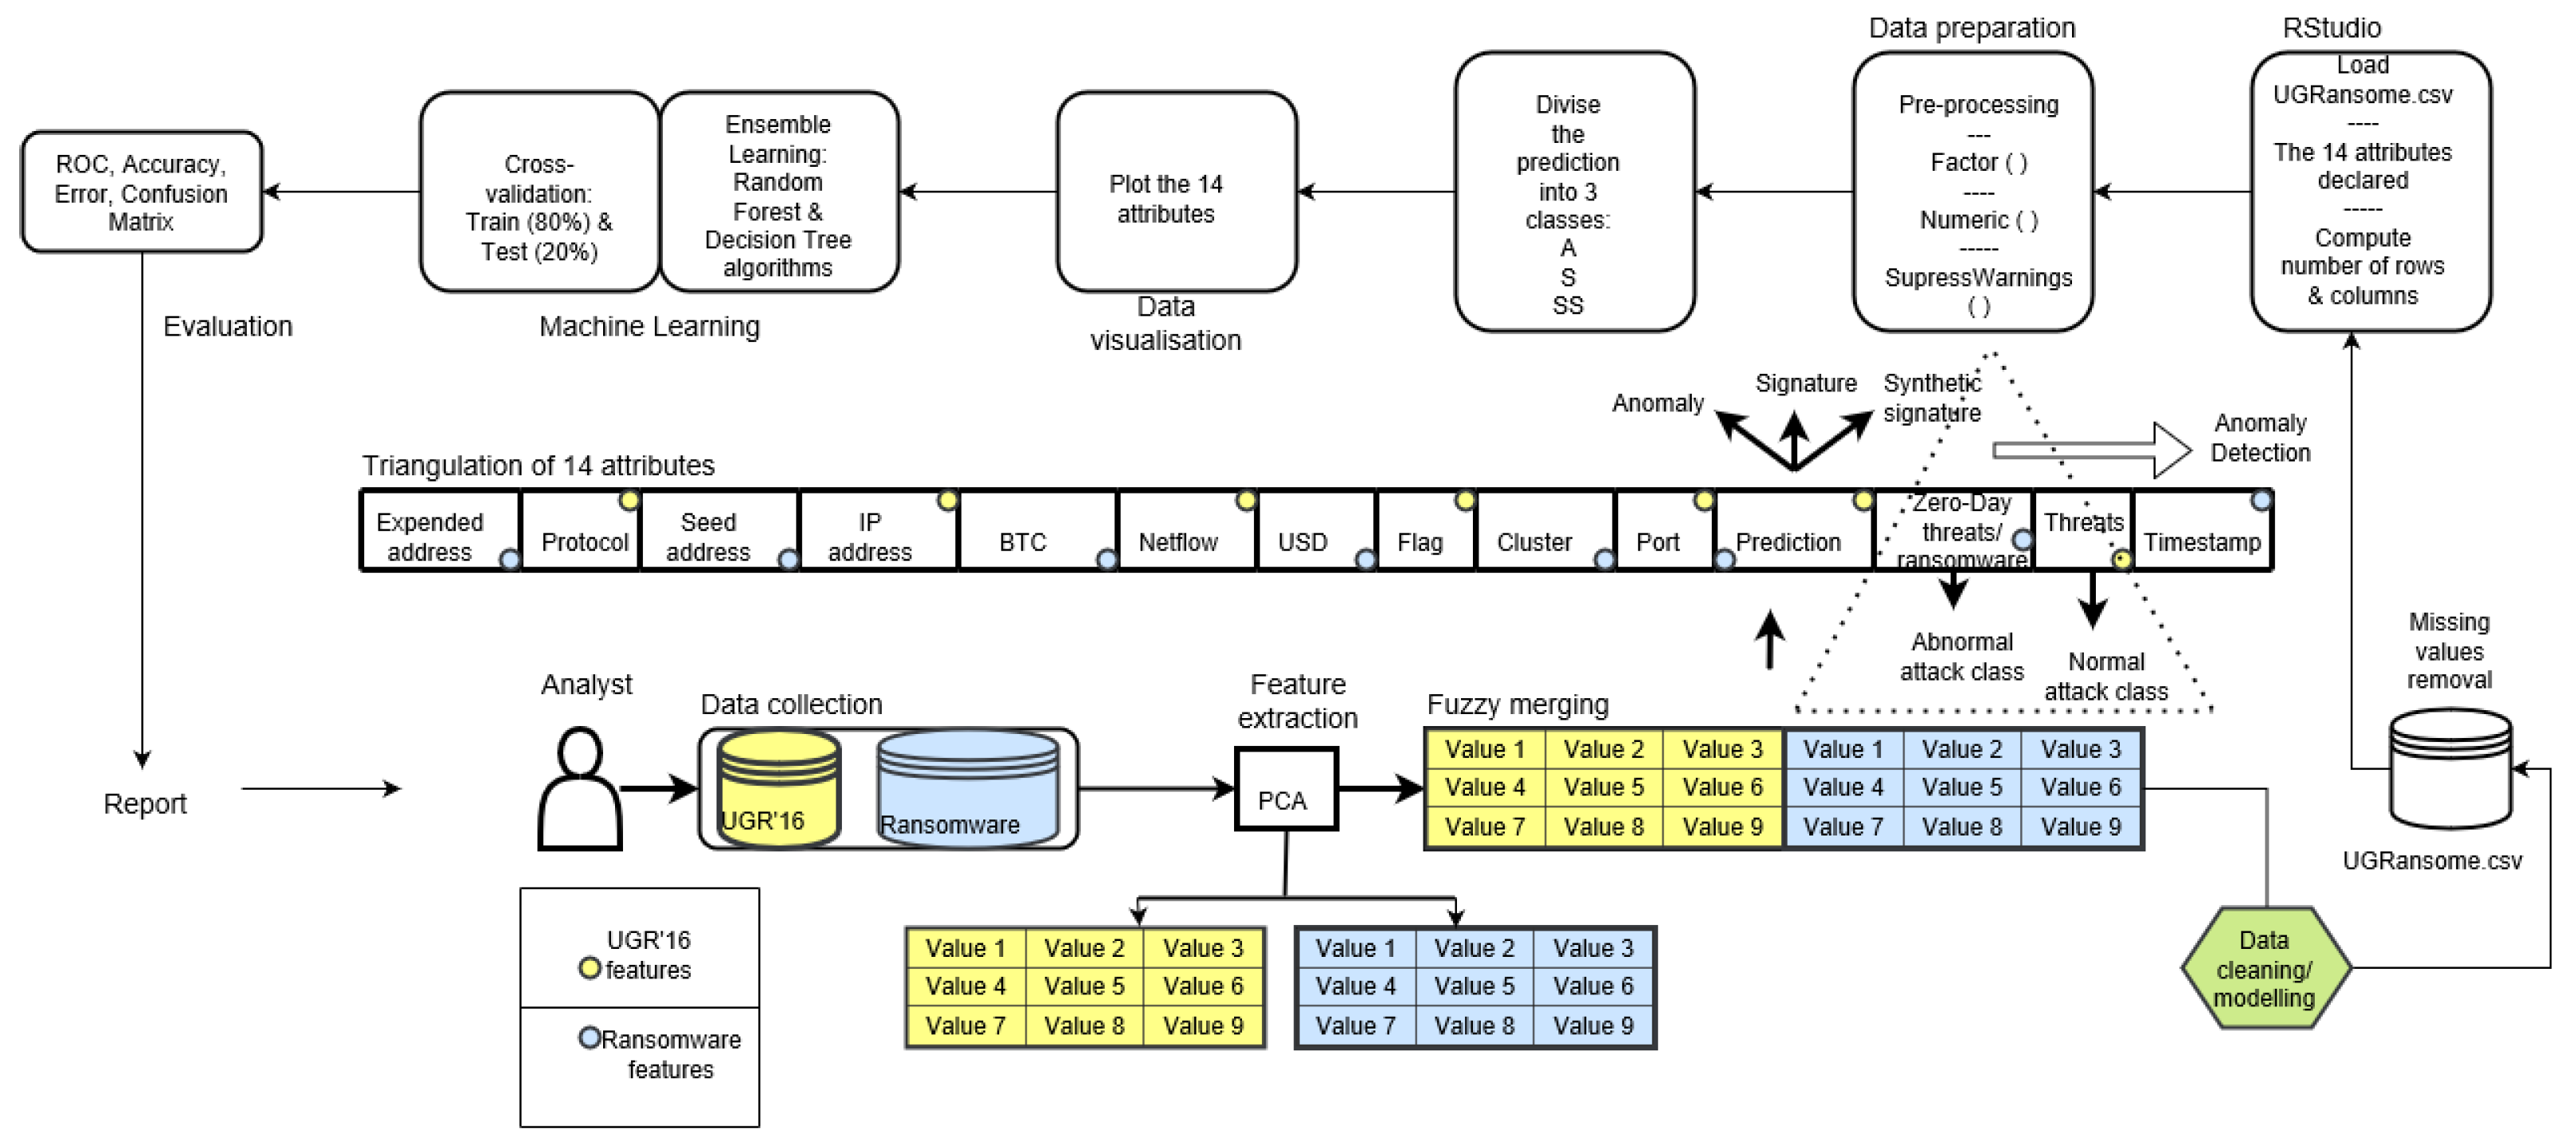
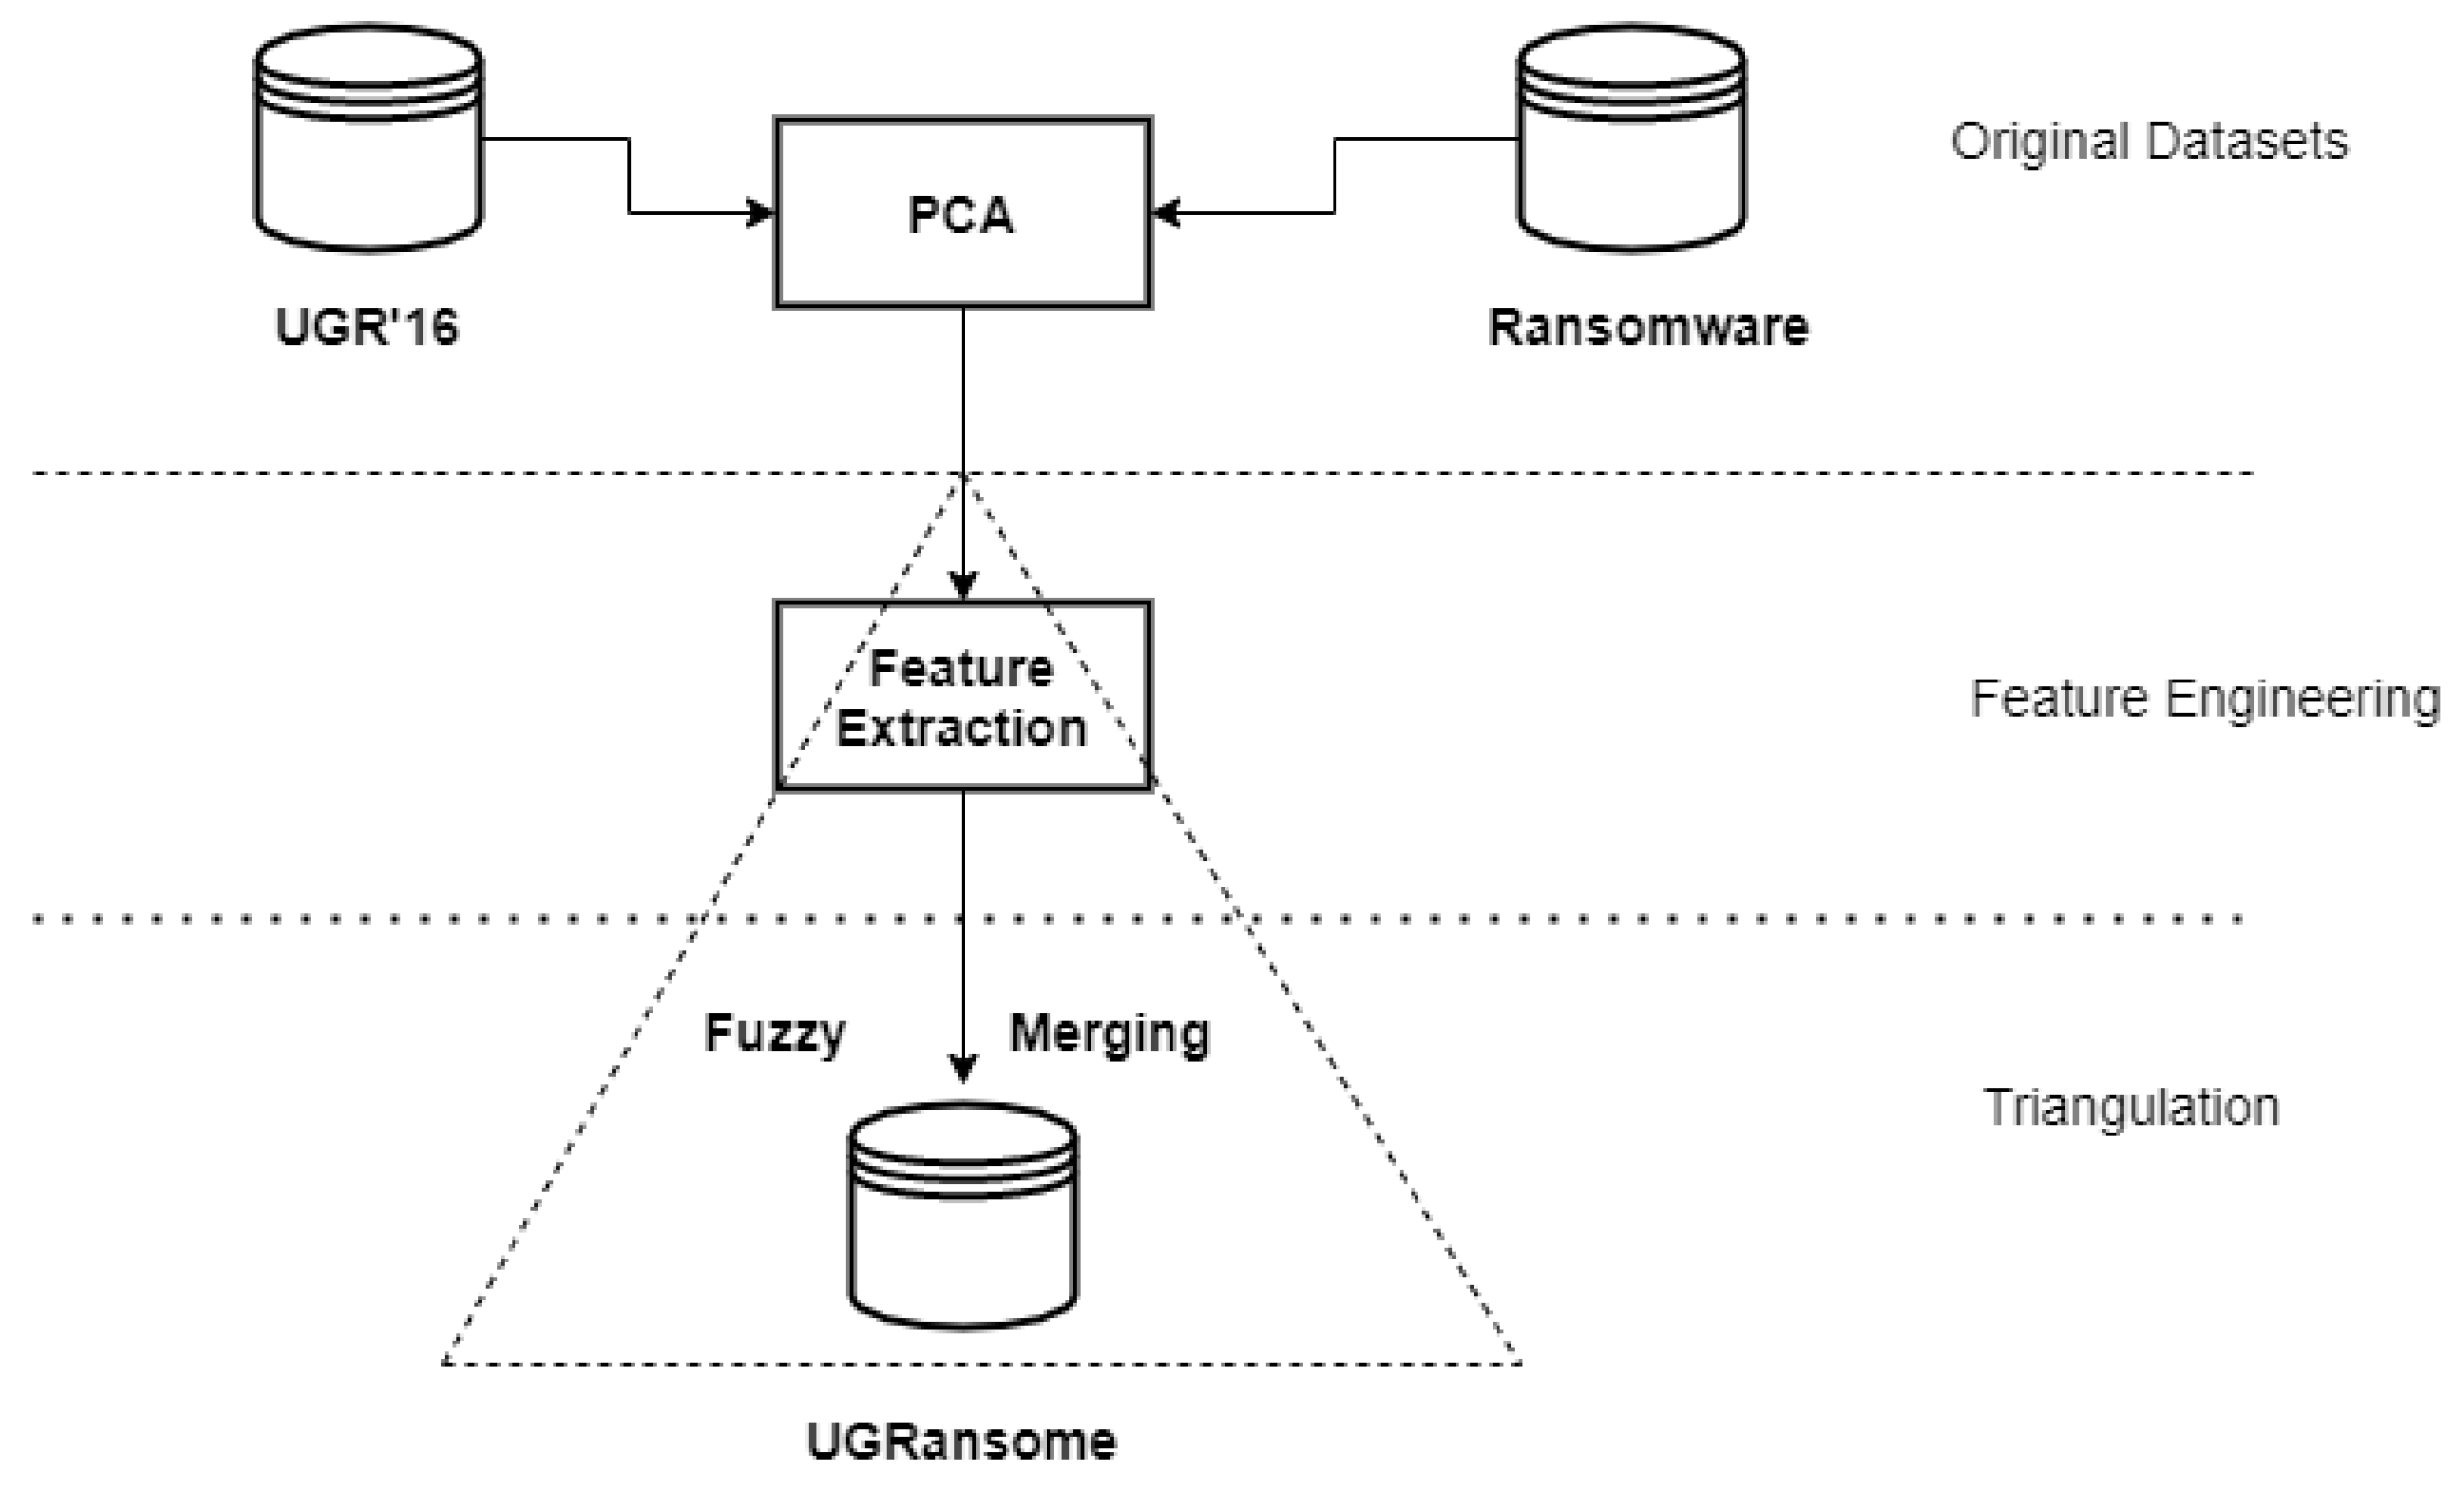
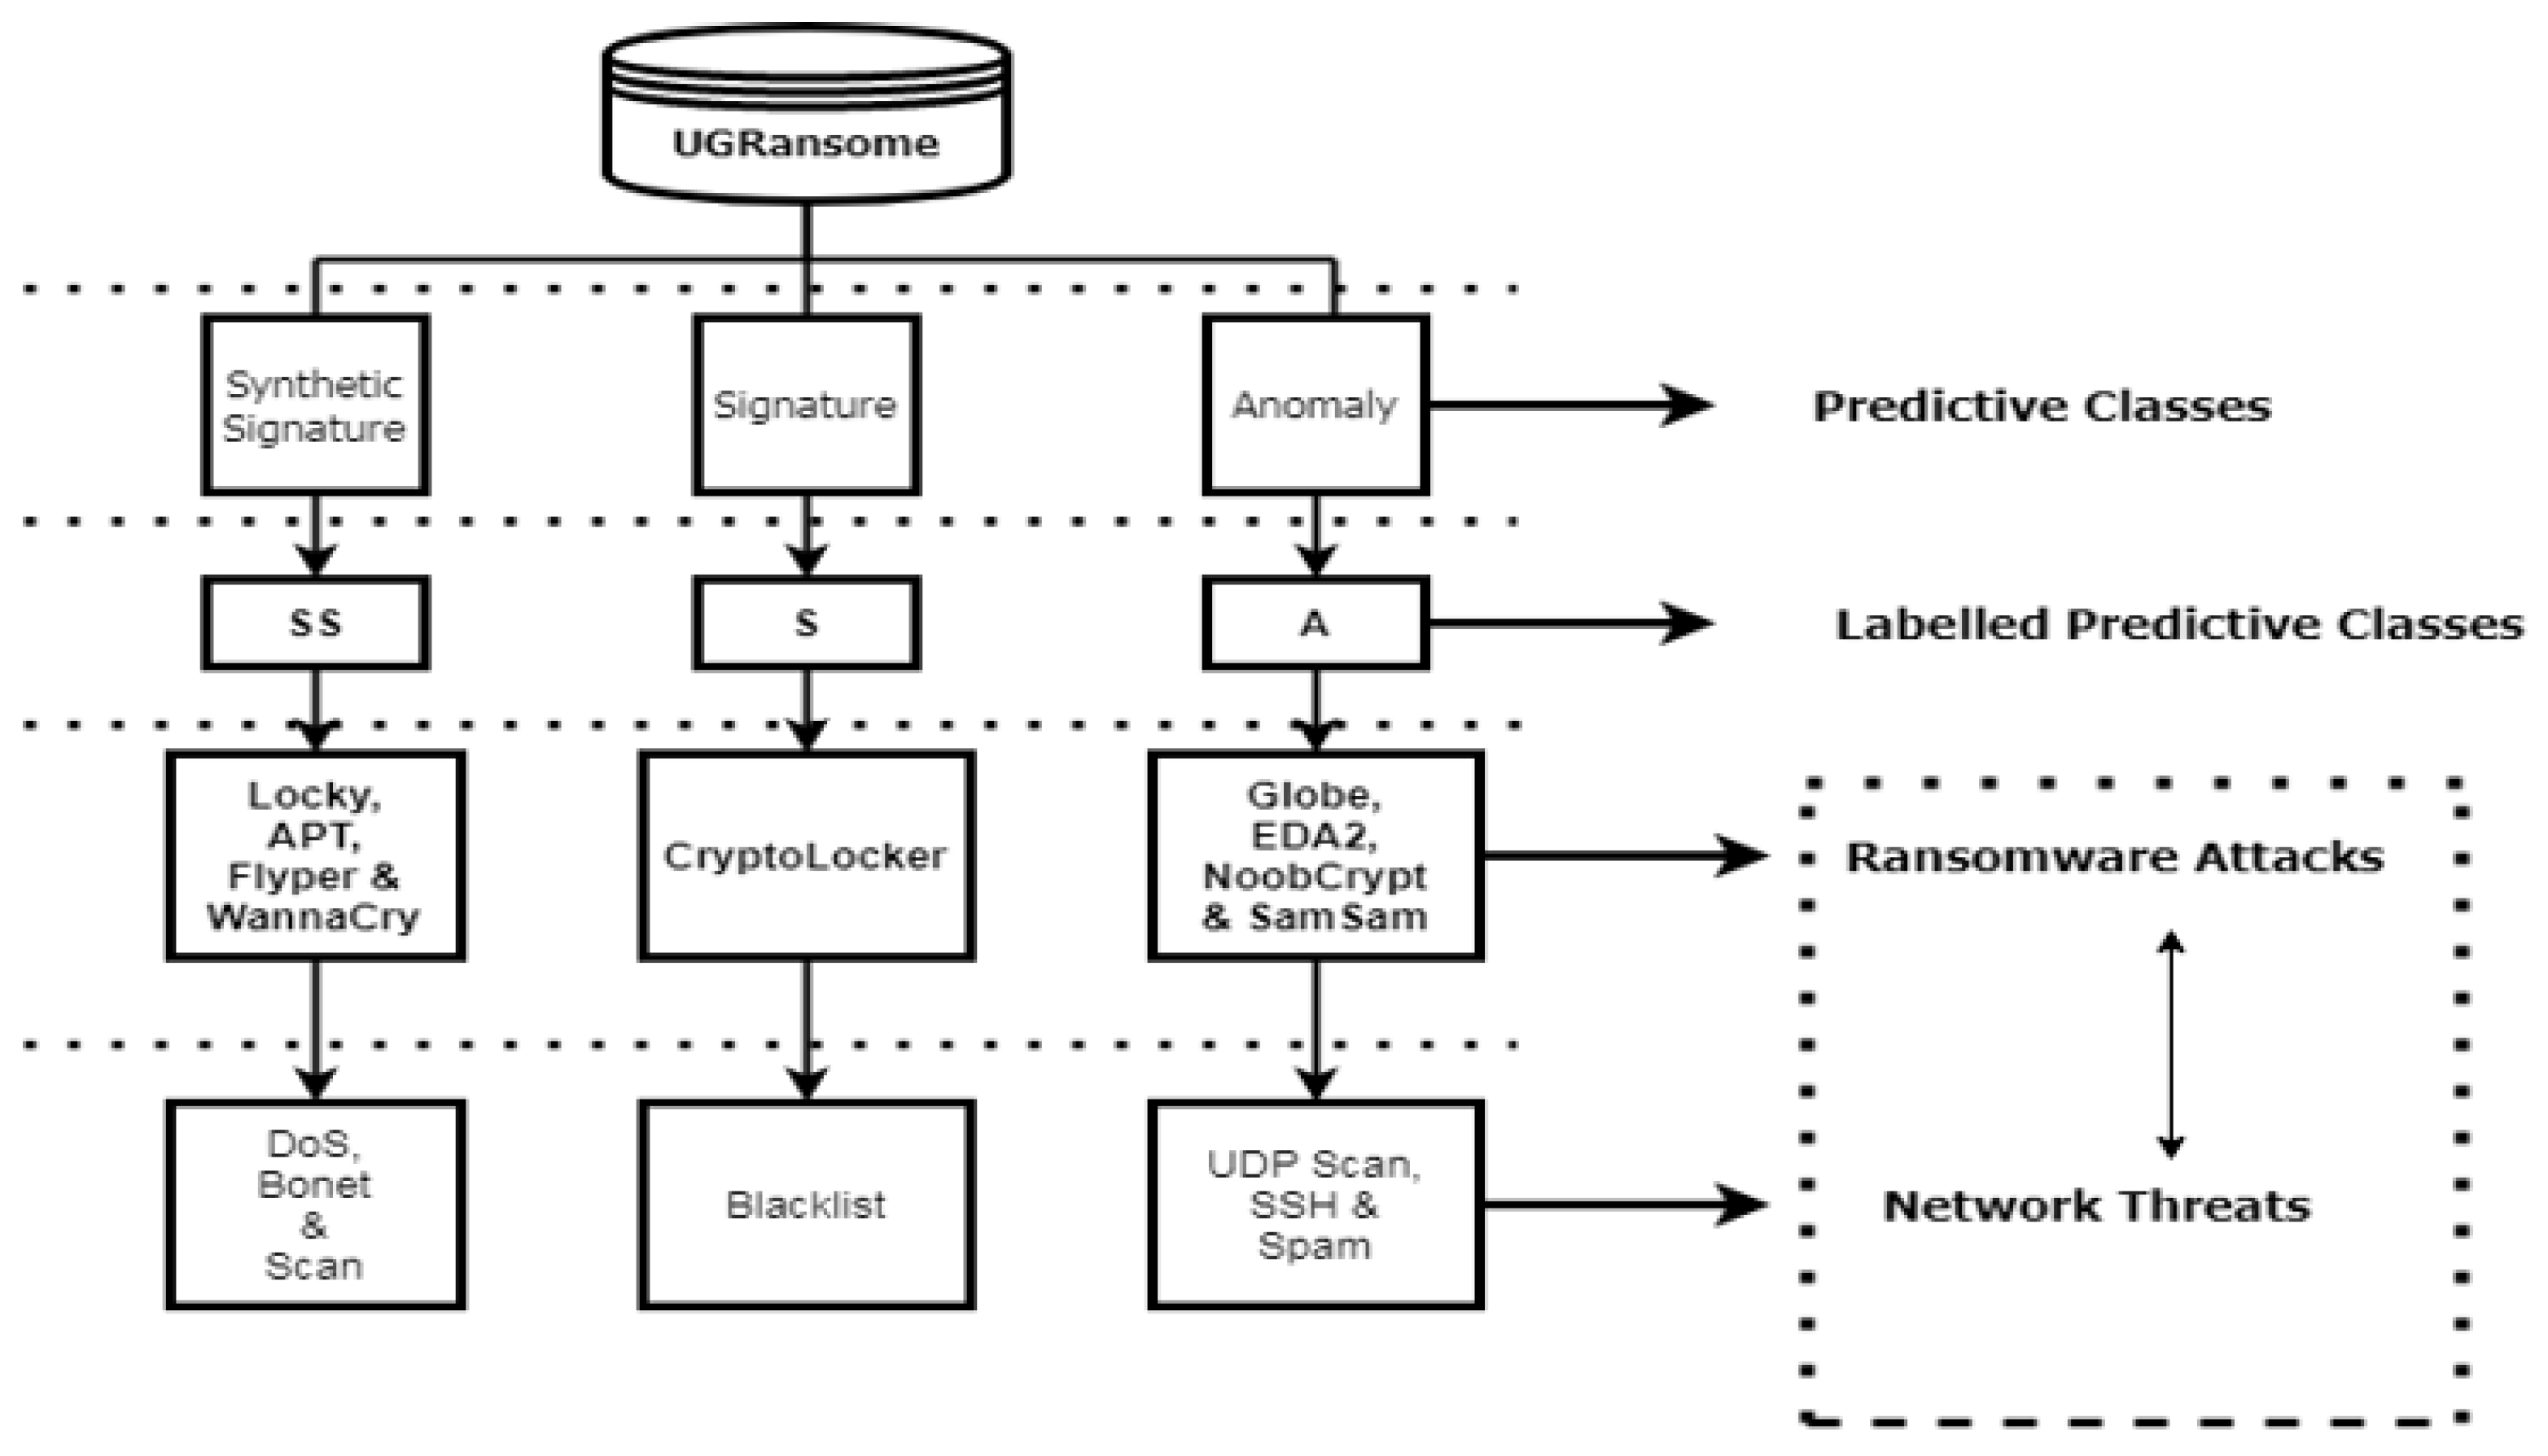
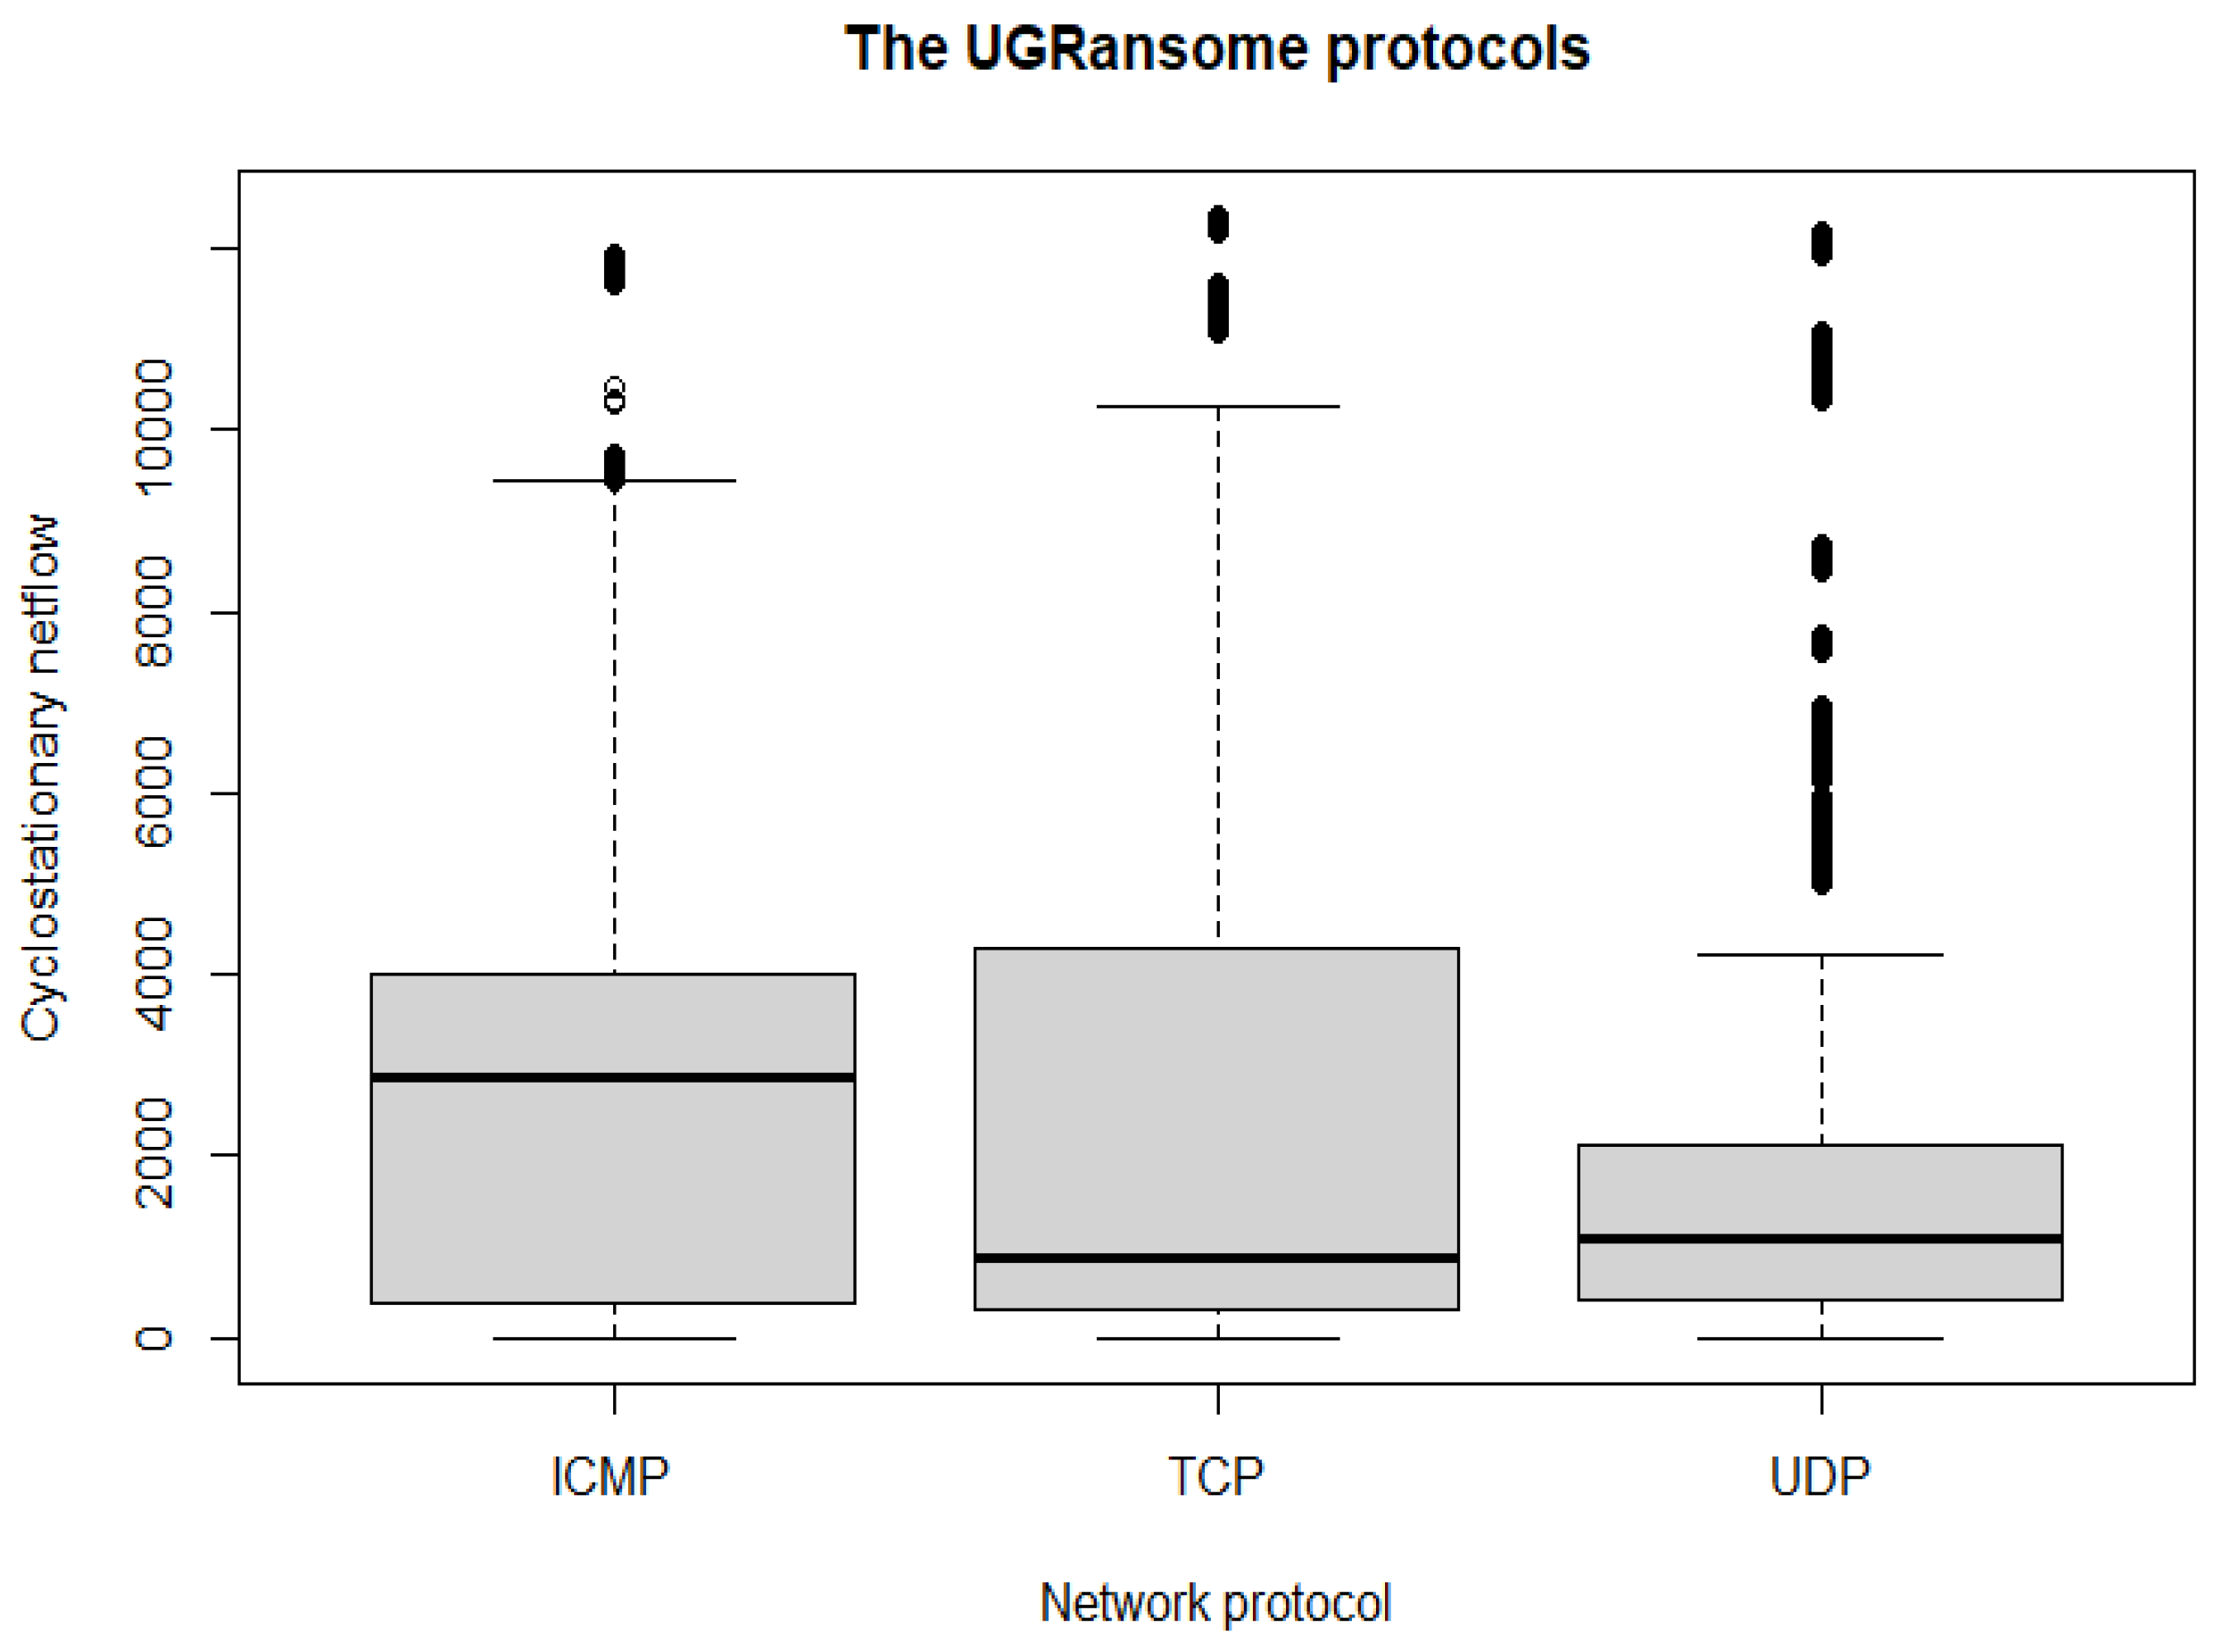
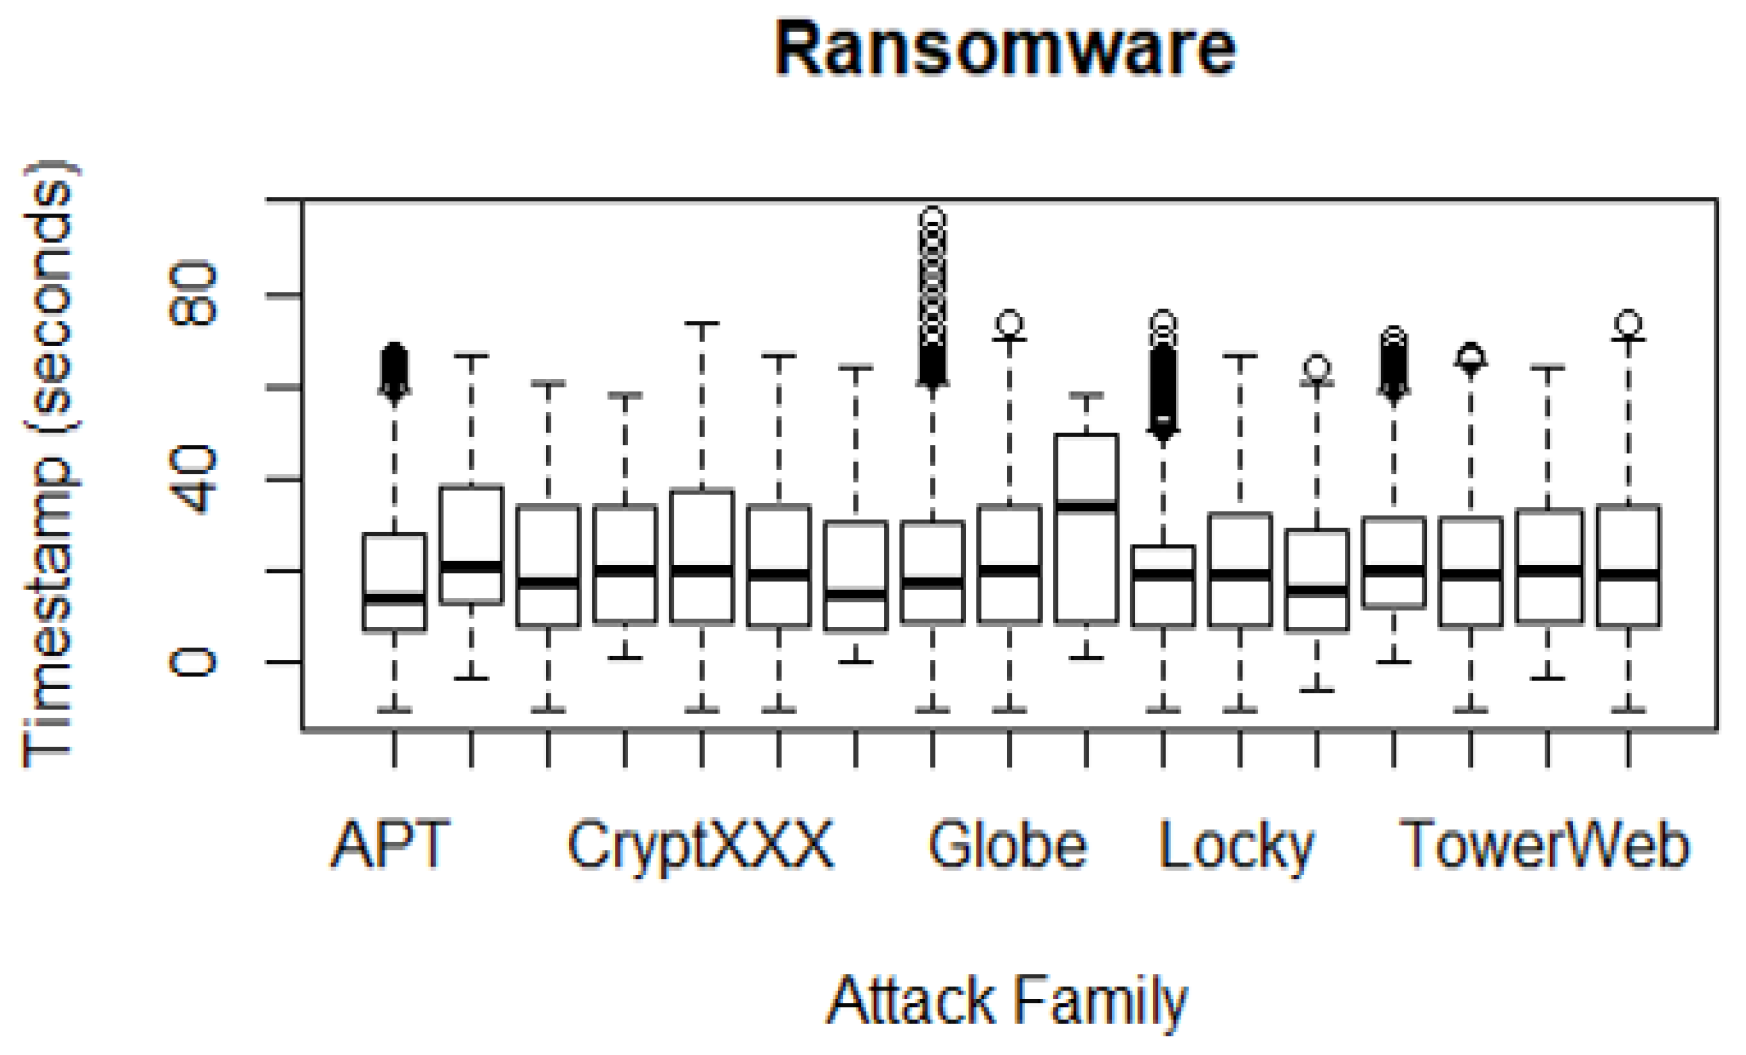
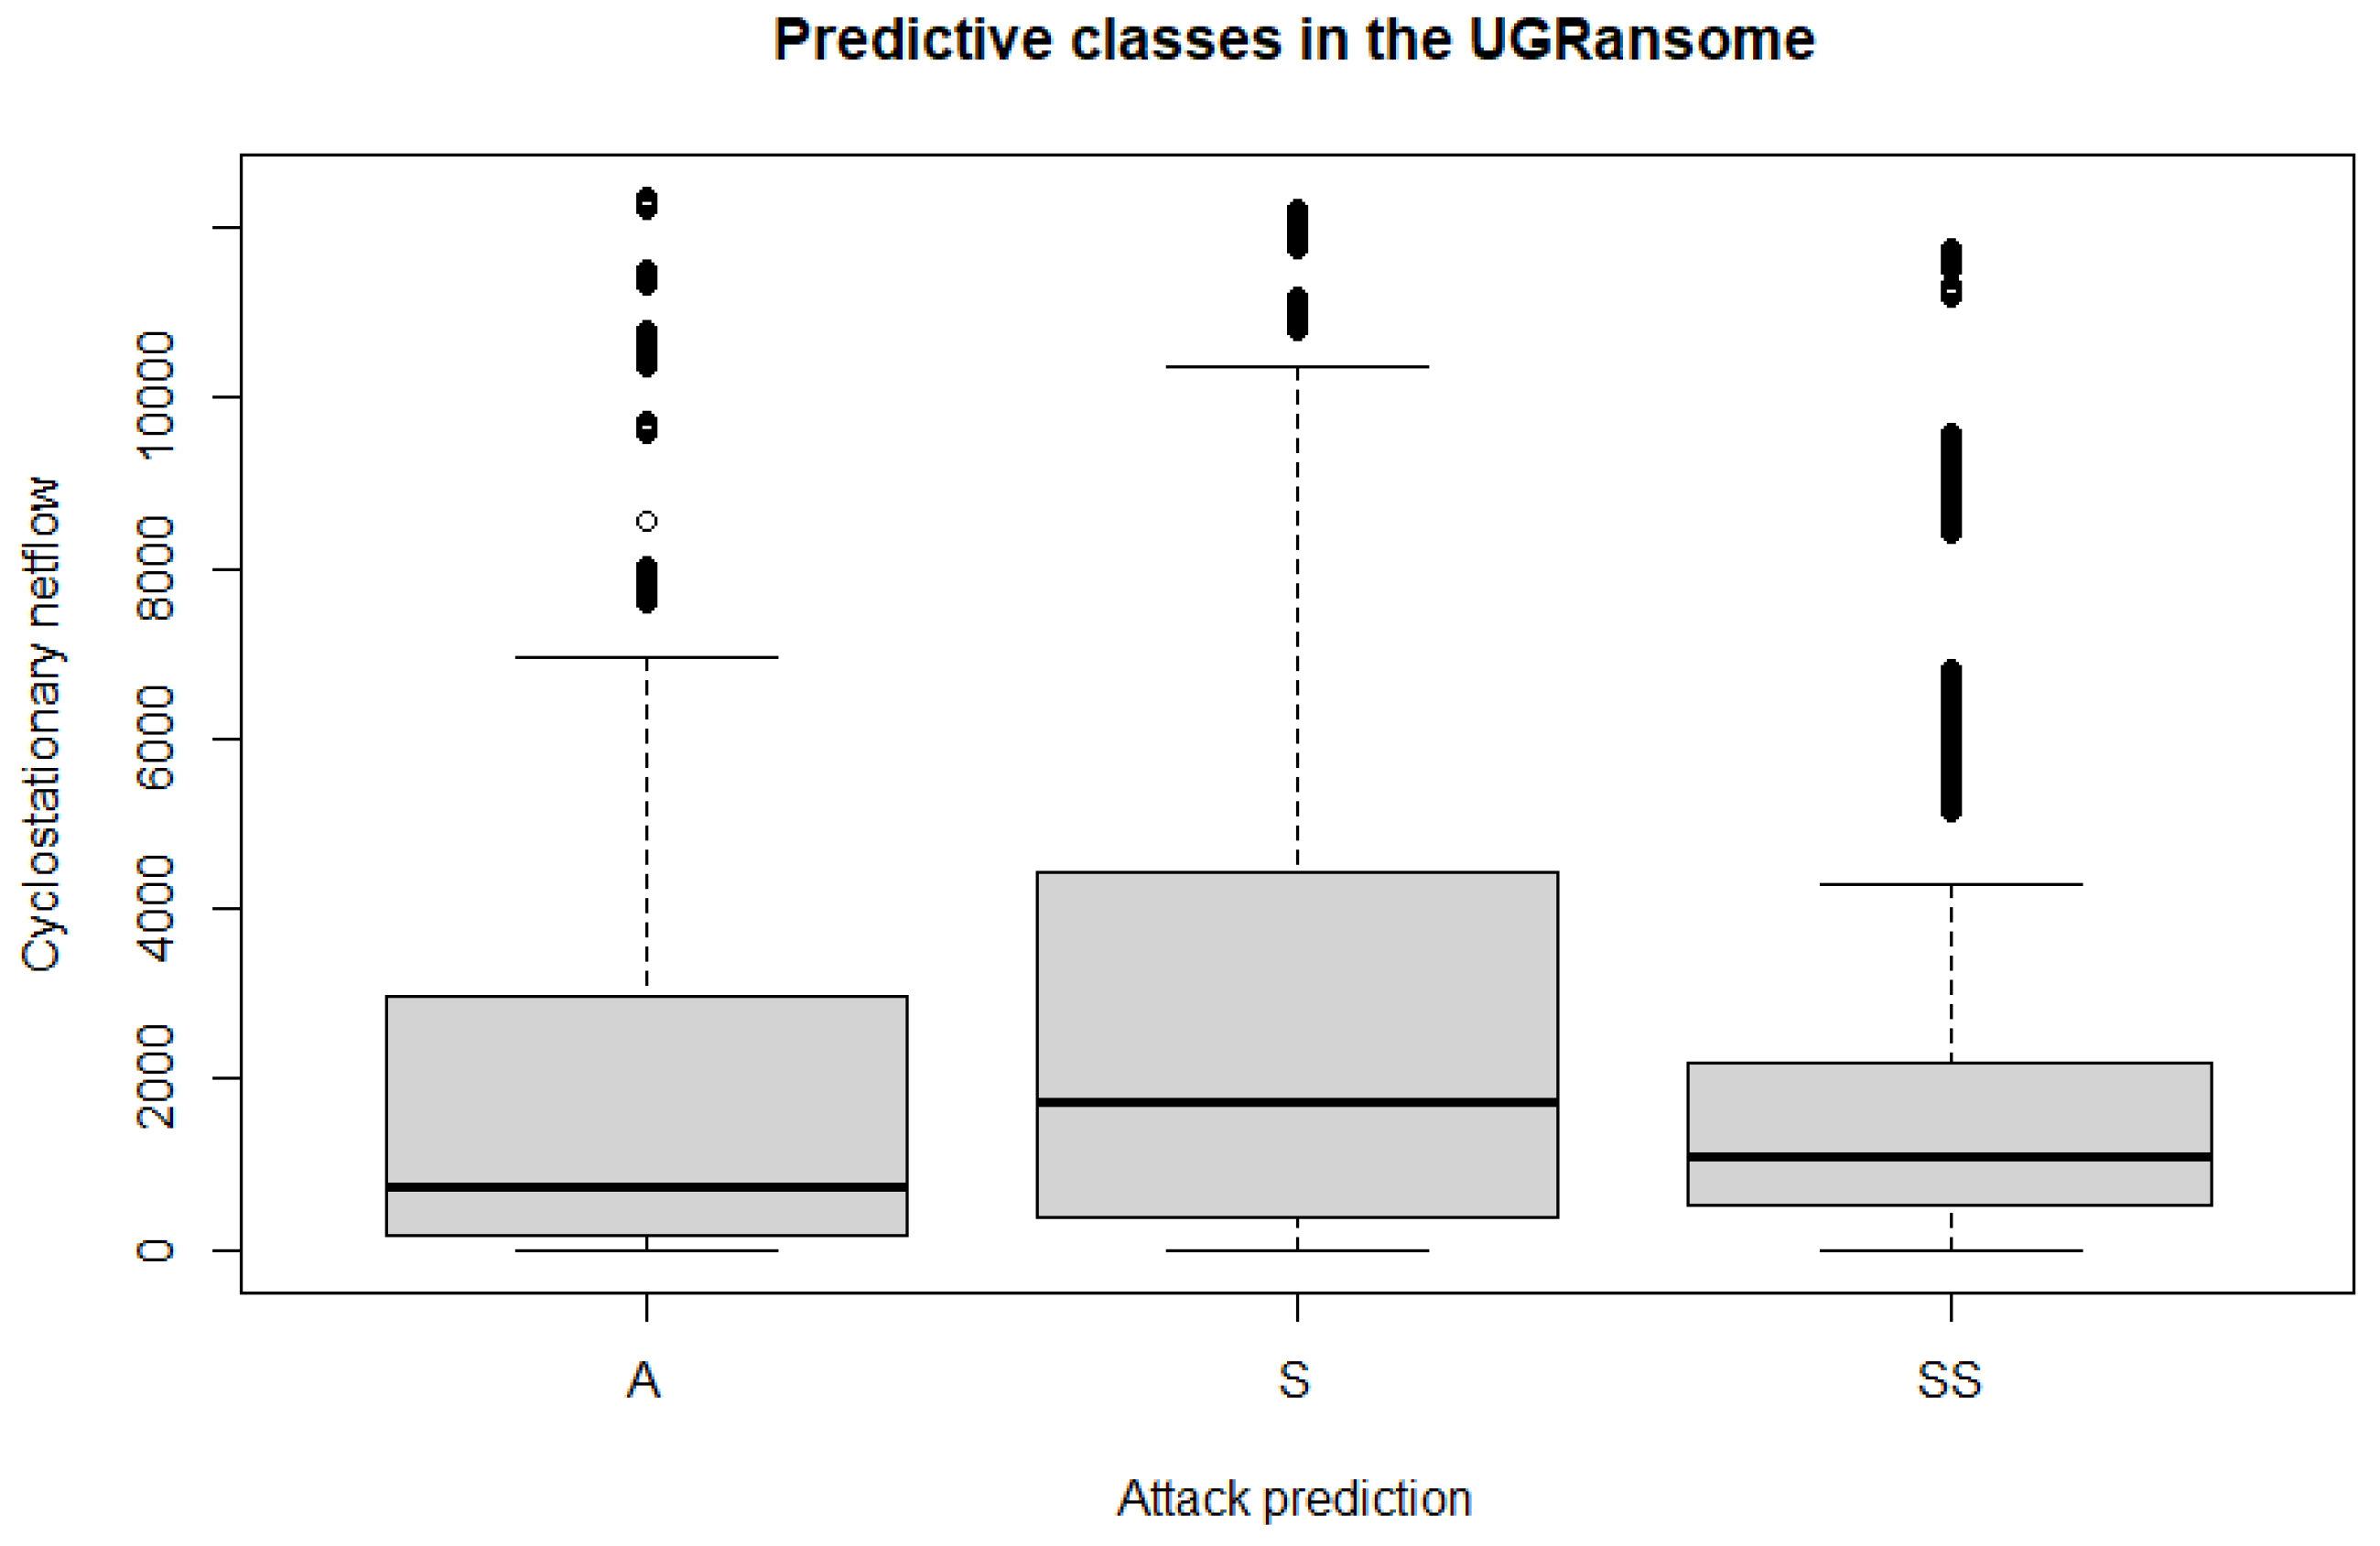
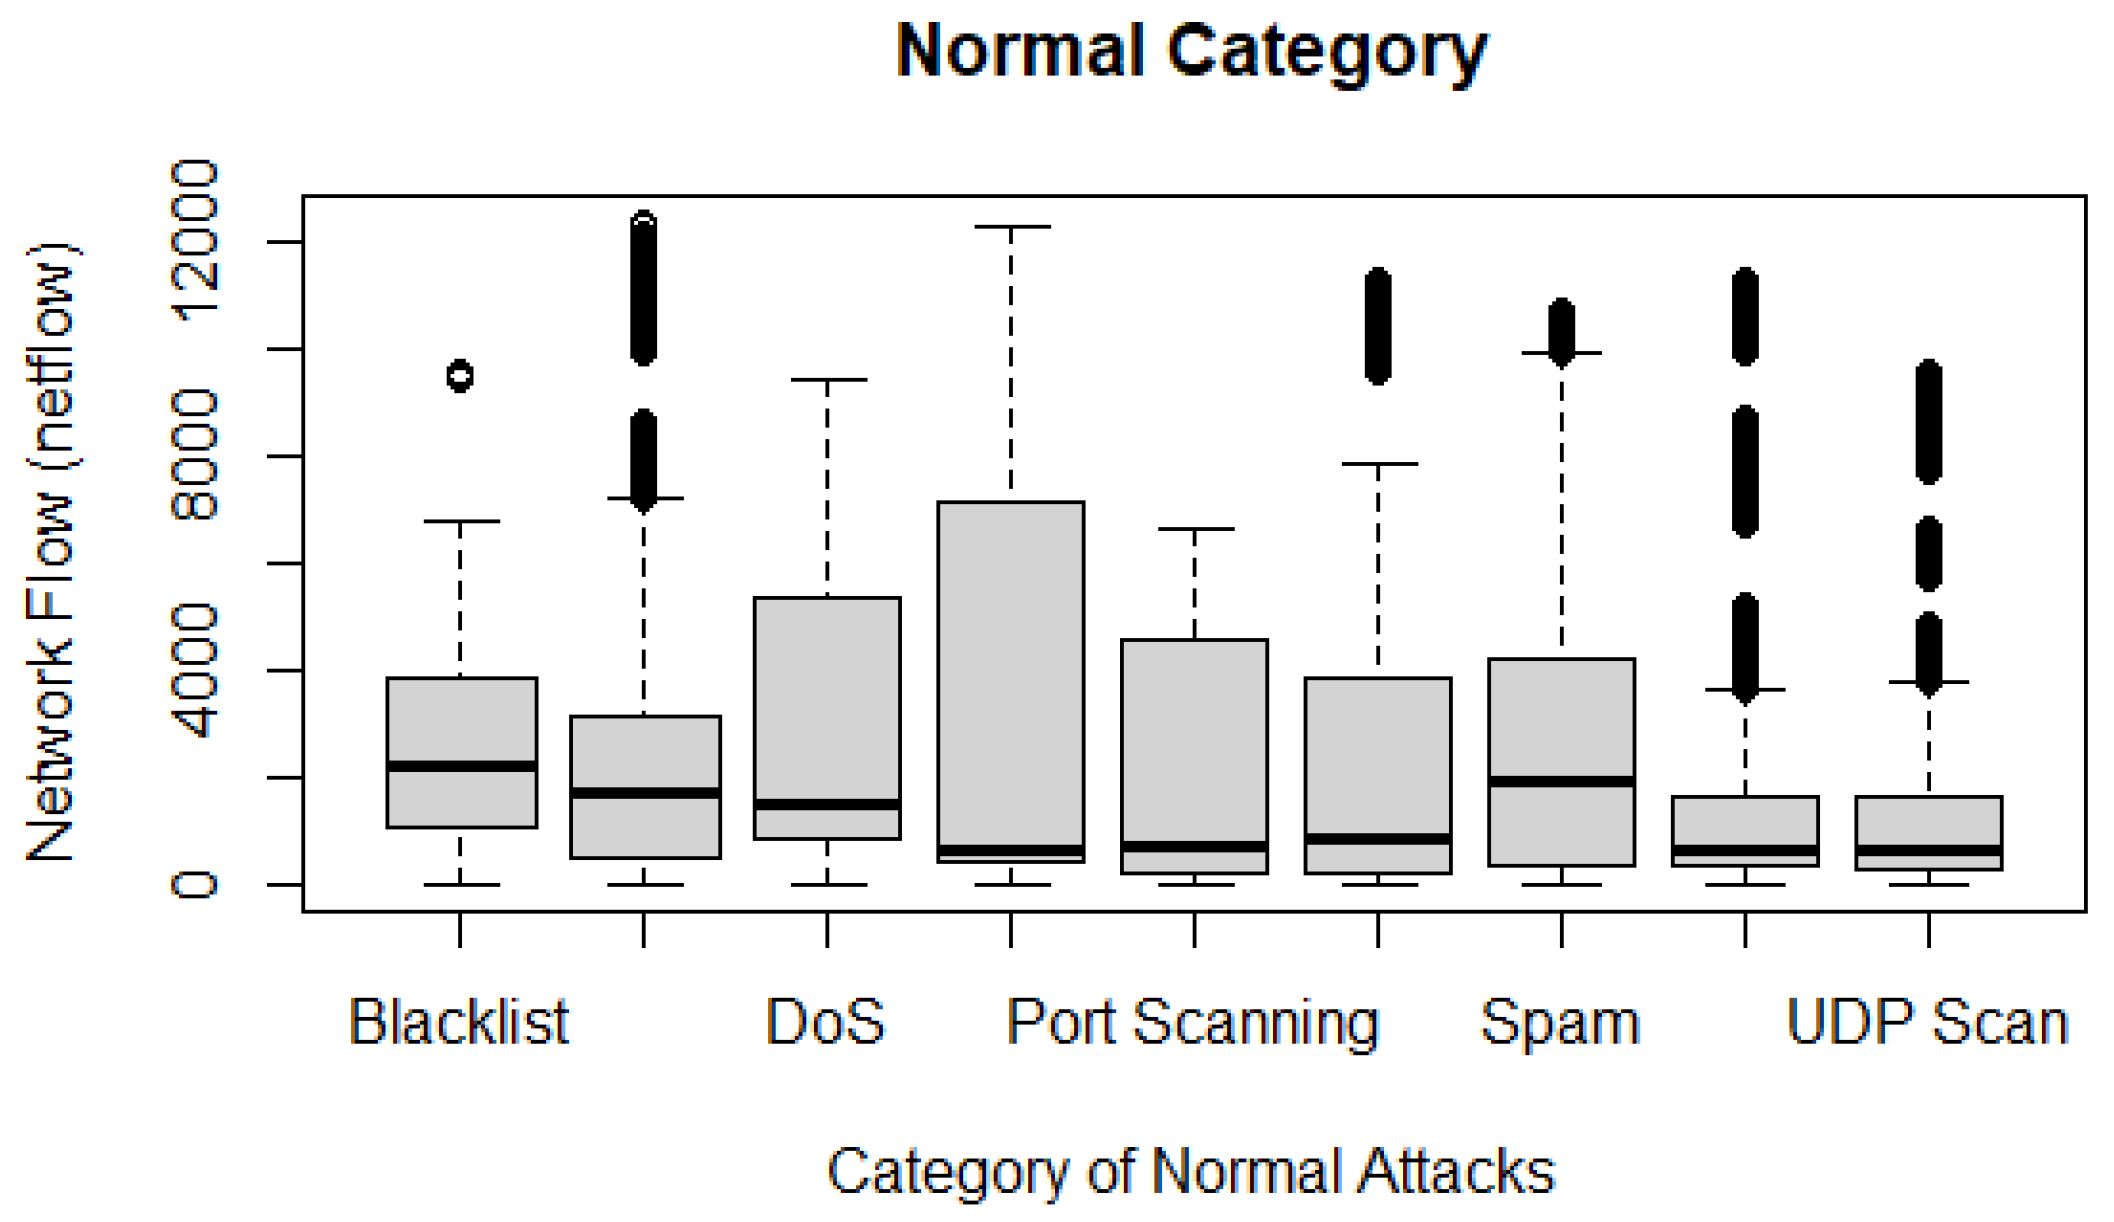
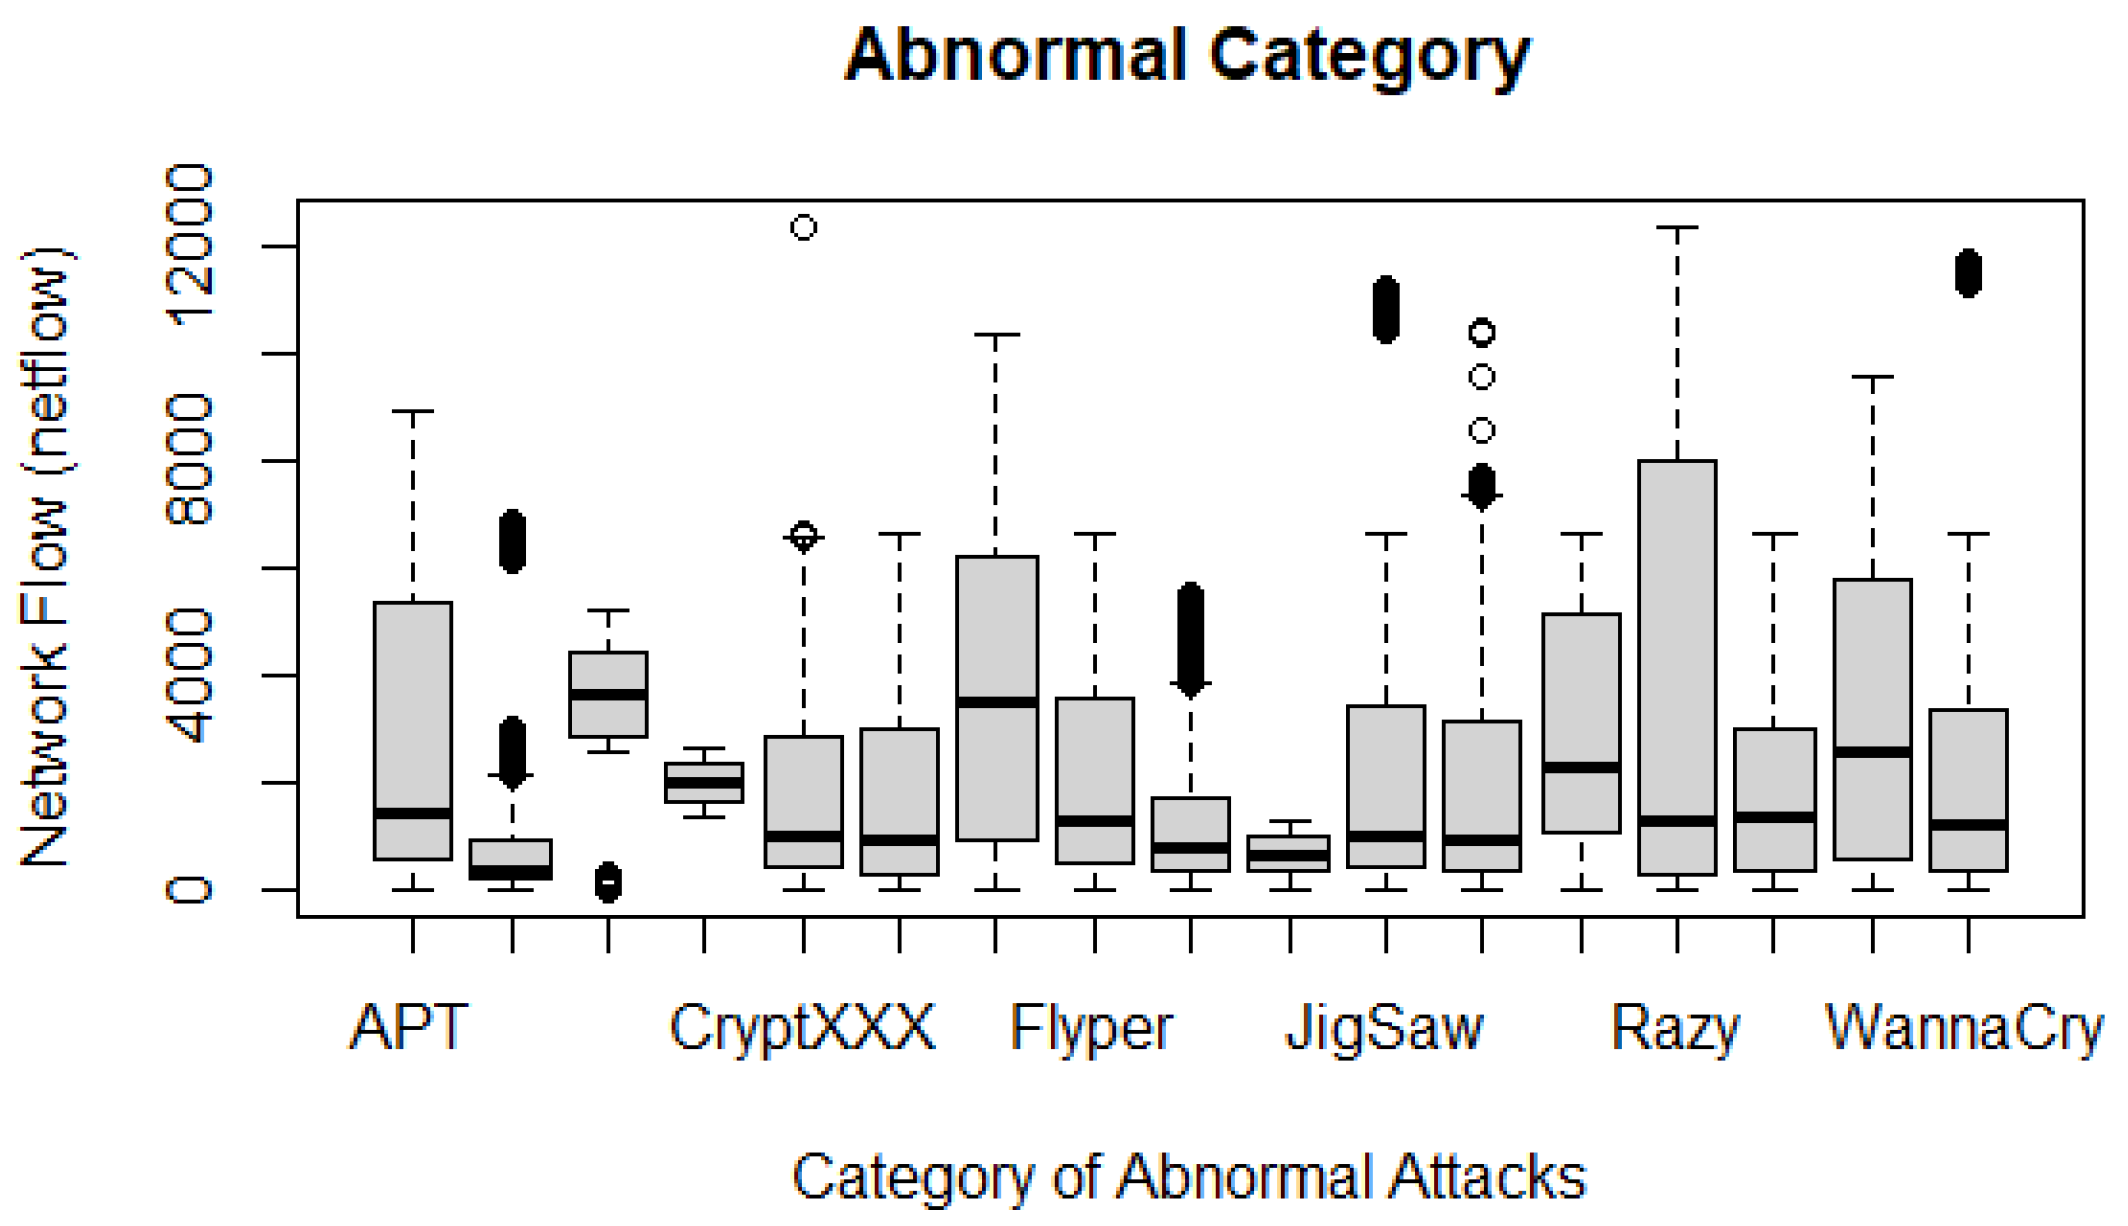
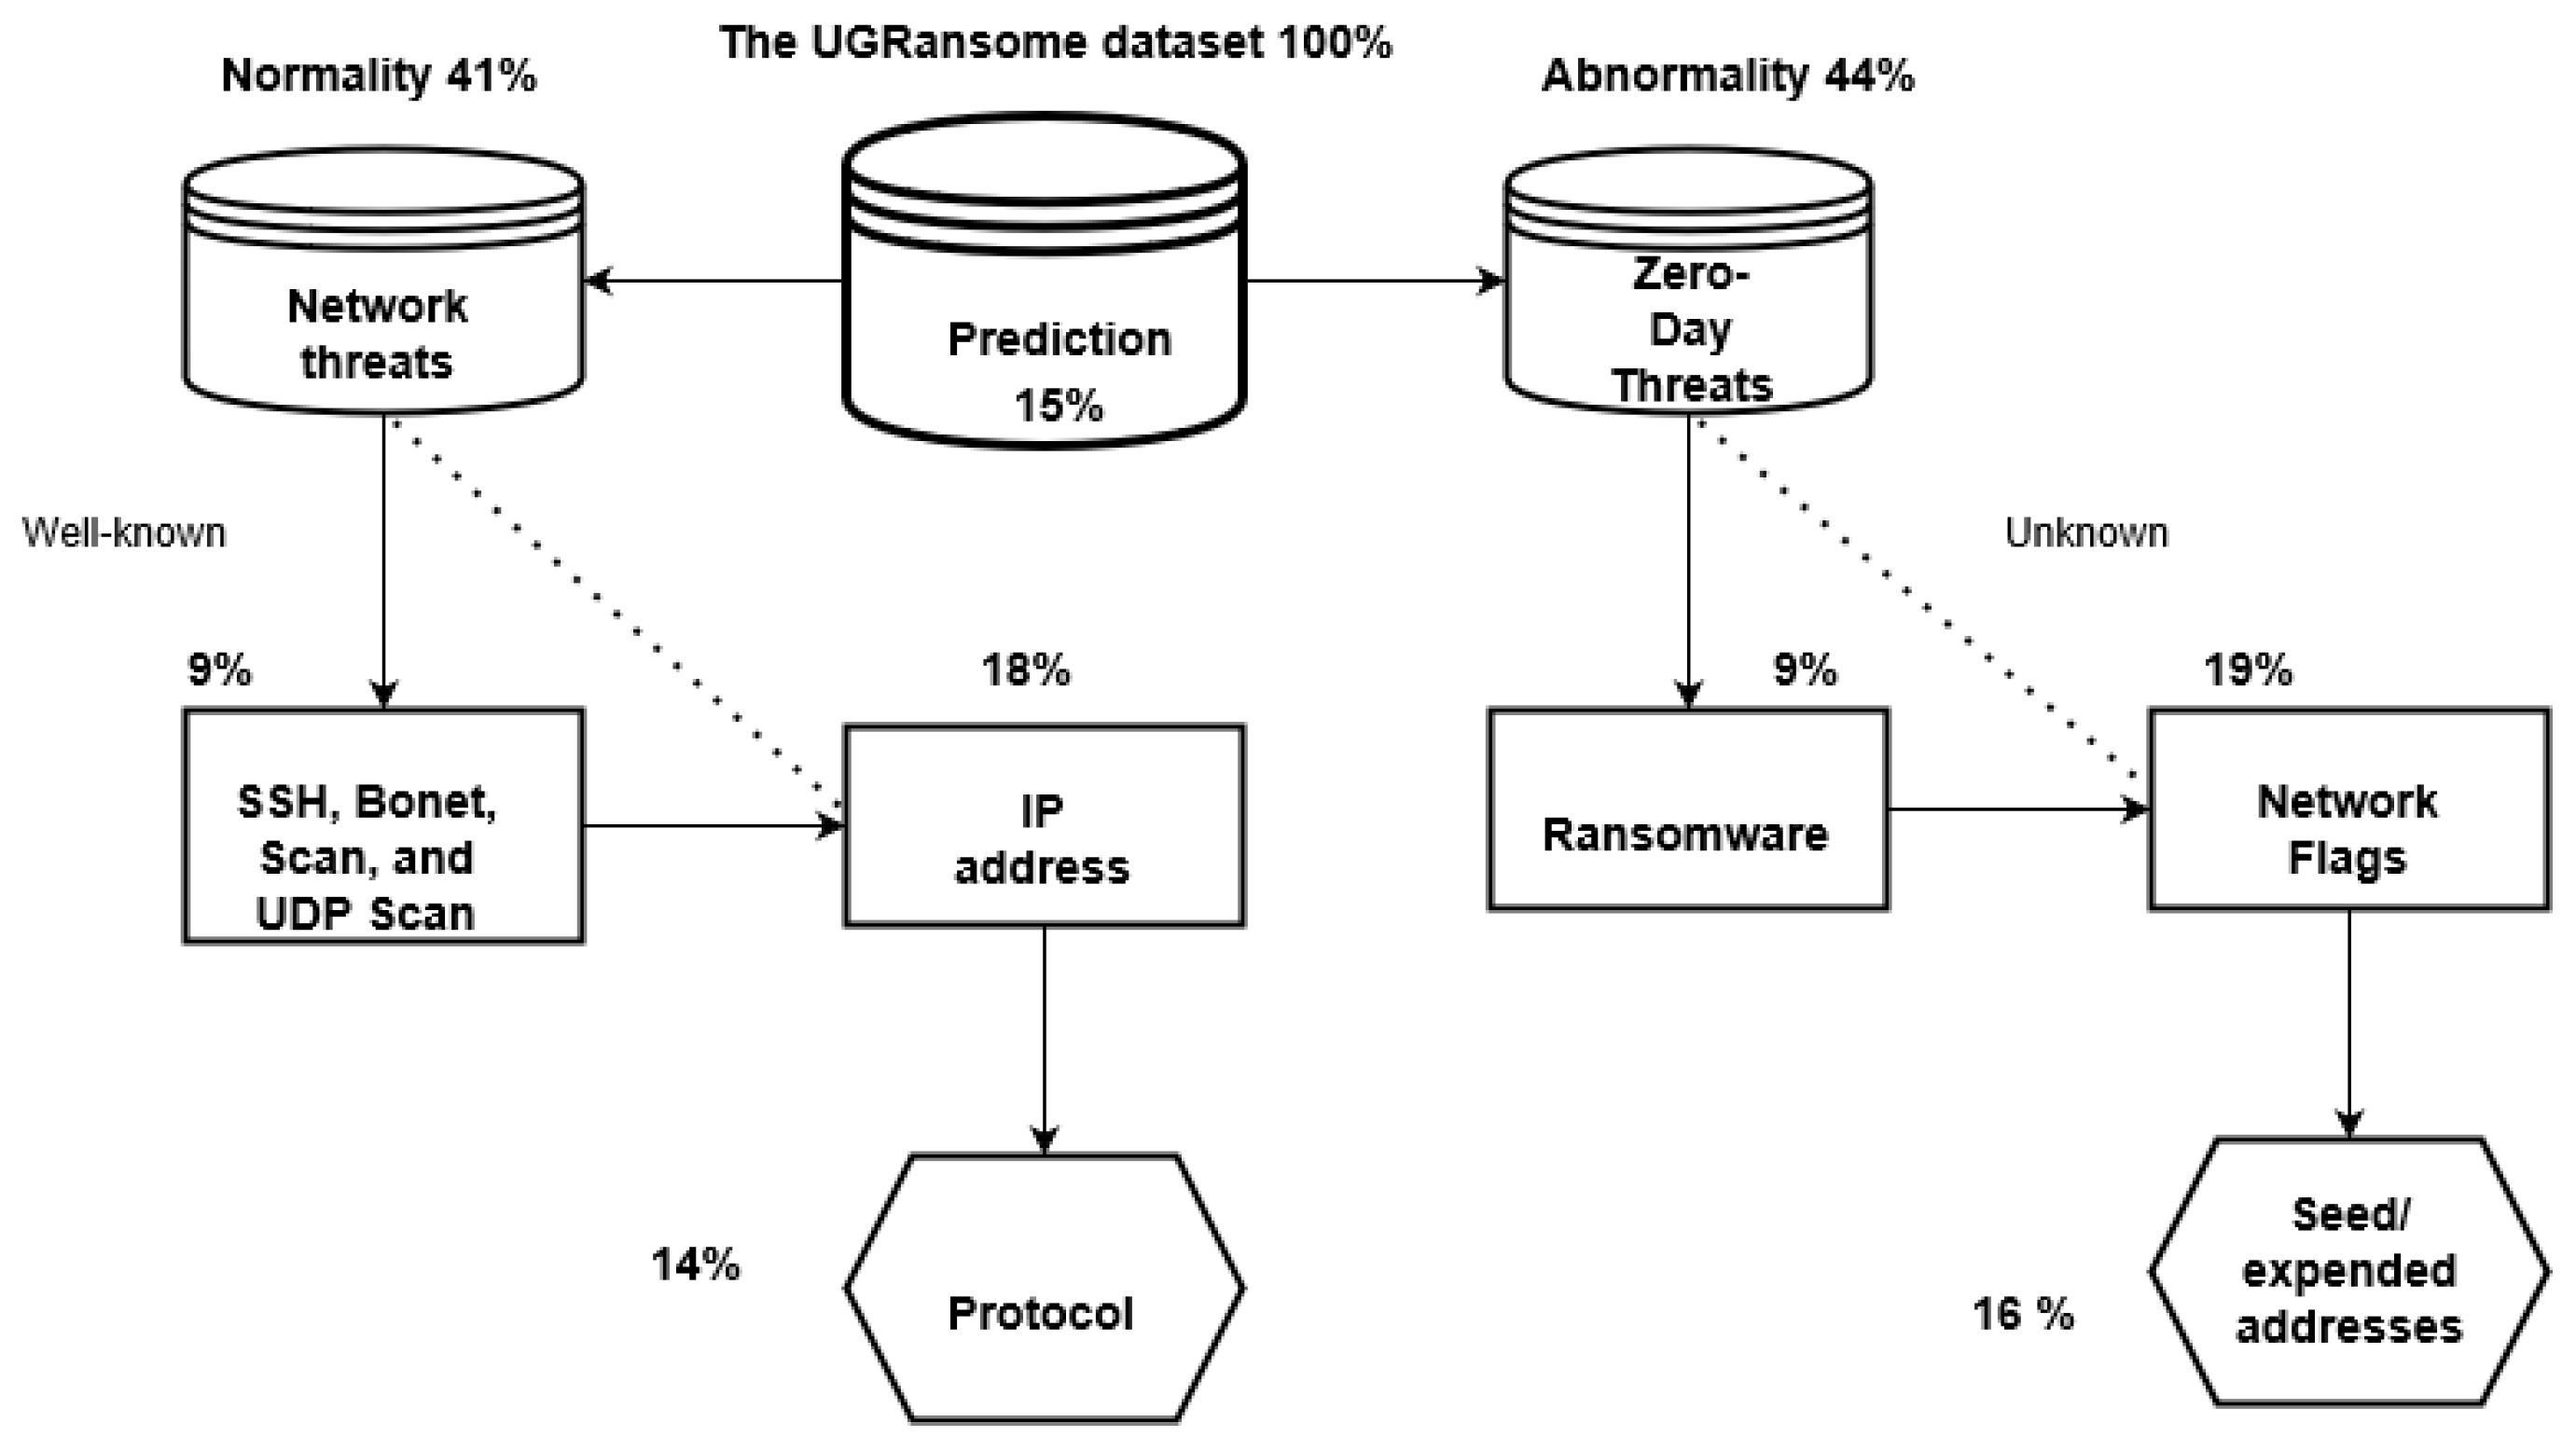
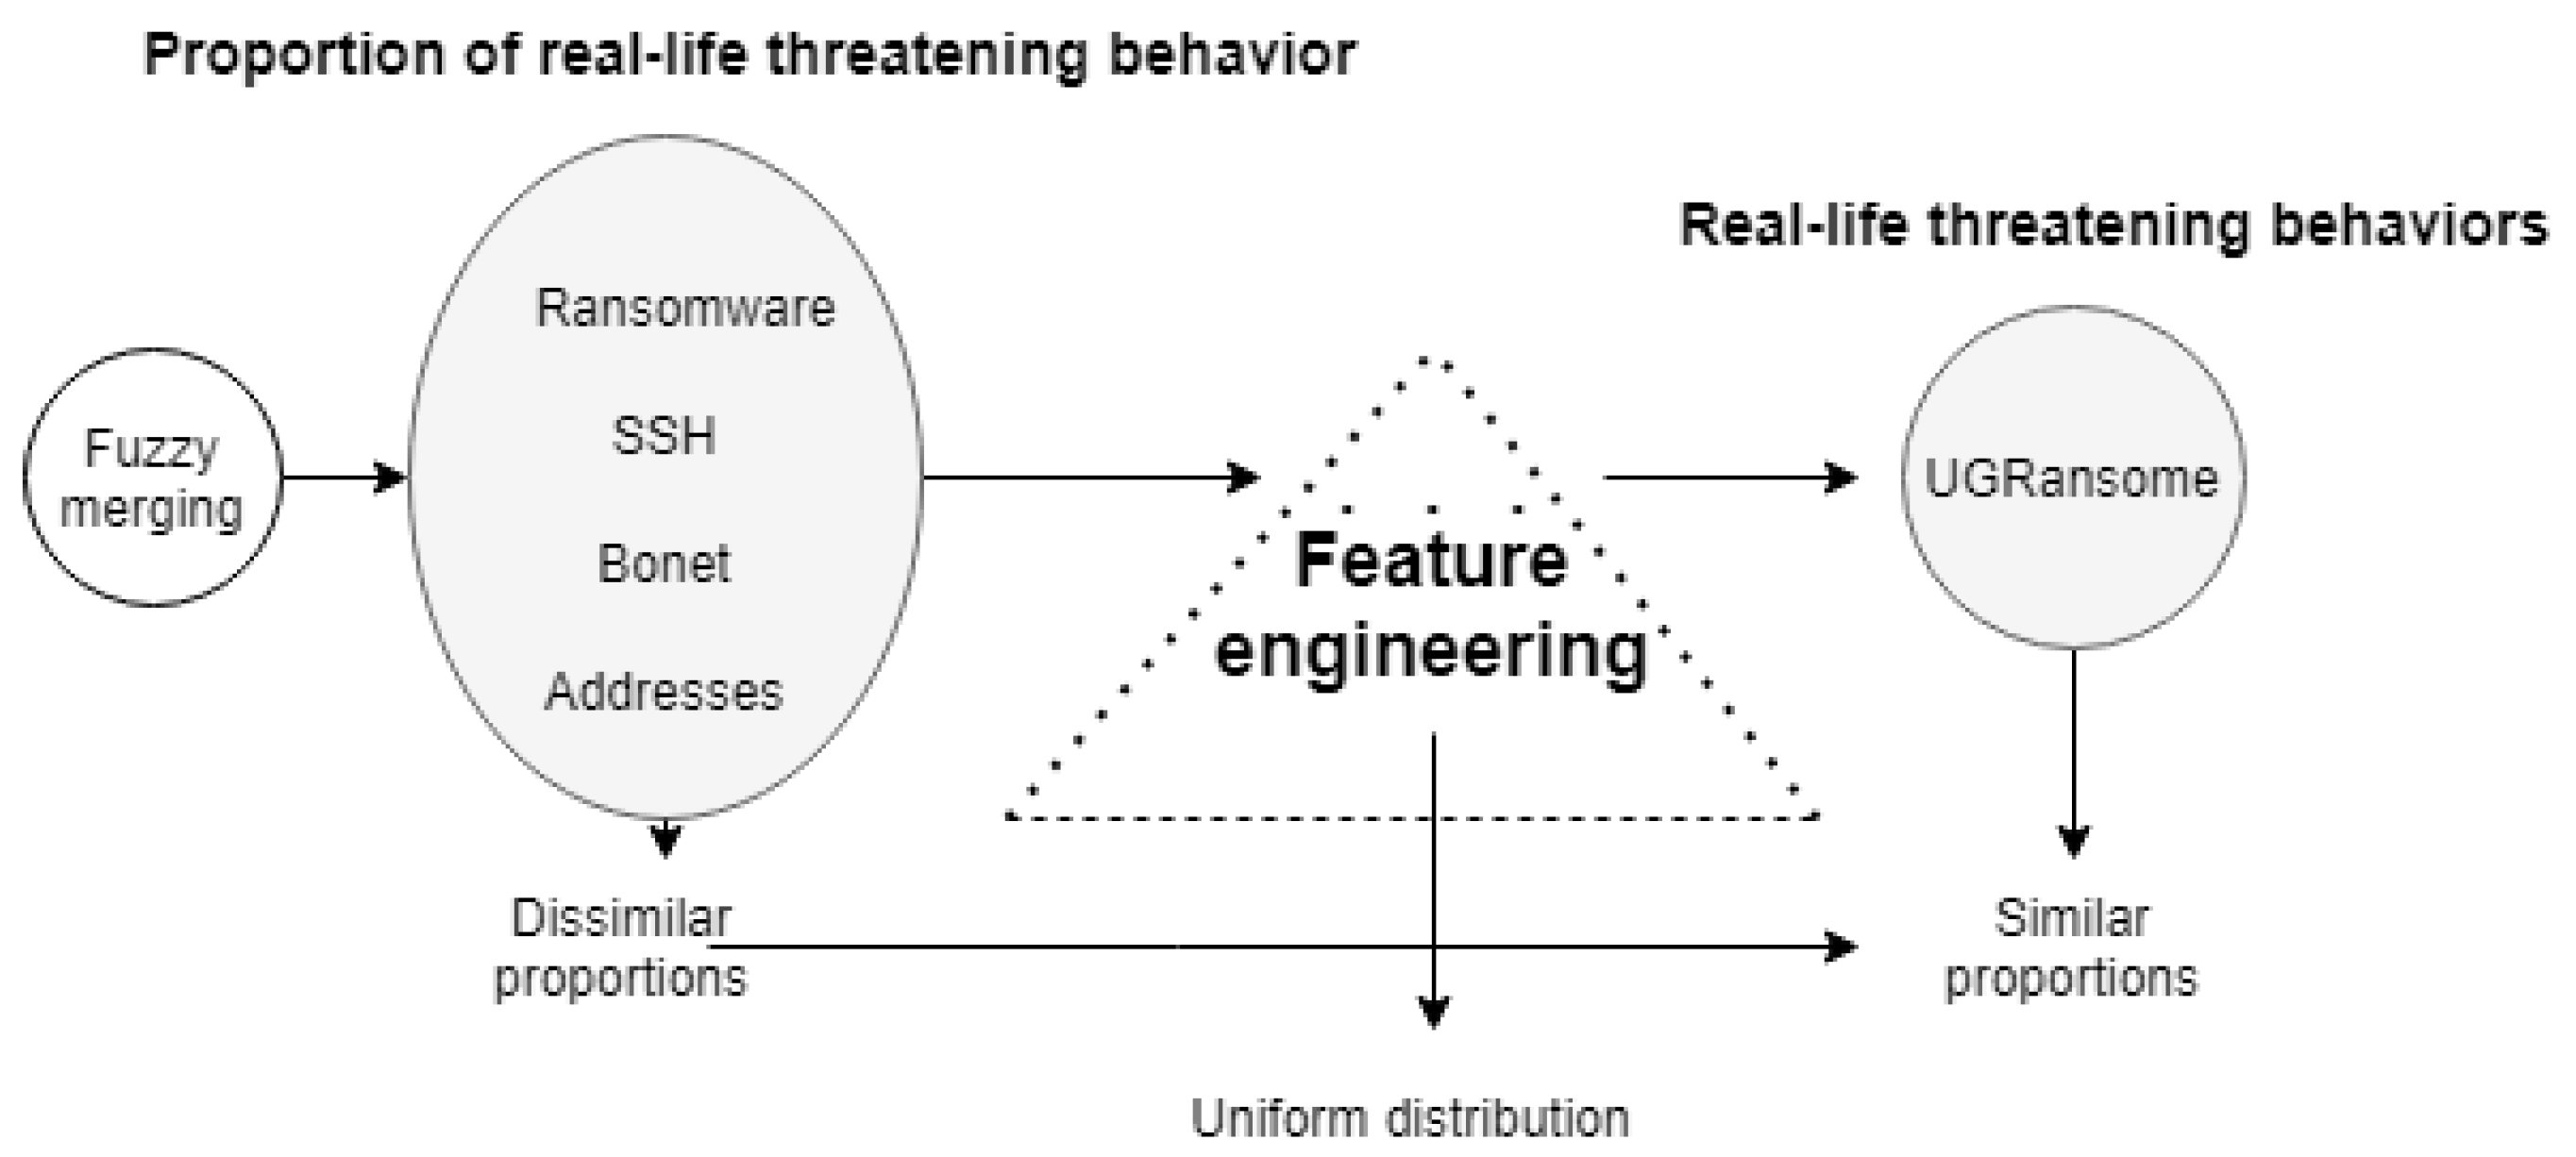
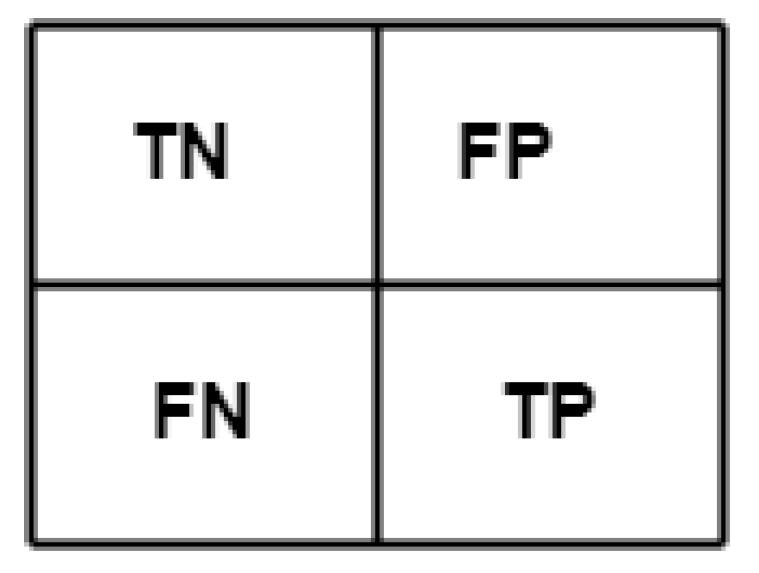
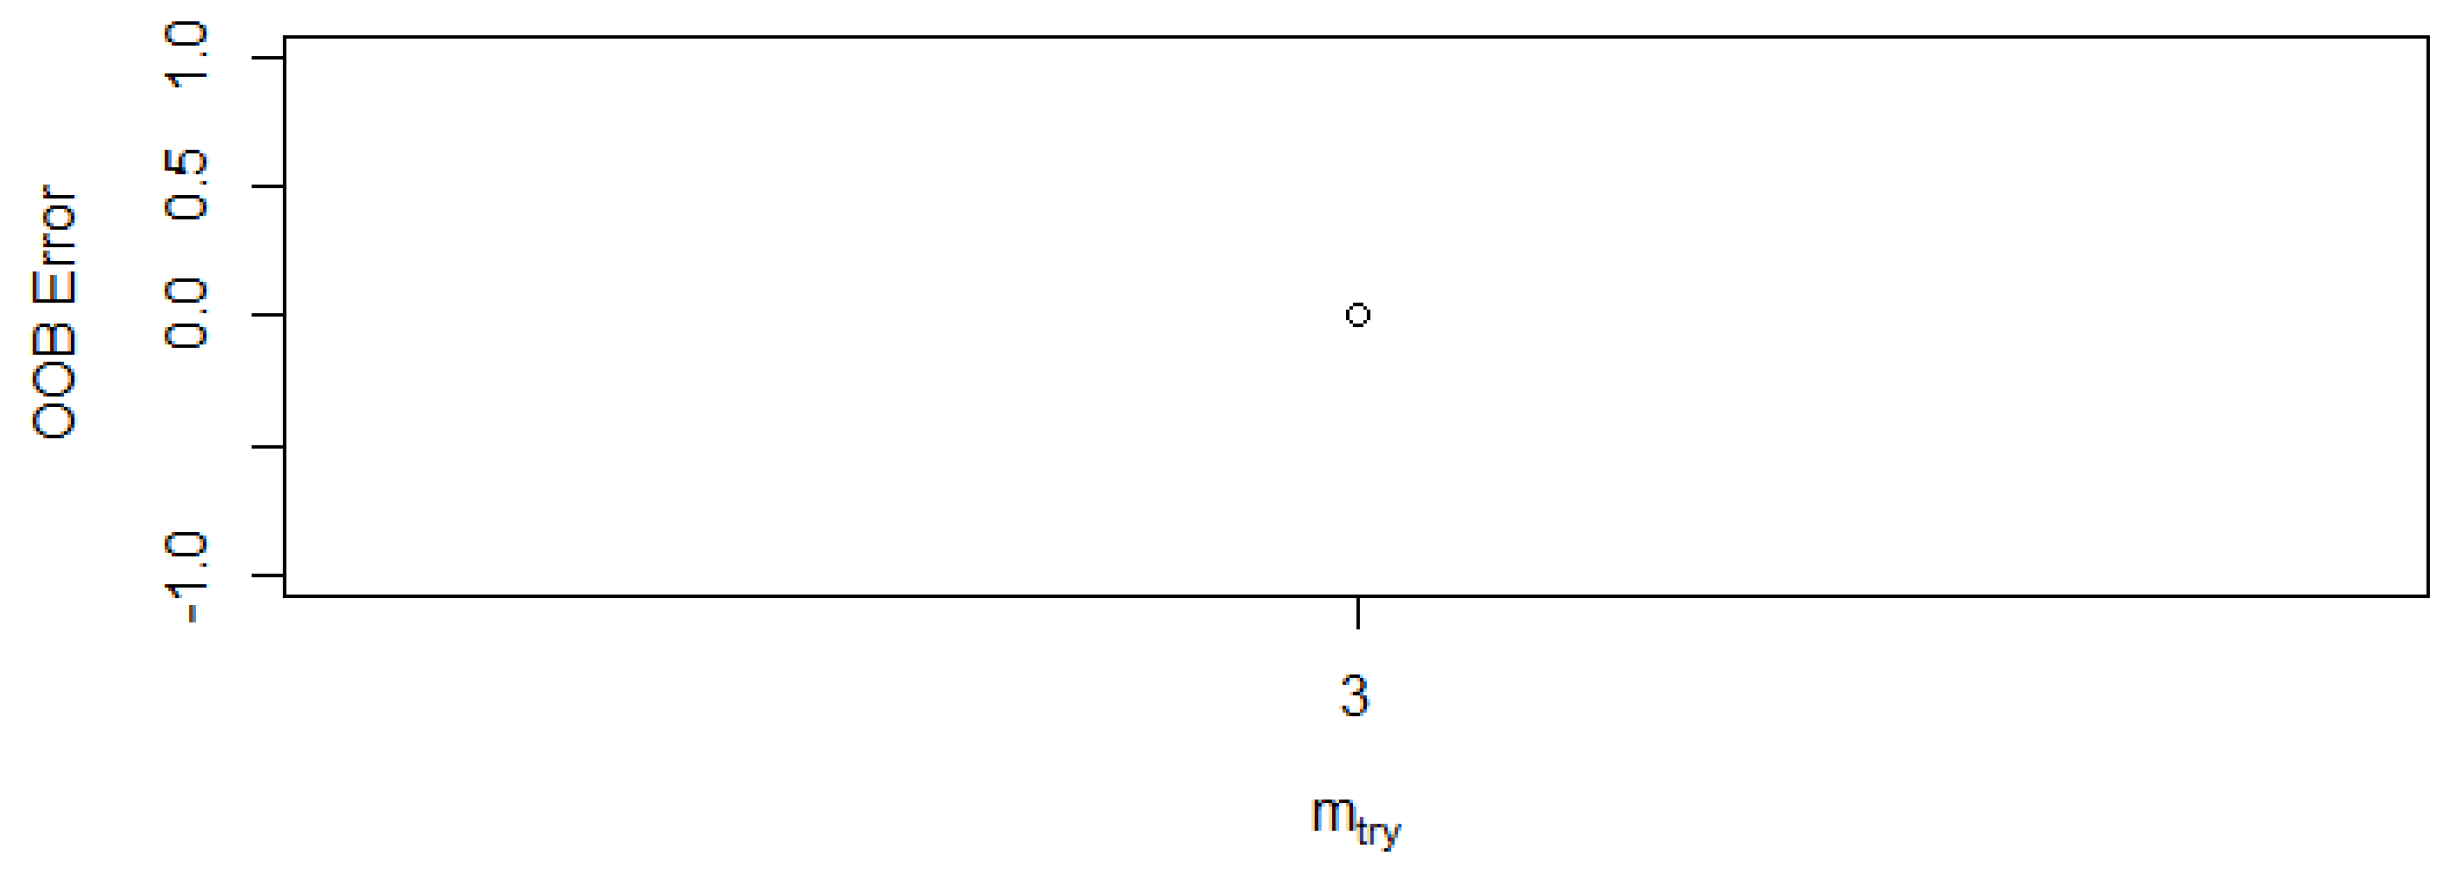
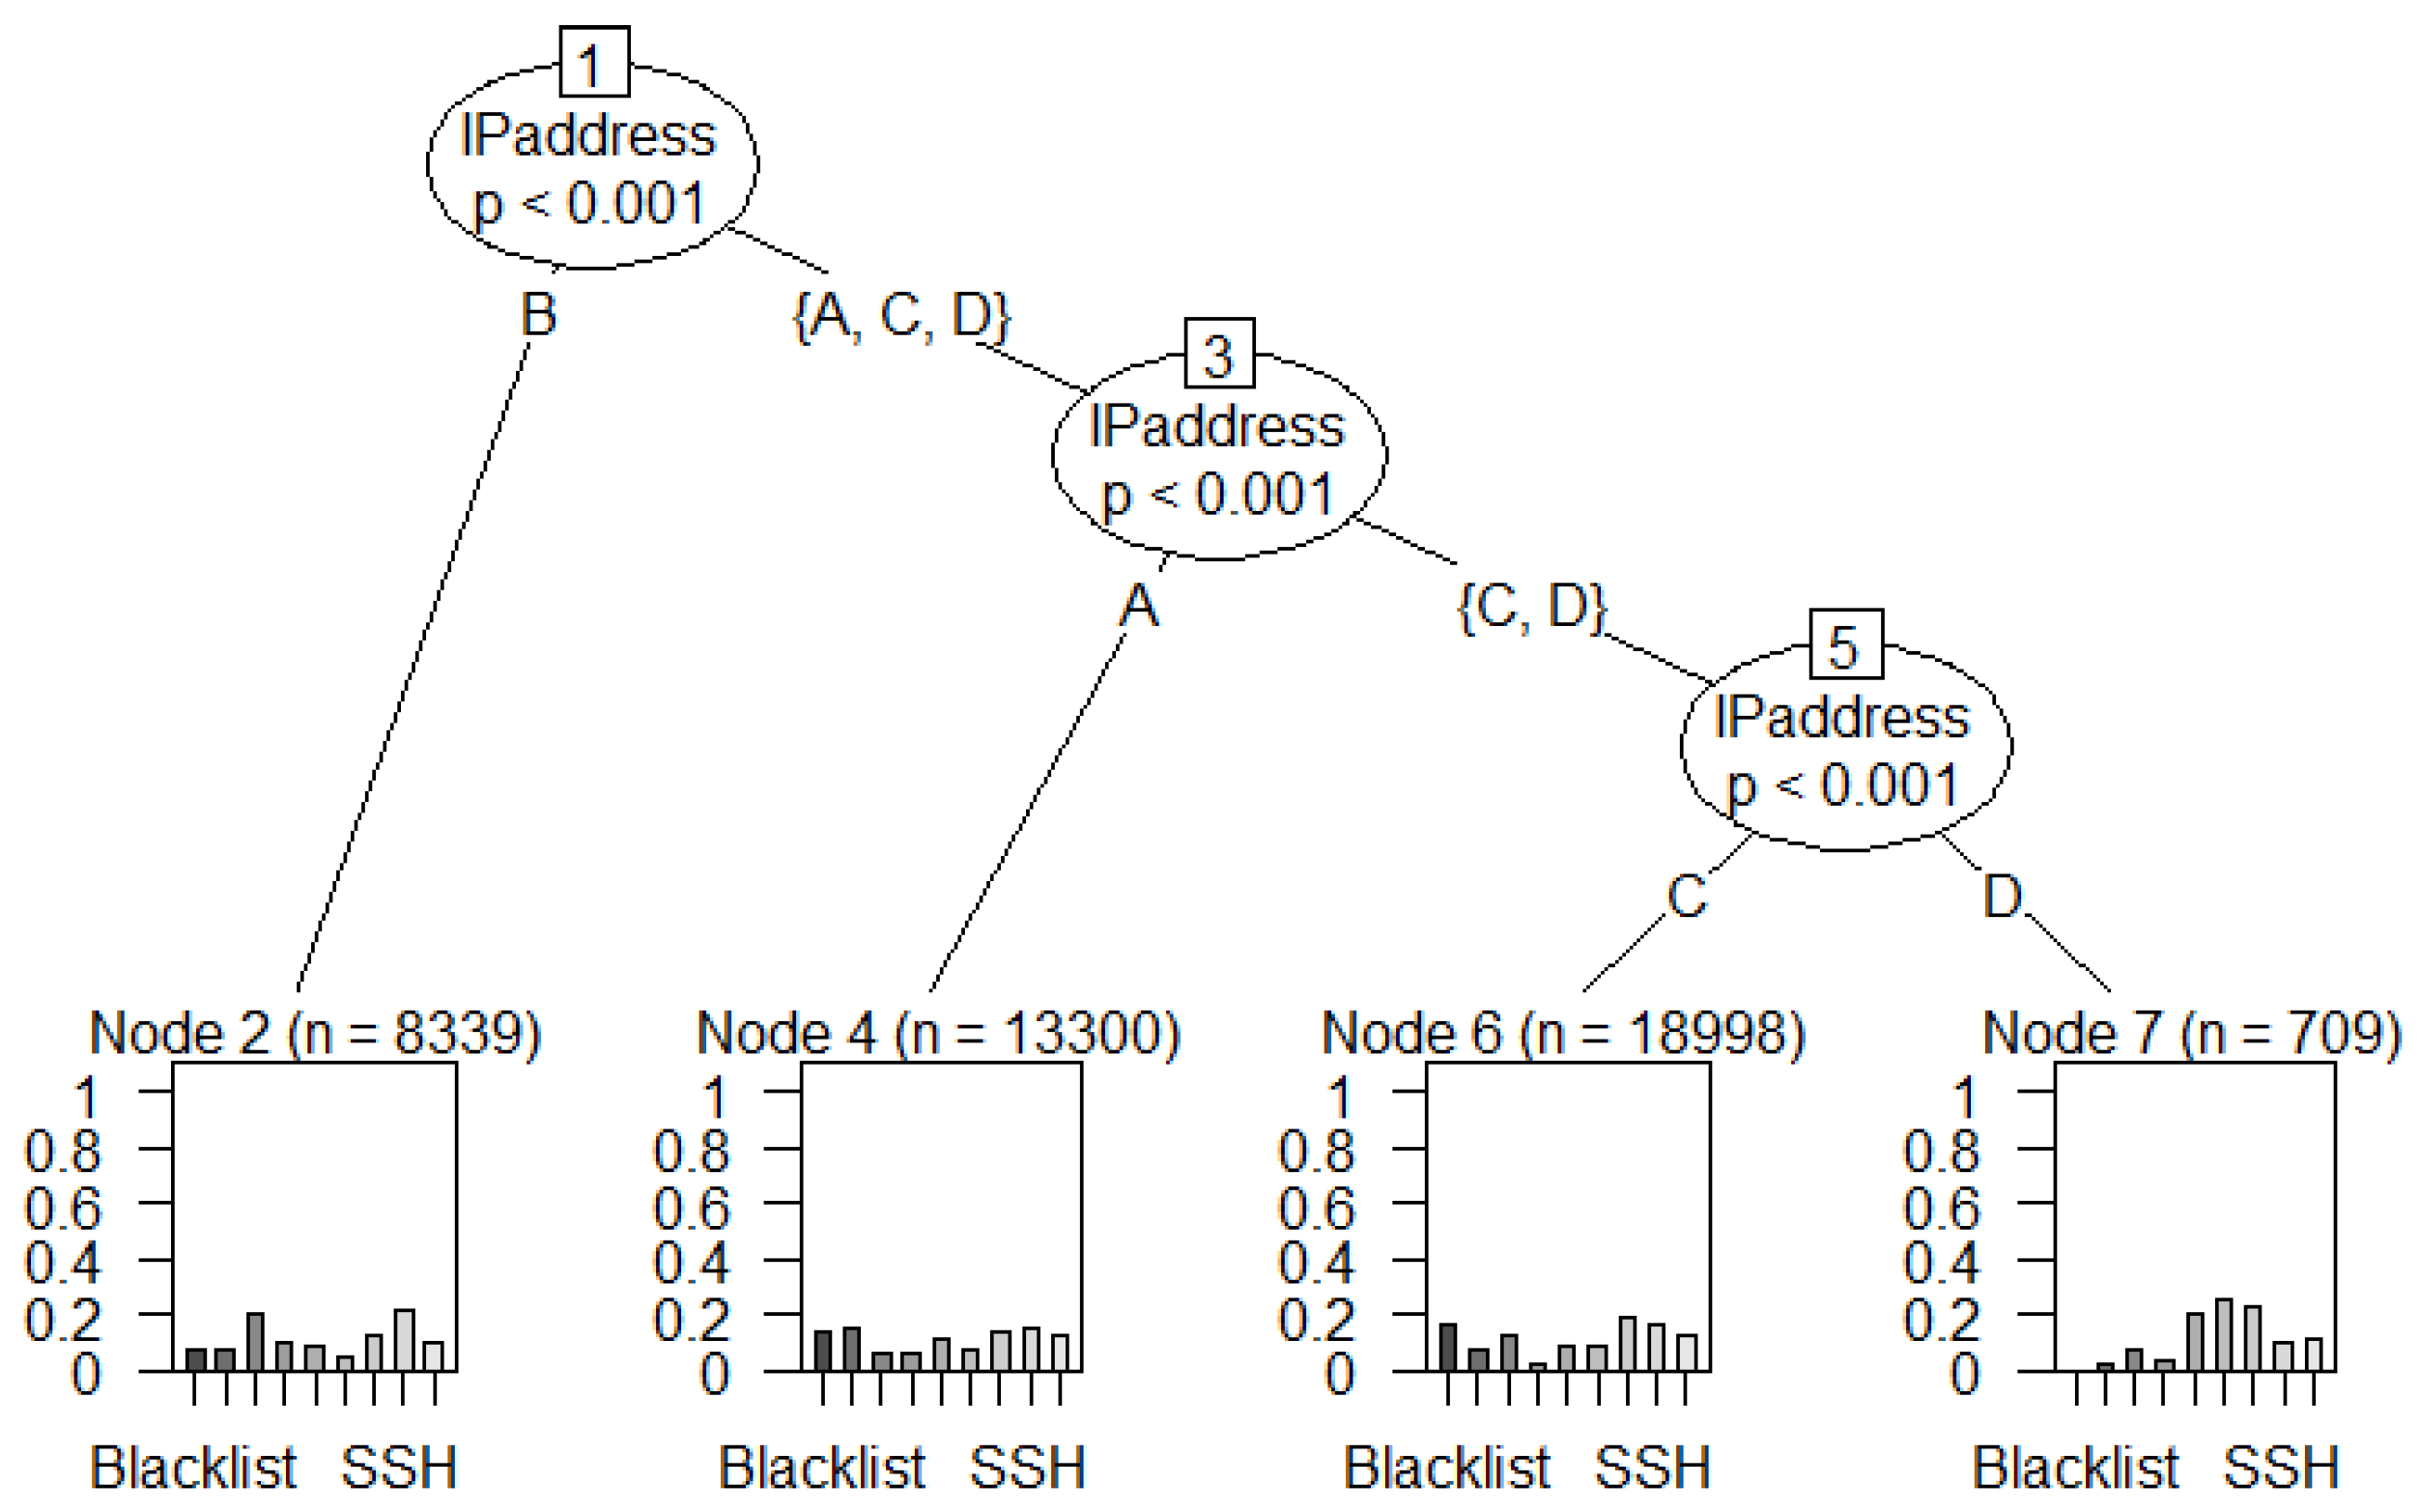
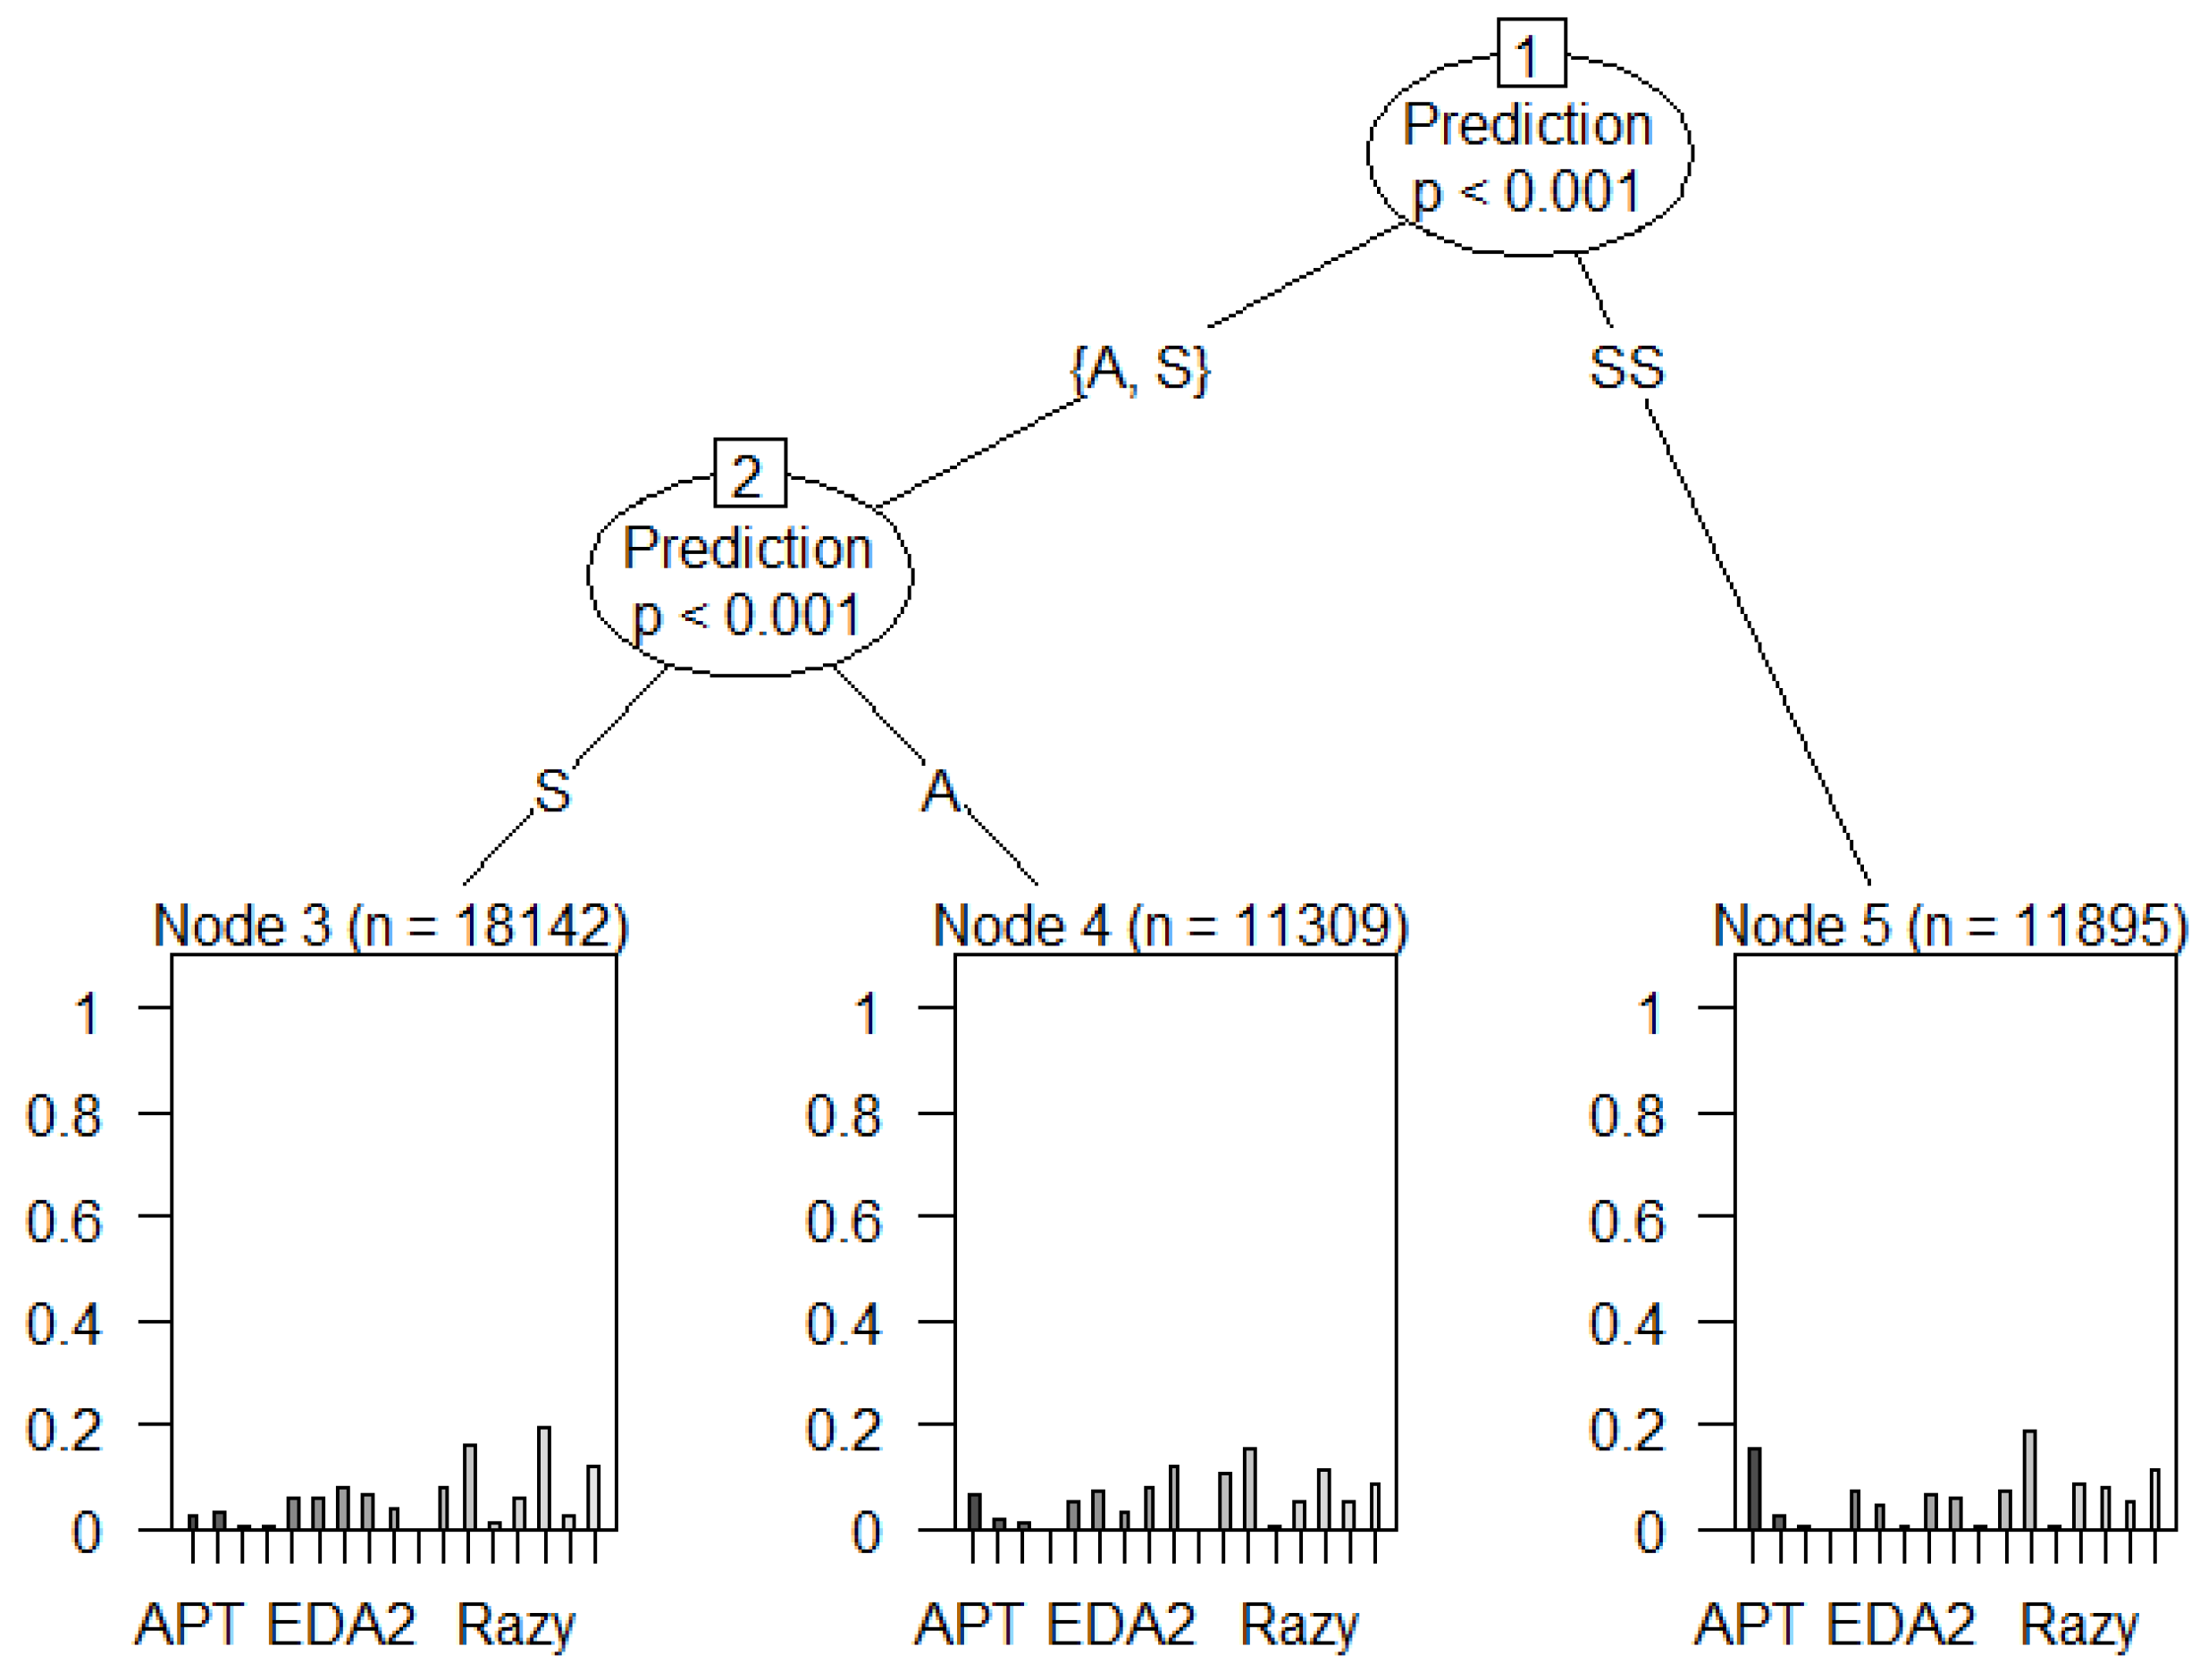
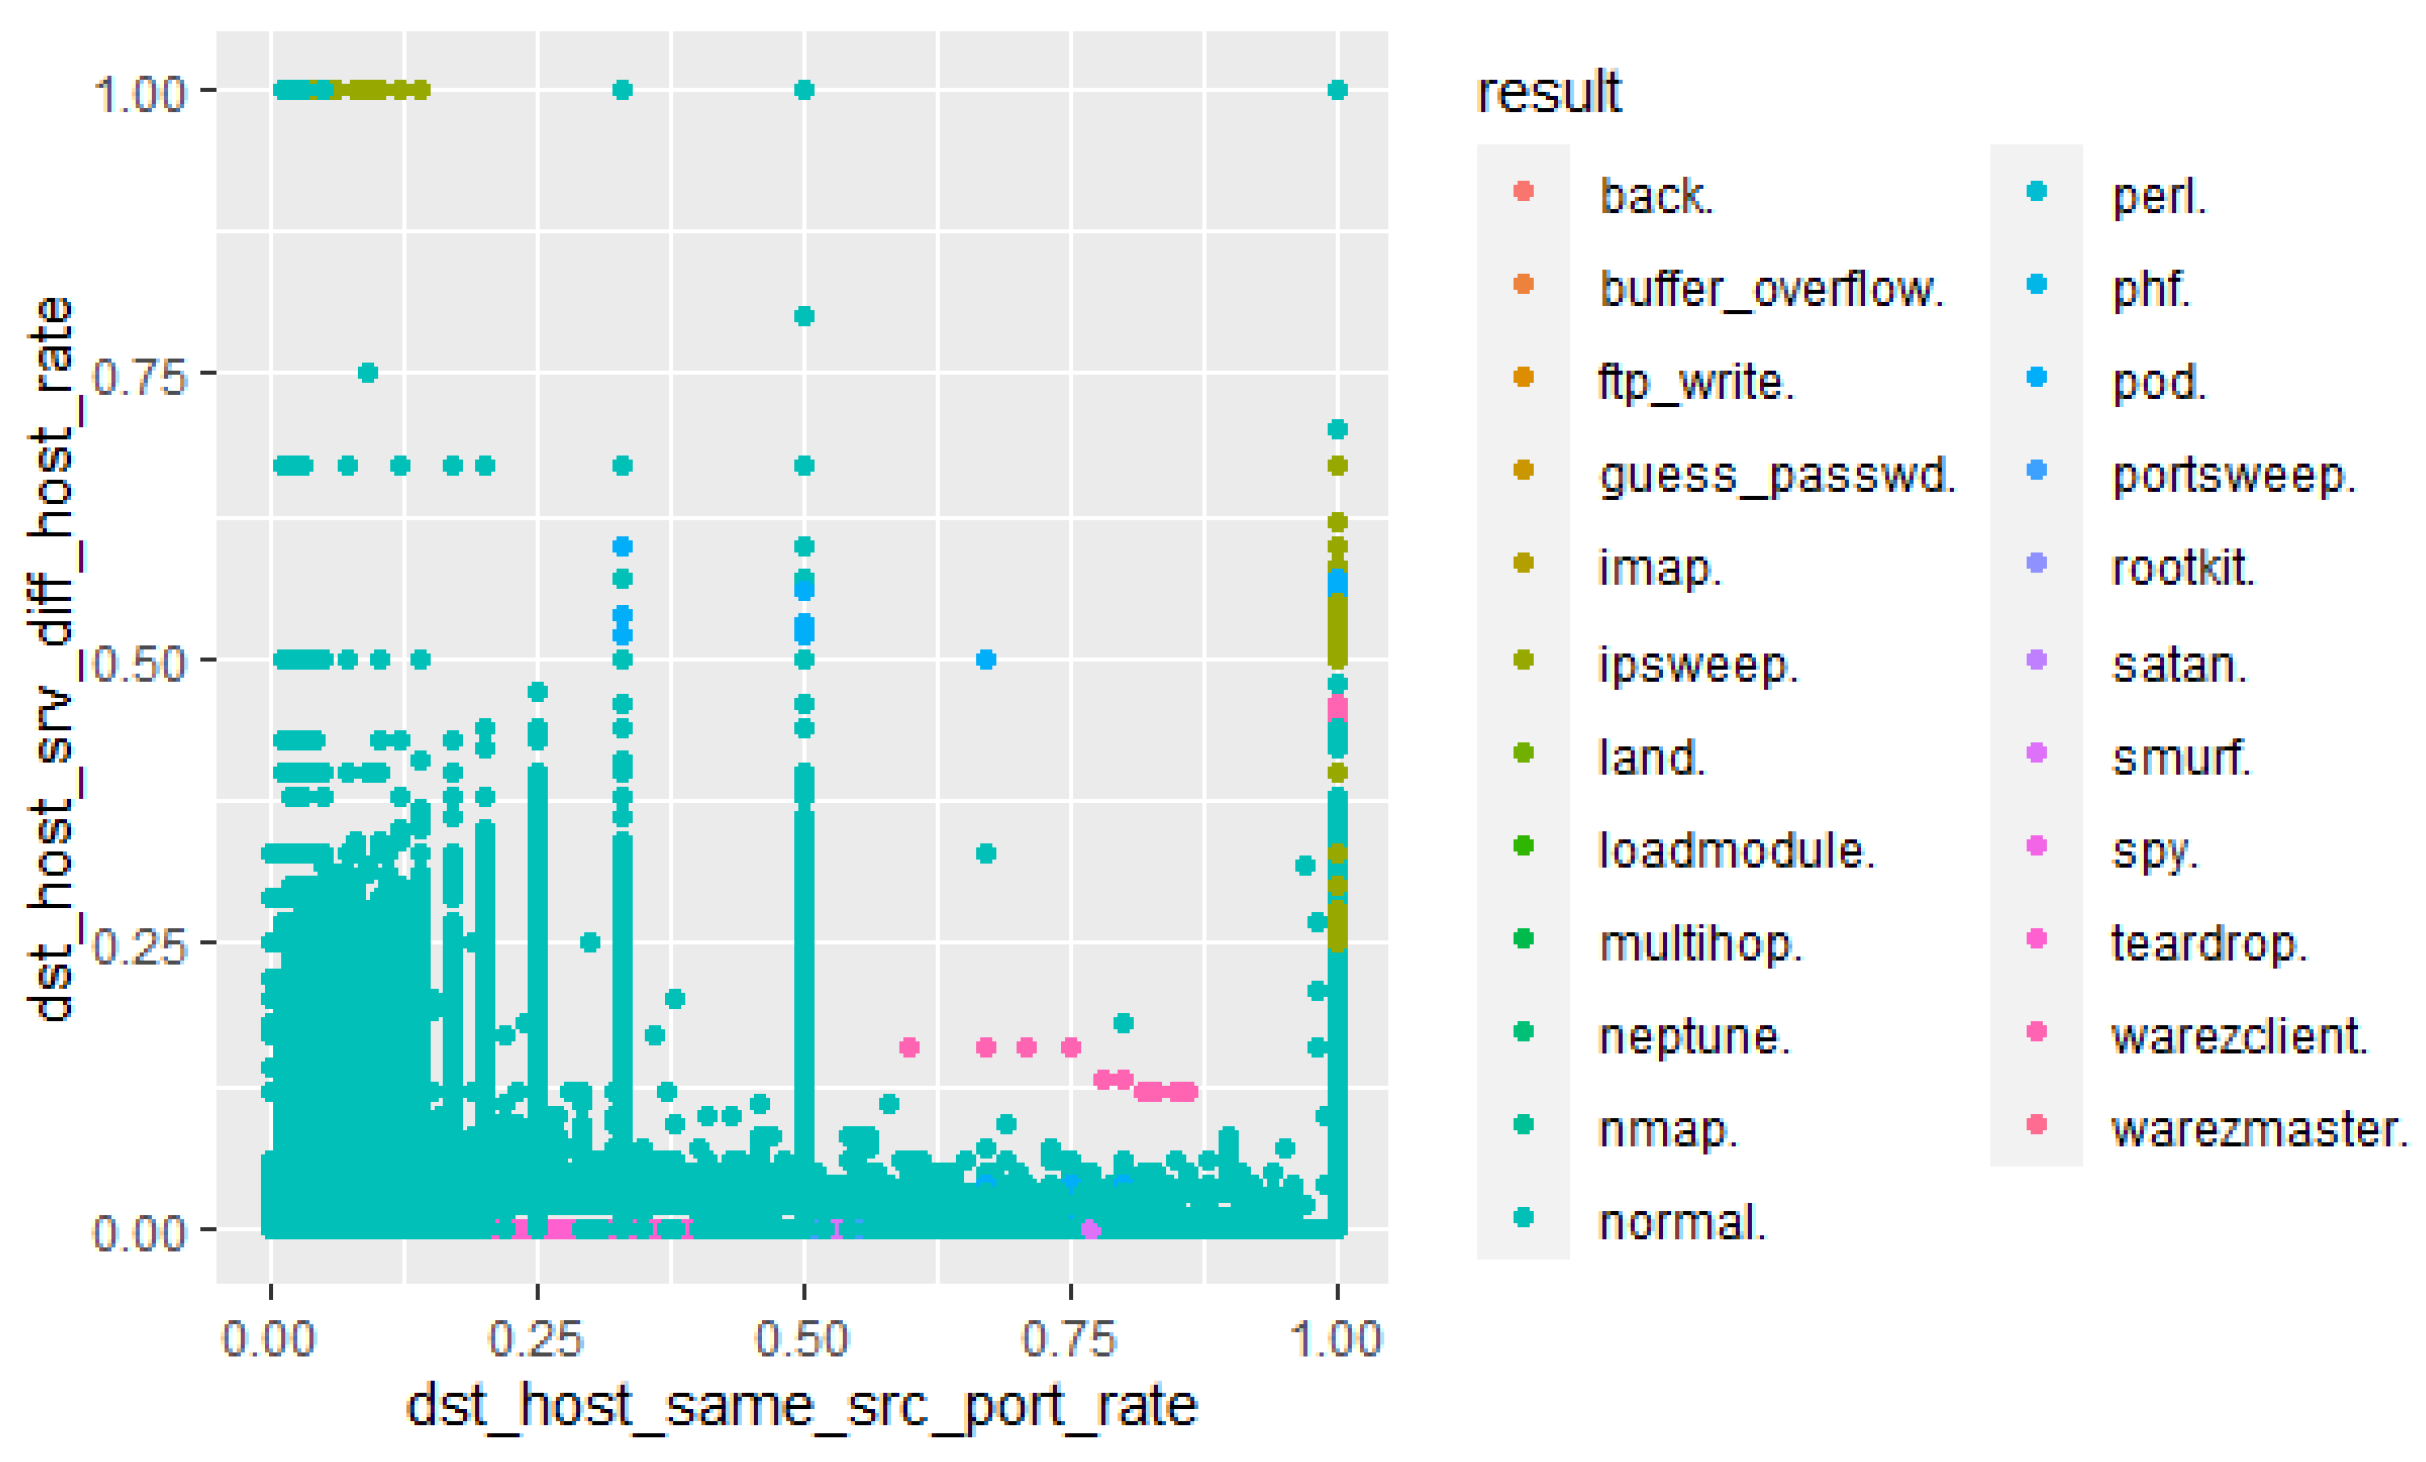
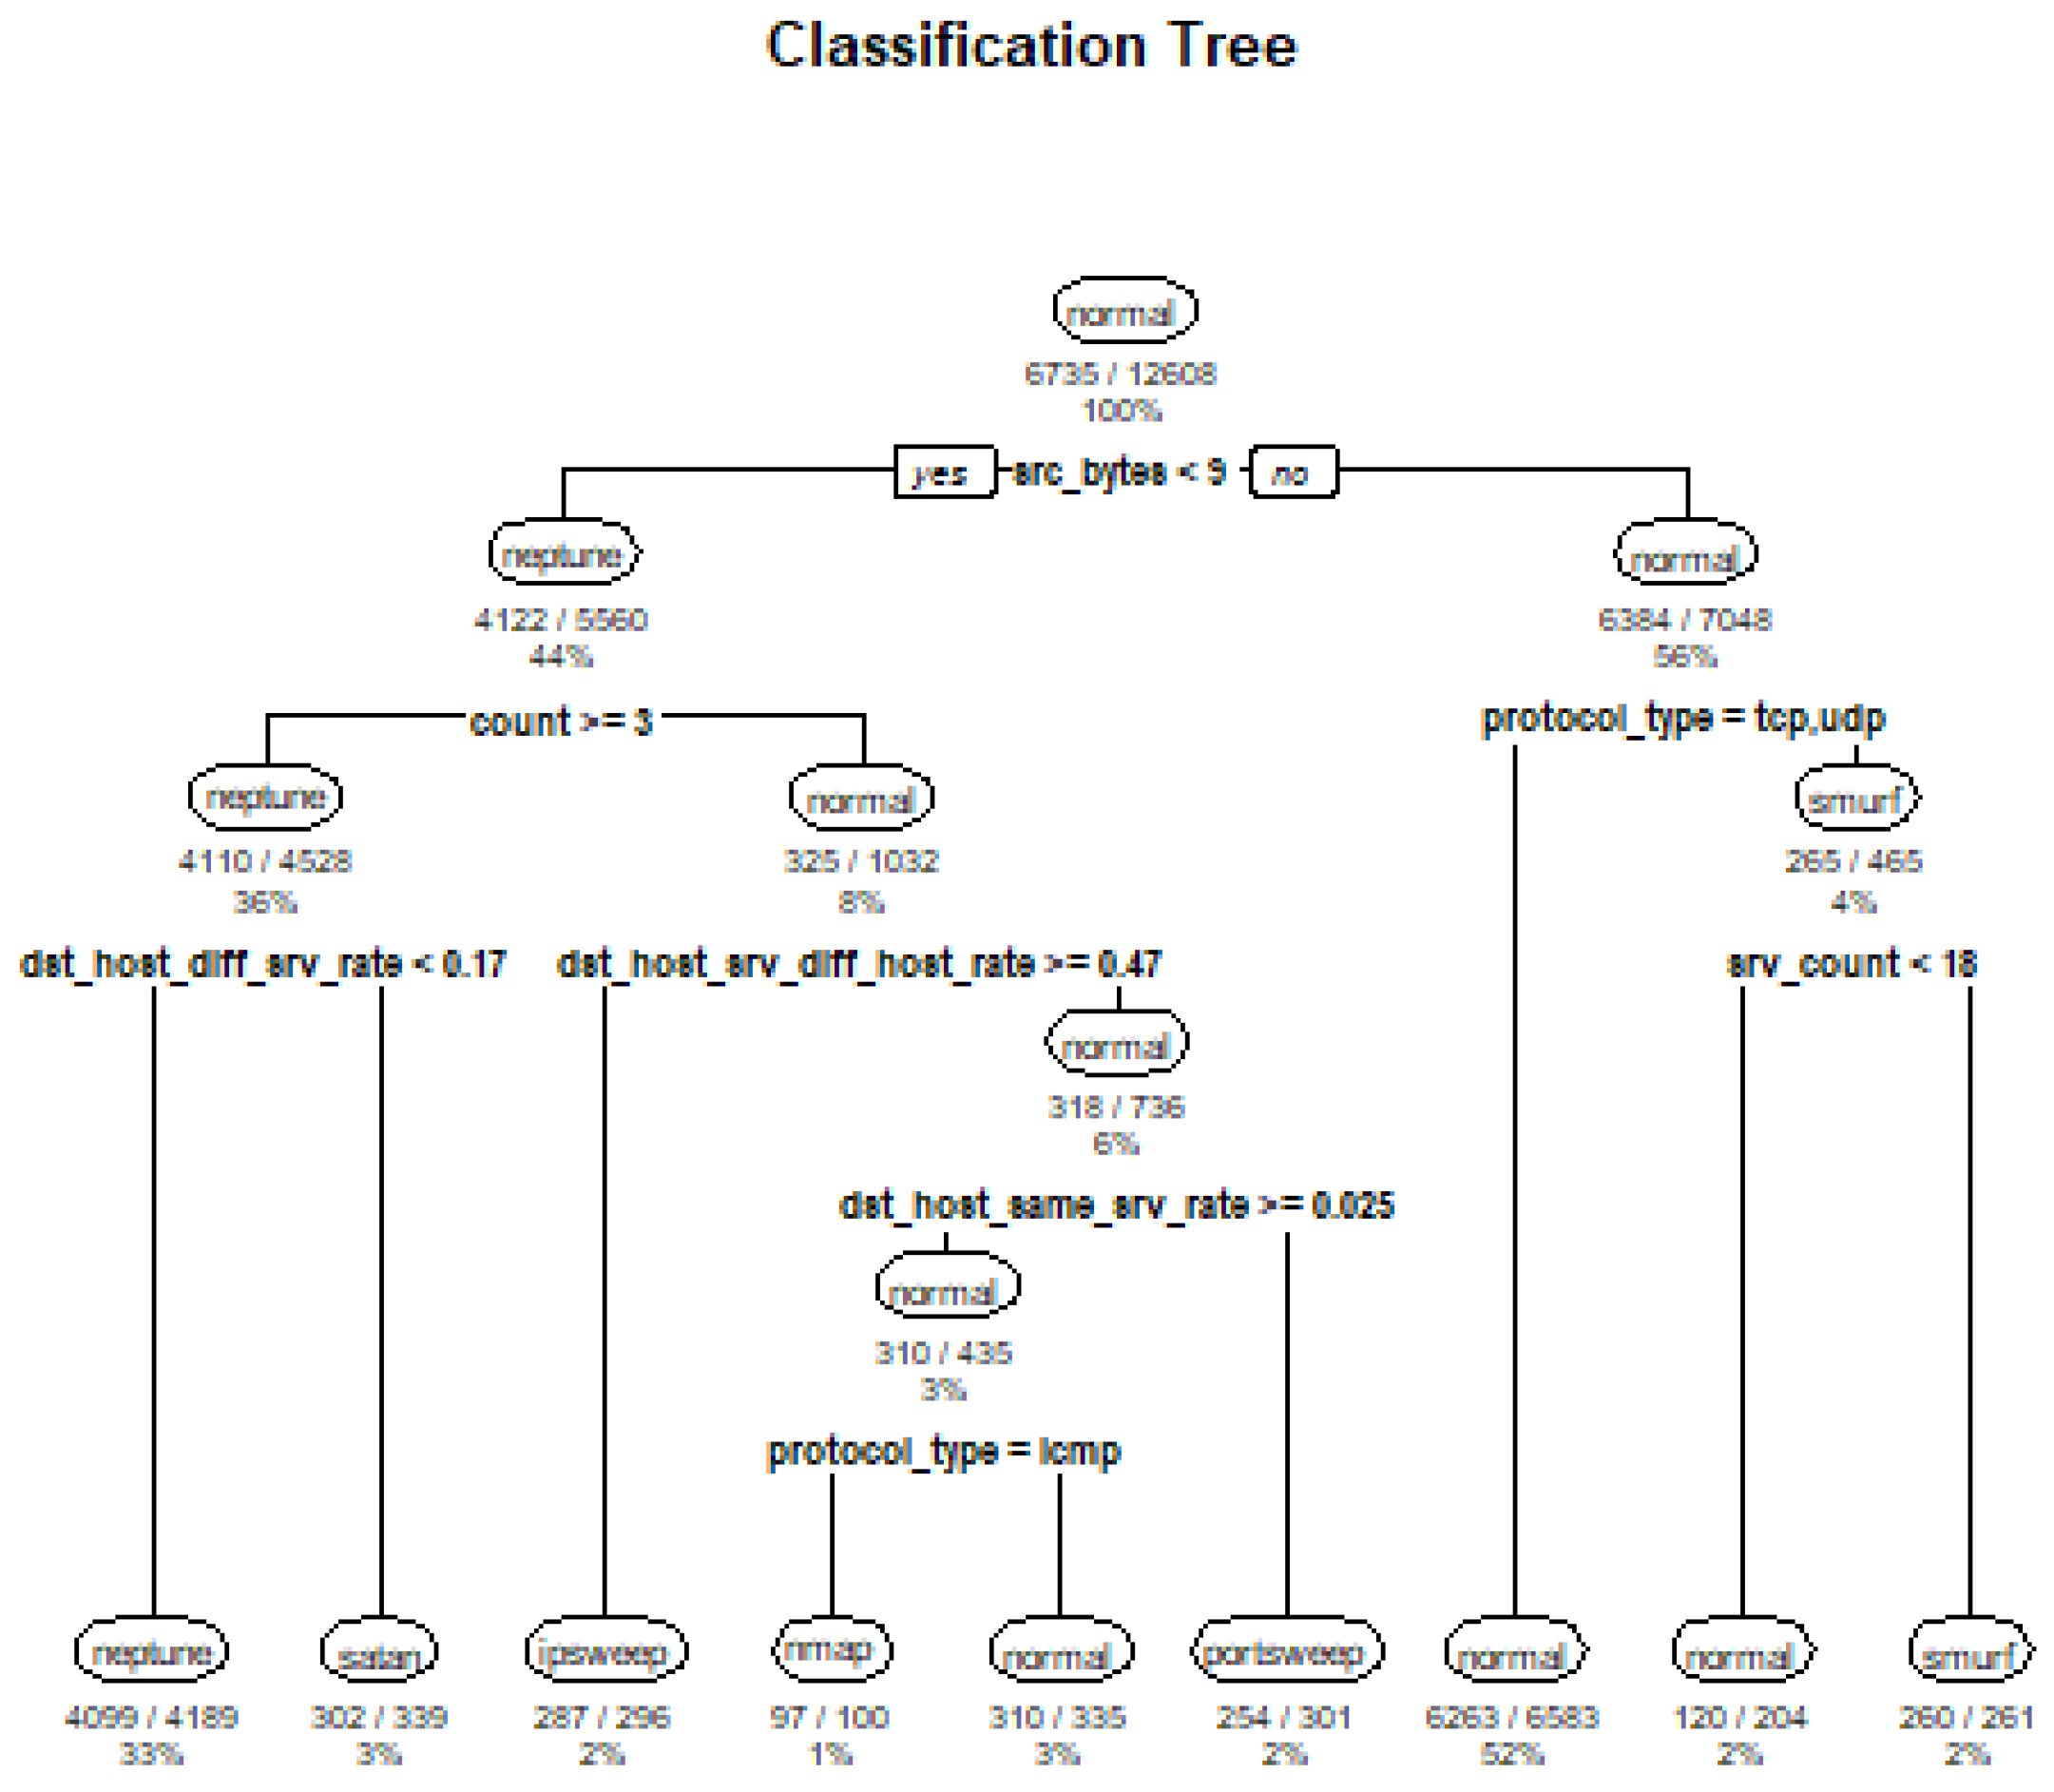
Table 1.
The most recent datasets for the NIDP in the NIDL.
| Name | Dataset Type | Disadvantage |
|---|---|---|
| Sperotto [15] | Netflow | A single host extracted features. |
| MAWI working lab [16] | Tcpdump | False Alarms generation. |
| CTU-13 [17] | Tracing flow | Short netflow. |
| UNB ISCX [18] | Netflow | Limited to Windows XP. |
| ADFA-LD12 [19] | IDS | Limited to normal tracing. |
| UNSW-NB15 [20] | Tcpdump & netflow | Uncorrelated synthetic netflow. |
| CICIDS [21] | Netflow | Lack of triangulated features. |
| SDN [22] | Static & dynamic IoT | Limited to SDN & IoT. |
Table 2.
Relevant features of the UGR’16 dataset.
| Features | Description |
|---|---|
| Protocol | Communication rules. |
| Flag | Netflow states. |
| Forwarding status | The states of outgoing netflow. |
| Type of service | A service provided by a netflow. |
| Packet exchanged | The packets exchanged between hosts. |
| Port | Communication endpoints between hosts. |
| IP address | Unique string that identifies each host. |
| Duration | Netflow duration. |
| Timestamp | Netflow termination. |
Table 3.
The disadvantages of existing studies.
| References | Drawbacks |
|---|---|
| [3] | The time complexity was not considered. |
| [51] | Lack of robust validation methods. |
| [52] | The confusion matrix was not considered. |
| [53] | Binary stratification was considered without confusion matrix. |
| [54] | The time complexity and confusion matrix are not considered. |
Table 4.
The UGR’16 files.
| Filename | Period | Week | Size | Features | Status |
|---|---|---|---|---|---|
| Spam | May | 3 | 32,358 KB | Spam malware | Normal attack |
| Scan 44 | August | 2 | 2020 KB | Scan malware | Normal attack |
| Scan 11 | August | 2 | 527 KB | Scan malware | Normal attack |
| Bonet | July | 5 | 5284 KB | Bonet malware | Normal attack |
| Blacklist | May | 4 | 37,962 KB | Blacklist malware | Normal attack |
Table 5.
The PCA results.
| File | Rows | Variables | Relevant Feature | Total |
|---|---|---|---|---|
| Blacklist | 3,311,559 | 13 | Timestamp | 2761 |
| Spam | 203,693 | 13 | IP address | 377,425 |
| Scan 44 | 547,468 | 13 | TCP | 3,311,559 |
| Scan 11 | 140,541 | 13 | Flag | 2,087,293 |
| Bonet | 607,036 | 13 | Date | 2759 |
Table 6.
The PCA results on the ransomware dataset.
| Ransomware | Cluster | Total | Status |
|---|---|---|---|
| Locky | 1 | 27,423 | Abnormal |
| CryptXXX | 2 | 352 | Abnormal |
| CryptoLocker20 | 3 | 124 | Abnormal |
| CryptoLocker | 5 | 40 | Abnormal |
| DMALocker | 6 | 22 | Abnormal |
| Others | None | 71 | - |
Table 7.
The tabulate format of the final dataset with 14 attributes.
| Column | Attribute | Example | Format |
|---|---|---|---|
| 1 | Prediction | SS | Categorical |
| 2 | Ransomware | EDA2 | Categorical |
| 3 | Bitcoins (BTC) | 60 BTC | Numeric |
| 4 | Dollars (USD) | 400 USD | Numeric |
| 5 | Cluster | 1 | Numeric |
| 6 | Seed Address | 1dice6yg | Categorical |
| 7 | Expended Address | 4ePEyKtk | Categorical |
| 8 | Port | 5062 | Numeric |
| 9 | Malware | SSH | Categorical |
| 10 | Network traffic | 918,919,000 bytes | Numeric |
| 11 | IP address | Class A | Categorical |
| 12 | Flag | AF | Categorical |
| 13 | Protocol | TCP | Categorical |
| 14 | Timestamp | 40 s | Numeric |
Table 8.
The data structure of UGRansome.
| Abnormal Attack | Normal Attack | Prediction | Labelled |
|---|---|---|---|
| Locky | DoS | SS | Synthetic Signature |
| APT | DoS | SS | Synthetic Signature |
| WannaCry | Bonet | SS | Synthetic Signature |
| Flyper | Nerisbonet | SS | Synthetic Signature |
| TowerWeb | Spam | A | Anomaly |
| SamSam | Spam | A | Anomaly |
| JigSaw | Scan | A | Anomaly |
| CryptoLocker types | Blacklist | S | Signature |
| Globe | UDP Scan | A | Anomaly |
| DMALocker | Port Scanning | A | Anomaly |
Table 9.
The result of the confusion matrix with the Random Forest model.
| A | S | SS | Error | |
|---|---|---|---|---|
| A | 49,884 | 389 | 166 | 0.011003390 |
| S | 648 | 80,490 | 265 | 0.011215803 |
| SS | 84 | 182 | 52,830 | 0.005009794 |
Table 10.
Predictive results of the Random Forest model.
| A | S | SS | |
|---|---|---|---|
| A | 50,633 | 465 | 16 |
| S | 254 | 81,602 | 114 |
| SS | 51 | 157 | 53,488 |
Table 11.
The accuracy of the prediction with the Random Forest model.
| A | S | SS | |
|---|---|---|---|
| A | 99.06 | 0.91 | 0.03 |
| S | 0.31 | 99.55 | 0.14 |
| SS | 0.09 | 0.29 | 99.61 |
Table 12.
The comparison of UGRansome with legacy datasets.
| Dataset | Random Forest | Decision Tree | Final Ensemble Learning |
|---|---|---|---|
| KDD99 | 99% | 99% | 99% |
| NSL-KDD | 100% | 98% | 100% |
| UGRansome | 99% | 44% | 99% |
Table 13.
The Comparison with other research results in the field.
| Research | Algorithms | Accuracy | Dataset |
|---|---|---|---|
| [56] | RandomTree & DecisionStump | 99% | NSL-KDD |
| [57] | Network traffic anomalies detection | 99% | Legacy datasets |
| [58] | AI4SAFE-IoT | 100% | IOT |
| [59] | Boosting method of logistic model trees | 99% | DDoS traffic |
| [60] | Logistic Regression | 99% | IOT & Netflow |
Publisher’s Note: MDPI stays neutral with regard to jurisdictional claims in published maps and institutional affiliations. |
© 2021 by the authors. Licensee MDPI, Basel, Switzerland. This article is an open access article distributed under the terms and conditions of the Creative Commons Attribution (CC BY) license (https://creativecommons.org/licenses/by/4.0/).
Share and Cite
MDPI and ACS Style
Nkongolo, M.; van Deventer, J.P.; Kasongo, S.M. UGRansome1819: A Novel Dataset for Anomaly Detection and Zero-Day Threats. Information 2021, 12, 405. https://doi.org/10.3390/info12100405
AMA Style
Nkongolo M, van Deventer JP, Kasongo SM. UGRansome1819: A Novel Dataset for Anomaly Detection and Zero-Day Threats. Information. 2021; 12(10):405. https://doi.org/10.3390/info12100405
Chicago/Turabian StyleNkongolo, Mike, Jacobus Philippus van Deventer, and Sydney Mambwe Kasongo. 2021. "UGRansome1819: A Novel Dataset for Anomaly Detection and Zero-Day Threats" Information 12, no. 10: 405. https://doi.org/10.3390/info12100405
Note that from the first issue of 2016, this journal uses article numbers instead of page numbers. See further details here.