
System Design to Utilize Domain Expertise for Visual Exploratory Data Analysis †


Chair of Technologies and Management of Digital Transformation, University of Wuppertal, Rainer-Gruenter-Str. 21, 42119 Wuppertal, Germany
*
Author to whom correspondence should be addressed.
†
This paper is an extended version of our paper “Towards Utilizing Domain Expertise for Exploratory Data Analysis” published in Proceedings of the 12th International Symposium on Visual Information Communication and Interaction (VINCI’2019) © ACM, Shanghai, China, 20–22 September 2019. http://dx.doi.org/10.1145/3356422.3356434 .
Information 2021, 12(4), 140; https://doi.org/10.3390/info12040140
Submission received: 25 February 2021
/
Revised: 17 March 2021
/
Accepted: 20 March 2021
/
Published: 24 March 2021
(This article belongs to the Section Information Systems)
Abstract
:Exploratory data analysis (EDA) is an iterative process where data scientists interact with data to extract information about their quality and shape as well as derive knowledge and new insights into the related domain of the dataset. However, data scientists are rarely experienced domain experts who have tangible knowledge about a domain. Integrating domain knowledge into the analytic process is a complex challenge that usually requires constant communication between data scientists and domain experts. For this reason, it is desirable to reuse the domain insights from exploratory analyses in similar use cases. With this objective in mind, we present a conceptual system design on how to extract domain expertise while performing EDA and utilize it to guide other data scientists in similar use cases. Our system design introduces two concepts, interaction storage and analysis context storage, to record user interaction and interesting data points during an exploratory analysis. For new use cases, it identifies historical interactions from similar use cases and facilitates the recorded data to construct candidate interaction sequences and predict their potential insight—i.e., the insight generated from performing the sequence. Based on these predictions, the system recommends the sequences with the highest predicted insight to data scientist. We implement a prototype to test the general feasibility of our system design and enable further research in this area. Within the prototype, we present an exemplary use case that demonstrates the usefulness of recommended interactions. Finally, we give a critical reflection of our first prototype and discuss research opportunities resulting from our system design.
1. Introduction
Since the beginning of knowledge discovery in databases, one of the most common tasks of a data scientist is to find interesting insights and discover knowledge in datasets by performing exploratory data analysis (EDA) [1]. During this process, the scientist examines the data to find patterns and trends, detect anomalies (e.g., outliers) and check the validity of hypotheses within the data. This helps the data scientist to learn about the characteristics of the data and especially the associated domain. Thus, EDA is an important step at the beginning of the data science process as the generated insights mainly influence subsequent tasks such as data cleansing and feature engineering. EDA is known to be a difficult process since the quality of findings depend on the analyst’s ability to ask the right questions and to translate these questions into the right sequence of analysis interactions. In this article, we present a system design to utilize domain expertise during EDA to increase the quality of findings and to speed up the time to gain insights. Until today, several similar EDA recommender systems (e.g., [2,3,4]) and visionary systems for fully automated EDA (e.g., [5,6]) have been proposed. Nevertheless, those approaches focus on EDA tools that provide extensive means to statistically analyze and visualize a dataset to discover insightful views. Our approach is based on the core hypothesis that domain knowledge from experts is an essential part of the EDA process. Thus, the quality of generated insight and the time to gain insights depends on the domain expertise of the person conducting the analysis. For example, statistically significant correlation may be trivial or not relevant at all, depending on the analyzed data and the use case from which this data were recorded. Therefore, we propose a complementary approach that utilizes human domain expertise to recommend whole sequences of interactions. To achieve this, we propose a system design that operates in two phases: In the first phase, we record domain experts’ EDA sessions by storing interactions and analysis context and encourage them to bookmark findings to indicate insights. In the second phase, where a domain novice performs EDA on a similar use case, we generate candidate interaction sequences from the collected EDA sessions of the first phase and rank them by predicted insights that is generated from performing the sequence. The sequences with the highest predicted insight are then proposed for visual guidance.
In extension to existing approaches, our approach has two main advantages that cannot be achieved otherwise:
- We recommend views that do not necessarily show statistically prominent data from the dataset (e.g., anomalies) but those views that contain insights from the perspective of a domain expert.
- We recommend coherent sequences of interactions (i.e., a sequence of consecutive views) to provide more context to an insight compared to recommendation of single independent views.
We evaluate the feasibility of our approach by implementing a limited proof-of-concept prototype. In the prototype, we implement an operational first version of all components, which will be further developed in the future. Using the prototype, we demonstrate a use case by giving recommendations for the exploration of temperature data in Brazil and show how the proposed interactions contribute to a better understanding of the data.
In Section 2, we give a detailed problem description including associated research questions. We review a selection of relevant related work in Section 3. We contribute our conceptual system design and describe the functionality and interaction of abstract system components in Section 4. Furthermore, we implement a limited proof-of-concept prototype and present its usage in an exemplary use case to demonstrate the feasibility of our system. In Section 5, we give a critical reflection of the presented work and discuss challenges for further research in this area, We finish with a conclusion in Section 6.
2. Problem Description
According to Colleen McCue [7] “[…] domain expertise implies knowledge and understanding of the essential aspects of the field of inquiry. Domain expertise includes insight regarding the sources and limitations of the data, operational requirements and constraints, and context”. For EDA, that means there are two core elements that constitute a gain in knowledge: one is an identified, interesting view of the data and the other is the sequence of operations an analyst has performed to understand the view and its context [8]. Both elements require domain knowledge that can either be contributed by domain experts or needs to be integrated into the underlying process. Domain experts know what interesting data points look like in their specific domain, and they know what sequence of visualizations they need to look at in order to validate hypotheses about those data points. Take, for example, a process from the manufacturing industry in which two parts are first glued and then welded together. Now, it can happen that the glue has been applied too thickly and, during the subsequent welding process, the seam becomes soiled because the welding head is blocked by the excessive glue. In this case, it is not possible for a data analyst to understand the data of the conspicuous weld seam without also looking at the corresponding data of the gluing process. Therefore, a specific sequence of analysis operations (e.g., creating certain views of both, gluing and welding, processes in comparison) is necessary to generate knowledge about conspicuous features in the production process. From the above description, we define domain knowledge in the context of EDA as interaction sequences that yield insights in the context of a specific domain. We now want to develop a system that guides domain novices through insightful views and thus allows them to build domain knowledge by themselves.
There are four key challenges and their corresponding research questions in designing such a system:
Record EDA sessions: How to record EDA sessions and context? A core concept of our system is to utilize the expertise of domain experts. Therefore, we need to be able to record EDA sessions of experts in a way that we can derive recommendations from them. Similar to when the expert would demonstrate an analysis and the novice would learn from it.
Evaluate EDA sessions: How to measure insight? Insight is an abstract concept that describes “(the ability to have) a clear, deep, and sometimes sudden understanding of a complicated problem or situation” [9]. We need to construct interaction sequence candidates and recommend those candidates of which we predict that they yield insight. Thus, we need to define or learn a measurable representation for insight for our prediction algorithm.
Gather recommendation data: How to identify a suitable subset of historical EDA data for new use cases? Since recommendations are made on past data, a suitable amount of historical data must be available to extract recommendations for new use cases. It is unlikely that data scientists will only work the same use case over and over. Therefore, we need to develop a way to identify related use cases in order to extend the available historical data.
Provide recommendations: How to generate good EDA recommendations? After historical data can be recorded and selected for new use cases, and we have found a suitable representation for insight, we still need to develop the actual recommender system. The system should construct new interaction sequences from the existing data, which give the data scientists as much insight into their data as possible.
3. Related Work
In the following, we give an overview of the state of the art of current visual analytics tools to see the progress that has been made to facilitate the EDA process from a tool perspective. Afterwards, we present research in the area of analytic provenance that focuses on recording user interactions and some related research to measurement and rating of insight. Finally, since we are building a recommender system for interactions, we give a short overview of work on recommender systems algorithms outside of our application domain.
3.1. Systems to Ease the Visualization of Data
There are several VA systems that provide extensive statistical and visual methods. We review a non-exhaustive but representative selection of relevant related systems. Most of the commercial VA tools such as Power BI [10], Tableau [11] or Qlik [12] focus on recommending a good visualization for the data selected during a data analysis (e.g., pie chart for categorical data). However, in 2018, Behrisch et al. [13] conducted a study on the status of commercial VA systems for new requirements in the area of big data analysis and concluded that most systems focus on confirmatory data analysis, where an analyst pursues a question and tries to find answers to this question within data. They found that those systems are not particularly good at supporting analysts in exploratory analysis where it is necessary to search for the most important insights in all available data. Batch and Elmqvist [14] supported these findings with a user study that shows that data scientists often prefer static over dynamic interactive visualizations during initial exploratory analysis. They explained this phenomenon with the time required to construct adequate views to answer questions during sensemaking and the lack of suitable guidance tools. Both studies support our approach. We suggest a new system design to offer guidance in interactive exploratory data analysis tools. Our system design is generally applicable to visualization tools and can be adapted for guidance in those systems.
3.2. Systems to Recommend Statistically Interesting Views on Datasets
Wongsuphasawat et al. [15] presented the Voyager system that, in addition to the constructed charts, presents recommended additional charts to an analyst based on statistical and perceptual measures. Relevant views can be bookmarked for later inspection. Demiralp et al. [16] presented Foresight, a system that recommends views by multiple metrics that measure statistical relevance between features. Thus, the analyst explores insight space instead of feature space. There is some additional research on mining statistical relevant features and insights directly from databases [17,18] and research by Srinivasan et al. that shows how to augment views with insights in text form [19]. These approaches focus on mining statistically interesting insights from datasets. Our system takes a different approach in two aspects. First, we argue that it is beneficial to suggest interaction sequences instead of single views to the user because interaction sequences offer more context to the final view. Second, we rely on human expert knowledge to learn relevant views. We argue that, especially with a lot of data, a data scientist needs to view some data that are not statistically relevant to make sense of the underlying domain and domain experts know best which data are relevant to understand the domain. Both those tools and our system have in common that they rely on some means to quantify the amount of insight generated during EDA.
3.3. Systems to Recommend Statistically Relevant Next Steps during EDA
There are also systems that recommend next steps for ongoing EDA sessions based on logs or by means of interactive user feedback. Eirinaki et al. [20] matched users’ behavior of constructing database queries with a log of past queries and recommend queries of similar user. Milo and Somech [4] analyzed interaction paths taken during EDA of a dataset and identified actions that were taken by other users in similar EDA contexts (i.e., same interactions performed previously on the dataset). The approach recommends probable next steps based on the types of interactions performed. However, it requires a lot of interaction data on a dataset and ignores the relevance of the suggestions for the analyzed domain, making it difficult to transfer between domains. Dimitriadou et al. [21] and Huang et al. [22] presented systems that use real-time feedback and active learning to recommend interactions during exploratory data analysis. These methods have been shown to improve quality and speed of findings. Our system works in a similar way but utilizes domain expertise as a source of knowledge to also provide guidance where interesting insights cannot be inferred from statistic characteristics of the dataset. We recommend interactions and use data of similar domains and use cases identified by the domain model of the data. Therefore, we assume that our system design will provide similar benefits regarding quality and speed of findings but is better transferable to different related complex domains.
3.4. Systems to Track and View Interaction Data
In the area of analytic provenance, there is relevant research that deals with recording and analyzing user interaction [23,24]. Endert et al. [25] introduced a system by defining interactions for similarity analysis between texts and assigning semantics to these interactions. The result is an expert system that can steer the underlying model on the basis of these semantic interactions. Feng et al. [26] and Gotz et al. [27] recorded user interactions and then utilized the interaction history in VA to integrate indicators into an analytics tool. This allows users to record their sensemaking process and revisit central views. Camisetty et al. [28] presented a similar system that uses analytic provenance data to enhance a web-based analytics application to record user interactions, lets them recap their interaction paths and allows them to revisit important choices when new data becomes available. There is additional related work that records user interactions and tries to prepare and visualize those interactions in such a way that it becomes recognizable where an analyst has gained central insights [29,30]. Boukhelifa et al. [31] performed an exploratory study on the sensemaking process of domain experts during EDA. They identified common patterns in for how domain experts structure EDA sessions. Building upon that research, Barczewski et al. [32] used machine learning to automatically identify those patterns from interaction data. A similar approach was also used by Caruccio et al. who mined and classified user interaction patterns to identify and understand user intent during the navigation of websites [33]. Current research in analytic provenance focuses on tracking user interaction and using tracked interactions to enhance analytics tools with a history of past analysis interactions. We use many of the existing approaches and, additionally, our system design makes advances in the area of utilizing recorded user interactions for guidance.
3.5. Recommender Systems
Finally, we give an overview of the functioning of recommender systems. The general idea is that our guidance system recommends interaction sequences to the data scientists, and the study of recommender systems has a long history. Therefore, there is a lot of literature about the general design and idea of recommender systems. Good overviews were given by Ricci et al. in Recommender systems handbook [34] and Jannach et al. in Recommender systems: an introduction [35], from which our system benefits. Those systems apply filter and ranking mechanisms to specific kinds of content to meet user preferences. Convingtion et al. [36] used deep neural networks for recommendations on the YouTube video platform. From the available videos, recommendation candidates are generated by using users’ viewing history and context. Those videos are then ranked by a machine learning algorithm and presented to the user.
4. Using Machine Learning and Analytic Provenance for Guided Visual Exploratory Data Analysis
In this section, we describe our conceptual system design to implement a machine learning based guidance system that recommends analysis operations based on recorded user interactions and analysis context. We give a high level overview of the process of our system design and then show how the presented components contribute to the research questions discussed in Section 2. Subsequently, we implement a prototype that shows one concrete example implementation of our system design and present an exemplary use case to enable further research.
4.1. System Workflow
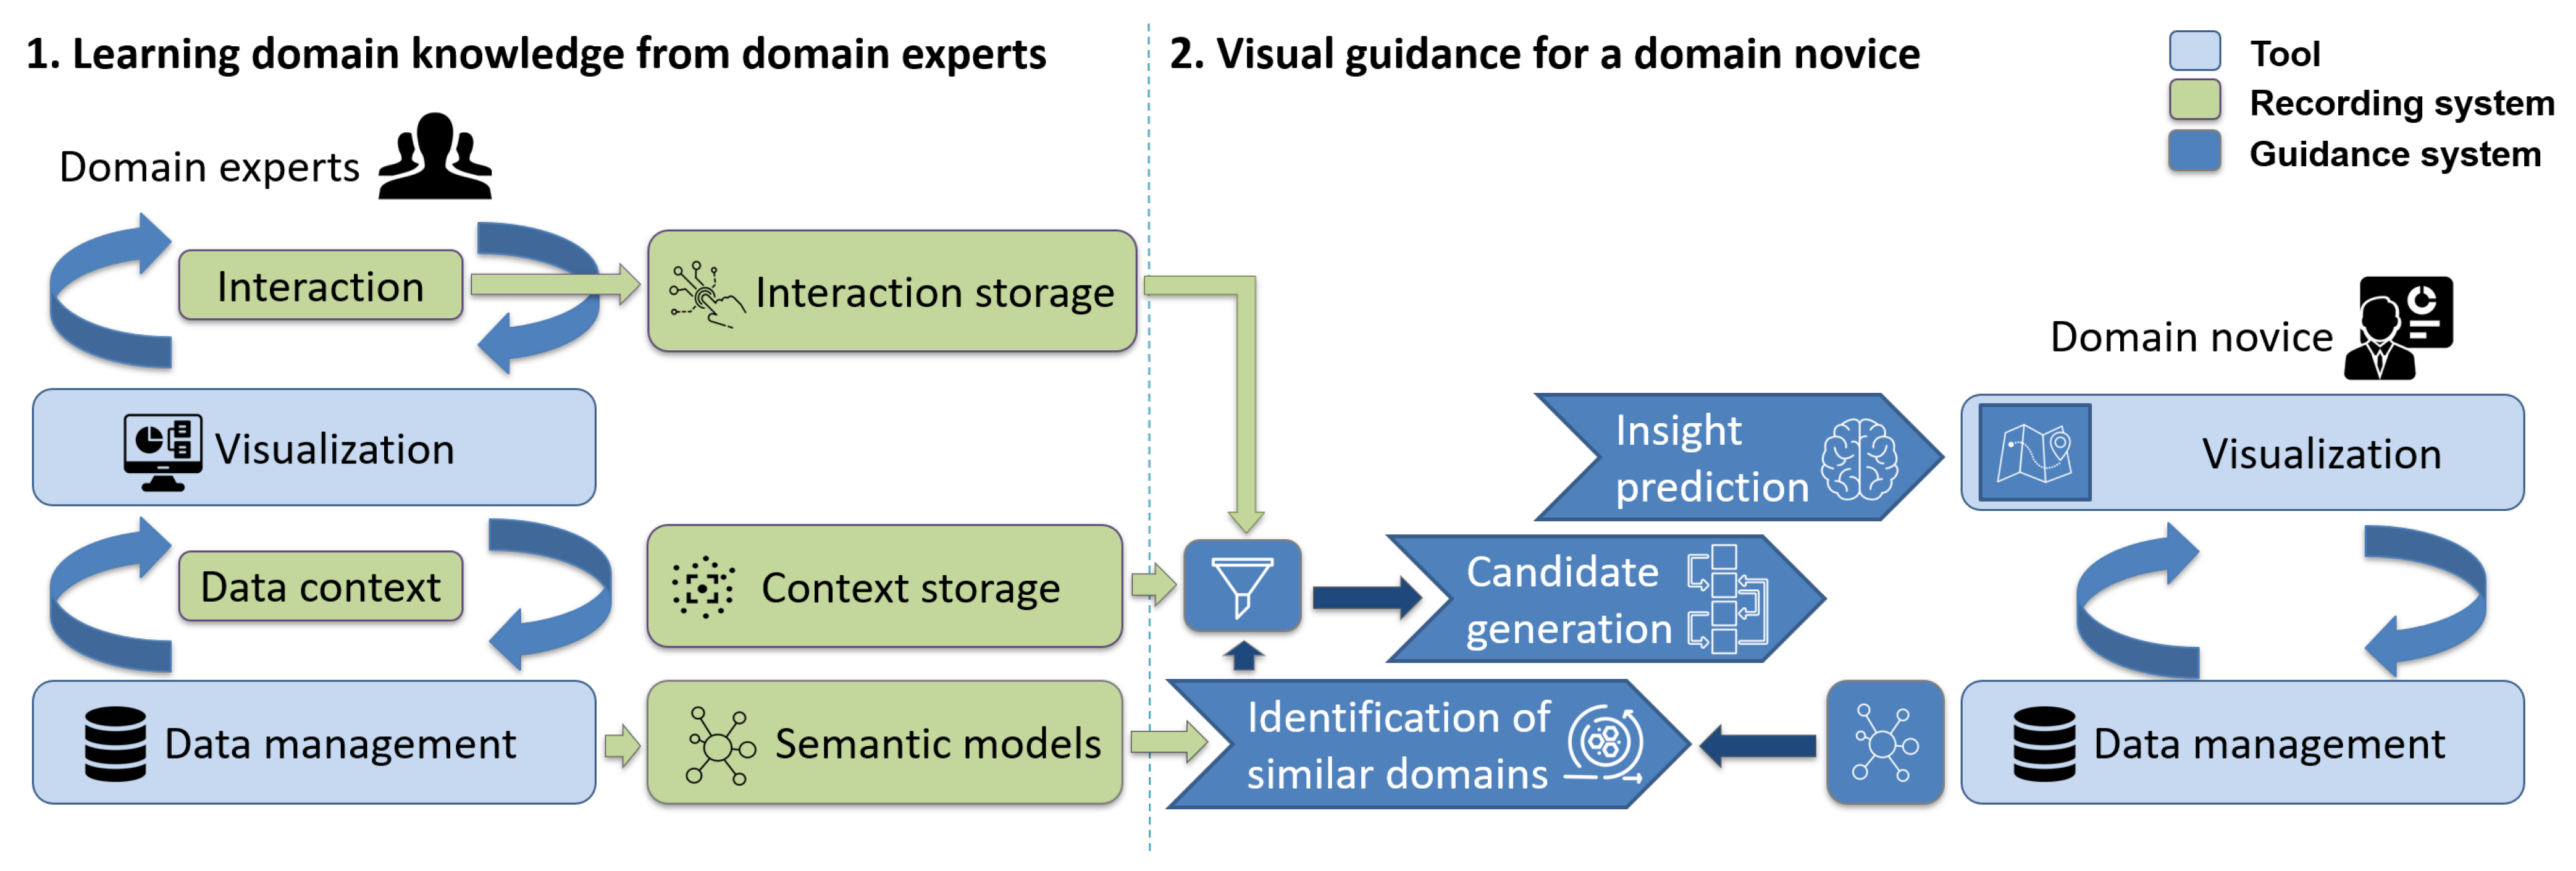
Figure 1 shows a high level overview of our system design. The system design consists of two parts: (1) learning domain knowledge from domain experts; and (2) deriving visual guidance for domain novices from the learned domain knowledge. Domain experts create a semantic model for the data that they analyze and perform EDA. During EDA, interactions and insight context are stored in the interaction storage and context storage (see Section 4.2). This data are then used to guide EDAs in similar domains. First similar domains are identified by comparing stored and current domain models (Section 4.4). Afterwards, candidate interaction sequences are generated and sorted based on the predicted insight that might be gained by performing this sequence (Section 4.3). The sequences with the highest predicted insight is used for integrated visual guidance during EDA of a domain novice (Section 4.5).
4.2. Record EDA Sessions: How to Record EDA Sessions and Context?
The interactions carried out during the data analysis process are stored in the interaction storage as an analysis interaction history. We suggest dividing interactions into the following types: meta, analysis and insight actions. This classification allows us later, for example, to filter out all insight actions for the construction of our recommendations. Meta interactions define initial state, session ending and undo and redo. Those interactions are interesting for a graphical analysis because they give some hints on the thinking process of the data scientist, but those interactions are not suited for the actual guidance; for example, it would be strange to guide someone to undo and redo an interaction afterwards. Analysis interactions describe the action space of the analysis tool. Thus, they need to contain the action and the actions parametrization (e.g., action: filter; parameters: values > 1). Insight actions are discussed in Section 4.3. The data are stored in graph-based representation that describes view states and interactions which perform transitions between views (see Section 4.6 for an example of such kind of interactions and an example of a graph-based representation).
The context storage evaluates the characteristics of the data that are contained in views, which are put into final reports. Those views yield some kind of insight, which is often generated by data with interesting characteristics as spikes or inconsistencies. The context storage identifies those data points and searches for similar data points within new datasets. The representation of the characteristic depends on the data type. An approach to identify similar characteristics within datasets was proposed by Chirigati et al. [37].
4.3. Evaluate EDA Sessions: How to Measure Insight?
To our knowledge, there is no method that allows automatically inferring if a data scientist discovered some insight in a dataset. Therefore, a common approach is to require explicit insight actions where the data scientist manually indicates insightful views. We suggest implementing bookmarks that indicate an insightful view and allow the data scientist to export those views in a final report. This way, it will be easier for him to present his findings to someone else and we can be sure that the relevant views have been bookmarked. Based on the bookmarks, it is then possible to quantify the insight content of the views. For an initial approach, we suggest to implement a popularity ranking, that is, if a view receives more bookmarks from different data scientists, it is ranked higher.
4.4. Gather Recommendation Data: How to Identify a Suitable Subset of Historical EDA Data for New Use Cases?
Our recommender system requires a set of historical EDA training data. To identify a suitable subset of historical interaction data, we suggest using semantic models. Semantic models depict the concepts and relations within a dataset and, thus, provide further information on the origin and use of the analyzed data. Unless otherwise possible, the semantic model must be created by the data scientist when selecting the dataset. Management of semantic models can be implemented by a knowledge graph-based data management system, as proposed by Pomp et al. [38]. For two semantic models, we suggest to identify similar domains by using the graph edit distance on those models. The graph edit distance calculates the minimum number of graph edit operations to transform one graph to another. Thus, it gives us a quantifiable value of the similarity between semantic models of two domains [39]. We propose to include the historical EDA data of use cases that have a graph edit distance that is smaller than 80% of the sum of the number of vertexes and edges in the semantic model of the new use case (i.e., only 20% of the model had to be changed to have exact matching semantic models). The threshold of 80% that we use in the initial version of our approach can be adjusted upwards later based on the number of historical data to receive historical EDA data of more similar domains that might yield better recommendations.
4.5. Provide Recommendations: How to Generate Good EDA Recommendations?
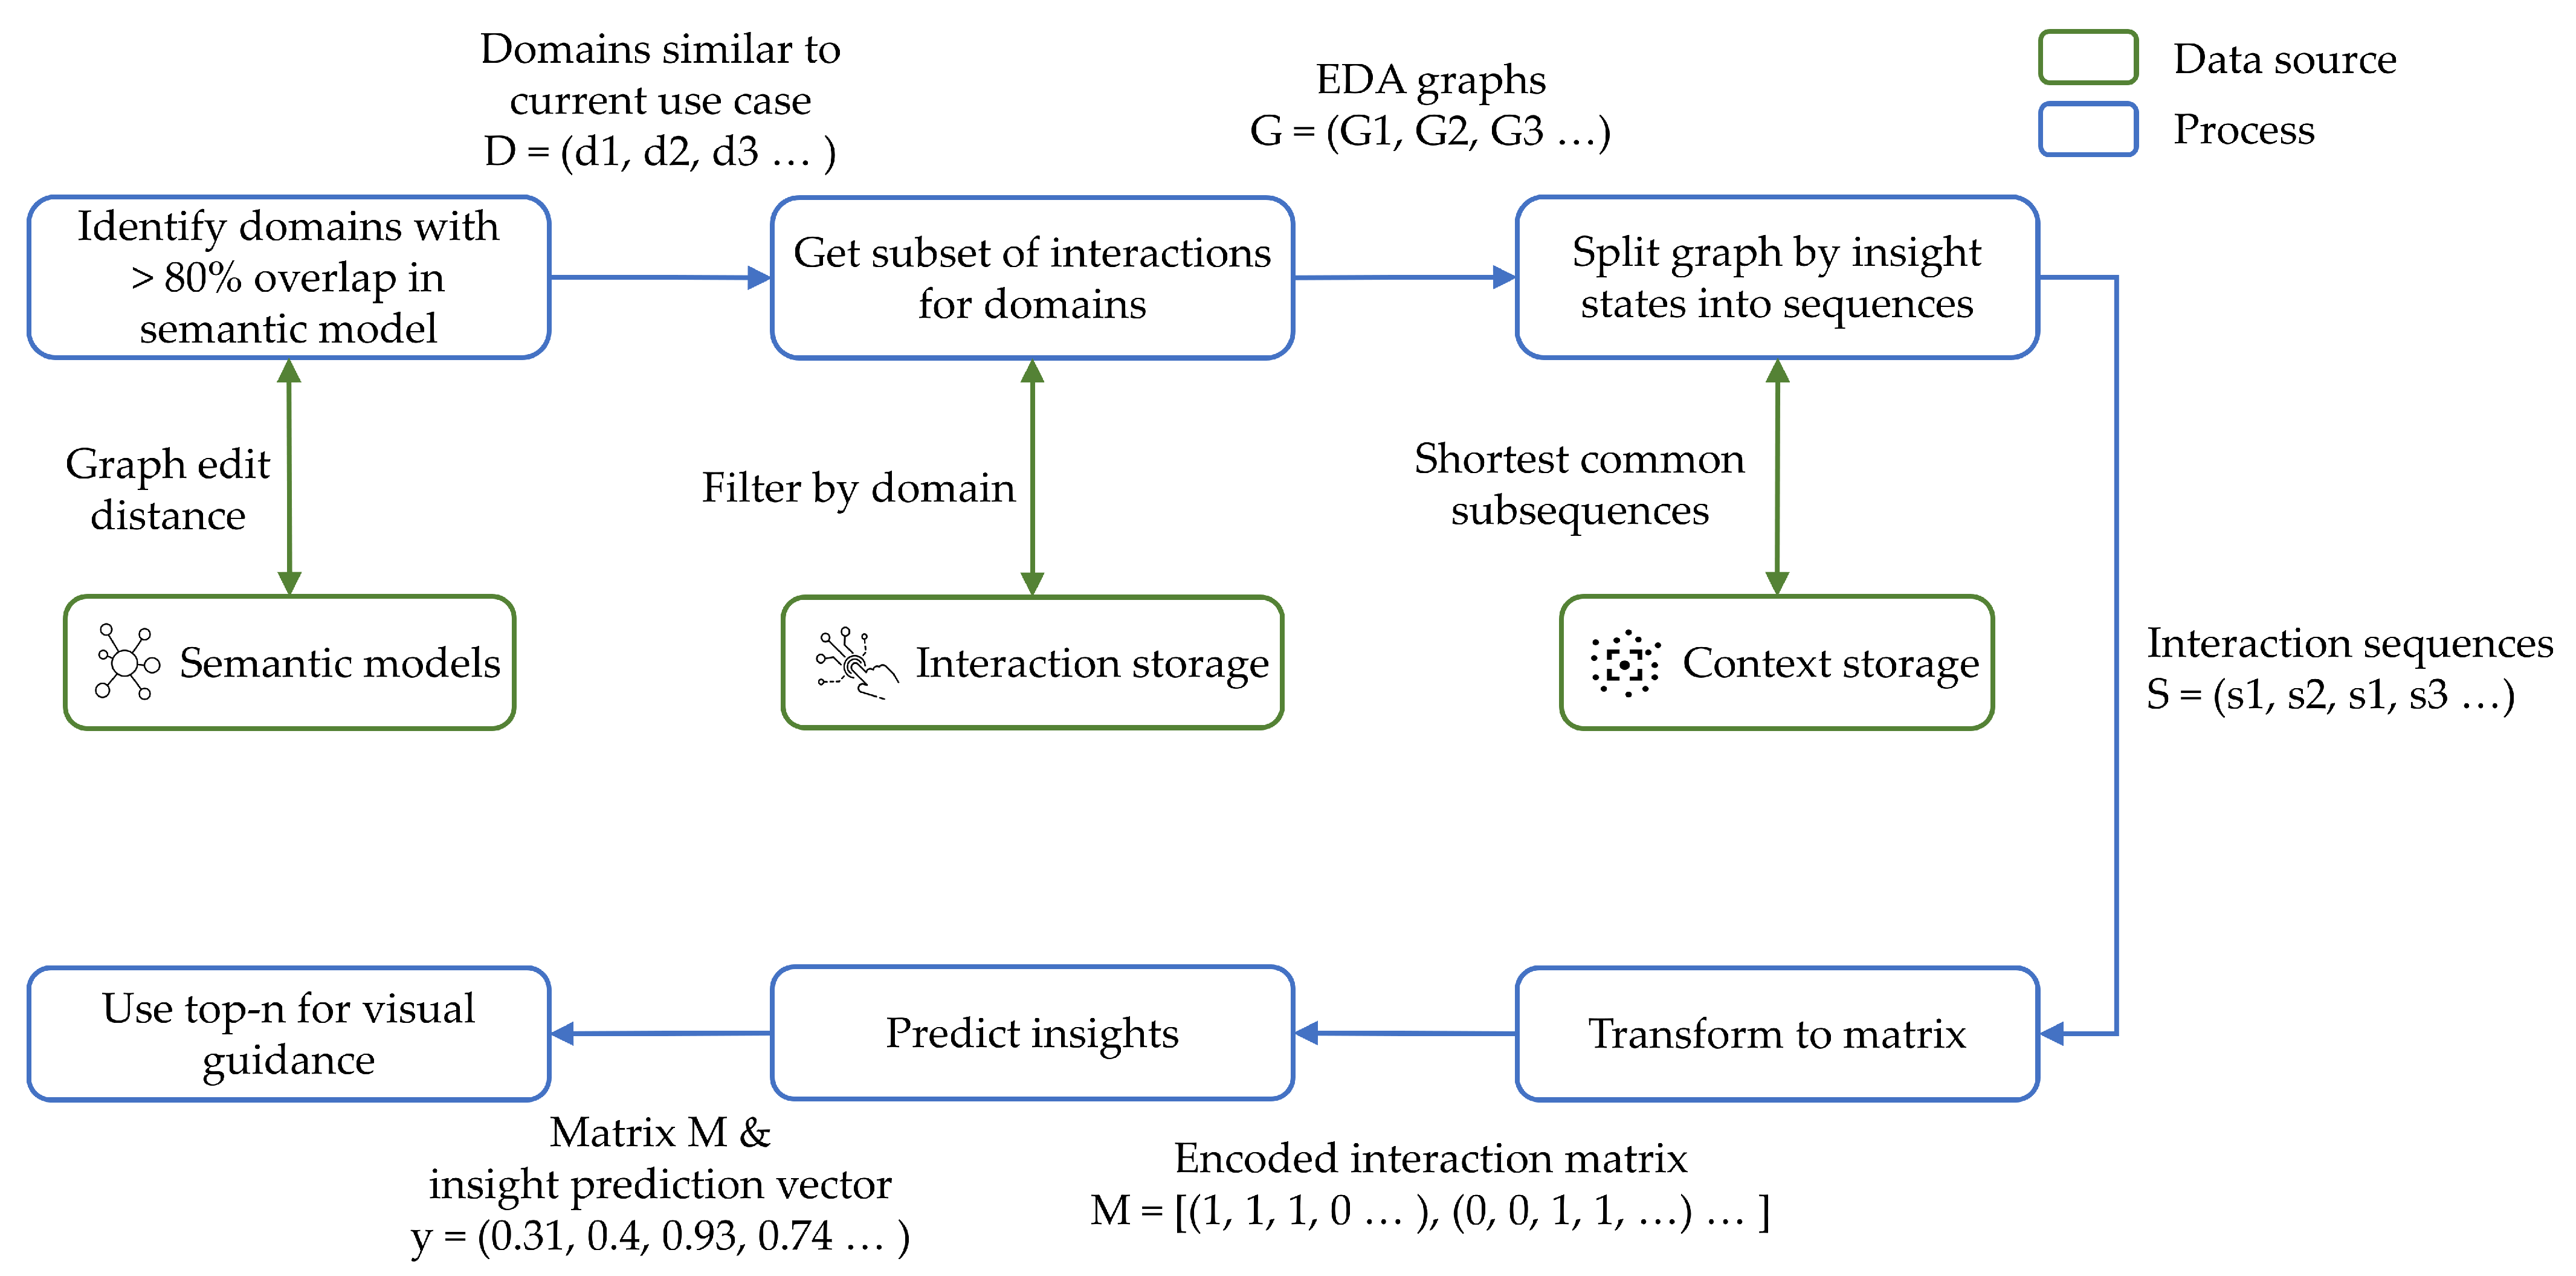
All three, the interaction storage, the context storage and the semantic model, serve together as input data for the visual guidance for domain novices. For new analyses, the guidance system performs three steps: First, it identifies similar existing domains and filters previously stored interactions and contexts based on similarity to the current domain. Second, candidates are derived from the data characteristics and historical interaction data from the interaction storage. The insight prediction implements a machine learning based recommender system. The system is trained on all interaction sequences that end in a state that is put into a final report to indicate insight. Finally, the candidates are ranked by predicted insight from the recommender system. Based on the model, a guidance system highlights certain analysis interaction as part of the visual processing, depending on how much predicted insight would be generated by their execution. Figure 2 shows an overview of the described process and shows the used data sources from components of our system.
Each of the presented abstract system components can be implemented using various approaches and technologies. In the following subsections, we show an example prototype of a concrete implementation of our system design and evaluate the prototype with an exemplary use case.
4.6. Proof of Concept System
We implemented and tested a limited prototype of the presented system design. The tool allows uploading and exploring any valid CSV data files. For semantic modeling and management of the data, we chose the PLASMA open source framework (https://github.com/tmdt-buw/plasma, accessed on 23 March 2021).
PLASMA allows semantic processing of a wide variety of data formats and stores its semantic models in a Neo4j graph data base. Neo4j then again comes with a number of algorithms for graph processing, e.g., to compute graph similarity to identify similar domain graphs [40]. The prototype analyzes the type of each of the dataset’s columns and shows one or multiple columns in suggested visualizations based on the types of data (e.g., pie chart for categorical data).
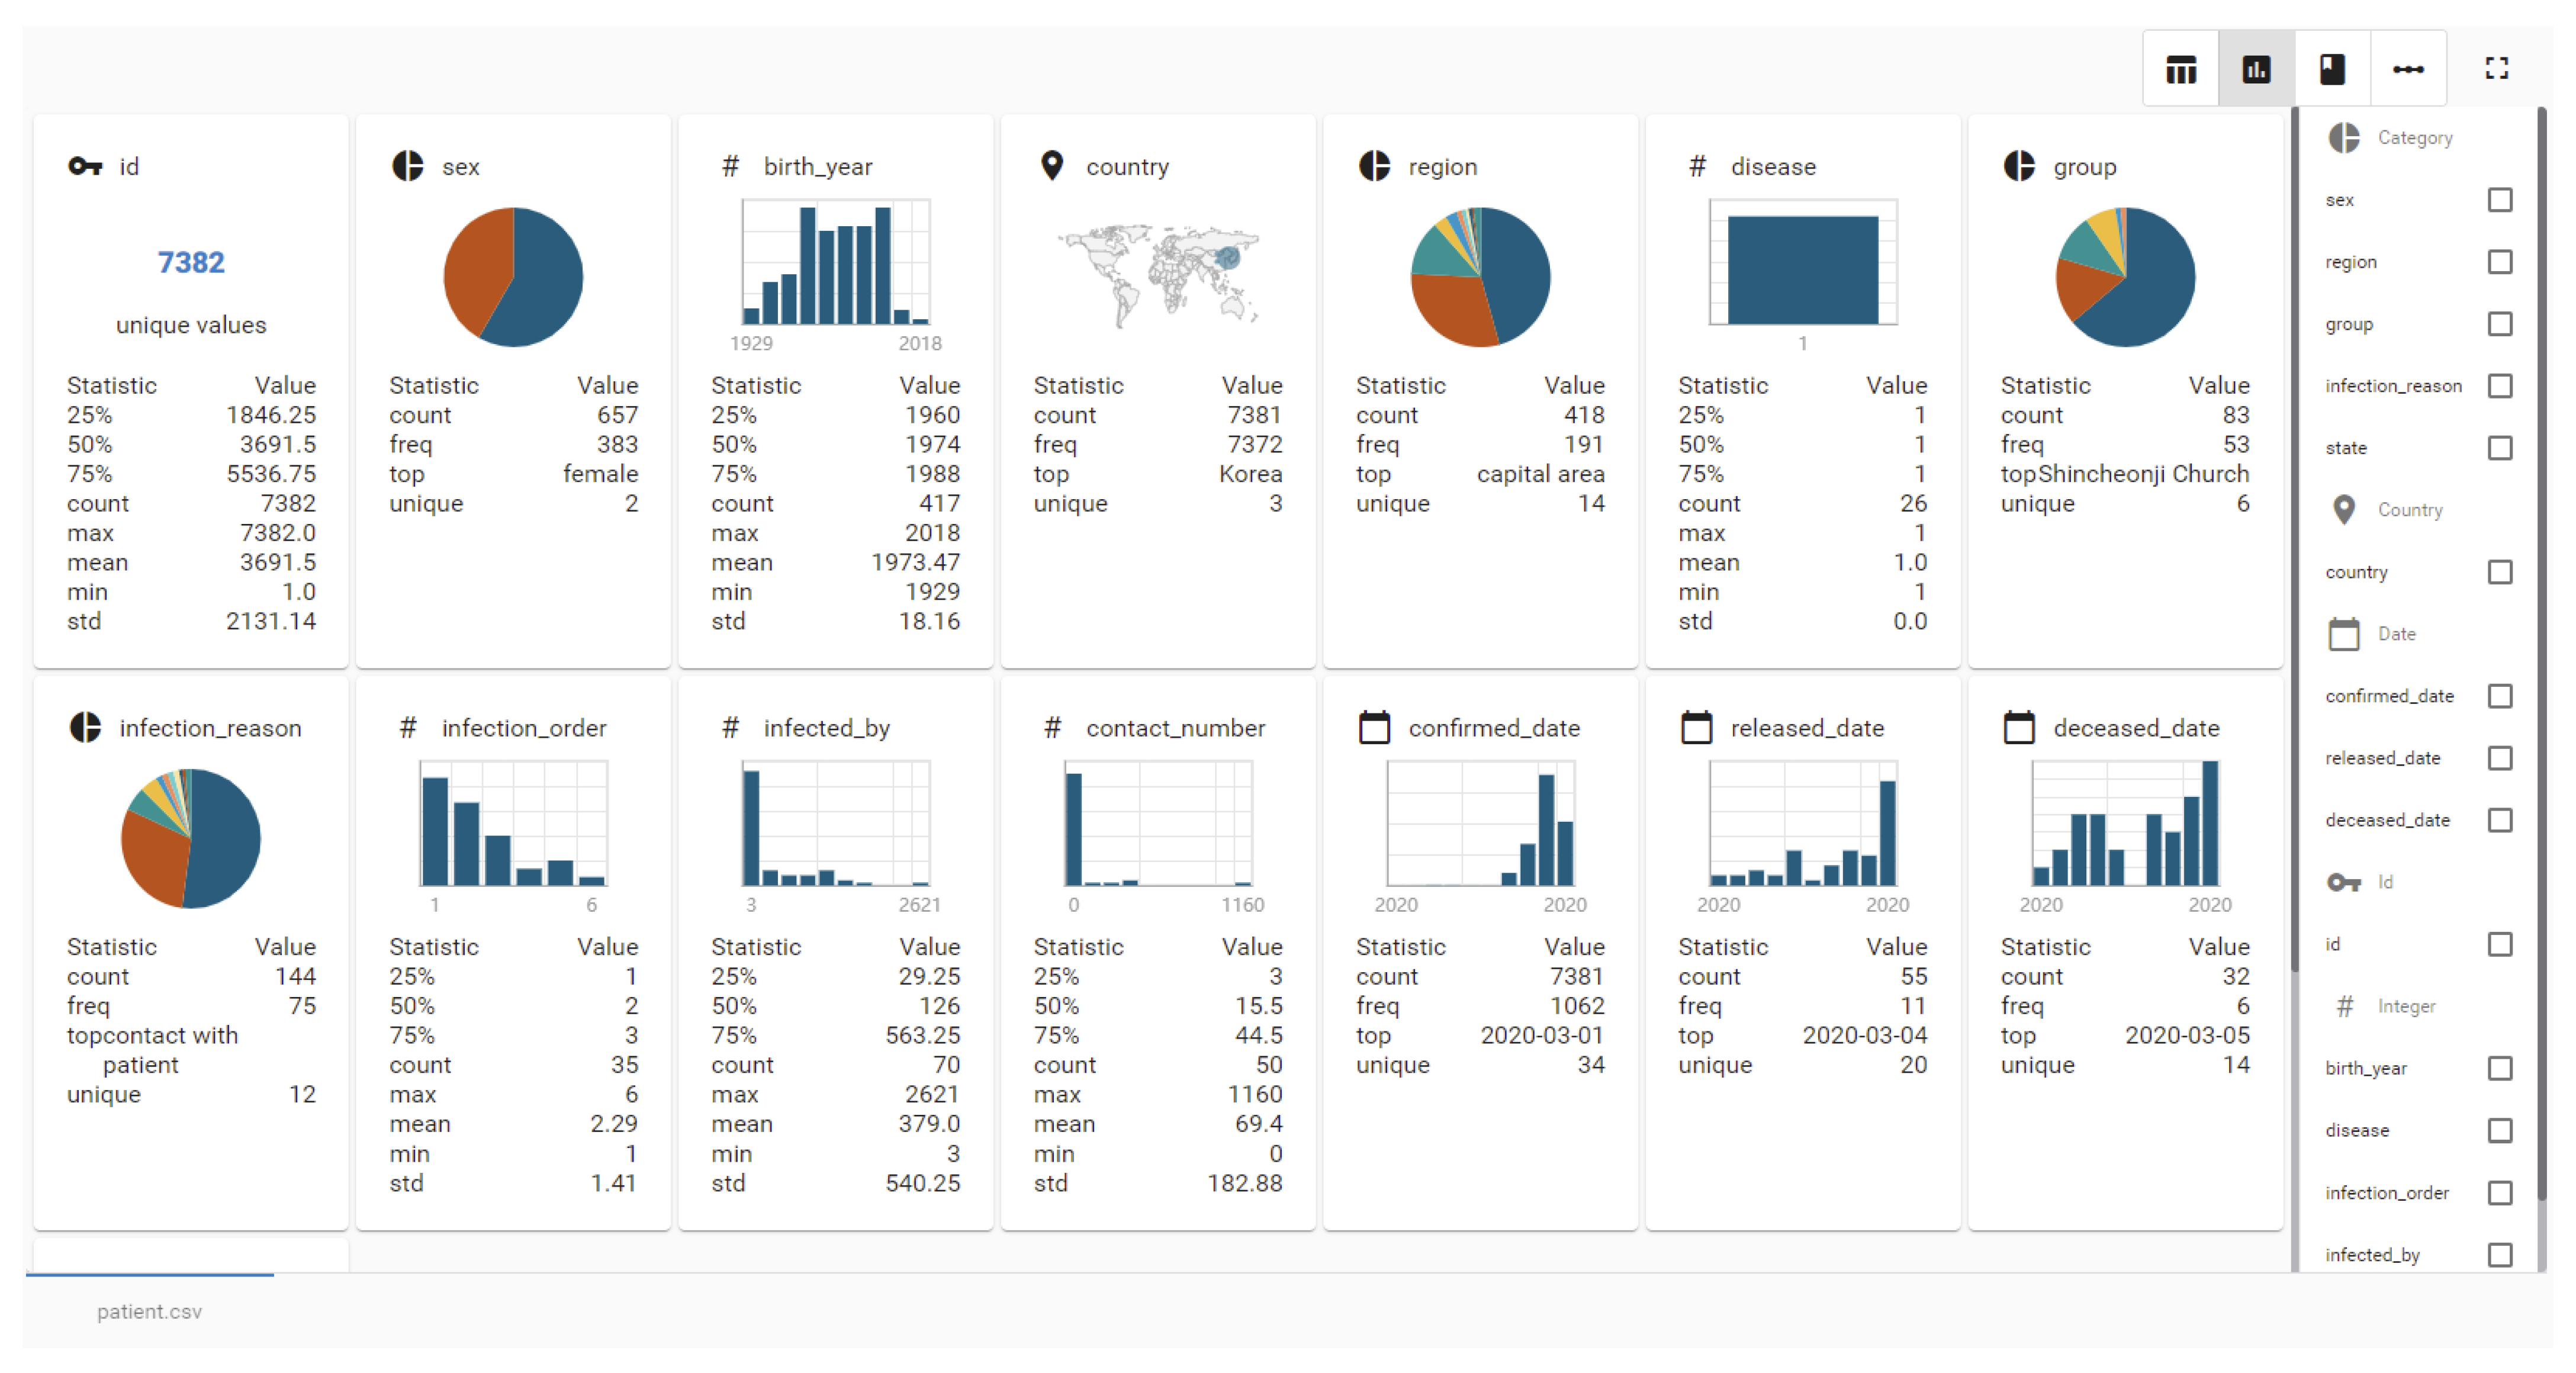
We achieve this by parsing the values contained in the respective columns in a number, location or category. If this is not possible, we assume that the column contains plain strings. Figure 3 shows an overview that the tool presents on initialization of a data exploration visualizing all columns regarding to their data type. For selected features, we show charts according to recommended visualizations by similar VA tools described in Section 3. Numerical values are displayed as histogram or line chart, locations as points on a map and categories as pie charts. Furthermore, the tool allows filtering of viewed data in a legend and display of details for individual data points.
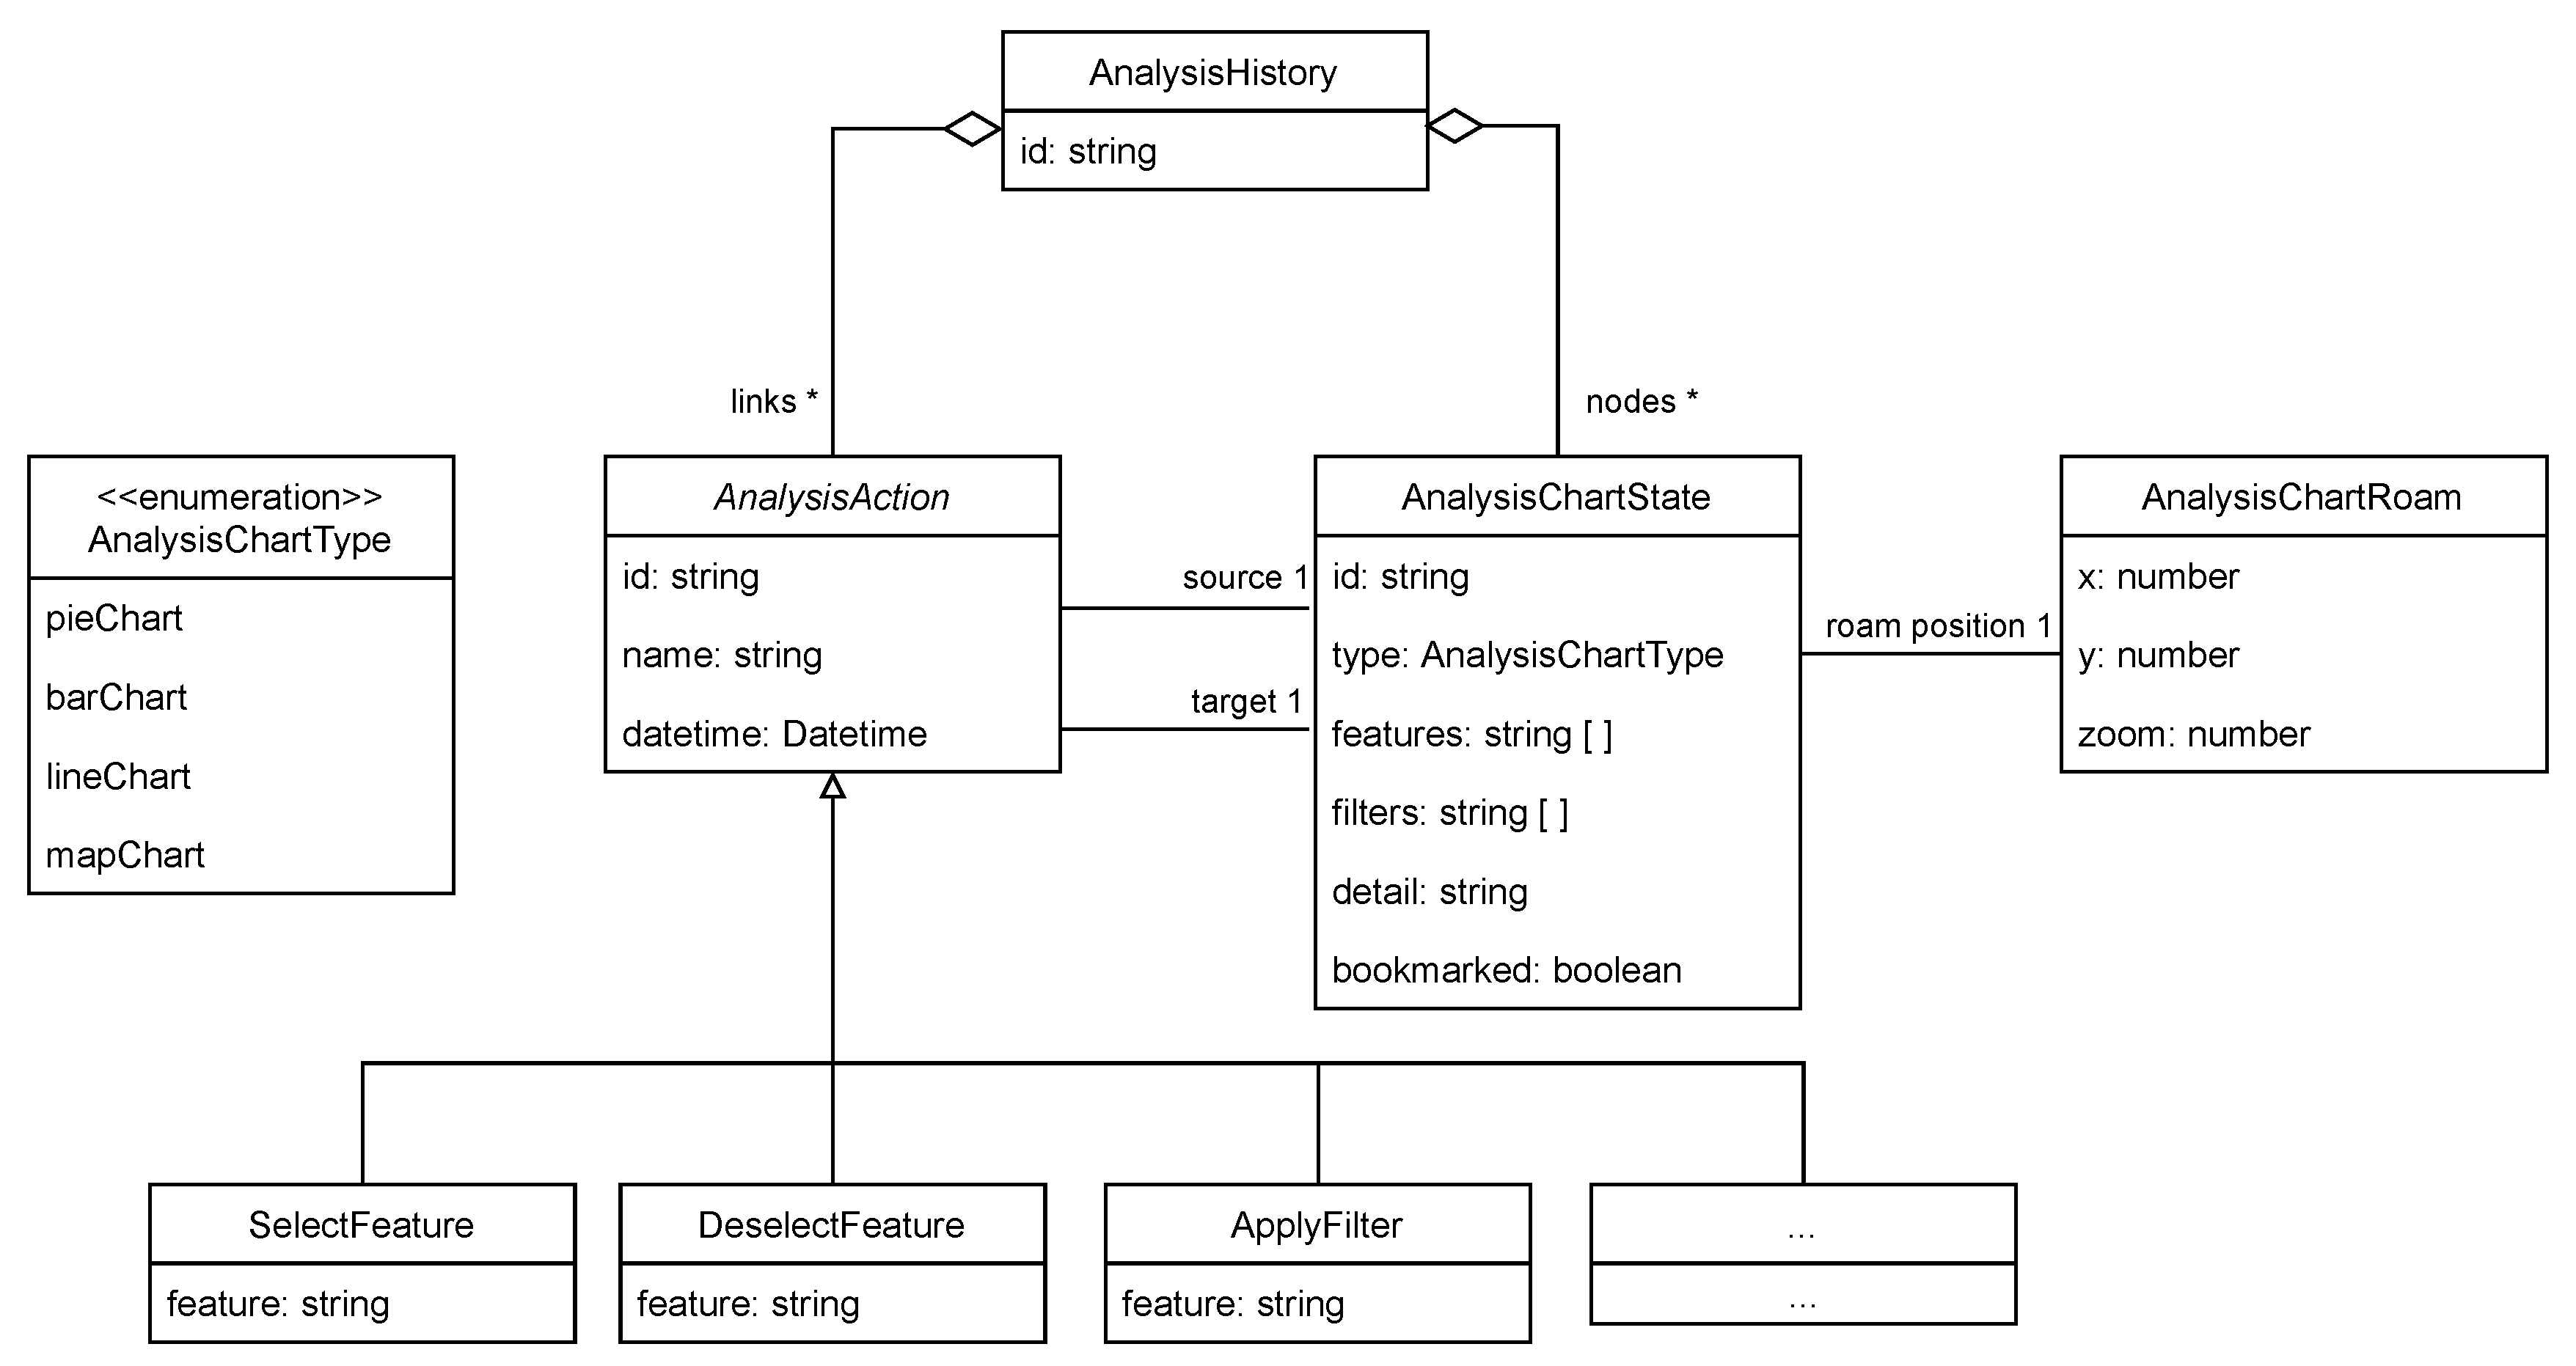
The implementation is based on a Python Flask (https://flask.palletsprojects.com/, accessed on 23 March 2021) application that uses the Anaconda (https://www.anaconda.com/, accessed on 23 March 2021) distribution while the front end is developed as an Angular (https://angular.io/, accessed on 23 March 2021) application that uses the echarts (https://echarts.apache.org/, accessed on 23 March 2021) library for the visualization of charts. Interactions performed during EDA are recorded by the front end and stored in the interaction storage of the back end in a MongoDB (https://www.mongodb.com/, accessed on 23 March 2021). For the implementation (Latest version available at: https://github.com/tmdt-buw/gideon, accessed on 23 March 2021), we chose a graph representation of nodes and links, where nodes describe the current state of the view and links describe analysis actions that are performed on the view to translate it into the next view (e.g., by applying a filter). Figure 4 shows an UML-diagram of the implementation of the described interaction model.
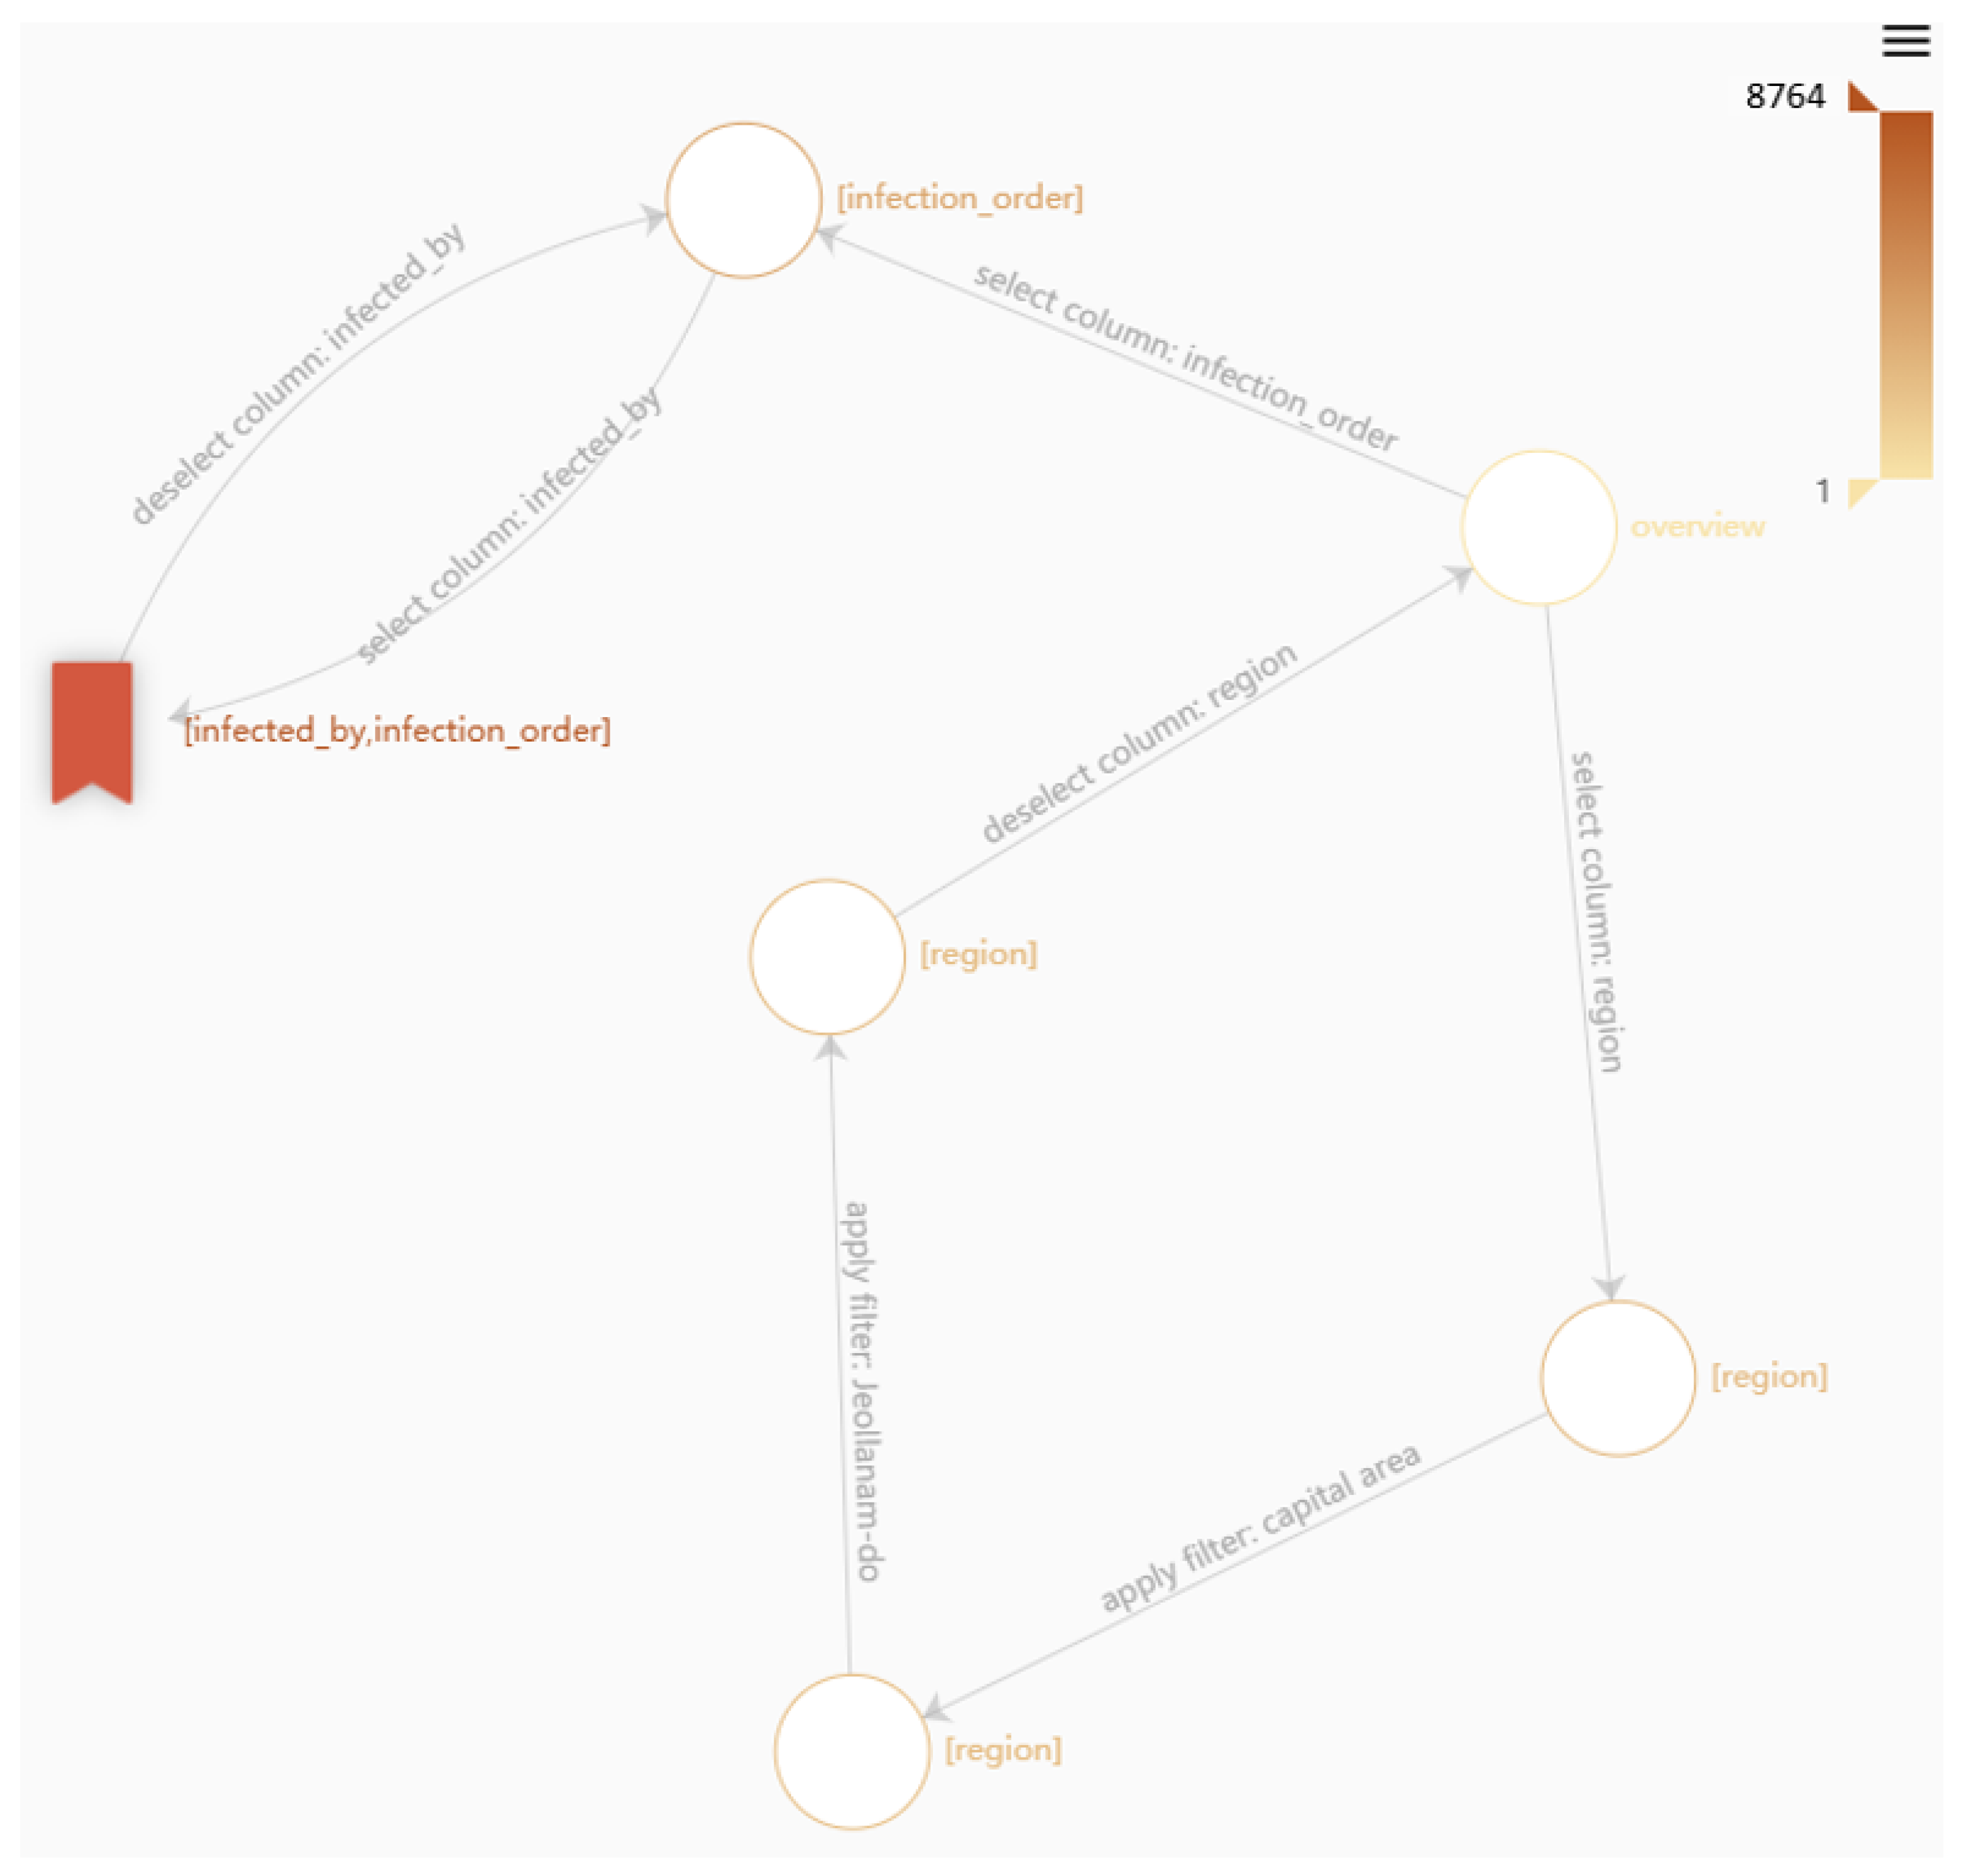
Furthermore, we recorded interactions based on the interaction types described in Section 4.2. Table 1 shows an overview of the actions that are recorded by our system and their corresponding parameters. Meta actions mark the beginning and end of an analysis session. The nodes store the state of the analysis view which contains currently selected features, chosen chart type, filters, roam position on the chart (X-axis position, Y-axis position and zoom level) and hover state of the mouse for recording detail requests on specific data points. It also stores if the data scientist, who is performing the EDA, bookmarked the state for the indication of insight. Links store data about the performed analysis interaction and parameters. We implement some means to visually analyze interaction graphs, e.g., to overlay a heat map for the time spent on views or to show/hide bookmark signs for bookmarked states. Figure 5 shows an example of a resulting analysis interaction graph. Through the visualization, we expect to find interesting insights to the data that we collect and infer some insight on the quality of collected data in future studies.
There is a difference on what makes a data point special depending on the type of data. For categorical data, for example, the distribution of the data to the individual groups is often relevant, whereas trends and outliers often play a role for continuous values. For the insight context storage for an initial implementation, we decided to focus on outlier detection for time series data. Thus, for every bookmarked view, we ran outlier detection on the viewed time series data, and the context storage determines whether the view contains an interesting data point in the form of an outlier.
For the generation of possibly good candidates, we determine statistically relevant common subsequences of sequences that lead to the same bookmarked view in our training dataset. The longest common subsequences problem has undergone research for a long time [41] and we used a standard algorithm for that in Python (https://docs.python.org/3/library/difflib.html, accessed on 23 March 2021). Therefore, for all bookmarked states, we determined the longest common subsequence that leads to the bookmarked state. As a result, we get statically relevant interaction sequences for all bookmarked views.
For our machine learning based insight prediction prototype, we implemented a Multilayer Perceptron (MLP) [42] regression-based recommender system. We chose an MLP because they are a form of neural networks that is easy to implement in contrast to advanced architectures and is therefore a good choice for a first prototype. Since MLPs can only process input data as vectors, we transformed the interaction graphs of our training data into series of sequence input vectors, where each vector represents a sequence of interactions. Each value inside each vector describes a possible state in our exploration view (i.e., selected features, chart type, filters, etc.), where 0 means that the state was not visited by the sequence and 1 that it was visited. We also added a value to include the insight context generated by the context storage, that is, if the final bookmarked view contains an outlier. Finally, we need a target value to which we can fit the MLP. For this we need a measurement value for insight, which is generated by executing the sequence. For this purpose, we summed the number of bookmarks that occurred for the final bookmarked state of each sequence across all training data, i.e., we created a popularity ranking of insightful states, therefore taking the occurrences as a value for the amount of insight that the respective view creates.
Finally, we implemented a visual guidance system based on visual cues used in the HindSight system by Feng et al. [26]. Thus, marking suggested next interactions appear slightly darker and larger. For example, suggesting a filter action would make the region appear slightly darker and larger (e.g., see Figure 6).
4.7. Exemplary Use Case
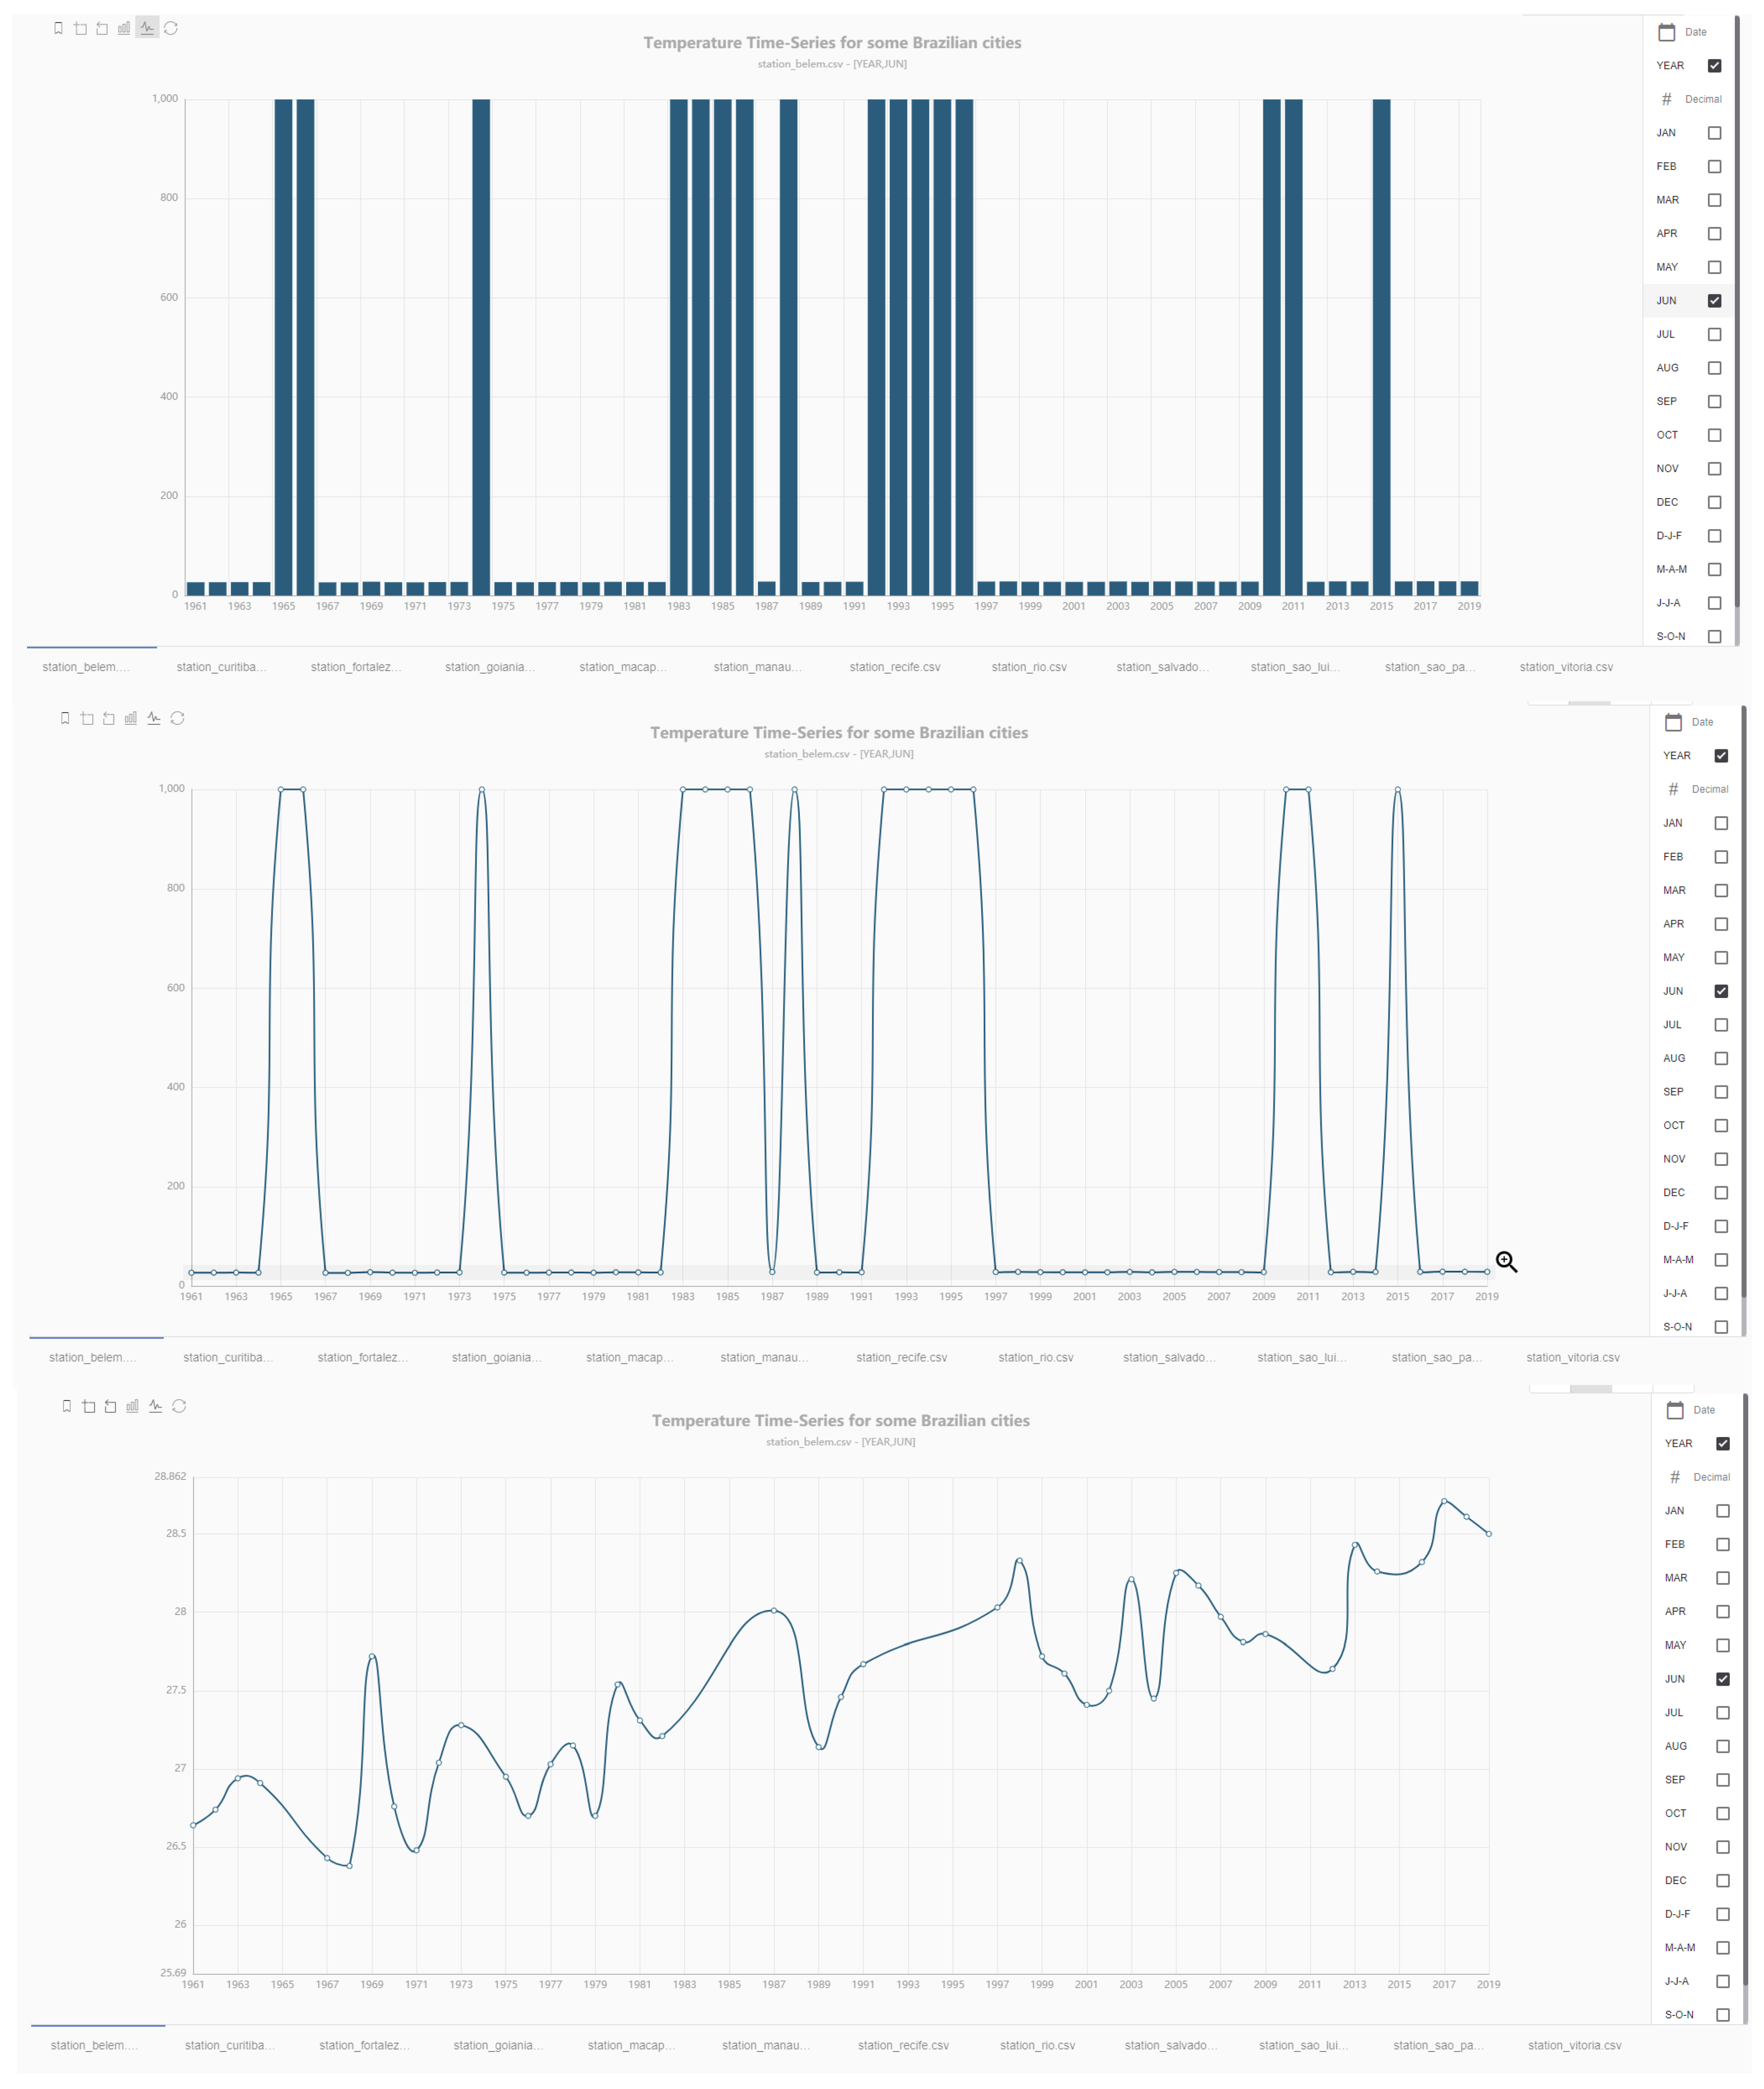
To check the feasibility of our approach and to demonstrate the process, we implemented an exemplary use case by using our prototype to analyze a temperature time series dataset (version 1) available on Kaggle (https://www.kaggle.com/volpatto/temperature-timeseries-for-some-brazilian-cities, accessed on 23 March 2021). The dataset consists of temperature data measured at different stations throughout Brazil from 1961 to 2019. We selected this dataset for an initial validation in order to reduce the effort for data collection and training of the guidance system. Overall, the dataset has few features and a limited action space (i.e., view the temperature data per year or per month over several years). The dataset contains some outlier values (999 °C) that are actually missing values. A typical analysis process of this dataset may be described as follows: A data scientist would visualize the time series data as a line chart to better represent the continuous nature of time series data. Afterwards, the data scientist explores different views of the temperature data over months and years. As a result, he discovers outliers in the data and filters the views accordingly into a smaller value range to be able to see temperature trends in the data. From this pattern, we generated a training dataset of 500 interaction sequences to simulate domain expert interaction graphs for our guidance system. Figure 6 shows an interaction sequence proposed by our system based on the simulated interaction data where the system suggests an exploration sequence similar to the pattern that we identified.
From the exemplary use case, we see that, under the given limitations in terms of action space and domain complexity, it is possible to record user interactions, generate useful candidate sequences and use them for guidance with our prototype implementation. From this, we derive the general feasibility of our system design, whereby the limits of the system for more complex use cases (i.e., larger dataset, domain or larger analysis interaction space) remain an open research question. We assume that for more complex use cases extensive user studies and prototype improvements regarding algorithms for candidate generation and guidance are necessary.
5. Critical Reflection and Research Opportunities
In the following, we discuss the presented system design and prototype by comparing it to current research, highlight key challenges for further research in this area and show the path forward.
Current research of analytic provenance focuses on generating optimized guidance systems based on insights gained from the analysis of recorded user interactions. Since domain knowledge is sometimes complex, this approach could prove to be extremely cumbersome. With recent advances in machine learning methods, technology has become available that allows us to preserve and harness complex knowledge without understanding its dependencies in detail. On the contrary, this provides a new opportunity to explore conserved knowledge by retrospectively examining the trained models to understand the ways in which people approach EDA. The recommendation of an analysis sequence also offers advantages if a data scientist has already found insights by viewing different ways that other analysts have used to find those insights. That will help to better understand what makes a specific data point interesting in its context.
In our prototype, we used a statistical approach to generate interaction sequence candidates and a Multilayer Perceptron (MLP) model to predict the generated insight. When using an MLP model and transforming the training data into vectors, the recurrence of the individual steps is lost. Therefore, it is worth testing and comparing several different deep learning methods for both the generation of good interaction sequence candidates and the accurate prediction of the resulting insight to determine which models perform best for our approach. The difficulty here will be to generate a good complete sequence of interactions, which then leads to deeper insight into the dataset or to predict a next insightful action. We also use a popularity ranking to represent and predict the amount of insight generated by an interaction sequence. While this approach is easy to implement, it causes insights that are very interesting but found by only a few data scientists to be ranked down and thus they will never be used for recommendations. Therefore, more advanced methods will be needed to label interaction sequences by the amount of insight they generate to enable better candidate generation and insight prediction. There are some related areas, such as time series prediction, that also deal with the prediction of several consecutive data points based on historical data. It would also be possible to include direct user feedback in the approach in order to create better models through interactive learning. Zhang et al. [42] gave an overview of how machine learning is used in recommender systems. Transformer networks are often used to predict user actions and generally yield good results, since they are able to keep a memory of historical data. It would be interesting to see how they perform in the context of analytic provenance and user action prediction. While the investigation of the learned machine learning models will lead to new research opportunities afterwards, the transfer between domains to achieve the required amount of training data and the constant quality assurance of the input data will be decisive factors for the successful implementation itself.
Several different analytic provenance approaches already exist. However, these data are not collected in a standardized format and implemented into a specific tool. Therefore, it is currently difficult to reuse such data. Here, the community should strive for a uniform format in order to easily compare recorded interactions and make them reusable in other systems. These provenance data are also widely scattered across domains and use cases. This in turn leads to another challenge, because the number of data per use case or even domain—i.e., the number of exploratory analyses by experts—will probably be high to receive decent results and thus difficult to generate for a single use case. The key to this will be the transfer of recommendations between similar domains and use cases. As an approach to enable this, we included semantic models to determine the similarity between domains and use cases. Semantic models have gained in importance, especially in the area of data integration and retrieval, in order to cope with large amounts of heterogeneous data [38]. It could therefore be possible that in the future semantic models of data will be created during data integration. In this context, the inclusion of further metadata of a dataset could offer potential for improvement in the identification of similar use cases. In the research area of data profiling, tools have been developed to enrich datasets with meta-data that serve for assessment of the quality and characteristics of the given data [43]. Furthermore, semantic models and data profiles [44] could be used to extend our approach in order to also suggest additional relevant data. For example, manufacturing processes can be influenced by the weather. Thus, we could suggest to include weather data if they are indicated by historical use cases of our system. To offer a larger context of a domain, we also plan to add process models to the domain description, for example, to describe how the data and domain model fit into a whole production process.
Interactions should not be interpreted independently, but as a sequence of operations aimed at generating the highest possible amount of insight. However, this is not a purely technical question, since the amount of insight depends strongly on the experience and context of the persons involved. For example, it makes a huge difference what a domain novice needs to learn in a data analysis in contrast to someone who has already worked in this field for some time. Thus, the way a novice must perform an EDA to understand insights will be different from the other person. Therefore, it might be interesting to personalize recommendations and to integrate personal context into the system. Ceneda et al. [45] suggested to determine the knowledge gap of the user and adapt the amount of guidance based on the identified knowledge gap. As a result, a greater variety of visual support will be necessary. A novice might like more visible visual cues while an expert would prefer less visible guidance. As a starting point with each data analysis that generates training data, a qualitative evaluation of the associated EDA should be carried out, for example, by interviewing the expert using a questionnaire. This questionnaire must ensure that the expert has in-depth domain knowledge and assesses the analysis. From the self-assessment, we can deduce, for example, whether there was any deeper knowledge within the data and how difficult it was to derive it.
6. Conclusions and Future Work
The recent advances in machine learning technology offer opportunities for analytic provenance research. While most of the research currently focuses on recording and analyzing user interaction, we introduce a system design that applies machine learning to recorded interactions to guide analysts during the sensemaking process of an EDA. Recorded data include interaction histories of expert users as well as the context of the analysis. From the recorded data, candidate analysis operation sequences are derived that are ranked by their predicted insight. We contribute a prototype system and show the architecture of the presented components. Based on this approach, we discuss core research questions and challenges for further research.
To continue our work, we will collect interaction data from EDAs of a specific use case in the manufacturing domain and evaluate the predictions of the system together with domain experts. After successful evaluation, the interaction dataset can be extended with EDA data from further use cases. However, a quality assurance system will first be developed in the process and implemented in order to maintain the quality of the predictions at a high level in the long term. Furthermore, for the implementation, the visual guidance system will be developed, which adapts the user interface in order to be able to easily carry out further studies in different domains and use cases. A key requirement is to guide the analyst through a series of analysis interactions that, only when executed consecutively, will yield a specific understanding and insight into the dataset. Finally, the most difficult point will be to investigate the transferability between domains and use cases and to train good models for candidate sequences and insight prediction. It will also be shown to what extent this is possible using semantic models. In general, after each use case, we will check how the trained model is structured and how it evolves with the integration of further domains and use cases.
Author Contributions
Conceptualization, T.L.; software, T.L.; and supervision, T.M. All authors have read and agreed to the published version of the manuscript.
Funding
This research received no external funding.
Institutional Review Board Statement
Not applicable.
Informed Consent Statement
Not applicable.
Data Availability Statement
Data available in a publicly accessible repositories. We have provided links in the paper.
Conflicts of Interest
The authors declare no conflict of interest.
Abbreviations
The following abbreviations are used in this manuscript:
| VA | Visual Analytics |
| EDA | Exploratory Data Analysis |
| MLP | Multilayer Perceptron |
References
- Grinstein, G.G. Harnessing the Human in Knowledge Discovery; KDD: Washington, DC, USA, 1996; pp. 384–385. [Google Scholar]
- Dimitriadou, K.; Papaemmanouil, O.; Diao, Y. Explore-by-example: An automatic query steering framework for interactive data exploration. In Proceedings of the 2014 ACM SIGMOD International Conference on Management of Data, Snowbird, UT, USA, 22–27 June 2014; pp. 517–528. [Google Scholar]
- Langer, T.; Meisen, T. Towards Utilizing Domain Expertise for Exploratory Data Analysis. In Proceedings of the 12th International Symposium on Visual Information Communication and Interaction, Shanghai, China, 23–25 September 2019; Association for Computing Machinery: New York, NY, USA, 2019. [Google Scholar]
- Milo, T.; Somech, A. Next-step suggestions for modern interactive data analysis platforms. In Proceedings of the 24th ACM SIGKDD International Conference on Knowledge Discovery & Data Mining, London, UK, 19–23 August 2018; pp. 576–585. [Google Scholar]
- Wasay, A.; Athanassoulis, M.; Idreos, S. Queriosity: Automated Data Exploration. In Proceedings of the 2015 IEEE International Congress on Big Data, Santa Clara, CA, USA, 29 October–1 November 2015; pp. 716–719. [Google Scholar]
- El, O.B.; Milo, T.; Somech, A. Towards Autonomous, Hands-Free Data Exploration; CIDR: Klagenfurt, Germany, 2020. [Google Scholar]
- McCue, C. Chapter 2—Domain Expertise. In Data Mining and Predictive Analysis, 2nd ed.; McCue, C., Ed.; Butterworth-Heinemann: Boston, MA, USA, 2015; pp. 25–30. [Google Scholar]
- Sacha, D.; Stoffel, A.; Stoffel, F.; Kwon, B.C.; Ellis, G.; Keim, D.A. Knowledge generation model for visual analytics. IEEE Trans. Vis. Comput. Graph. 2014, 20, 1604–1613. [Google Scholar] [CrossRef]
- Insight. In Cambridge Dictionary; Cambridge University Press: New York, NY, USA, 2020.
- Microsoft. Power BI. Available online: https://powerbi.microsoft.com/ (accessed on 10 August 2020).
- Tableau Software. Tableau. Available online: https://www.tableau.com/ (accessed on 10 August 2020).
- QlikTech. Qlik. Available online: https://www.qlik.com/ (accessed on 10 August 2020).
- Behrisch, M.; Streeb, D.; Stoffel, F.; Seebacher, D.; Matejek, B.; Weber, S.H.; Mittelstaedt, S.; Pfister, H.; Keim, D. Commercial visual analytics systems-advances in the big data analytics field. IEEE Trans. Vis. Comput. Graph. 2018, 25, 3011–3031. [Google Scholar] [CrossRef] [Green Version]
- Batch, A.; Elmqvist, N. The Interactive Visualization Gap in Initial Exploratory Data Analysis. IEEE Trans. Vis. Comput. Graph. 2018, 24, 278–287. [Google Scholar] [CrossRef]
- Wongsuphasawat, K.; Moritz, D.; Anand, A.; Mackinlay, J.; Howe, B.; Heer, J. Voyager: Exploratory analysis via faceted browsing of visualization recommendations. IEEE Trans. Vis. Comput. Graph. 2015, 22, 649–658. [Google Scholar] [CrossRef] [PubMed]
- Demiralp, Ç.; Haas, P.J.; Parthasarathy, S.; Pedapati, T. Foresight: Recommending visual insights. arXiv 2017, arXiv:1707.03877. [Google Scholar] [CrossRef]
- Tang, B.; Han, S.; Yiu, M.L.; Ding, R.; Zhang, D. Extracting Top-K Insights from Multi-Dimensional Data. In Proceedings of the 2017 ACM International Conference on Management of Data, Chicago, IL, USA, 14–19 May 2017; Association for Computing Machinery: New York, NY, USA, 2017; pp. 1509–1524. [Google Scholar]
- Vartak, M.; Rahman, S.; Madden, S.; Parameswaran, A.; Polyzotis, N. SeeDB: Efficient Data-driven Visualization Recommendations to Support Visual Analytics. In Proceedings of the 41th International Conference on Very Large Data Bases (VLDB) Endowment, Waikoloa, HI, USA, 31 August–4 September 2015; pp. 2182–2193. [Google Scholar]
- Srinivasan, A.; Drucker, S.M.; Endert, A.; Stasko, J. Augmenting visualizations with interactive data facts to facilitate interpretation and communication. IEEE Trans. Vis. Comput. Graph. 2018, 25, 672–681. [Google Scholar] [CrossRef] [PubMed]
- Eirinaki, M.; Abraham, S.; Polyzotis, N.; Shaikh, N. Querie: Collaborative database exploration. IEEE Trans. Knowl. Data Eng. 2013, 26, 1778–1790. [Google Scholar] [CrossRef]
- Dimitriadou, K.; Papaemmanouil, O.; Diao, Y. AIDE: An active learning-based approach for interactive data exploration. IEEE Trans. Knowl. Data Eng. 2016, 28, 2842–2856. [Google Scholar] [CrossRef]
- Huang, E.; Peng, L.; Palma, L.D.; Abdelkafi, A.; Liu, A.; Diao, Y. Optimization for Active Learning-Based Interactive Database Exploration. In Proceedings of the 44th International Conference on Very Large Data Bases (VLDB) Endowment, Rio de Janeiro, Brazil, 9 May 2018; pp. 71–84. [Google Scholar]
- Qu, Y.; Furnas, G.W. Model-driven Formative Evaluation of Exploratory Search: A Study Under a Sensemaking Framework. Inf. Process. Manag. 2008, 44, 534–555. [Google Scholar] [CrossRef]
- Mohseni, S.; Pena, A.M.; Ragan, E.D. ProvThreads: Analytic Provenance Visualization and Segmentation. arXiv 2018, arXiv:1801.05469. [Google Scholar]
- Endert, A.; Fiaux, P.; North, C. Semantic interaction for sensemaking: Inferring analytical reasoning for model steering. IEEE Trans. Vis. Comput. Graph. 2012, 18, 2879–2888. [Google Scholar] [CrossRef] [Green Version]
- Feng, M.; Deng, C.; Peck, E.M.; Harrison, L. HindSight: Encouraging Exploration through Direct Encoding of Personal Interaction History. IEEE Trans. Vis. Comput. Graph. 2017, 23, 351–360. [Google Scholar] [CrossRef]
- Gotz, D.; When, Z.; Lu, J.; Kissa, P.; Cao, N.; Qian, W.H.; Liu, S.X.; Zhou, M.X. HARVEST: An intelligent visual analytic tool for the masses. In Proceedings of the 1st International Workshop on Intelligent Visual Interfaces for Text Analysis, Hong Kong, China, 22–26 February 2010; pp. 1–4. [Google Scholar]
- Camisetty, A.; Chandurkar, C.; Sun, M.; Koop, D. Enhancing Web-based Analytics Applications through Provenance. IEEE Trans. Vis. Comput. Graph. 2019. [Google Scholar] [CrossRef]
- Nguyen, P.H.; Xu, K.; Wheat, A.; Wong, B.W.; Attfield, S.; Fields, B. Sensepath: Understanding the sensemaking process through analytic provenance. IEEE Trans. Vis. Comput. Graph. 2015, 22, 41–50. [Google Scholar] [CrossRef] [PubMed] [Green Version]
- Brown, E.T.; Yarlagadda, S.; Cook, K.A.; Chang, R.; Endert, A. Modelspace: Visualizing the trails of data models in visual analytics systems. In Proceedings of the Machine Learning from User Interaction for Visualization and Analytics Workshop at IEEE VIS, Paris, France, 22 October 2018. [Google Scholar]
- Boukhelifa, N.; Bezerianos, A.; Trelea, I.C.; Perrot, N.M.; Lutton, E. An exploratory study on visual exploration of model simulations by multiple types of experts. In Proceedings of the 2019 CHI Conference on Human Factors in Computing Systems, Scotland, UK, 4–9 May 2019; pp. 1–14. [Google Scholar]
- Barczewski, A.; Bezerianos, A.; Boukhelifa, N. How Domain Experts Structure Their Exploratory Data Analysis: Towards a Machine-Learned Storyline. In Proceedings of the 2020 CHI Conference on Human Factors in Computing Systems, Honolulu, HI, USA, 25–30 April 2020; pp. 1–8. [Google Scholar]
- Caruccio, L.; Deufemia, V.; Polese, G. Understanding user intent on the web through interaction mining. J. Vis. Lang. Comput. 2015, 31, 230–236. [Google Scholar] [CrossRef]
- Ricci, F.; Rokach, L.; Shapira, B. Introduction to recommender systems handbook. In Recommender Systems Handbook; Springer: New York, NY, USA, 2011; pp. 1–35. [Google Scholar]
- Jannach, D.; Zanker, M.; Felfernig, A.; Friedrich, G. Recommender Systems: An Introduction; Cambridge University Press: New York, NY, USA, 2010. [Google Scholar]
- Covington, P.; Adams, J.; Sargin, E. Deep neural networks for youtube recommendations. In Proceedings of the 10th ACM Conference on Recommender Systems, Boston, MA, USA, 15–19 September 2016; pp. 191–198. [Google Scholar]
- Chirigati, F.; Doraiswamy, H.; Damoulas, T.; Freire, J. Data Polygamy: The Many-Many Relationships Among Urban Spatio-Temporal Data Sets. In Proceedings of the 2016 International Conference on Management of Data, San Francisco, CA, USA, 26 June–1 July 2016; ACM: New York, NY, USA, 2016; pp. 1011–1025. [Google Scholar]
- Pomp, A.; Paulus, A.; Jeschke, S.; Meisen, T. Enabling Semantics in Enterprises. In Proceedings of the International Conference on Enterprise Information Systems, Porto, Portugal, 26–29 April 2017; Springer: New York, NY, USA, 2017; pp. 428–450. [Google Scholar]
- Zhang, K.; Shasha, D. Simple fast algorithms for the editing distance between trees and related problems. SIAM J. Comput. 1989, 18, 1245–1262. [Google Scholar] [CrossRef]
- Needham, M.; Hodler, A.E. Graph Algorithms: Practical Examples in Apache Spark and Neo4j; O’Reilly Media, Inc.: Sebastopol, CA, USA, 2019; p. 256. [Google Scholar]
- Hirschberg, D.S. Algorithms for the longest common subsequence problem. J. ACM 1977, 24, 664–675. [Google Scholar] [CrossRef] [Green Version]
- Zhang, S.; Yao, L.; Sun, A.; Tay, Y. Deep learning based recommender system: A survey and new perspectives. ACM Comput. Surv. 2019, 52, 1–38. [Google Scholar] [CrossRef] [Green Version]
- Abedjan, Z.; Golab, L.; Naumann, F. Profiling relational data: A survey. VLDB J. 2015, 24, 557–581. [Google Scholar] [CrossRef] [Green Version]
- Po, L.; Bikakis, N.; Desimoni, F.; Papastefanatos, G. Linked Data Visualization: Techniques, Tools, and Big Data. Synth. Lect. Semant. Web Theory Technol. 2020, 10, 1–157. [Google Scholar] [CrossRef] [Green Version]
- Ceneda, D.; Gschwandtner, T.; May, T.; Miksch, S.; Schulz, H.; Streit, M.; Tominski, C. Characterizing Guidance in Visual Analytics. IEEE Trans. Vis. Comput. Graph. 2017, 23, 111–120. [Google Scholar] [CrossRef] [PubMed]
Figure 1.
Overview of our system design.

Figure 2.
Process (blue) overview of the recommendation system and associated data sources (system components) (green).
Figure 2.
Process (blue) overview of the recommendation system and associated data sources (system components) (green).

Figure 3.
The initial view of the EDA tool presents an overview of all columns with the detected type and a chart suitable for visualization of the type. The right side allows selecting features for more specific exploration.
Figure 3.
The initial view of the EDA tool presents an overview of all columns with the detected type and a chart suitable for visualization of the type. The right side allows selecting features for more specific exploration.

Figure 4.
UML diagram of the implementation of our interaction model.

Figure 5.
An example of an interaction graph that is stored in the interaction storage from the results of an EDA. The initial meta state is filtered out, since the graph only contains one session. Each node describes the state of the presented visualization (chart type, selected features, filters, etc.). Each link describes an analysis action (e.g., select a feature). Bookmarks were created by the data scientist and mark the corresponding view as containing some form of insight. A heat-map overlay shows time spent exploring the particular view.

Figure 6.
For the exemplary time series dataset of temperatures measured in Brazil, our system initially creates a basic histogram. Then, it advises to change the chart type to line chart (button at top left corner) and, finally, to apply a zoom in to a specific value range of the data (Y-axis: 25.6–28.8) which filters the outliers. The final view shows a visible raise in temperature over the years.


Table 1.
Set of interactions to be recorded by the interaction storage of our prototype implementation.
Table 1.
Set of interactions to be recorded by the interaction storage of our prototype implementation.
| Action Type | Interaction | Parameters | Description |
|---|---|---|---|
| Meta | Initial | Marks the beginning of a new analysis session. | |
| End session | Marks the end of the current analysis session. | ||
| Analysis | Select feature | Feature | A request to add a feature to the visualization. |
| Deselect feature | Feature | A request to remove a feature from the visualization. | |
| Select chart type | Chart type | Request to visualize selected data with given chart type. | |
| Apply filter | Feature, filter range | A request to reduce the data of a feature to a given filter range. | |
| Remove filter | Feature, filter | A request to remove filter range for given feature. | |
| Roam | Roam range (x, y, zoom) | Request to change view to given x and y coordinates, and zoom in to given zoom level. | |
| Details | Data point | Request to view the details for a selected data point. | |
| Insight | Add view to final report | A request to add the current view to the final report to indicate that the user has reached a milestone on the exploration path. |
Publisher’s Note: MDPI stays neutral with regard to jurisdictional claims in published maps and institutional affiliations. |
© 2021 by the authors. Licensee MDPI, Basel, Switzerland. This article is an open access article distributed under the terms and conditions of the Creative Commons Attribution (CC BY) license (http://creativecommons.org/licenses/by/4.0/).
Share and Cite
MDPI and ACS Style
Langer, T.; Meisen, T. System Design to Utilize Domain Expertise for Visual Exploratory Data Analysis. Information 2021, 12, 140. https://doi.org/10.3390/info12040140
AMA Style
Langer T, Meisen T. System Design to Utilize Domain Expertise for Visual Exploratory Data Analysis. Information. 2021; 12(4):140. https://doi.org/10.3390/info12040140
Chicago/Turabian StyleLanger, Tristan, and Tobias Meisen. 2021. "System Design to Utilize Domain Expertise for Visual Exploratory Data Analysis" Information 12, no. 4: 140. https://doi.org/10.3390/info12040140
Note that from the first issue of 2016, this journal uses article numbers instead of page numbers. See further details here.