The Usefulness of Imperfect Speech Data for ASR Development in Low-Resource Languages

1
Human Technologies Research Group, CSIR Next Generation Enterprises and Institutions Cluster, P.O. Box 395, Pretoria 0001, South Africa
2
Department of Electrical & Electronic Engineering, Stellenbosch University, Private Bag X1, Stellenbosch 7602, South Africa
*
Author to whom correspondence should be addressed.
†
These authors contributed equally to this work.
Information 2019, 10(9), 268; https://doi.org/10.3390/info10090268
Submission received: 29 June 2019
/
Revised: 29 July 2019
/
Accepted: 8 August 2019
/
Published: 28 August 2019
(This article belongs to the Special Issue Computational Linguistics for Low-Resource Languages)
Abstract
:When the National Centre for Human Language Technology (NCHLT) Speech corpus was released, it created various opportunities for speech technology development in the 11 official, but critically under-resourced, languages of South Africa. Since then, the substantial improvements in acoustic modeling that deep architectures achieved for well-resourced languages ushered in a new data requirement: their development requires hundreds of hours of speech. A suitable strategy for the enlargement of speech resources for the South African languages is therefore required. The first possibility was to look for data that has already been collected but has not been included in an existing corpus. Additional data was collected during the NCHLT project that was not included in the official corpus: it only contains a curated, but limited subset of the data. In this paper, we first analyze the additional resources that could be harvested from the auxiliary NCHLT data. We also measure the effect of this data on acoustic modeling. The analysis incorporates recent factorized time-delay neural networks (TDNN-F). These models significantly reduce phone error rates for all languages. In addition, data augmentation and cross-corpus validation experiments for a number of the datasets illustrate the utility of the auxiliary NCHLT data.
1. Introduction
The development of language and speech technology requires substantial amounts of appropriate data. While huge volumes of text and speech data are available in some languages, others have very little with which to work. Languages in the first category are commonly referred to as “highly resourced”, while those in the second category are known as “under-resourced” (low-resourced languages do have sufficient data for initial model development). The work we report on in this paper is part of an ongoing effort to enlarge the resources that are available for technology development in South Africa’s 11 official languages (three letter ISO codes in brackets): Afrikaans (Afr), South African English (Eng), isiNdebele (Nbl), isiXhosa (Xho), isiZulu (Zul), Sepedi (Nso), Sesotho (Sot), Setswana (Tsn), Siswati (Ssw), Tshivenda (Ven), and Xitsonga (Tso).
Work in this area has been supported by the South African government for a number of years. Initial projects were funded by the Department of Arts, Culture, Science and Technology (DACST) and subsequently by the Departments of Arts and Culture (DAC) and Science and Technology (DST), respectively, after the two departments became separate entities. For instance, the African Speech Technology (AST) project [1] was supported by DACST, while DAC funded projects like Lwazi [2,3] and the National Centre for Human Language Technology (NCHLT) speech [4,5] and text [6] projects. The recently-established South African Centre for Digital Language Resources (https://www.sadilar.org/) (SADiLaR) is funded by DST.
Various strategies have been proposed to collect speech and text resources for technology development, for example harvesting existing data like broadcast news and online publications, crowd-sourcing, web crawling, dedicated data collection campaigns, etcetera [7,8,9,10,11,12,13]. Both data types are required for language and speech technology development, and constructing comprehensive text corpora is just as important as creating speech resources. However, the work we report on here mainly concerns speech data.
One of the most efficient ways to collect vast volumes of speech data is by means of speech applications like voice search, where input speech is captured and used to improve system performance [14]. Other strategies that have been proven to be successful include crowd sourcing and transcribing or translating existing resources.
In the absence of these possibilities, dedicated data collection campaigns can be used to collect representative samples of languages in their spoken form. In South Africa, the AST, Lwazi, and the first NCHLT project relied on data collection to create speech resources for the indigenous languages. During the Lwazi project, telephone speech was collected (between four and ten hours per language [2]), while the aim of the first NCHLT project was to collect 50–60 h of orthographically-transcribed, broadband speech in each of the country’s 11 official languages [4].
2. Background
Honest researchers and field workers can affirm that, despite careful design, meticulous planning, and continuous monitoring of execution, data collection does not always happen the way it should. No matter how carefully one goes about it, there always seems to be errors of one kind or another in the collected data [15,16,17]. Unforeseen challenges or delays in data collection could be due to issues related to the means of collection (e.g., telephone lines are out of order on the day that collection was planned to start), logistics (e.g., the bus that was supposed to bring volunteers to a suitable location broke down on the way), the attitude or literacy levels of potential participants, and so forth. The NCHLT speech project was no exception in this regard, and despite the fact that the project was successfully executed, not everything went exactly as planned.
During the project speech, data was collected using a smartphone application [11]. The initial version of the app used a prompt counter to select a unique subset of prompts for each recording session. However, this value was stored in memory and was sometimes accidentally reset as fieldworkers cleared recording devices. This resulted in some subsets of the data being recorded multiple times while other subsets were never selected. The app was subsequently updated to support random selection of prompts from the larger vocabulary, and additional, more diverse data was collected in some languages. To meet the project specifications, the majority of the repeated prompts were excluded from the subset of the data that was released as the NCHLT Speech corpus.
It is often said that “there is no data like more data”, and given the modeling capabilities of some recent acoustic modeling techniques, the question arose whether the data that was excluded from the official NCHLT corpus could be used to improve modeling accuracy. In this paper, we therefore investigate the potential of the additional or auxiliary data to improve acoustic models of the languages involved, given current best practices.
While the results of many studies seem to confirm that “there really is no data like more data”, the “garbage in, garbage out” principle also holds: using poor quality data will result in poor models, no matter how much of it is available. Poor models will ultimately yield poor results. One of the aims of our investigation was thus to quantify, to some extent, the quality of the utterances in the auxiliary datasets and to exclude potential “garbage” from the pool of additional data.
Basic verification steps were included in the NCHLT data collection protocol to identify corrupt and/or empty files. In the current study, we also used forced alignment to identify recordings that did not match their prompts. A phone string corresponding to the expected pronunciation of each prompt was generated, and if a forced alignment between the phone string and the actual acoustics failed, the utterance was not included in the auxiliary data. For the remaining prompts, we used a phone-based dynamic programming (PDP) scoring technique [18,19] to quantify the degree of acoustic match between the expected and produced pronunciations of each prompt and to rank them accordingly. Consequently, transcription errors or bad acoustic recording conditions could be filtered out based on an utterance level measure.
Baseline automatic speech recognition (ASR) results for both the Hidden Markov Model Toolkit (HTK) [20] and Kaldi [21] toolkits were published when the NCHLT Speech corpus was released. The Kaldi implementation of Subspace Gaussian Mixture Models (SGMMs) yielded the best results [4]. Subsequent experiments using one of the languages (Xho) showed that substantial gains can be achieved over the initial baseline if the acoustic models are implemented using deep neural networks (DNNs) [22]. Similar observations were made for the Lwazi telephone corpus [23] and DNNs optimized using sequence-discriminative training within a state-level minimum Bayes risk criterion. However, according to recent studies, time delay neural networks (TDNN) [24,25] and long short-term memory (LSTM) acoustic models outperform DNN-based models [26].
A model architecture that combines TDNNs and bi-directional LSTMs (BLSTMs) yielded the best results in a preliminary study on the auxiliary NCHLT data [19]. BLSTMs process input data in both time directions using two separate hidden layers. In this manner, they preserve both past and future context information [27]. The interleaving of temporal convolution and BLSTM layers has been shown to model future temporal context effectively [28]. When BLSTMs are trained on limited datasets, configurations with more layers (as many as five) outperform similar systems with fewer layers (three or less). Larger training sets (approaching 100 h of data) obtain even better performance using six layers [29].
Ongoing research aims to incorporate deeper TDNNs since it is known that more layers have significantly improved the performance of image recognition tasks [30]. However, the gate mechanism in LSTMs still seems to have utility to selectively train TDNNs by emphasizing the more important input dimensions for a particular piece of audio [31]. In this paper, we report results obtained using TDNN-F acoustic models, which have recently been demonstrated to be effective in resource-constrained scenarios [32]. Apart from reducing the number of parameters (and connections) of a single layer, the singular-value decomposition operation also proves effective with deeper network architectures. In particular, it has been found that tuning the TDNN-F networks resulted in networks with as many as 11 layers [32]. The best Kaldi Librispeech chain model example recipe used in this study contained as many as 17 layers (Section 4.1).
The next section of the paper describes the NCHLT data, as well as the extent of repetition in the auxiliary datasets. Subsequent sections introduce the techniques that were used to quantify the quality of the auxiliary recordings and present TDNN-F results for all 11 languages. The paper also includes experiments that were conducted to determine whether the acoustic models benefited from the inclusion of the auxiliary data in the training set. The recognition performance of models trained on different training sets was measured on out-of-domain datasets.
3. Data
As was pointed out in Section 1, the recordings that were made during the initial phase of the NCHLT Speech project contained many repetitions of some prompts. Additional data was therefore collected to ensure that the corpus met the acoustic diversity stipulated in the project requirements. For a number of languages, this sequence of events resulted in two datasets being collected: one set with many examples of the same prompts and one set with fewer examples of many different prompts.
Participants in the NCHLT data collection campaign were asked to read text prompts displayed on a smartphone screen. The prompts were compiled using a text selection algorithm that determined the most frequently-observed n-grams for each language. The algorithm was used to derive prompts from the biggest text corpus that was available for each language (at the time) [6]. A mobile data collection tool was subsequently used to record the prompts while they were read out by participants [11].
Given that participants were asked to read text displayed on a mobile device, a reasonable match between the audio and text data can be expected. The recorded speech was therefore not transcribed manually. However, poor matches between prompts and their recordings did occur, usually as a result of reading errors, high levels of background noise, hesitations, etcetera. A confidence scoring technique was used to identify recordings that did not match their associated transcriptions. Recordings that had a high confidence score (well-matched with their associated transcriptions) and that contributed most to lexical diversity were selected to be included in the final version of the corpus. An additional specification stipulated that the corpus should contain an equal amount of data ( h of speech) for all 11 languages. Due to this restriction, data that could be of a sufficiently good acoustic quality was not included in the final corpus. To clarify exactly which part of the recorded data we refer to, we adhere to the dataset definitions that were published with the first version of the corpus:
- NCHLT-rawThe total set of usable data collected after all empty and otherwise unusable recordings were discarded. This includes multiple sessions of some speakers and multiple examples of some prompts.
- NCHLT-baselineA subset of NCHLT-raw representing approximately 200 unique speakers per language and more than 200 utterances per speaker. Recordings from the more diverse second batch of data were given preference in cases where speakers participated in both data collection campaigns.
- NCHLT-cleanA subset of NCHLT-baseline constituting the final deliverable of h of speech data for all 11 official languages. For ASR evaluation purposes, this dataset was partitioned into a training and test set. The test partitions consisted of eight speakers (equal numbers of male and female speakers) that were manually selected. The development data was taken from the training sets defined in [4] and was selected to contain another eight speakers each (The composition of the test set is included in the official corpus. We used the development set defined for the experiments in the 2014 corpus paper. The file lists can be downloaded here: https://sites.google.com/site/nchltspeechcorpus/).
The Aux1 dataset is comprised of the data in NCHLT-baseline that was not included in NCHLT-clean (the same speakers therefore occur in Aux1 and the NCHLT-clean dataset). Aux2 refers to all the NCHLT-raw utterances that are not in NCHLT-baseline. Table 1 presents the initial number of recordings (init) in the Aux1 and Aux2 datasets for each language.
The values in the failed column correspond to the number of utterances in each dataset for which the alignment procedure described in Section 4.4 failed. The percentage values in the last row of Table 1 indicate that more than 90% of both the datasets could be aligned and could therefore be considered for harvesting. This corresponds to and h of audio in the Aux1 and Aux2 sets, respectively.
3.1. Unique and Repeated Prompts
Shortly after the release of the NCHLT Speech corpus, an overview of the unique and repeated prompts was reported in [33]. Table 2 and Table 3 provide type and token counts for the prompts in the NCHLT-clean, Aux1, and Aux2 datasets.
The values in the NCHLT_TRN Type column correspond to the number of unique prompts in the NCHLT training set. The counts for prompt types that occur in the test set, but not in the training set are listed in the NCHLT_TST Type column. NCHLT_TRN_TST types correspond to unique prompts that occur in both the training and the test sets (Type and token counts for the NCHLT_DEV set are not included in the table. On average, the development sets contain around 3000 prompt tokens.). The Aux1 and Aux2 columns indicate how many of these types also occur in the auxiliary data. The type and token counts for the unique prompts that occur only in the auxiliary data are provided in the last four columns of Table 3. These values indicate that the auxiliary data mostly contains repetitions of prompts that are already in the NCHLT-clean corpus. Table 4 and Table 5 contain word level type and token counts for all the datasets.
3.2. Speaker Mapping
During the second phase of data collection, some speakers that were already in the initial dataset, participated in the data collection again. Apart from ensuring vocabulary diversity and well-matched transcriptions during the NCHLT-baseline subset selection, duplicate speaker sessions were avoided. A rather conservative approach was followed to identify possible duplicate speakers from available metadata. In particular, three data fields in the metadata were used to identify overlapping speaker sessions: names, national identity and telephone numbers. Speaker duplication was flagged if any of the fields were identical or differed by only one digit. The data corresponding to duplicate speakers was subsequently clustered into a single set with a unique speaker identity.
As was mentioned in Section 3, the Aux1 data has exactly the same speaker numbers as NCHLT-clean. However, speaker overlap with the NCHLT-baseline speakers can be expected for the Aux2 recordings (The test speaker overlap for Afr is an exception. According to the metadata, it seems that two test speakers occur in the NCHLT-clean training data as well.). To quantify the extent of the overlap, Table 6 shows the number of speaker clusters that were identified per language following a similar metadata-based detection process.
In the table, a match is reported if any of the metadata fields were identical, while a difference of one digit constituted close matches. The number of speakers in the Aux2 corpora is much higher than the detected overlapping speakers (all). Therefore, Aux2 also contains data from additional speakers who are not represented in the NCHLT-clean corpora. The table also indicates that, for six languages, speakers whose data is included in the predefined NCHLT development (dev) and test (tst) sets may have contributed to the Aux2 set as well.
3.3. Phone Representations
Our data analysis required phone level transcriptions of all the auxiliary data. Text pre-processing was required to prepare the transcriptions for pronunciation extraction. All text was converted to lowercase, and unwanted symbols (not within the list of graphemes for a particular language) were removed. Since numerous additional words (see Table 4) occurred in the auxiliary data, the existing NCHLT pronunciation dictionaries had to be extended before the data could be processed.
During the NCHLT project, a set of grapheme-to-phoneme (G2P) rules was derived from the so-called NCHLT-inlang dictionaries [4]. These rules were used to predict pronunciations for the new words. No explicit procedure was followed to identify out-of-language words, but for some languages, the in-language G2P rules did not contain rules for particular graphemes or the punctuation mark used to indicate an apostrophe in English (Eng). For these words, the Eng G2P rules were used to generate pronunciations, and the phones were mapped (The mappings were derived manually, employing the closest Speech Assessment Methods Phonetic Alphabet (SAMPA) phone label from the same phone category. During the NCHLT project, the SAMPA computer-readable phonetic script was used to represent the phones of all 11 languages: https://en.wikipedia.org/wiki/SAMPA) to similar sounds in the in-language phone set.
Eng was the only language for which a different procedure was followed. The G2P rules that were used for Eng were derived from a version of the Oxford Advanced Learner’s dictionary, adapted to South African Eng using manually-developed phoneme-to-phoneme rules [34].
4. Experiments
This section presents ASR results obtained using the NCHLT-clean training data, as well as extended training sets that include auxiliary data. The development and test sets described in Section 3 were used throughout. Experiments were also conducted using cross-corpus validation data so that more general conclusions could be drawn from the results. The validation data was created during the Resources for Closely Related Languages (RCRL) project [35] and comprises 330 Afr news bulletins that were broadcast between 2001 and 2004 on the local Radio Sonder Grense (RSG) radio station. The bulletins were purchased from the South African Broadcasting Corporation (SABC) and transcribed to create a corpus of around 27 h of speech data. For the experiments in this study, we used a previously-selected h evaluation set containing 28 speakers (To obtain the phone sequences from the RSG orthography, we implemented the same procedure as for the NCHLT Afr system. After text pre-processing, G2P rules were applied to generate pronunciations for new words.).
Two acoustic modeling recipes were followed to build all acoustic models. Section 4.1 describes the experimental setup. Since the focus of the current work was primarily on acoustic modeling, recognition performance was quantified in terms of phone recognition results (Section 4.2) in all experiments. In principle, improved phone recognition should translate to better word recognition results for a well-defined transcription task. Word recognition experiments were not included, because of the very limited amount of text corpora available for most of the NCHLT languages. After establishing a new baseline (Section 4.3), further data augmentation work using both Aux1 and Aux2 data was carried out. The selection criteria for auxiliary datasets (Section 4.4 and Section 4.5) allowed us to test the utility of the additional data with current acoustic modeling techniques. This section ends with cross-corpus validation experiments for a specific set of models Section 4.6.
4.1. Acoustic Modeling
The development of TDNN-BLSTM baseline acoustic models for all 11 languages was described in [19]. In this paper, the aim was to improve on the baseline by using TDNN-F acoustic models (Section 2). To create the new models, the same standard triphone recognition systems that were used in previous studies [19] were required to extract phone alignments for the training data.
A standard MFCC front-end with a 25-ms Hamming window and a 10-ms shift between frames (16-kHz sampling frequency) was employed to train all models for the triphone recognition systems. Mean and variance normalization operations, applied on a per speaker basis, followed the extraction of 13 cepstra, which included C0. Delta and double delta coefficients were added. These features were used to estimate three-state left-to-right HMM triphone models, incorporating linear discriminant analysis (LDA), maximum likelihood linear transform (MLLT) training, and speaker adaptive training (SAT).
Similar to the previous TDNN-BLSTM models, the TDNN-F recipes also require i-vectors [36] and 40-dimensional high-resolution MFCC features for training. I-vector extractors were trained based on the training parameters provided in the Kaldi Wall Street Journal (WSJ) example recipe without adjustment. The high-resolution MFCCs were derived from speed (using factors of , , and [37]) and volume (choosing a random factor between and 2) perturbed data. Speed perturbing was applied first, adding two speed-perturbed versions of the audio data used for training, after which volume perturbation was applied to the complete set (including the speed-perturbed versions).
We generated two different TDNN-F networks with the nnet3 Kaldi setup and refer to these TDNN-F recipes as the 1c [38] and 1d [39] recipes, respectively. Both recipes were taken from Kaldi Librispeech chain model examples. The nnet3 component graph of the TDNN-F 1c recipe contained 11 TDNN-F layers. For all layers, the cell-dimension was kept at 1280 and the bottleneck-dimension at 256, respectively. In contrast, the TDNN-F 1d recipe’s component graph implements 17 layers of a larger cell-dimension (1536) and smaller bottleneck-dimension (160) each. It also implements a dropout schedule of “0,[email protected],0.5@0,0” defining a piecewise linear function f(x) that is linearly interpolated between the points f(0) = 0, f(0.2) = 0, f(0.5) = 0.5, and f(1) = 0. Dropout schedules of this form were recommended in [40] to guard against overfitting.
4.2. Phone Recognition Measurement
A position independent phone configuration was used to convert the training transcriptions to a phone-level representation. During system evaluation, this arrangement seamlessly converts the standard Kaldi word error rate (WER) measurement to a phone error rate (PER). PERs were calculated using only speech phone labels. Silence labels were not taken into consideration. Recognition employed a flat ARPA language model consisting of equiprobable one-grams.
The best ratio between acoustic and language model contributions was determined by varying the language-scale parameter (integer values in the range of 1–20) during scoring. The acoustic-scale parameter was set to the default value of , and the best language-scale parameter was chosen using the NCHLT-clean development datasets. The selected language-scale parameters were subsequently used during data harvesting to gauge recognition performance.
4.3. Baseline Systems
Table 7 compares the development (dev) and test (tst) set PER results of the TDNN-BLSTM baseline [19] with the new TDNN-F acoustic models. Both the TDNN-F 1c and TDNN-F 1d recipes (see Section 4.1) were evaluated for all 11 languages. The number of phone labels (#Phns) provides an indication of the label complexity.
The results in Table 7 show that, except for Nbl, the PERs of all the languages improved substantially compared to the TDNN-BLSTM baseline. Furthermore, in all cases, the TDNN-F 1d recipe yielded better results than the TDNN-F 1c recipe.
4.4. Acoustic Ranking
Not all the Aux1 and Aux2 data could be used as training or test data. The auxiliary data was screened to detect acoustically-compromised recordings using the TDNN-BLSTM acoustic models [19] (the data harvesting procedure was not repeated with TDNN-F models). The screening procedure required each utterance to be decoded twice.
First, standard free phone decoding implementing an ergodic phone loop generated a sequence of phone labels, purely based on the acoustics. Next, Kaldi’s functionality to compute training alignments from lattices for nnet3 models was used. This algorithm generates a decoding graph for a single fixed sequence of phone labels, which directly corresponds to the reference transcription. In the event that the acoustics are not a good match for the forced sequence of phone labels, this constraint can result in the decode operation exiting without producing any output. Such unsuccessful decodes served as a first selection criterion to filter out large transcription errors. The number of utterances that were discarded for the Aux1 and Aux2 datasets is shown in the failed columns in Table 1.
As was explained in Section 2, PDP scoring matched the free phone decode and forced phone label sequences. It is possible to adjust the PDP algorithm using a cost matrix so that string edit operations (substitution, deletion, and insertion) contribute differently for the various phone labels [41]. A flat phone matrix was chosen where the contributions of the edit operations are the same for all phone labels. Insertions and deletions contributed half as much to the score as substitutions and correctly-recognised labels.
4.5. Data Selection
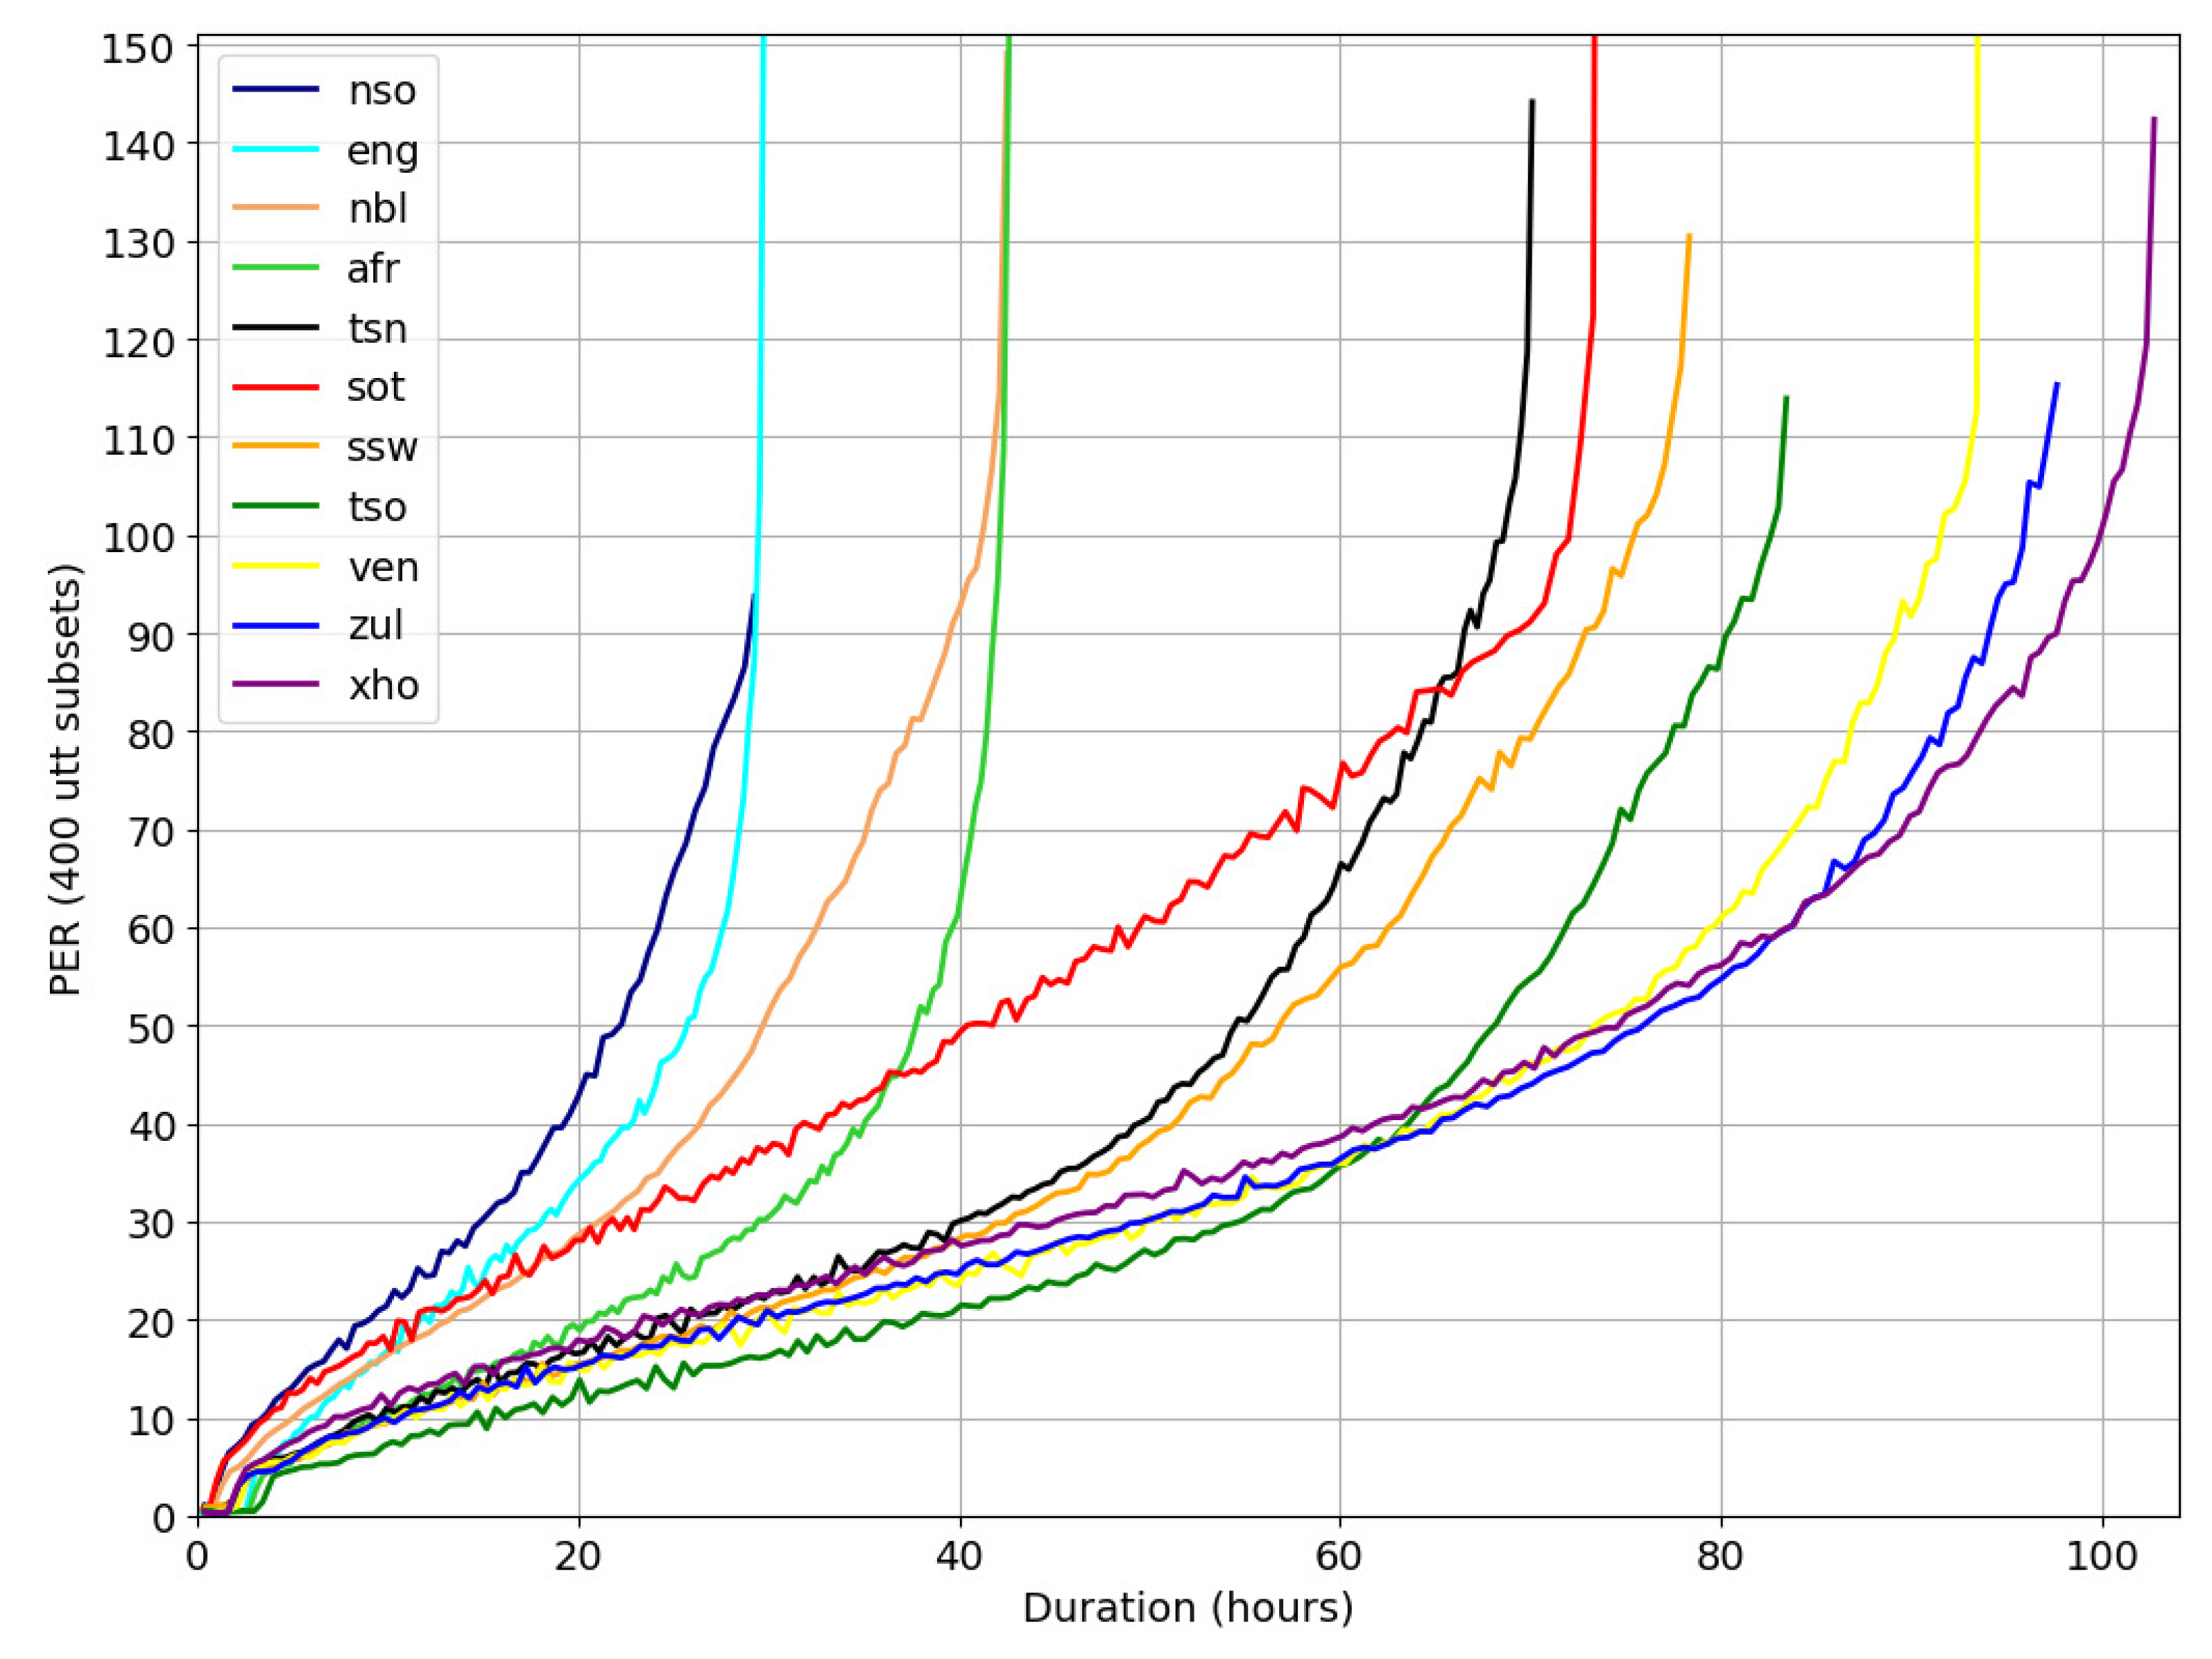
The first data augmentation experiment was conducted with only the Aux1 data added to the NCHLT training sets. This meant that the speaker labels agreed with those of NCHLT-clean and secondly that the vocabulary of the augmentation data would be similarly diverse. To select suitable subsets of additional training data, we estimated local PERs for 400 utterances at a time.
Figure 1 depicts graphs of the local PERs. These values were computed for non-overlapping subsets of utterances, ordered according to PDP scores. Figure 1 reveals a large range of PER scores for different subsets of utterances. In a few estimations, PERs of higher than 100% occur, which can be explained in terms of the PER estimation formula. PERs of higher than 100% can occur due to, for example, runaway insertions during free phone recognition. At an operating point of 50% PER, more than 20 h and for some languages even more than 60 h of additional data can be selected. In [19], it was decided to use a conservative estimate of 30% PER. This selection strategy resulted in some improvement given the TDNN-BLSTM baseline.
Repeating the experiment for more languages, using the new TDNN-F models, generated the set of results given in Table 8. For each language, the amount of augmentation data (in hours) for the 30% selection criterion is displayed. With the exception of English, results for seven other languages with more than 20 h of acceptable Aux1 data were obtained. Comparing the TDNN-F baseline (base) results with those obtained for the systems trained on the augmented data (30%) showed that using the additional data did not result in improved system performance. The within-corpus modeling capability of the TDNN-F models remained similar.
4.6. Cross-Corpus Validation
Measuring recognition performance on a well-matched test set provides an indication of modeling efficiency, but in practice, ASR systems have much more utility if generalization to speech databases from other domains can be achieved. To simulate this scenario for acoustic modeling based on NCHLT data, the performance of the Afr models was evaluated on a different test set, the radio news data introduced at the beginning of the section.
Table 9 provides an overview of different acoustic models created by augmenting the NCHLT Afr training data with various selections of Aux1 and Aux2 data. The first entry (NCHLT-clean) corresponds to the TDNN-F baseline results for both recipes (see Table 7) and adds the new PERs that were obtained when validating on broadcast data (Radio). Here, the baseline result for the TDNN-F 1c recipe showed approximate agreement with the earlier findings in [19]. However, cross-corpus results for the TDNN-F 1d recipe improved even further.
To obtain the next three results, all auxiliary data passing the original alignment (cf. Table 1) was simply added to the NCHLT training data. Adding another 10 h of data increased the total amount of Aux1 augmentation data to 39.90 h, but did not further improve PERs. The same holds true when validating these models with RSG data (Aux1). Similarly, an attempt to augment training data with the entire set of Aux2 data did not improve recognition performance. Finally, more than doubling the training data by adding all 79.04 h of auxiliary data (Aux1 + Aux2) reduced the PER on cross-corpus data.
The bottom part of Table 9 shows the results of four experiments based on more refined selection efforts. Firstly, we added the radio data validation results for the Aux1 (30%) experiment. Interestingly, augmenting with this selection of higher quality Aux1 data did improve PER for the TDNN-F 1c recipe. The 30% selection criterion for the Aux1 Afr data approximately corresponded to selecting all harvested utterances with a PDP score higher than . With our setup, the PDP scoring resulted in a value of for matching transcriptions. Applying an even more strict threshold (a PDP score of 0.85), selected only 8.17 h of Aux1 data, but provided another indication of improved PER for the TDNN-F 1d model. In fact, this effect holds when augmenting with 19.74 h of Aux2 data and the PDP score threshold. For this configuration, both TDNN-F 1c and TDNN-F 1d model validations achieved lower PERs. The trend continued when these high confidence-based selections of auxiliary data were combined in experiment Aux1 + Aux2 (0.85 PDP).
4.7. Discussion
As mentioned in Section 2, BLSTM training with six or more layers requires at least 100 h of speech data. However, the separate language components of the NCHLT corpus of the South African languages consist of about half (56 h) this amount of data. A pure BLSTM model was not experimented with since improved TDNN-BLSTM networks were available. Previously, these TDNN-BLSTM networks were successfully applied to all language components, resulting in significant improvement, even with the limited data [19].
With standard parameters, the more recent TDNN-F acoustic model recipes produced models capable of modeling NCHLT speech data even better than TDNN-BLSTMs. It was verified that the latest Kaldi example TDNN-F recipes, employing deeper networks, a smaller bottleneck-dimension, and higher cell-dimensions, outperformed previous baselines. Overall, the TDNN-F 1d recipe seemed to produce more consistent results with improved generalization to different datasets. This might not only be because of the deeper network and parameter settings, but also points out the importance of drop-out during training. Furthermore, drop-out combined with the deeper architecture of the TDNN-F 1d recipe seems to generate significantly improved results for all cross-corpus experiments.
Unfortunately, with the limited auxiliary data, it is clear that the modeling capacity of the TDNN-F models did not increase beyond that of training on NCHLT-clean data only. In fact, within-corpus variability seemed to increase slightly: The Aux1 data augmentation experiment based on the 30% selection criterion consistently produced lower PERs across all languages. Possibly, more data of a comparable quality may be required for further improvement since adding all h of auxiliary data (Aux1 + Aux2) to the training data generalized better to the broadcast news data. An absolute reduction of PER was achieved, which might not be statistically significant.
Using a stricter threshold (0.85 PDP) did improve the TDNN-F 1d model’s generalization in all three experiments: Aux1, Aux2, and Aux1 + Aux2. Interestingly, the Aux2 data did show utility even though this data contains high numbers of repeated prompts and therefore only represents a limited vocabulary.
5. Conclusions
The aim of the study presented in this paper was to determine whether imperfect speech data could be used to improve the performance of ASR systems in under-resourced languages. The specific case considered involved data that was collected but not released because it did not meet project requirements. Given the severe lack of data in the languages under consideration, it was crucial to determine if acoustic modeling accuracy could be improved by adding this data to existing resources.
Results indicate that the additional data added very little to modeling capacity when the acoustic models were evaluated on matched test sets. In fact, recognition rates decreased slightly for some languages when the augmented datasets were used for training. In contrast, results obtained for a test set from a different corpus showed that the additional data did improve the models’ ability to maintain performance across different datasets. However, it remains clear that substantially more high quality data is required to improve ASR for South Africa’s 11 official languages.
Author Contributions
The individual contributions of the authors were as follows: conceptualisation, F.d.W. and J.B.; data curation, J.B.; formal analysis, J.B. and F.d.W.; funding acquisition, F.d.W.; investigation, J.B.; methodology, J.B. and F.d.W.; project administration, J.B. and F.d.W.; resources, F.d.W.; software, J.B.; supervision, F.d.W.; validation, F.d.W.; visualisation, F.d.W. and J.B.; writing-original, F.d.W. and J.B.; writing-review and editing, F.d.W. and J.B.
Funding
This research was funded by the South African Centre for Digital Language Resources (SADiLaR, https://www.sadilar.org/).
Acknowledgments
The authors are indebted to Andrew Gill of the Centre for High Performance Computing for providing technical support.
Conflicts of Interest
The authors declare no conflict of interest. The funders had no role in the design of the study; in the collection, analyses, or interpretation of data; in the writing of the manuscript; nor in the decision to publish the results.
Abbreviations
The following abbreviations are used in this manuscript:
| Afr | Afrikaans |
| AST | African Speech Technology |
| ASR | Automatic speech recognition |
| Aux | auxiliary |
| BLSTM | bi-directional LSTM |
| DAC | Departments of Arts and Culture |
| DACST | Department of Arts Culture Science and Technology |
| DNN | deep neural network |
| DST | Department of Science and Technology |
| Eng | English |
| G2P | grapheme-to-phoneme |
| HTK | Hidden Markov Model Toolkit |
| LDC | linear discriminant analysis |
| LSTM | long short-term memory |
| MLLT | maximum likelihood linear transform |
| Nbl | isiNdebele |
| NCHLT | National Centre for Human Language Technology |
| Nso | Sepedi |
| PDP | phone-based dynamic programming |
| PER | phone error rate |
| SABC | South African Broadcasting Corporation |
| RCRL | Resources for Closely Related Languages |
| RSG | Radio Sonder Grense |
| SADiLaR | South African Centre for Digital Language Resources |
| SAMPA | Speech Assessment Methods Phonetic Alphabet |
| SAT | speaker adaptive training |
| SGMM | subspace Gaussian mixture models |
| Sot | Sesotho |
| Ssw | Siswati |
| TDNN | time delay neural networks |
| TDNN-F | factorized time delay neural networks |
| Tsn | Setswana |
| Tso | Xitsonga |
| Ven | Tshivenda |
| WER | word error rate |
| WSJ | Wall Street Journal |
| Xho | isiXhosa |
| Zul | isiZulu |
References
- Roux, J.C.; Louw, P.H.; Niesler, T. The African Speech Technology Project: An Assessment. In Proceedings of the Fourth International Conference on Language Resources and Evaluation (LREC’04), Lisbon, Portugal, 1 January 2004; pp. 93–96. [Google Scholar]
- Badenhorst, J.; Heerden, C.V.; Davel, M.; Barnard, E. Collecting and evaluating speech recognition corpora for 11 South African languages. Lang. Resour. Eval. 2011, 3, 289–309. [Google Scholar] [CrossRef]
- Calteaux, K.; de Wet, F.; Moors, C.; van Niekerk, D.; McAlister, B.; Sharma-Grover, A.; Reid, T.; Davel, M.; Barnard, E.; van Heerden, C. Lwazi II Final Report: Increasing the Impact of Speech Technologies in South Africa; Technical Report; CSIR: Pretoria, South Africa, 2013. [Google Scholar]
- Barnard, E.; Davel, M.H.; van Heerden, C.; de Wet, F.; Badenhorst, J. The NCHLT speech corpus of the South African languages. In Proceedings of the 4th Workshop on Spoken Language Technologies for Under-Resourced Languages, St. Petersburg, Russia, 14–16 May 2014; pp. 194–200. [Google Scholar]
- De Wet, F.; Badenhorst, J.; Modipa, T. Developing speech resources from parliamentary data for South African English. Procedia Comput. Sci. 2016, 81, 45–52. [Google Scholar] [CrossRef]
- Eiselen, R.; Puttkammer, M.J. Developing Text Resources for Ten South African Languages. In Proceedings of the Language Resource and Evaluation, Reykjavik, Iceland, 28 May 2014; pp. 3698–3703. [Google Scholar]
- Camelin, N.; Damnati, G.; Bouchekif, A.; Landeau, A.; Charlet, D.; Estève, Y. FrNewsLink: A corpus linking TV Broadcast News Segments and Press Articles. In Proceedings of the Language Resource and Evaluation, Miyazaki, Japan, 22 May 2018; pp. 2087–2092. [Google Scholar]
- Takamichi, S.; Saruwatari, H. CPJD corpus: Crowdsourced parallel speech corpus of japanese dialects. In Proceedings of the Eleventh International Conference on Language Resources and Evaluation (LREC-2018), Miyazaki, Japan, 7–12 May 2018; pp. 434–437. [Google Scholar]
- Salimbajevs, A. Creating Lithuanian and Latvian speech corpora from inaccurately annotated web data. In Proceedings of the Eleventh International Conference on Language Resources and Evaluation (LREC-2018), Miyazaki, Japan, 7–12 May 2018; pp. 2871–2875. [Google Scholar]
- Baumann, T.; Köhn, A.; Hennig, F. The Spoken Wikipedia Corpus collection: Harvesting, alignment and an application to hyperlistening. Lang. Resour. Eval. 2018, 1–27. [Google Scholar] [CrossRef]
- de Vries, N.J.; Davel, M.H.; Badenhorst, J.; Basson, W.D.; de Wet, F.; an Alta de Waal, E.B. A smartphone-based ASR data collection tool for under-resourced languages. Speech Commun. 2014, 56, 119–131. [Google Scholar] [CrossRef]
- Jones, K.S.; Strassel, S.; Walker, K.; Graff, D.; Wright, J. Multi-language speech collection for NIST LRE. In Proceedings of the Tenth International Conference on Language Resources and Evaluation (LREC 2016), Portorož, Slovenia, 23–28 May 2016; pp. 4253–4258. [Google Scholar]
- Ide, N.; Reppen, R.; Suderman, K. The American National Corpus: More Than the Web Can Provide. In Proceedings of the Third International Conference on Language Resources and Evaluation (LREC’02), Las Palmas, Spain, 29–31 May 2002; pp. 840–844. [Google Scholar]
- Schalkwyk, J.; Beeferman, D.; Beaufays, F.; Byrne, B.; Chelba, C.; Cohen, M.; Kamvar, M.; Strope, B. “Your Word is my Command”: Google search by voice: A case study. In Advances in Speech Recognition; Springer: Boston, MA, USA, 2010; pp. 61–90. [Google Scholar]
- Cieri, C.; Miller, D.; Walker, K. Research Methodologies, Observations and Outcomes in (Conversational) Speech Data Collection. In Proceedings of the Second International Conference on Human Language Technology Research, San Diego, CA, USA, 24–27 May 2002; pp. 206–211. [Google Scholar]
- De Wet, F.; Louw, P.; Niesler, T. The design, collection and annotation of speech databases in South Africa. In Proceedings of the Pattern Recognition Association of South Africa (PRASA 2006), Bloemfontein, South Africa, 29 November–1 December 2006; pp. 1–5. [Google Scholar]
- Brümmer, N.; Garcia-Romero, D. Generative modeling for unsupervised score calibration. arXiv 2014, arXiv:1311.0707. [Google Scholar]
- Davel, M.H.; van Heerden, C.; Barnard, E. Validating Smartphone-Collected Speech Corpora. In Proceedings of the Third Workshop on Spoken Language Technologies for Under-resourced Languages, Cape Town, South Africa, 7–9 May 2012; pp. 68–75. [Google Scholar]
- Badenhorst, J.; Martinus, L.; De Wet, F. BLSTM harvesting of auxiliary NCHLT speech data. In Proceedings of the 2019 Southern African Universities Power Engineering Conference/Robotics and Mechatronics/Pattern Recognition Association of South Africa (SAUPEC/RobMech/PRASA), Bloemfontein, South Africa, 28–30 January 2019; pp. 123–128. [Google Scholar]
- Young, S.; Evermann, G.; Gales, M.; Hain, T.; Kershaw, D.; Liu, X.; Moore, G.; Odell, J.; Ollason, D.; Povey, D.; et al. The HTK Book. Revised for HTK Version 3.4. 2009. Available online: http://htk.eng.cam.ac.uk// (accessed on 27 June 2019).
- Povey, D.; Ghoshal, A.; Boulianne, G.; Burget, L.; Glembek, O.; Goel, N.; Hannemann, M.; Motlicek, P.; Qian, Y.; Schwarz, P.; et al. The Kaldi speech recognition toolkit. In Proceedings of the IEEE 2011 Workshop on Automatic Speech Recognition and Understanding, Hilton Waikoloa Village, Big Island, HI, USA, 11–15 December 2011. [Google Scholar]
- Badenhorst, J.; de Wet, F. The limitations of data perturbation for ASR of learner data in under-resourced languages. In Proceedings of the 2017 Pattern Recognition Association of South Africa and Robotics and Mechatronics (PRASA-RobMech), Bloemfontein, South Africa, 30 November–1 December 2017; pp. 44–49. [Google Scholar]
- van Heerden, C.; Kleynhans, N.; Davel, M. Improving the Lwazi ASR baseline. In Proceedings of the Interspeech 2016, San Francisco, CA, USA, 8–12 September 2016; pp. 3534–3538. [Google Scholar]
- Peddinti, V.; Povey, D.; Khudanpur, S. A time delay neural network architecture for efficient modeling of long temporal contexts. In Proceedings of the INTERSPEECH 2015 16th Annual Conference of the International Speech Communication Association, Dresden, Germany, 6–10 September 2015; pp. 3214–3218. [Google Scholar]
- Waibel, A.; Hanazawa, T.; Hinton, G.; Shikano, K.; Lang, K.J. Phoneme recognition using time-delay neural networks. IEEE Trans. Acoust. Speech Signal Process. 1989, 37, 328–339. [Google Scholar] [CrossRef]
- Sak, H.; Senior, A.; Beaufays, F. Long short-term memory based recurrent neural network architectures for large vocabulary speech recognition. arXiv 2014, arXiv:1402.1128. [Google Scholar]
- Yu, Z.; Ramanarayanan, V.; Suendermann-Oeft, D.; Wang, X.; Zechner, K.; Chen, L.; Tao, J.; Ivanou, A.; Qian, Y. Using bidirectional LSTM recurrent neural networks to learn high-level abstractions of sequential features for automated scoring of non-native spontaneous speech. In Proceedings of the 2015 IEEE Workshop on Automatic Speech Recognition and Understanding (ASRU), Scottsdale, AZ, USA, 13–17 December 2015; pp. 338–345. [Google Scholar]
- Peddinti, V.; Wang, Y.; Povey, D.; Khudanpur, S. Low latency acoustic modeling using temporal convolution and LSTMs. IEEE Signal Process. Lett. 2018, 25, 373–377. [Google Scholar] [CrossRef]
- Karafiat, M.; Baskar, M.K.; Vesely, K.; Grezl, F.; Burget, L.; Černocký, J.C. Analysis of multilingual BLSTM acoustic model on low and high resource languages. In Proceedings of the 2018 IEEE International Conference on Acoustics, Speech and Signal Processing (ICASSP), Calgary, AB, Canada, 15–20 April 2018; pp. 5789–5793. [Google Scholar]
- Huang, X.; Zhang, W.; Xu, X.; Yin, R.; Chen, D. Deeper Time Delay Neural Networks for Effective Acoustic Modeling. J. Phys. Conf. Ser. 2019, 1229, 012076. [Google Scholar] [CrossRef]
- Chen, K.; Zhang, W.; Chen, D.; Huang, X.; Liu, B.; Xu, X. Gated Time Delay Neural Network for Speech Recognition. J. Phys. Conf. Ser. 2019, 1229, 012077. [Google Scholar] [CrossRef]
- Povey, D.; Cheng, G.; Wang, Y.; Li, K.; Xu, H.; Yarmohammadi, M.; Khudanpur, S. Semi-Orthogonal Low-Rank Matrix Factorization for Deep Neural Networks. In Proceedings of the Interspeech 2018, Hyderabad, India, 2–6 September 2018; pp. 3743–3747. [Google Scholar]
- van der Westhuizen, E.; Niesler, T.R. Technical Report SU-EE-1501 An Analysis of the NCHLT Speech Corpora; Technical Report; Stellenbosh University of Zurich, Department of Electrical and Electronic Engineering: Stellenbosch, South Africa, 2015. [Google Scholar]
- Loots, L.; Davel, M.; Barnard, E.; Niesler, T. Comparing manually-developed and data-driven rules for P2P learning. In Proceedings of the 20th Annual Symposium of the Pattern Recognition Association of South Africa (PRASA), Stellenbosch, South Africa, 30 November–1 December 2009; pp. 35–40. [Google Scholar]
- de Wet, F.; de Waal, A.; van Huyssteen, G.B. Developing a broadband automatic speech recognition system for Afrikaans. In Proceedings of the INTERSPEECH 2011, 12th Annual Conference of the International Speech Communication Association, Florence, Italy, 27–31 August 2011; pp. 3185–3188. [Google Scholar]
- Peddinti, V.; Chen, G.; Povey, D.; Khudanpur, S. Reverberation robust acoustic modeling using i-vectors with time delay neural networks. In Proceedings of the INTERSPEECH 2015 16th Annual Conference of the International Speech Communication Association, Dresden, Germany, 6–10 September 2015; pp. 2440–2444. [Google Scholar]
- Ko, T.; Peddinti, V.; Povey, D.; Khudanpur, S. Audio augmentation for speech recognition. In Proceedings of the INTERSPEECH 2015 16th Annual Conference of the International Speech Communication Association, Dresden, Germany, 6–10 September 2015; pp. 3586–3589. [Google Scholar]
- Povey, D. Kaldi Librispeech TDNN-F 1c Chain Model Example Recipe. Available online: https://github.com/kaldi-asr/kaldi/blob/master/egs/librispeech/s5/local/chain/tuning/run_tdnn_1c.sh (accessed on 27 June 2019).
- Povey, D. Kaldi Librispeech TDNN-F 1d Chain Model Example Recipe. Available online: https://github.com/kaldi-asr/kaldi/blob/master/egs/librispeech/s5/local/chain/tuning/run_tdnn_1d.sh (accessed on 27 June 2019).
- Cheng, G.; Peddinti, V.; Povey, D.; Manohar, V.; Khudanpur, S.; Yan, Y. An exploration of dropout with lstms. In Proceedings of the Interspeech, 2017, Stockholm, Sweden, 20–24 August 2017; pp. 1586–1590. [Google Scholar]
- Jurafsky, D.; Martin, J. Speech Lang. Process.; Prentice Hall: Upper Saddle River, NJ, USA, 2000; pp. 153–199. [Google Scholar]
Figure 1.
Local phone error rates (PERs) for 400 utterance subsets of the Aux1 data.


Table 1.
Total number of initial (Init) auxiliary recordings (Aux1 and Aux2), number of failed phone alignments (failed) and duration (dur) in hours of additional data per language.
Table 1.
Total number of initial (Init) auxiliary recordings (Aux1 and Aux2), number of failed phone alignments (failed) and duration (dur) in hours of additional data per language.
| Lang | Aux 1 | Aux 2 | ||||
|---|---|---|---|---|---|---|
| Init | Failed | Dur | Init | Failed | Dur | |
| Afr | 54,117 | 2451 | 42.68 | 47,290 | 356 | 39.14 |
| Eng | 42,958 | 952 | 29.78 | 54,719 | 628 | 38.92 |
| Nbl | 37,669 | 3224 | 42.56 | 100,402 | 4202 | 120.07 |
| Nso | 65,224 | 2259 | 64.89 | 53,318 | 947 | 51.80 |
| Sot | 74,457 | 5858 | 73.86 | 47,938 | 700 | 43.51 |
| Ssw | 67,410 | 7172 | 78.41 | 136,422 | 9490 | 167.00 |
| Tsn | 69,655 | 1953 | 70.15 | 35,156 | 356 | 36.98 |
| Tso | 71,311 | 3781 | 83.67 | 2316 | 1489 | 0.65 |
| Ven | 82,895 | 4886 | 93.69 | 44,666 | 1220 | 54.94 |
| Xho | 90,560 | 8739 | 102.95 | 53,269 | 2549 | 54.95 |
| Zul | 77,833 | 3471 | 97.93 | 30,319 | 327 | 32.74 |
| Total | 734,089 | 6.1% | 780.57 | 605,815 | 3.7% | 640.70 |
Table 2.
Type and token counts for prompts only in NCHLT_TRN and only in NCHLT_TST. Aux1, Aux2: Type and token counts for prompts repeated in auxiliary data.
Table 2.
Type and token counts for prompts only in NCHLT_TRN and only in NCHLT_TST. Aux1, Aux2: Type and token counts for prompts repeated in auxiliary data.
| NCHLT_TRN | Aux1 | Aux2 | NCHLT_TST | Aux1 | Aux2 | |||||||
|---|---|---|---|---|---|---|---|---|---|---|---|---|
| Language | Type | Token | Type | Token | Type | Token | Type | Token | Type | Token | Type | Token |
| Afr | 9482 | 39,589 | 8268 | 30,494 | 996 | 29,224 | 44 | 44 | 44 | 299 | 0 | 0 |
| Eng | 6509 | 33,595 | 5724 | 22,425 | 1934 | 17,095 | 95 | 106 | 86 | 301 | 9 | 14 |
| Nbl | 9967 | 29,416 | 7056 | 20,639 | 9964 | 63,833 | 599 | 632 | 403 | 724 | 196 | 278 |
| Nso | 14,247 | 45,803 | 12,415 | 41,453 | 6787 | 34,699 | 223 | 291 | 194 | 556 | 28 | 61 |
| Sot | 9414 | 34,010 | 8273 | 42,105 | 3561 | 23,714 | 122 | 122 | 122 | 485 | 0 | 0 |
| Ssw | 9781 | 28,472 | 9097 | 33,662 | 9781 | 79,138 | 160 | 164 | 158 | 687 | 2 | 2 |
| Tsn | 13,230 | 40,994 | 11,206 | 41,768 | 1588 | 28,533 | 407 | 443 | 160 | 309 | 32 | 32 |
| Tso | 10,517 | 34,265 | 10,144 | 42,177 | 646 | 659 | 173 | 179 | 173 | 911 | 0 | 0 |
| Ven | 14,188 | 37,456 | 13,085 | 49,008 | 6738 | 34,037 | 436 | 439 | 434 | 1 527 | 0 | 0 |
| Xho | 11,416 | 26,713 | 9470 | 43,812 | 2190 | 11,651 | 511 | 511 | 201 | 818 | 0 | 0 |
| Zul | 7580 | 19,585 | 7220 | 34,330 | 1191 | 9760 | 277 | 299 | 276 | 1377 | 0 | 0 |
Table 3.
Type and token counts for prompts in both NCHLT_TRN and NCHLT_TST. Aux1, Aux2: Type and token counts for prompts repeated in auxiliary data. New unique: Type and token counts for new prompts in Aux1 and Aux2.
Table 3.
Type and token counts for prompts in both NCHLT_TRN and NCHLT_TST. Aux1, Aux2: Type and token counts for prompts repeated in auxiliary data. New unique: Type and token counts for new prompts in Aux1 and Aux2.
| NCHLT_TRN_TST | Aux1 | Aux2 | New Unique Aux1 | New Unique Aux2 | ||||||
|---|---|---|---|---|---|---|---|---|---|---|
| Language | Type | Token | Type | Token | Type | Token | Type | Token | Type | Token |
| Afr | 2463 | 23,328 | 2318 | 14,565 | 1089 | 16,697 | 1244 | 6378 | 80 | 1013 |
| Eng | 2804 | 40,673 | 2627 | 16,065 | 2455 | 35,894 | 583 | 3215 | 195 | 1088 |
| Nbl | 2269 | 9393 | 1696 | 4366 | 2269 | 16,326 | 2450 | 8716 | 2716 | 15,763 |
| Nso | 2082 | 10,258 | 1783 | 5818 | 1015 | 6466 | 3513 | 15,138 | 1969 | 11,145 |
| Sot | 1726 | 20,600 | 1680 | 15,111 | 814 | 18,998 | 2507 | 10,898 | 937 | 4526 |
| Ssw | 2292 | 11,898 | 2189 | 9219 | 2292 | 2546 | 3442 | 16,670 | 3448 | 22,376 |
| Tsn | 868 | 14,137 | 682 | 8316 | 528 | 3454 | 4596 | 17,309 | 223 | 2781 |
| Tso | 2476 | 10,626 | 2427 | 8505 | 6 | 6 | 2706 | 15,937 | 148 | 162 |
| Ven | 2331 | 8979 | 2193 | 7834 | 1041 | 3732 | 3987 | 19,640 | 1641 | 5677 |
| Xho | 1057 | 16,419 | 1500 | 15,081 | 1024 | 36,792 | 5636 | 22,110 | 490 | 2277 |
| Zul | 1814 | 21,844 | 1772 | 22,915 | 1040 | 19,296 | 2321 | 15,740 | 262 | 936 |
Table 4.
Type and token counts for words only in NCHLT_TRN and only in NCHLT_TST. Aux1, Aux2: Type and token counts for words repeated in auxiliary data.
Table 4.
Type and token counts for words only in NCHLT_TRN and only in NCHLT_TST. Aux1, Aux2: Type and token counts for words repeated in auxiliary data.
| NCHLT_TRN | Aux1 | Aux2 | NCHLT_TST | Aux1 | Aux2 | |||||||
|---|---|---|---|---|---|---|---|---|---|---|---|---|
| Language | Type | Token | Type | Token | Type | Token | Type | Token | Type | Token | Type | Token |
| Afr | 5189 | 34,893 | 4885 | 37,778 | 851 | 26,501 | 26 | 26 | 26 | 180 | 0 | 0 |
| Eng | 4644 | 28,647 | 4378 | 28,610 | 1781 | 18,780 | 56 | 62 | 53 | 212 | 3 | 5 |
| Nbl | 9985 | 45,265 | 8383 | 49,369 | 9982 | 125,433 | 421 | 455 | 316 | 837 | 105 | 153 |
| Nso | 8817 | 35,582 | 8497 | 57,178 | 2769 | 22,389 | 114 | 159 | 114 | 614 | 0 | 0 |
| Sot | 7924 | 37,274 | 7719 | 67,886 | 3307 | 27,505 | 90 | 93 | 90 | 474 | 0 | 0 |
| Ssw | 7929 | 34,531 | 7702 | 61,454 | 7929 | 12,281 | 134 | 136 | 134 | 1173 | 0 | 0 |
| Tsn | 4368 | 43,351 | 4238 | 74,935 | 1018 | 18,627 | 41 | 43 | 34 | 496 | 1 | 1 |
| Tso | 3819 | 16,087 | 3780 | 40,840 | 396 | 446 | 101 | 108 | 101 | 1270 | 0 | 0 |
| Ven | 4335 | 20,886 | 4266 | 55,577 | 2113 | 17,345 | 116 | 119 | 116 | 780 | 0 | 0 |
| Xho | 23,963 | 62,054 | 22,241 | 119,921 | 4823 | 24,540 | 826 | 831 | 570 | 2397 | 0 | 0 |
| Zul | 19,465 | 48,541 | 18,566 | 91,591 | 2915 | 19,334 | 742 | 804 | 742 | 3707 | 0 | 0 |
Table 5.
Type and token counts for words in both NCHLT_TRN and NCHLT_TST. Aux1, Aux2: Type and token counts for words repeated in auxiliary data. New unique: Type and token counts for new words in auxiliary data.
Table 5.
Type and token counts for words in both NCHLT_TRN and NCHLT_TST. Aux1, Aux2: Type and token counts for words repeated in auxiliary data. New unique: Type and token counts for new words in auxiliary data.
| NCHLT_TRN_TST | Aux1 | Aux2 | New Unique Aux1 | New Unique Aux2 | ||||||
|---|---|---|---|---|---|---|---|---|---|---|
| Language | Type | Token | Type | Token | Type | Token | Type | Token | Type | Token |
| Afr | 3377 | 146,834 | 3338 | 102,989 | 1971 | 102,981 | 775 | 6102 | 87 | 1331 |
| Eng | 3570 | 185,394 | 3536 | 88,421 | 3327 | 136,536 | 776 | 4617 | 257 | 1521 |
| Nbl | 4693 | 94,878 | 4387 | 63,962 | 4693 | 199,190 | 2402 | 13,014 | 2558 | 21,942 |
| Nso | 2238 | 244,606 | 2150 | 218,659 | 1285 | 229,884 | 2314 | 18,598 | 740 | 4347 |
| Sot | 2499 | 233,274 | 2488 | 213,721 | 1556 | 170,124 | 1923 | 13,289 | 702 | 4028 |
| Ssw | 3995 | 88,281 | 3967 | 100,213 | 3995 | 236,987 | 3241 | 25,506 | 3246 | 34,112 |
| Tsn | 1126 | 223,705 | 1115 | 202,301 | 959 | 132,632 | 1915 | 18,957 | 216 | 3766 |
| Tso | 2114 | 206,228 | 2110 | 248,341 | 684 | 3122 | 2858 | 26,475 | 234 | 272 |
| Ven | 3243 | 210,377 | 3231 | 293,293 | 2392 | 186,810 | 1783 | 17,528 | 895 | 3878 |
| Xho | 3892 | 65,194 | 3857 | 71,907 | 2369 | 117,731 | 9616 | 47,164 | 1042 | 4514 |
| Zul | 4446 | 72,926 | 4335 | 83,810 | 2374 | 68,684 | 7374 | 36,874 | 540 | 1671 |
Table 6.
Claimed speaker overlap for matching and close matching metadata fields (names, ID, and telephone numbers) of speakers in the predefined NCHLT development (dev) and test (tst) sets.
Table 6.
Claimed speaker overlap for matching and close matching metadata fields (names, ID, and telephone numbers) of speakers in the predefined NCHLT development (dev) and test (tst) sets.
| Language | Aux2 | Match | Close Match | ||||||
|---|---|---|---|---|---|---|---|---|---|
| #spk | clusters | all | dev | tst | clusters | all | dev | tst | |
| Afr | 94 | 7 | 14 | - | 2 | - | - | - | - |
| Eng | 113 | 14 | 30 | - | 1 | 3 | 6 | - | - |
| Nbl | 208 | 20 | 46 | - | - | 4 | 9 | - | - |
| Nso | 105 | 15 | 31 | - | - | 4 | 8 | - | 1 |
| Sot | 98 | 11 | 22 | 1 | 1 | 3 | 7 | 1 | 1 |
| Ssw | 226 | 26 | 53 | 1 | 1 | 4 | 9 | - | - |
| Tsn | 75 | 4 | 9 | - | - | - | - | - | - |
| Tso | 6 | 4 | 8 | - | - | 1 | 2 | - | - |
| Ven | 86 | 26 | 53 | - | 2 | 5 | 12 | - | - |
| Xho | 107 | 16 | 33 | - | - | 3 | 7 | - | - |
| Zul | 63 | 5 | 10 | - | - | 4 | 8 | - | - |
Table 7.
PERs for TDNN-BLSTM and TDNN-F baseline systems per language (lowest PERs in bold).
| TDNN-BLSTM | TDNN-F 1c | TDNN-F 1d | |||||
|---|---|---|---|---|---|---|---|
| Lang | #Phns | dev | tst | dev | tst | dev | tst |
| Afr | 37 | 5.89 | 6.64 | 3.92 | 4.73 | 3.63 | 4.39 |
| Eng | 44 | 7.69 | 7.24 | 6.32 | 5.76 | 6.10 | 5.64 |
| Nbl | 49 | 10.04 | 10.77 | 10.66 | 12.07 | 11.09 | 11.29 |
| Nso | 44 | 9.29 | 9.64 | 5.88 | 7.18 | 5.48 | 7.00 |
| Sot | 39 | 11.44 | 11.92 | 8.87 | 10.04 | 8.17 | 9.72 |
| Ssw | 39 | 9.17 | 8.70 | 6.71 | 7.52 | 6.17 | 7.35 |
| Tsn | 34 | 8.24 | 7.17 | 5.71 | 5.65 | 5.33 | 5.24 |
| Tso | 55 | 7.10 | 6.67 | 5.87 | 5.45 | 5.02 | 4.76 |
| Ven | 39 | 8.61 | 9.10 | 7.42 | 8.17 | 7.03 | 7.51 |
| Xho | 53 | 11.20 | 11.25 | 10.12 | 9.26 | 9.42 | 8.51 |
| Zul | 46 | 10.18 | 10.72 | 7.71 | 8.85 | 7.87 | 8.48 |
Table 8.
PERs for TDNN-F baseline (base) and 30% PER selection criterion systems per language (lowest PERs in bold).
Table 8.
PERs for TDNN-F baseline (base) and 30% PER selection criterion systems per language (lowest PERs in bold).
| TDNN-F 1c | TDNN-F 1d | ||||
|---|---|---|---|---|---|
| Lang | Aux (h) | base | 30% | base | 30% |
| Afr | 27.8 | 4.73 | 4.87 | 4.39 | 4.59 |
| Eng | 17.7 | 5.76 | 5.83 | 5.64 | 5.16 |
| Ssw | 40.0 | 7.52 | 9.63 | 7.35 | 9.48 |
| Tsn | 38.4 | 5.65 | 6.31 | 5.24 | 6.14 |
| Tso | 52.0 | 5.45 | 6.53 | 4.76 | 5.38 |
| Ven | 47.2 | 8.17 | 9.54 | 7.51 | 8.26 |
| Xho | 42.2 | 9.26 | 9.88 | 8.51 | 10.56 |
| Zul | 47.4 | 8.85 | 9.38 | 8.48 | 9.19 |
Table 9.
PERs for two Afr test sets and TDNN-F systems trained on different augmented training sets (lowest PERs in bold).
Table 9.
PERs for two Afr test sets and TDNN-F systems trained on different augmented training sets (lowest PERs in bold).
| System | (h) | TDNN-F 1c | TDNN-F 1d | ||
|---|---|---|---|---|---|
| NCHLT | Radio | NCHLT | Radio | ||
| NCHLT-clean | 0 | 4.73 | 27.73 | 4.39 | 23.29 |
| Aux1 | 39.90 | 4.71 | 27.68 | 4.52 | 23.49 |
| Aux2 | 39.14 | 4.94 | 29.53 | 4.29 | 24.56 |
| Aux1 + Aux2 | 79.04 | 4.93 | 26.57 | 3.98 | 22.80 |
| Aux1 (30%) | 27.79 | 4.87 | 25.55 | 4.59 | 23.68 |
| Aux1 (0.85 PDP) | 8.17 | 4.64 | 28.09 | 4.48 | 22.87 |
| Aux2 (0.85 PDP) | 19.74 | 5.06 | 25.47 | 4.22 | 22.65 |
| Aux1 + Aux2 (0.85 PDP) | 28.56 | 4.89 | 27.04 | 4.23 | 22.06 |
© 2019 by the authors. Licensee MDPI, Basel, Switzerland. This article is an open access article distributed under the terms and conditions of the Creative Commons Attribution (CC BY) license (http://creativecommons.org/licenses/by/4.0/).
Share and Cite
MDPI and ACS Style
Badenhorst, J.; de Wet, F. The Usefulness of Imperfect Speech Data for ASR Development in Low-Resource Languages. Information 2019, 10, 268. https://doi.org/10.3390/info10090268
AMA Style
Badenhorst J, de Wet F. The Usefulness of Imperfect Speech Data for ASR Development in Low-Resource Languages. Information. 2019; 10(9):268. https://doi.org/10.3390/info10090268
Chicago/Turabian StyleBadenhorst, Jaco, and Febe de Wet. 2019. "The Usefulness of Imperfect Speech Data for ASR Development in Low-Resource Languages" Information 10, no. 9: 268. https://doi.org/10.3390/info10090268
Note that from the first issue of 2016, this journal uses article numbers instead of page numbers. See further details here.