1. Introduction
The limit of the operating range of a compressor at low mass flow is set by the development of aerodynamic instabilities. Historically, those instabilities are separated into two categories called rotating stall and surge [
1]. Rotating stall initiates from a local phenomenon inherently linked to the viscosity of the fluid. Surge involves the whole compression system including volumes located upstream and downstream of the compressor. Nevertheless, these two categories are closely related, as surge is necessarily triggered by the emergence of separated flow areas in the compressor. For axial geometry, the presence of separated flow areas often leads to catastrophic operations which will ultimately induce the breakdown of the compressor through surge or/and mechanical failure. Centrifugal compressors are more robust and can continue to provide work input to the flow despite the presence of separated flow areas thanks to the Coriolis force. Therefore, more complex flow structures and path to surge may occur.
For some rotation speeds, the centrifugal compressor studied in this paper exhibits a particular stalled behavior resulting from the development of an alternate stall pattern of the flow over two adjacent channels within the radial diffuser. First observed numerically by Benichou and Trébinjac [
2], this two-channel pattern has then been experimentally proven by Moënne-Loccoz et al. [
3]. No other example of such a behavior within aeronautical radial compressor has been found in the literature. But similar alternate stall pattern can nevertheless be found in hydraulic applications, either in the rotor or the stator on condition that the number of blades is even [
4,
5].
The present paper aims at analyzing the evolution of the flow topology near surge in the diffuser at different rotation speeds. In order to quantify the level of alternation of the flow field that develops in two adjacent channels of the vaned diffuser, a steady indicator called the alternate rate 𝒜 is introduced. Then, depending on the value of 𝒜 obtained, distinct flow regimes which develop in the diffuser are identified. Finally, the temporal evolution of the alternate rate 𝒜 (t) during a continuous throttling shows the link between the alternate behavior of the diffuser and the onset of deep surge.
2. Experimental Setup
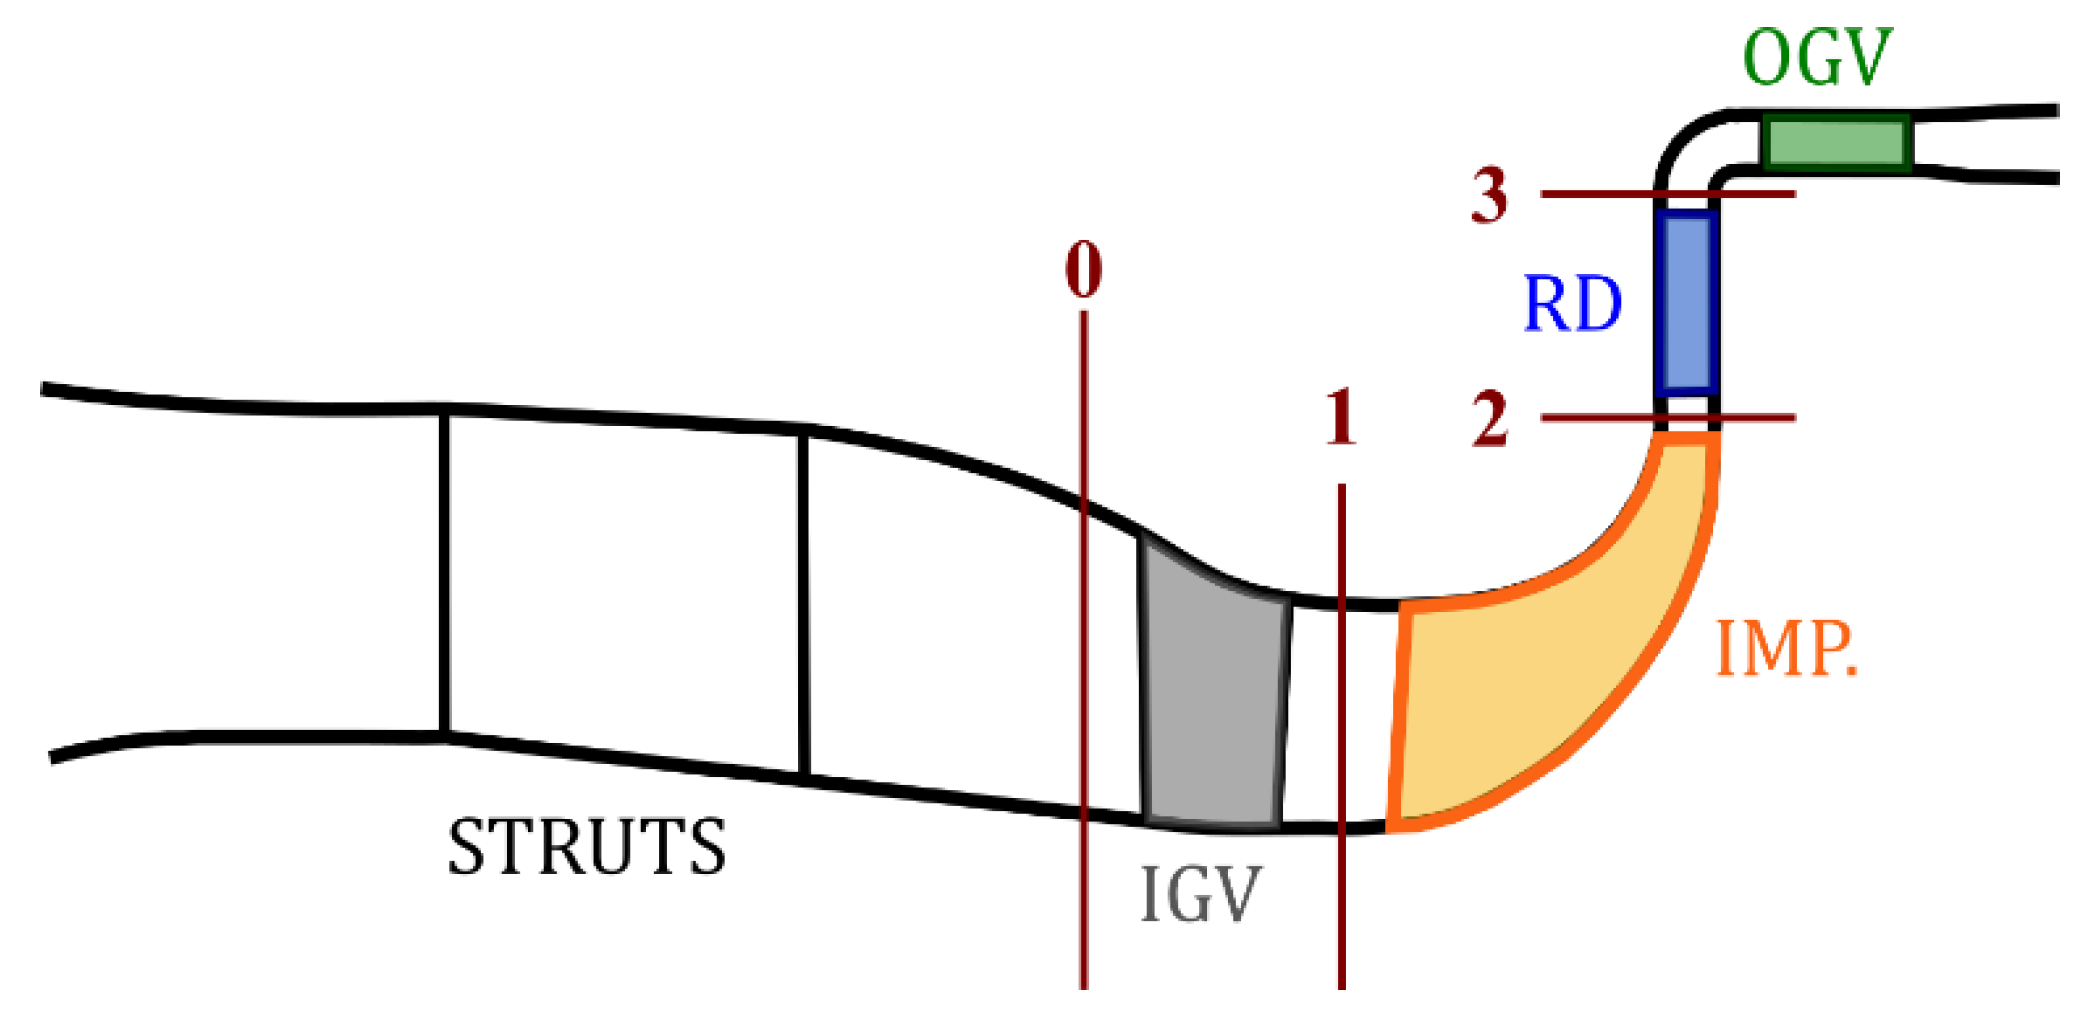
The test case is a research centrifugal compressor stage designed and built by SAFRAN Helicopter Engines. The compressor is composed of inlet guide vanes (IGV), a backswept splittered unshrouded impeller (IMP), a splittered vaned radial diffuser (RD) and axial outlet guide vanes (OGV). A meridional sketch is given in
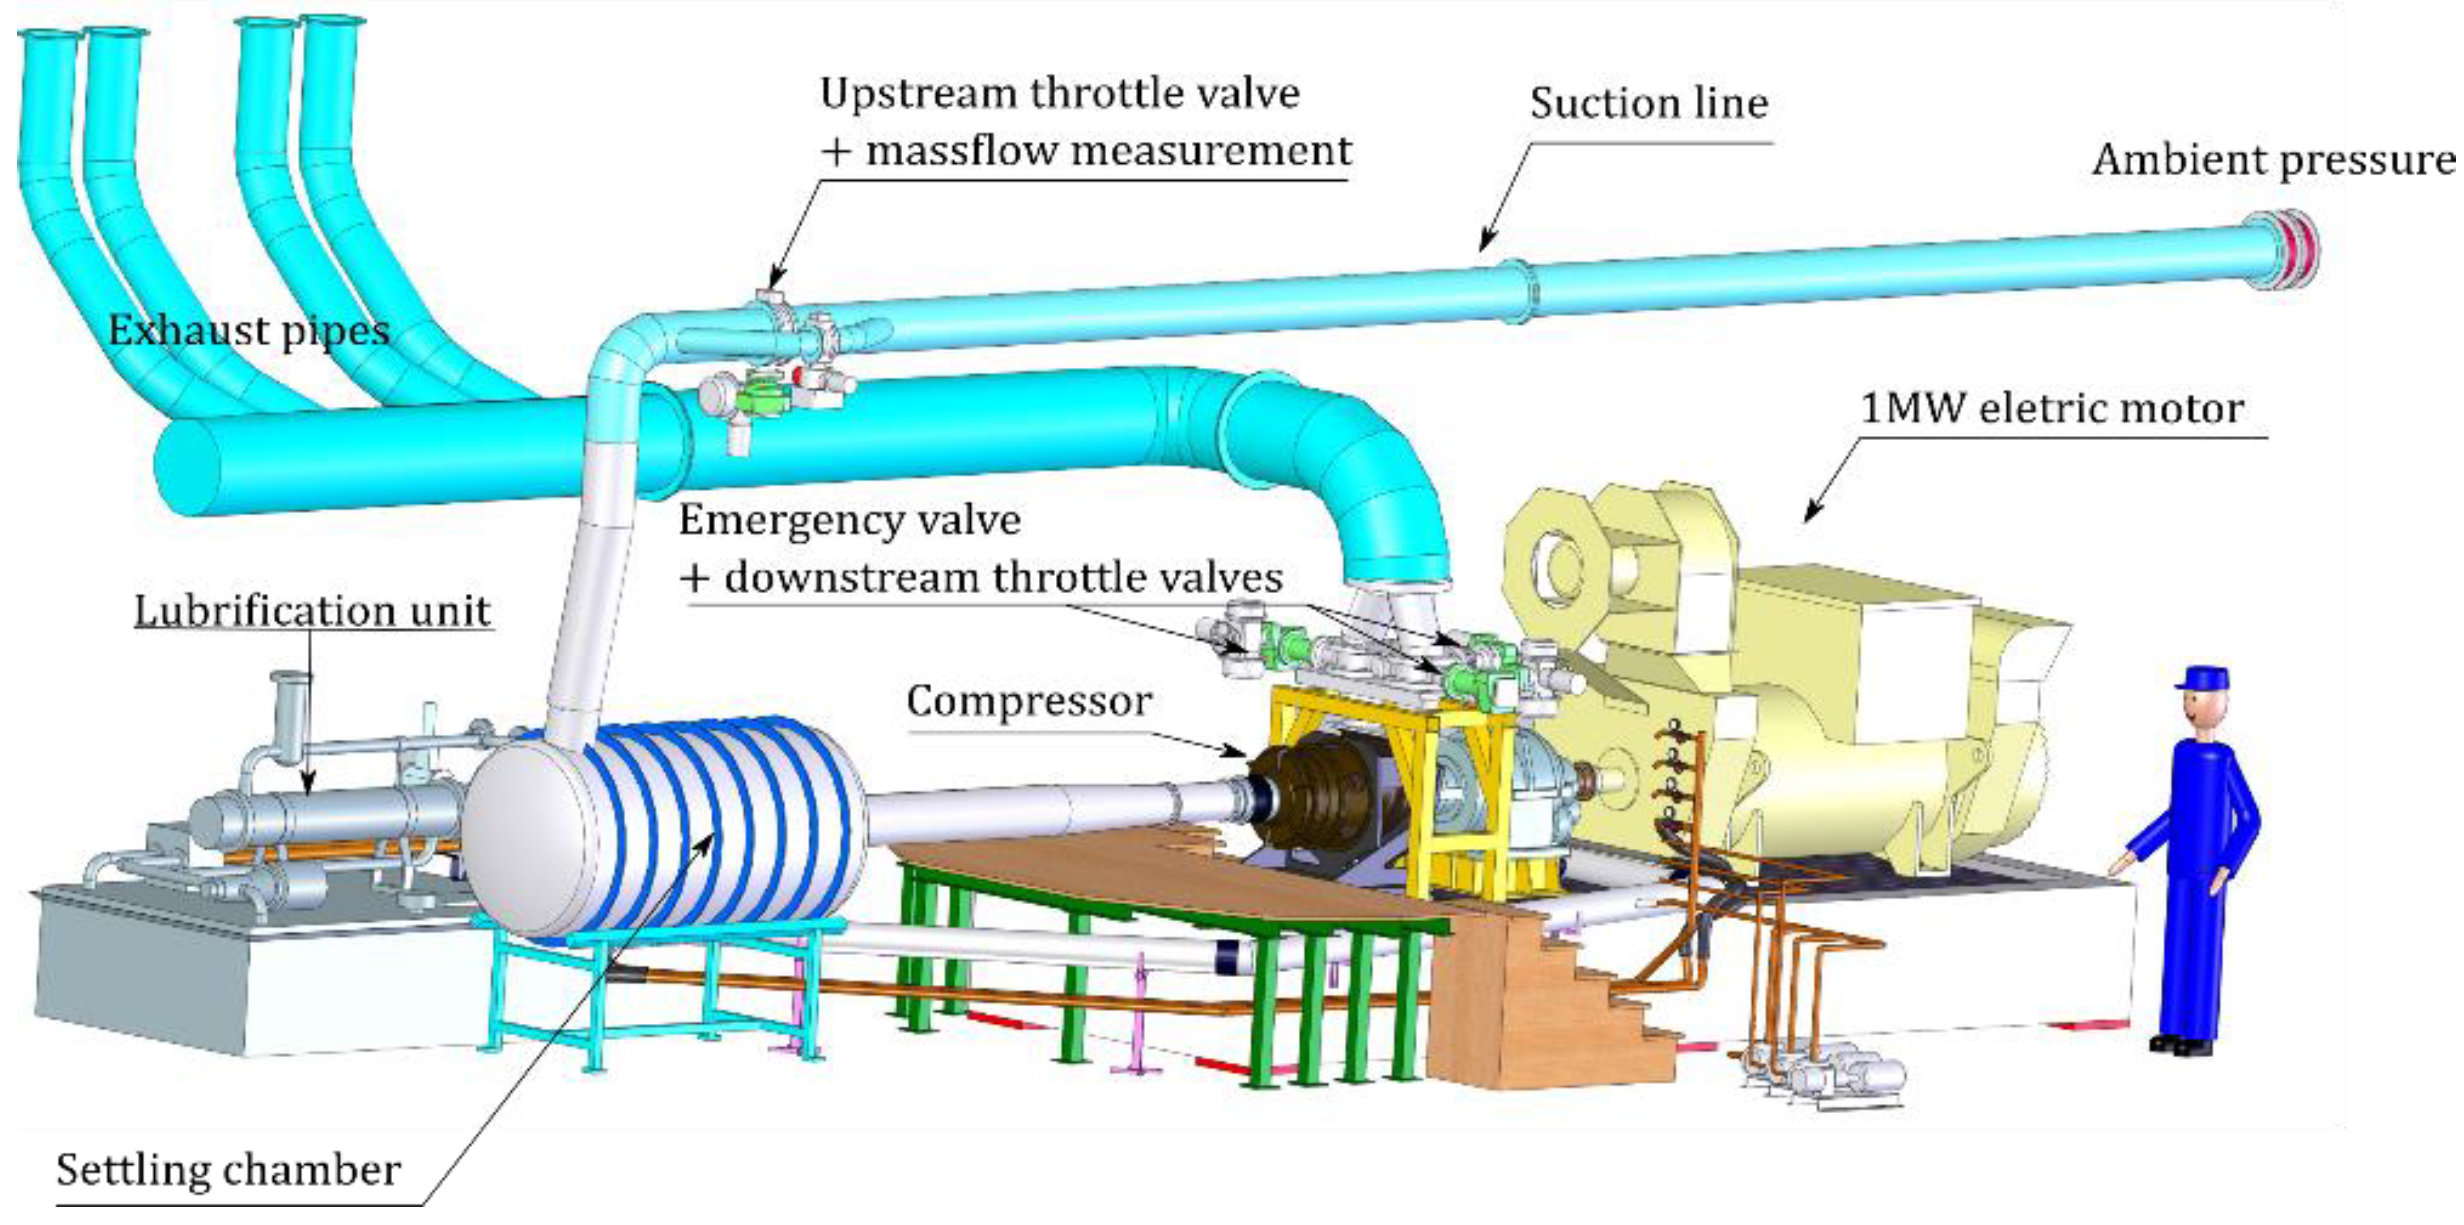
Figure 1. The compressor stage is mounted on a 1 MW test rig (
Figure 2) at the Laboratoire de Mécanique des Fluides et d’Acoustique, École Centrale de Lyon, France. An electric motor drives the impeller. The air is collected from the atmosphere and goes through the suction line after filtering. Then the air goes through the plenum chamber, an axial supply line and the compressor stage before reaching the outlet annular plenum. Two throttle valves regulate the outlet pressure and a discharge valve is used to empty the outlet plenum when the compressor surges.
The compressor stage is extensively instrumented. In total, 130 steady sensors (temperature, pressure measurements) are used for the monitoring and the performance measurements. The mass flow is measured with a diaphragm flowmeter, located upstream the plenum chamber (see
Figure 2), which gives a time-averaged value of the mass flow. The rotation speed, the flow rate, the pressure and the temperature are measured at ±0.01%, ±0.5%, ±0.05% and ±0.5 K respectively for 95% confidence intervals. These uncertainties correspond to the standard deviation of 50 samples taking into account Student’s law for maximum isentropic efficiency operating point. The uncertainties of the combined quantities are then evaluated using propagation formulas.
In order to capture the unsteady fluctuations of the flow, 52 unsteady pressure sensors manufactured by Kulite Semiconductor Product, Inc. (Leona, NJ, USA) are installed at different locations both on the shroud and the hub of the compressor. The protection grids are removed to maximize the natural frequency of the sensors allowing valid pressure measurements up to 150 kHz with an acquisition frequency of 500 kHz. The average value of the uncertainties of the fluctuations are evaluated at less than 0.7% of the peak-to-peak pressure fluctuation of the signal. Concerning the radial vaned diffuser, which is the subject of this paper, 39 unsteady pressure sensors embedded in the shroud and the hub in the different channels allow its time-dependent analysis. The projection of the unsteady pressure sensors in one passage of the radial diffuser and a scheme of the flush-mounted sensors in the hub or shroud are given in
Figure 3.
It is recalled [
2,
3] that the alternate stall pattern is characterized by a stalled passage which experiences high pressure and low absolute Mach number at its inlet and a high Mach number and low pressure zone near the suction side in the adjacent passage (
Figure 4). The time-averaged flow fields plotted in
Figure 4 have been obtained with numerical unsteady simulations (URANS) run with elsA software from ONERA (v3.4, ONERA, Châtillon, France) [
2]. These numerical flow fields are only given for an illustrative purpose of the alternate stall pattern and not for comparing the experimental and numerical results.
It is also recalled that the free passage corresponds to the channel with high mass flow rate (
Figure 4b right channel) whereas the stalled passage corresponds to the channel with low mass flow rate (
Figure 4b left channel). Furthermore, the adjective “alternate” refers to a flow pattern where one channel over two is stalled. This flow pattern is steady in the azimuthal direction: the stalled channel is always the same even if the flow separation may pulsate as explained in [
6].
As the alternate nature of the flow is most pronounced at the diffuser inlet, the steady and unsteady sensors distributed around the circumference at the leading edge of the diffuser are used in the following.
3. The Alternate Rate 𝒜
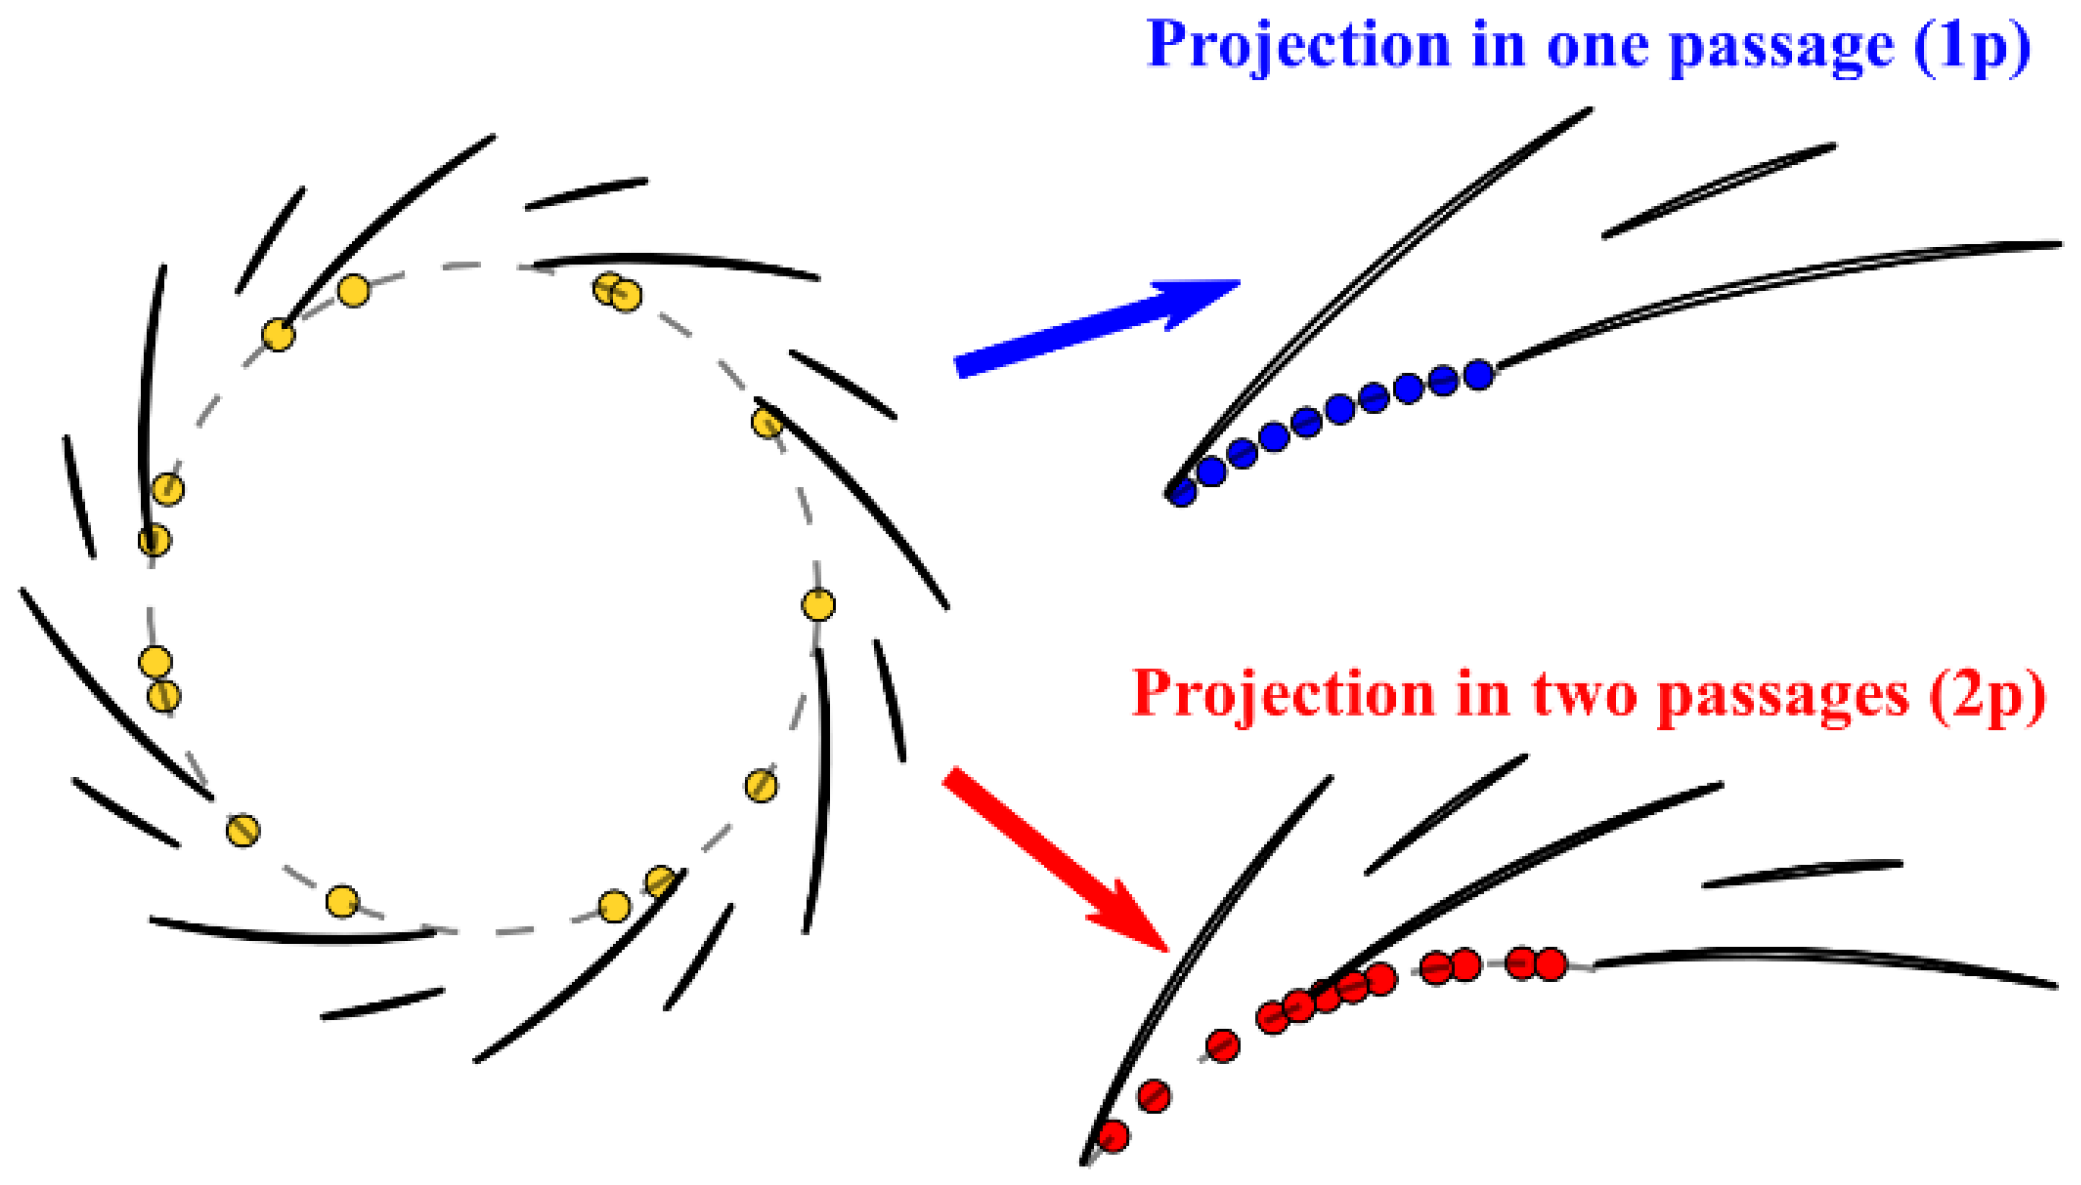
The pressure sensors distributed over the entire circumference at the diffuser leading edge may be projected onto one single passage or two adjacent passages as schematized in
Figure 5.
The projection in one passage (1p
Figure 5), obtained by resetting all the sensors on a single passage, leads to a fine and regular discretization of the circumferential profile of the inlet flow. This was anticipated when choosing the positioning of the sensors over the circumference, since the steady field is usually the same in all channels (called ‘periodic flow’ in the following). The existence of an alternate stall pattern over two channels requires that the sensor belonging channel be respected (the used projection is presented as 2p in
Figure 5). This results in a loss of discretization quality but has to be done in order to get a physical meaning as illustrated below.
A one-dimensional quantity called the alternate rate 𝒜 (Equation (1)) based on those two projections is defined to quantify the level of alternation, and then the existence—or not—of an alternate stall pattern.
with:
P1p (P2p), the pressure projected in 1 passage (2 passages);
θ, the circumferential direction;
θDR, the circumferential pitch of the diffuser.
Actually, 𝒜 compares the difference between the circumferential static pressure profiles at the diffuser inlet depending on how the pressure sensors are redistributed. The alternate rate 𝒜 (Equation (1)) is calculated from discrete values with the trapezoid method. For illustration, two static pressure maps in the diffuser extracted from the numerical simulations mentioned above are considered, one for a periodic flow (
Figure 6a), the other for an alternate flow (
Figure 6b). In order to fit with the experiments, the probing of the numerical pressure field is realized at the same exact positions as the experimental positions of the sensors. The pressure profiles in
Figure 6—right result from a projection in one passage (blue points) and in two passages (red points) for each of the fields (periodic and alternate).
If the flow in the diffuser is the same in every channel (periodic regime), the two pressure profiles overlap each other. The discrepancies only result from the difference in the discretization and 𝒜 is close to 0. In the case given in
Figure 6, 𝒜 = 0.007. On the contrary, if a two-channel pattern exists in the diffuser (alternate regime), the two profiles are very different and 𝒜 rises. The saw-tooth profile rendered by the projection in one passage (blue points) is obviously non-physical since sensors belonging alternately to different channels are considered. In this case, 𝒜 = 0.1640. Weltens et al. [
7] propose a uniformity index to quantify the uniformity of the flow as the alternate rate 𝒜. However, the uniformity index cannot be used in the present case because it is based on the velocity field. In the study of Weltens et al. [
7], the velocity field comes from numerical predictions, but the present study is based on only experimental data coming from discrete pressure sensors.
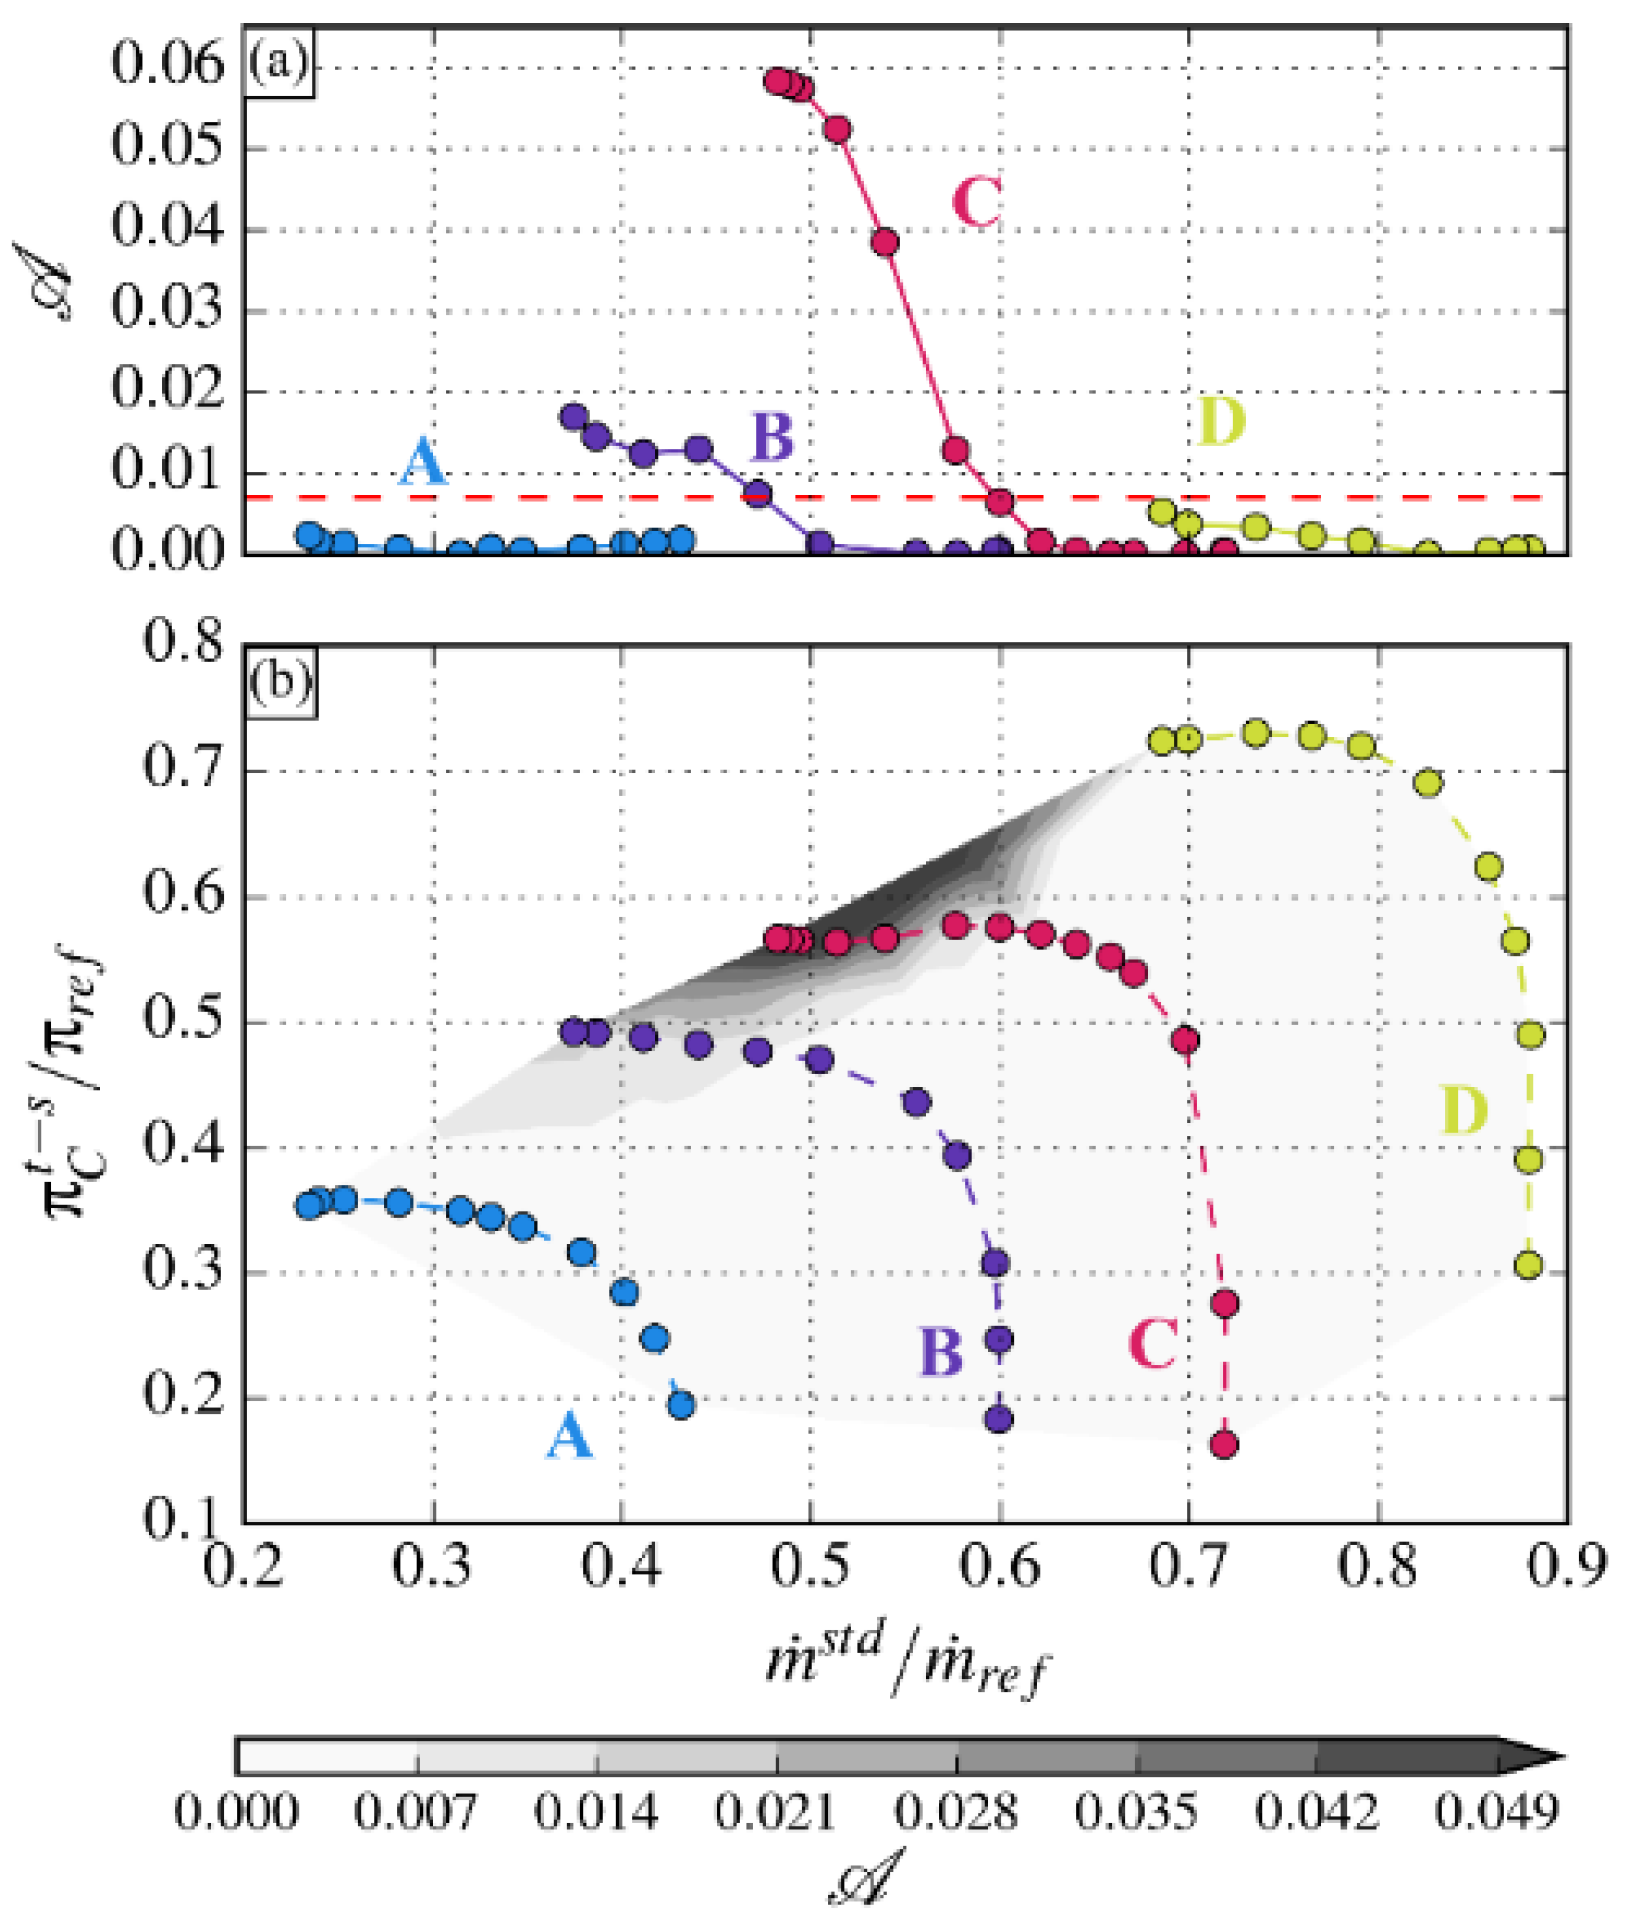
This alternate rate 𝒜 is calculated from the experimental pressure data for stabilized operating points—fixed position of the downstream throttle.
Figure 7 gives the results for four of the twelve rotation speeds investigated from speed A to speed D.
Figure 7a presents the evolution of the alternate rate versus the reduced mass flow for four rotation speeds (indicated in colors).
Figure 7b shows the alternate rate (grey contours, computed with data from the 12 rotation speeds) superimposed on the performance map of the compressor (i.e., the reduced total to static pressure ratio versus the reduced mass flow).
Three distinct regimes are associated with the alternate rate:
4. Temporal Evolution of the Alternate Flow
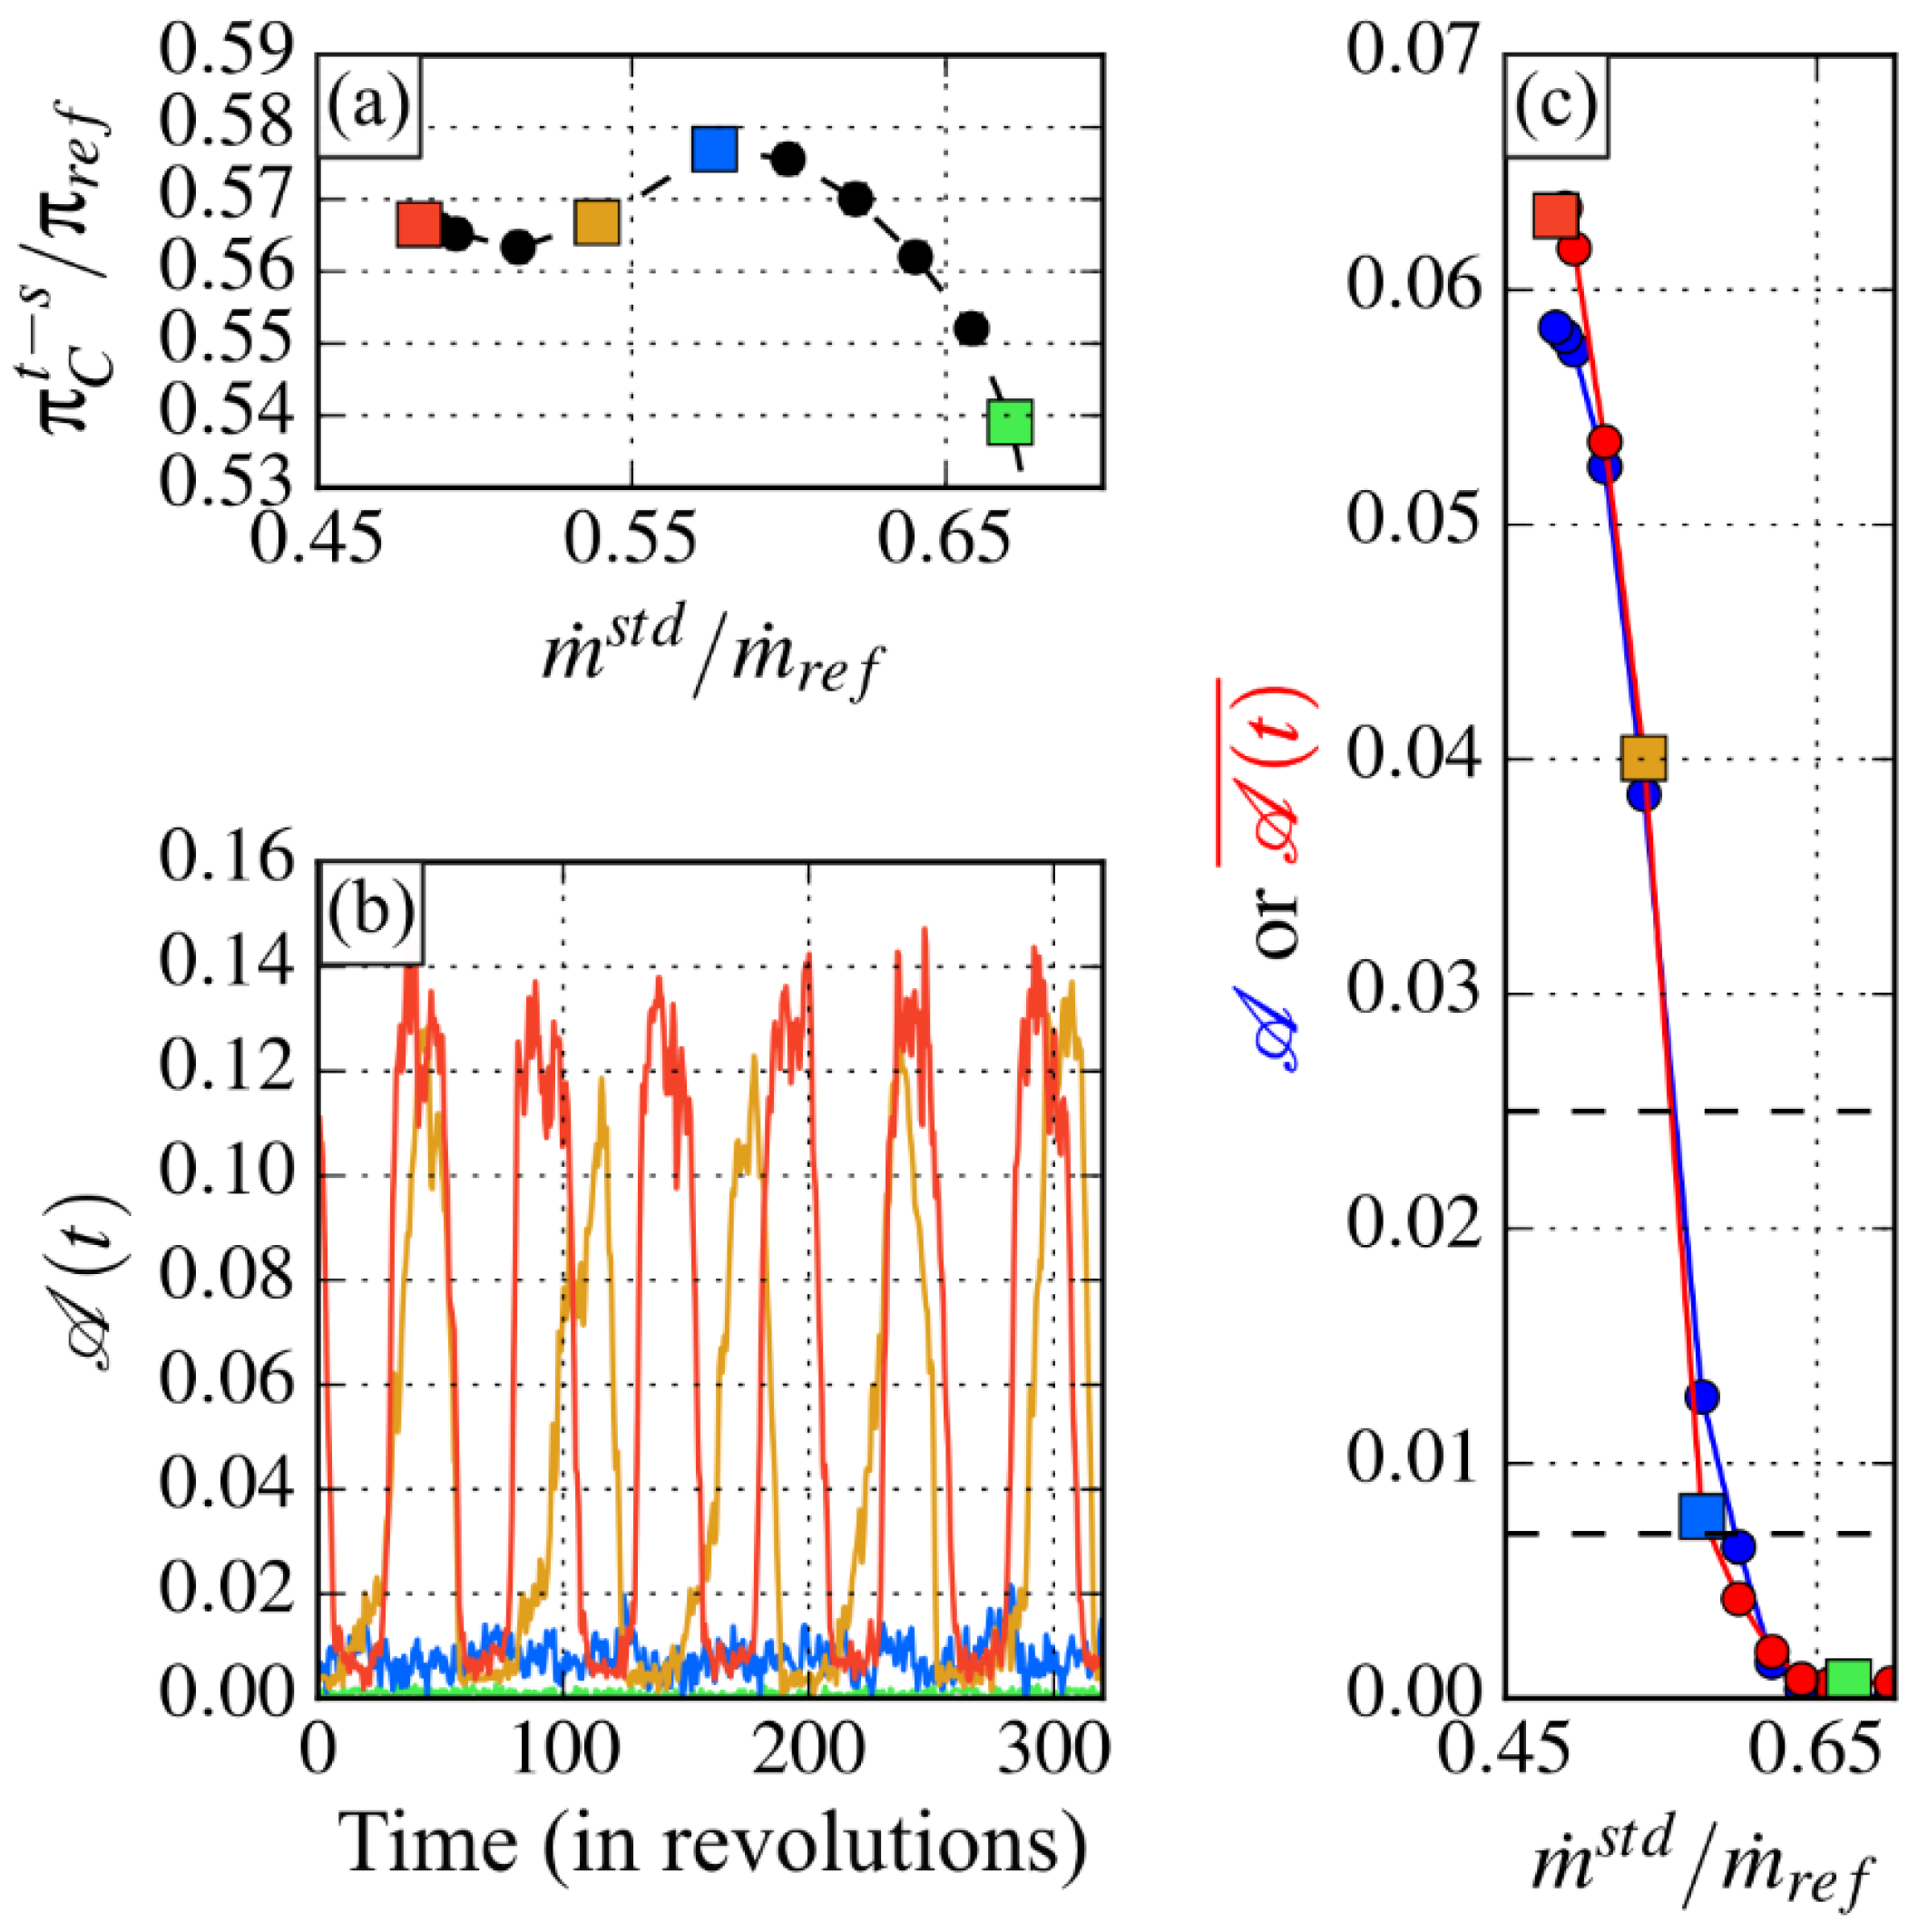
A similar methodology is applied to the signals coming from the unsteady sensors in order to evaluate the time-dependent evolution of the alternate rate 𝒜 (t) at the diffuser inlet. The results at the rotation speed C are given in
Figure 8.
Four operating points are considered and marked by colored squares in
Figure 8a.
Figure 8b shows the unsteady alternate rate 𝒜 (t) over 300 rotations for those operating points with the same color code.
Figure 8c gives the comparison of the time-averaged value of the unsteady alternate rate (in red circles) and the steady alternate rate (in blue circles). The time-averaged values are calculated using 4 s signals of the unsteady pressure sensors. For operating points experiencing mild surge, it corresponds to more than 40 periods of mild surge. The time-averaged values of 𝒜 (t) for the studied points are again represented with the colored squares.
Figure 8c shows that the evolutions of 𝒜 (t) and 𝒜 with the reduction of the mass flow are very similar. A slow growth of the rate with the reduction in mass flow is first observed and then a sudden increase for
≈ 0.57 until deep surge occurs. Thus, despite the difference in distribution between stationary and unsteady sensors, the mean alternate rate calculated from the two types of sensors is consistent and representative of the alternate functioning of the diffuser.
Its time-dependent representation given in
Figure 8b shows very different behavior depending on the operating point.
At high mass flow (green and blue operating points), 𝒜 (t) is either almost zero (green) or very low (blue) with no specific periodicity.
For < 0.57, 𝒜 (t) reveals high fluctuations of low frequency. The lower the mass flow, the higher the fluctuations and the higher the frequency. Five periods of a 9.0 Hz fluctuation are visible for the orange curve and six periods of a 11.4 Hz fluctuation are visible for the red one.
Those low-frequency fluctuations correspond to the ones detected in every section of the compressor during mild surge operation. It demonstrates that the mild surge of the compressor is deeply linked to the alternate operation of the diffuser. During a mild surge period, the diffuser successively operates in an almost periodic way, with all channels showing almost similar flow topology and then in an alternate way with a two channel pattern: one channel stalled and the other is free.
5. From Alternate Mild Surge to Deep Surge
To understand the transition from mild surge to deep surge, the evolution of the alternate operation of the diffuser during continuous throttling from stable operation to surge is analyzed.
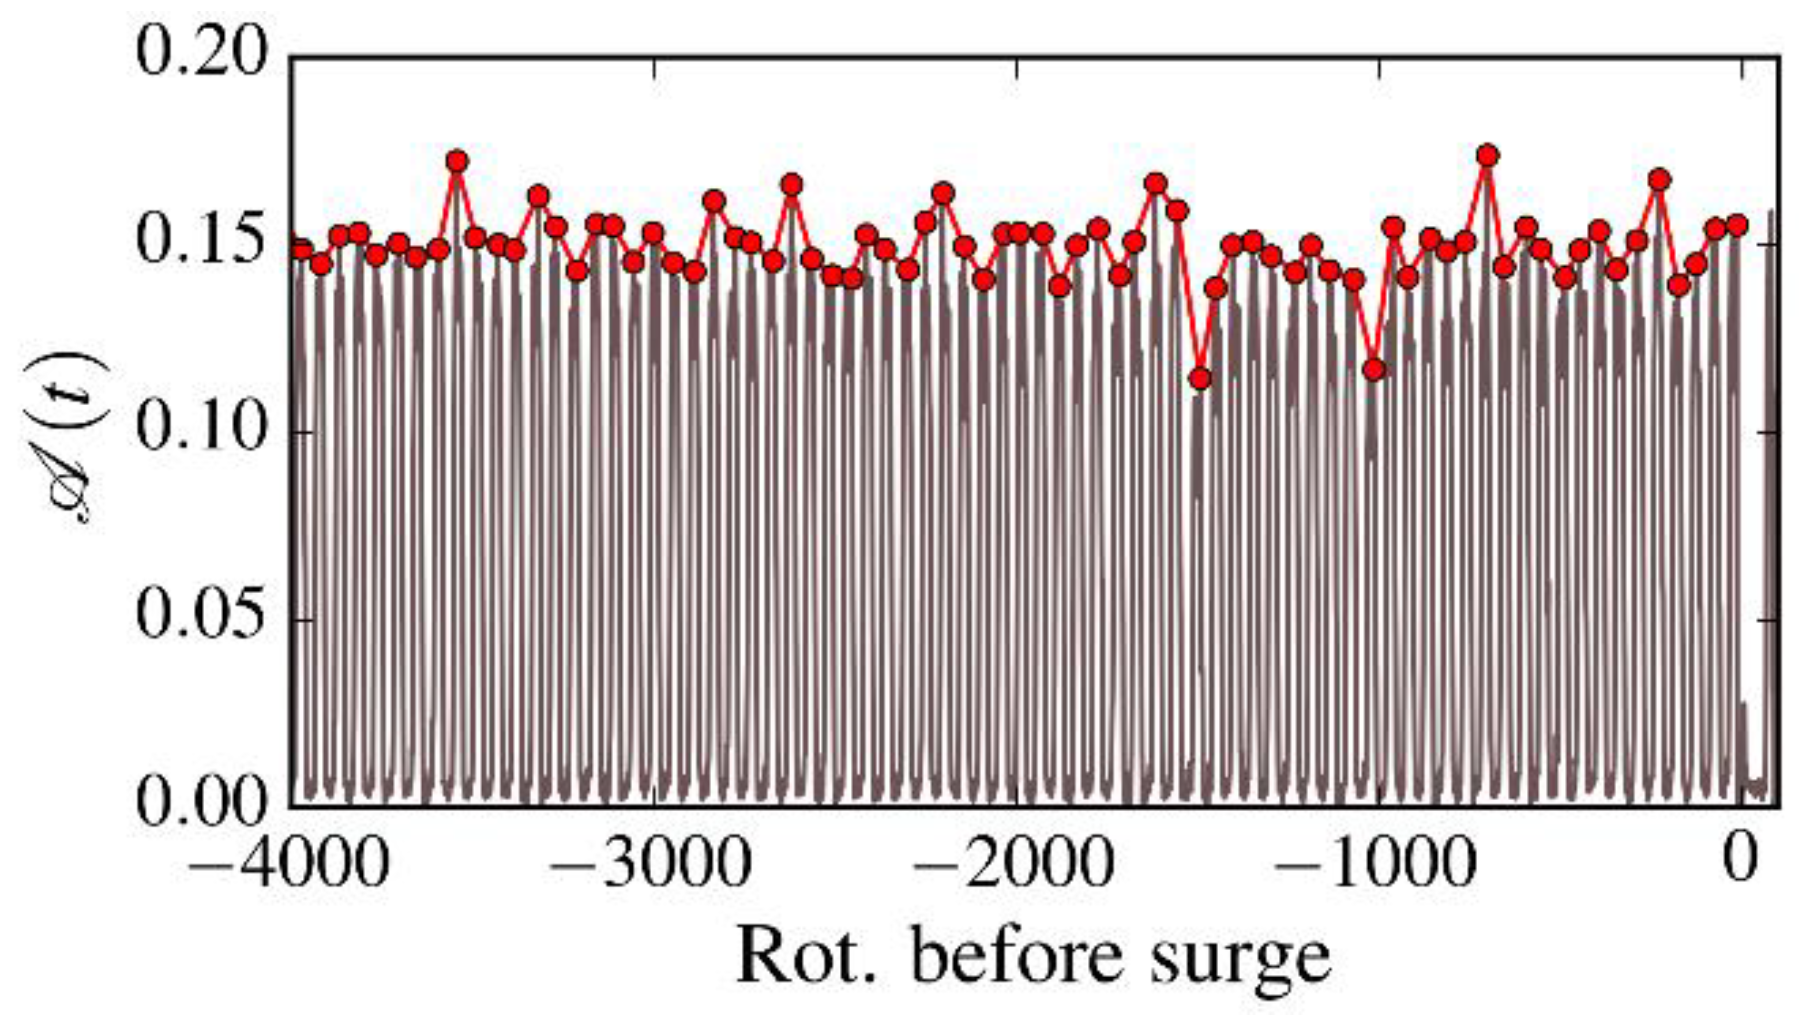
The evolution of the alternate rate 𝒜 (t) per mild surge period is given in
Figure 9. The raw level of the alternate rate is represented by the grey curve and the evolution of the maximum of each period is represented by the red curve. No clear change in the maximum alternate rate is noted. Some maxima are sporadically reached without triggering deep surge. An increase in the alternate flow behavior at the diffuser inlet does not seem to be part of the mechanism responsible for the deep surge onset of the compressor.
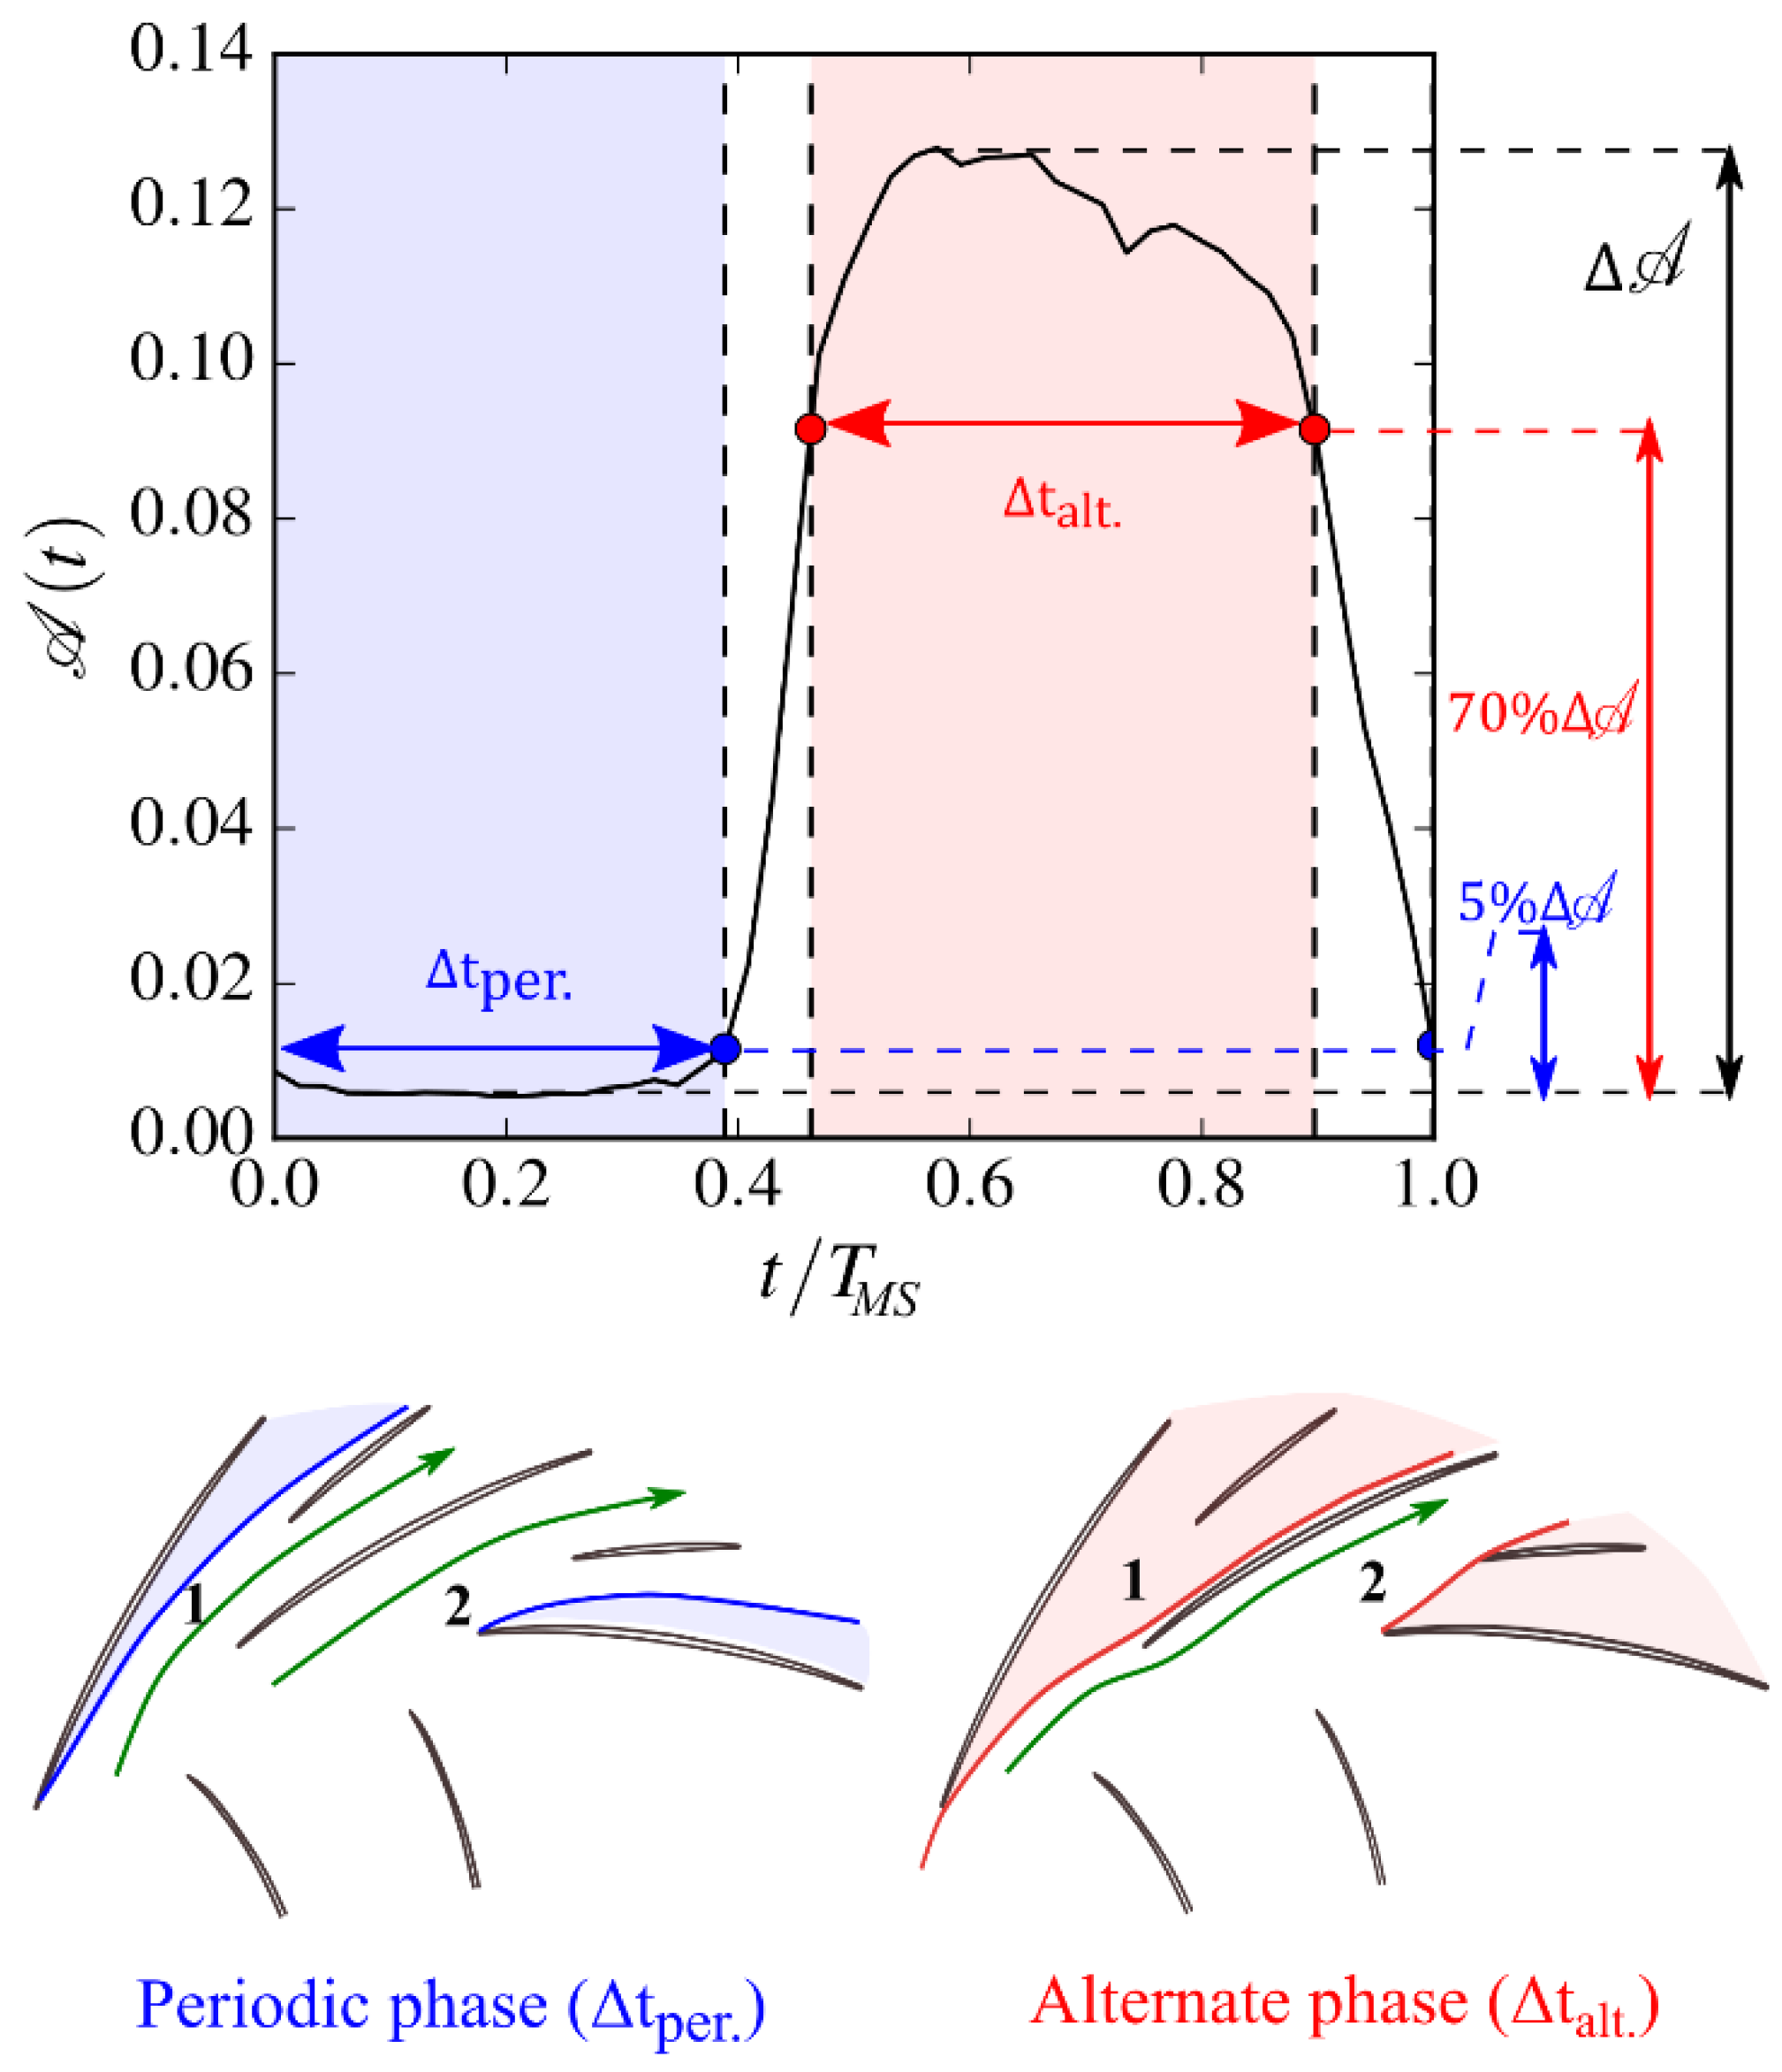
A more in-depth study of the operating phases of the diffuser and their evolution with the reduction of the flow rate is thus performed. For this purpose, a splitting of all the mild surge periods,
, during the same continuous throttle operation is carried out using the alternate rate, as shown in
Figure 10. Based on the flow topology observed in the numerical simulations (
Figure 6) for low and high values of the alternate rate, sketches are drawn in the bottom of
Figure 10 to highlight the separated flow regions (colored areas) in the diffuser.
By considering the threshold values of 5% and 70% of the maximum alternate rate value per mild surge period, two phases can be distinguished: the periodic (or almost periodic) phase in blue with a duration and the alternate phase in red with a duration .
The proportion of these durations in relation to the total mild surge period
is given in
Figure 11 as a function of time during the throttle operation. The evolution of the temporal distribution of the (almost) periodic and alternate phases is schematized by the colored arrows. As the downstream throttle is closed and the mass flow is reduced, the periodic phase duration decreases in favor of the alternate phase duration. Since the latter has a negative impact on the performance of the diffuser, this indicates a drop in the average pressure at the diffuser outlet. If it becomes too weak, the air in the downstream plenum will flow back into the compressor and the mild surge will then turn into deep surge.
To confirm this scenario, a comparison of the pressure signals at the inlet/outlet of the different compressor rows during a mild surge period and a deep surge period is presented in
Figure 12. The figures on the left show the position of the different unsteady pressure sensors. For the diffuser inlet, sensors on either side of the vane presenting the hich Mach number zone were selected because they are particularly representative of the flow alternation. The figures on the right show a zoom during the transition from mild to deep surge during continuous throttling ramp.
The differences between mild and deep surge are particularly noticeable on the pressure signals at the impeller inlet and diffuser outlet. The pressure fluctuations measured are up to four times higher during a deep surge cycle. A characteristic peak of its triggering is visible at the impeller inlet, after which very similar pressure levels are measured at the compressor inlet/outlet.
Concerning the time of each cycle, deep surge shows a period almost twice as long as the mild surge, with a measured frequency of ≈ 6 Hz against ≈ 12 Hz for mild surge. This observation is consistent with the literature [
8,
9,
10]. Mild surge, being related to the Helmholtz resonance (which frequency is calculated as proposed by Fink et al. [
8]) of the test rig without overall flow reversal, is a much shorter phenomenon than deep surge. Indeed, deep surge must take into account the time required to fill and empty the plenums.
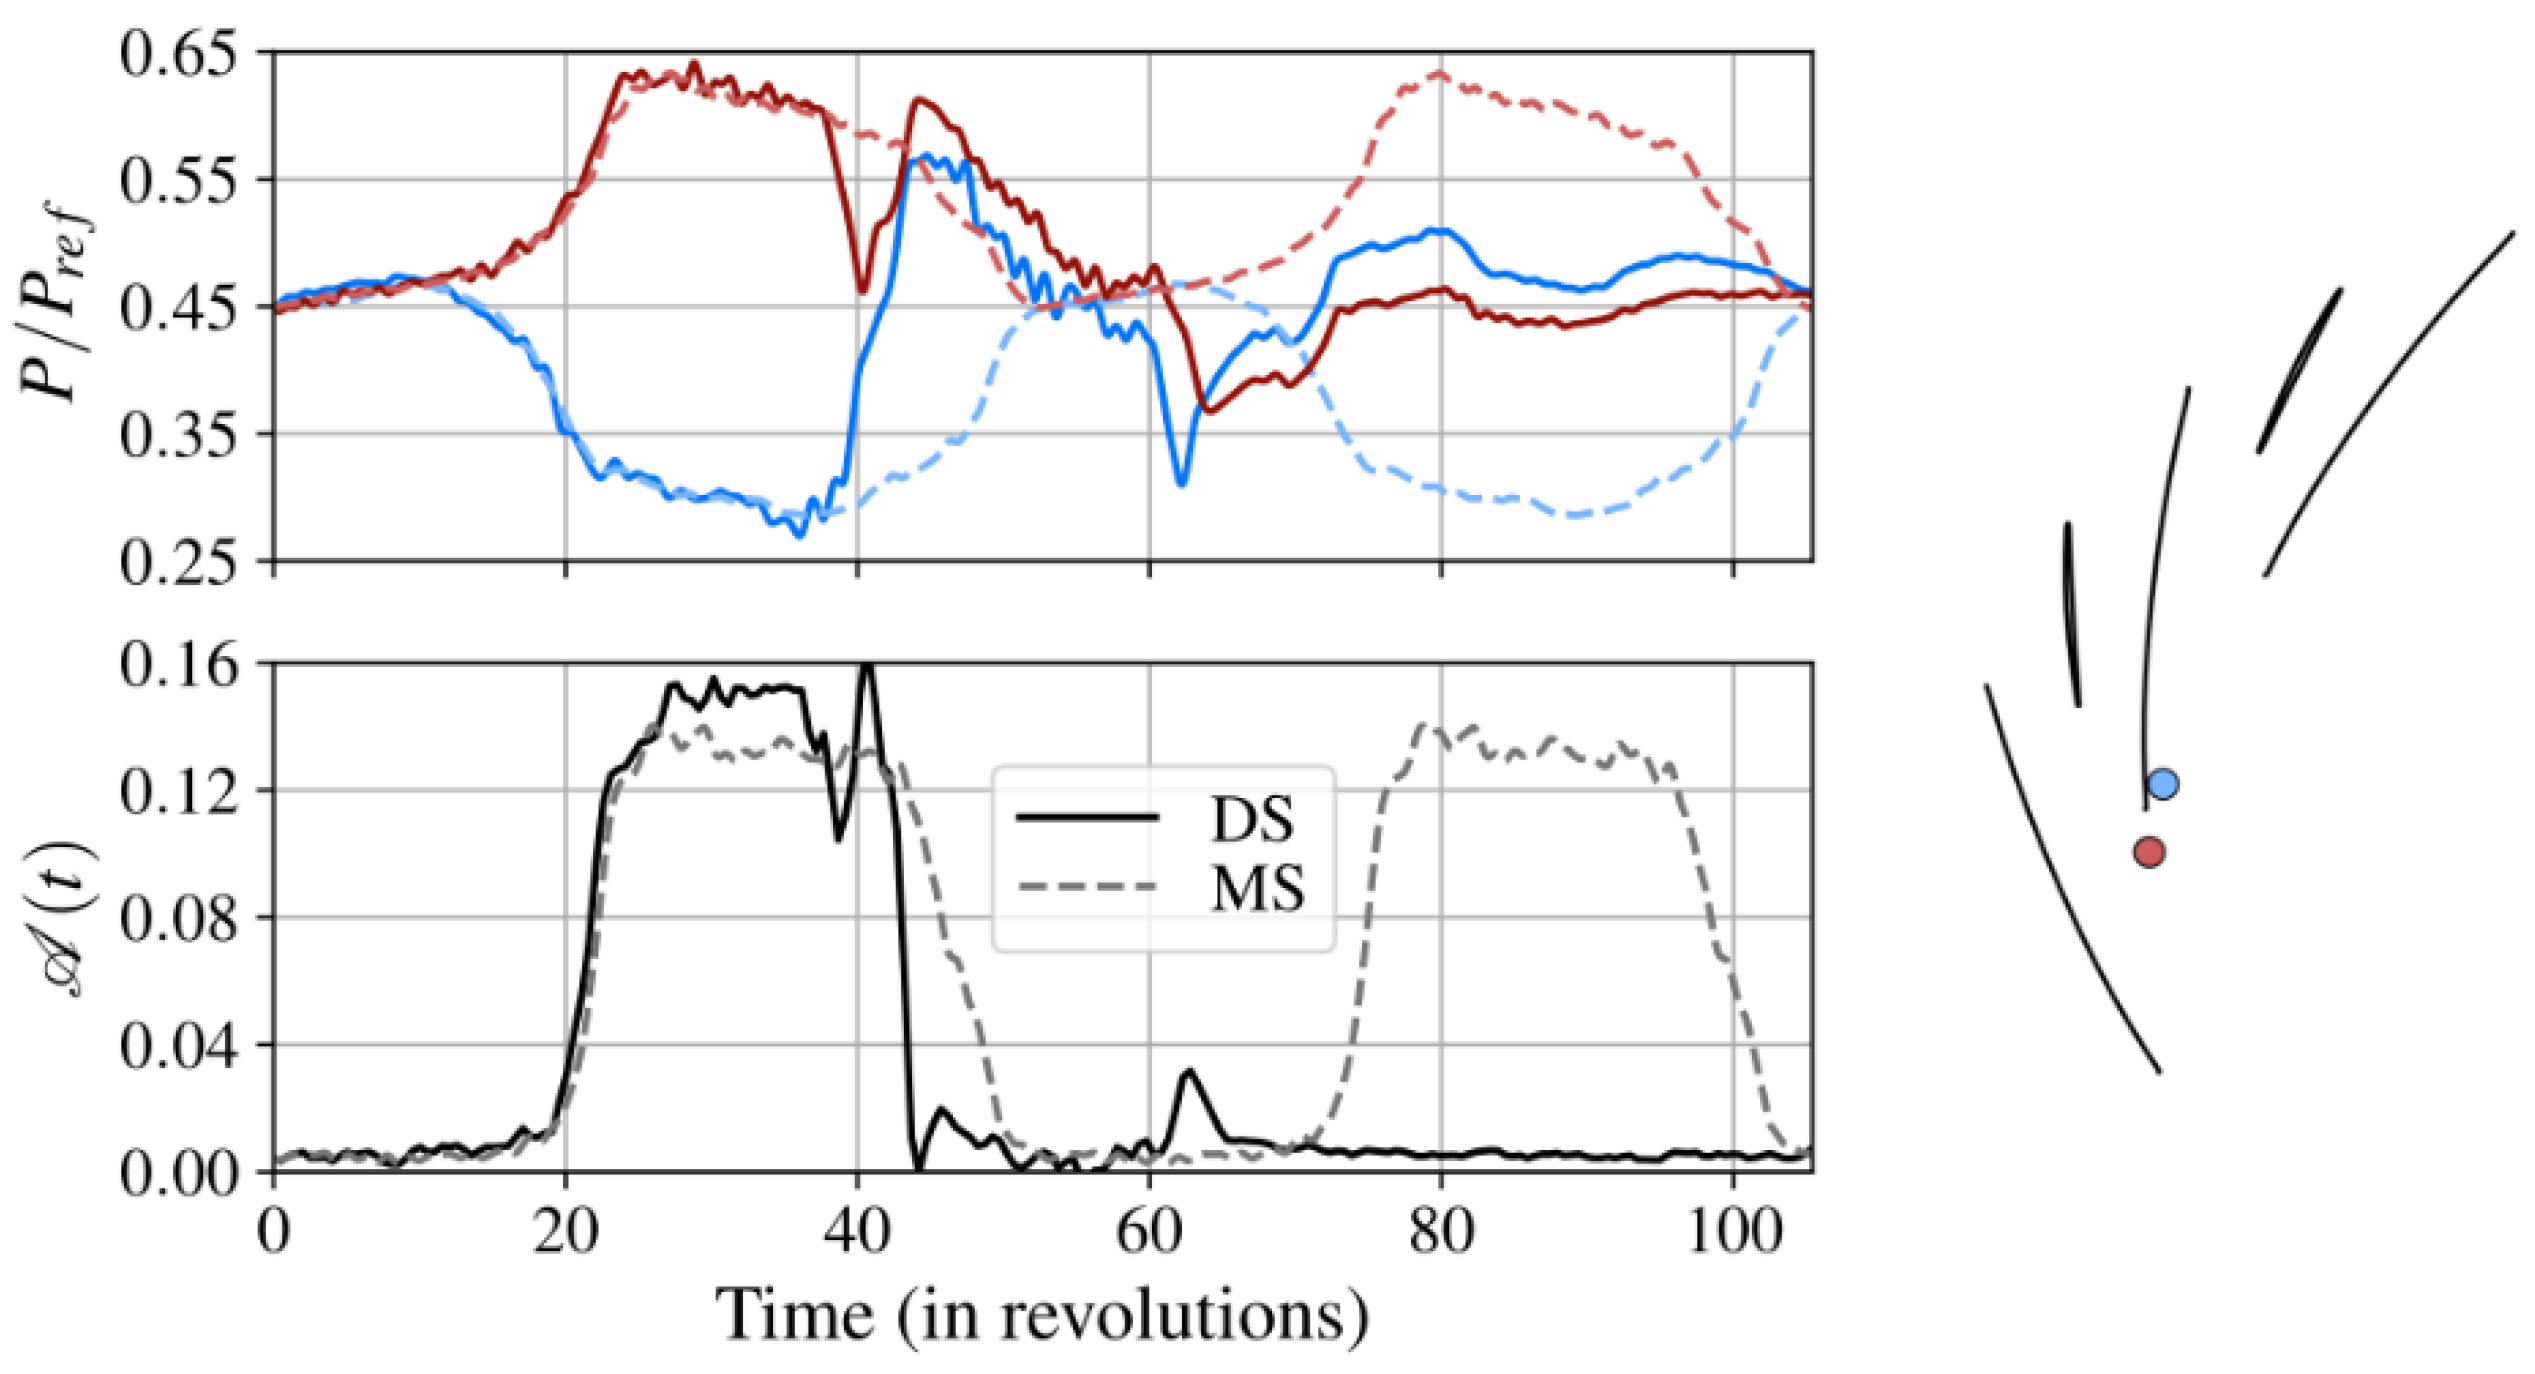
The pressure signals at the diffuser inlet give more information about the onset of deep surge. They show that a deep surge cycle starts in the same way as a mild surge cycle, with diverging pressure levels on either side of the diffuser vane. This divergence reaches a threshold corresponding to the installation of the alternate stall pattern observed during a mild surge cycle. In the case of deep surge, however, the diffuser cannot recover, and the alternate stall pattern is swept away by the flow reversal. This is highlighted in
Figure 13 which gives the evolution of the unsteady alternate rate during deep and mild surge cycles (
Figure 13—bottom) synchronized with the signals at the diffuser inlet (
Figure 13—top). The continuous lines correspond to the deep surge, while the dotted lines correspond to the mild surge.
The alternate rate evolves in the same way at the beginning of the two surge cycles. An abrupt drop of 𝒜 (t) is observed when the flow rate is reversed during deep surge cycle. The alternate rate then remains very low until a new cycle is initiated. These observations, in addition to those concerning the duration of periodic and alternate phases, indicate that the deep surge results from an accumulation effect. As the alternating phase overrides the “healthy” phase, the performance of the diffuser decreases until it reaches a limit value for which the pressure at its outlet will be insufficient to prevent air present in the downstream plenum from flowing into the compressor.
6. Discussion
The compressor referred to in this work reveals the possible setting of an alternate stall pattern over two adjacent channels in the radial diffuser at a few rotation speeds. In such an alternate stall pattern, one diffuser passage is stalled, the adjacent passage is free, and this pattern is repeated all around the circumference. Based on circumferential steady and unsteady static pressure sensors, an indicator—the alternate rate 𝒜 and 𝒜 (t)—has been developed to determine the establishment and magnitude of the alternate stall pattern.
Depending on the value of the alternate rate, three distinct flow regimes are identified:
a periodic regime for low 𝒜 values, each of the channels behaving identically,
a slightly alternate but time-independent regime for intermediate values of 𝒜, and
a highly alternate and pulsating regime for high values of 𝒜.
In this last case, the pulsation is associated with mild surge at a frequency close to the Helmholtz frequency. When the compressor is further throttled, the alternate phases become longer than the periodic phases, degrading the performance of the diffuser and ultimately leading to deep surge of the compressor.


