Article

Identification of Tartary Buckwheat Varieties Suitable for Forage via Nutrient Value Analysis at Different Growth Stages

1
College of Life and Environmental Science, Wenzhou University, Wenzhou 325035, China
2
Liangshan Prefecture Academy of Agricultural Sciences, Liangshan Prefecture, Xichang 615000, China
3
Institute of Crop Sciences, Chinese Academy of Agricultural Sciences, Beijing 100081, China
*
Authors to whom correspondence should be addressed.
Int. J. Plant Biol. 2022, 13(2), 31-43; https://doi.org/10.3390/ijpb13020005
Submission received: 25 February 2022 / Revised: 22 March 2022 / Accepted: 25 March 2022 / Published: 29 March 2022

Abstract

:
It is important to select buckwheat varieties suitable for foraging and determining their best harvest time as increasing attention was paid to the forage value of buckwheat. Here, eight tartary buckwheat varieties were identified as suitable for forage based on their potential forage value through assaying the contents of ash, crude protein, crude fiber, crude fat, acid detergent fiber, neutral detergent fiber, nitrogen free extract, calcium, phosphorus, total flavonoids, and rutin in these tartary buckwheat varieties at flowering, pustulation, and mature stages, respectively. In addition, analysis of relative feed value (RFV), relative forage quality (RFQ), and principal component analysis (PCA) based on the assayed contents was applied for comprehensive evaluation of these tartary buckwheat varieties. Results showed that all the eight tartary buckwheat varieties possessed potential high forage value as their RFV is from 121.31% to 217.39% and RFQ from 117.26% to 224.54% at all three stages. In particular, both RFV and RFQ values of PS-07 reached the highest at the flowering stage among the eight tartary buckwheat varieties, followed by CQ-3 and EWPS. Accordingly, the comprehensive scoring of principal component values of PS-07 and CQ-3 are relatively higher at the flowering stage. Our research thus revealed that the eight tartary buckwheat varieties are all suitable for forage, and also provided an experimental basis for selecting the eight tartary buckwheat varieties harvested at different growth stages for livestock forage.

1. Introduction

Buckwheat known as triangular wheat is a dicotyledonous plant of the genus Fagopyrum which belongs to the family Polygonaceae [1]. Cultivated buckwheat includes two species originating from China: common buckwheat (Fagopyrum esculentum) and tartary buckwheat (Fagopyrum tartaricum), among which tartary buckwheat is extensively cultivated as an alternative crop in China as early as 1000 BC. Tartary buckwheat is regarded as a popular food and forage crop with strong ecological adaptability due to its well-adapted, short growth period, highly resistant to barren soil and insect pests [2]. As a well-adapted and climate-resilient crop, tartary buckwheat is very suitable for planting in some remote areas of China such as Liangshan Yi Autonomous Prefecture in Sichuan Province or Qianxinan Buyei and Miao Autonomous Prefecture in Guizhou Province where barren land is not good for major crop growth, but tartary buckwheat can still grow normally [3]. In the mountain area of western China with a long history of tartary buckwheat cultivating, some tartary buckwheat landraces, especially those with amounts of large leaves, are commonly used as forage. Compared with other forages like oats and maize, tartary buckwheat has obvious advantages of production and preservation [4]. At the same time, tartary buckwheat has significant superiorities in view of forage as its nutritional ingredients not only contain common basic ingredients such as proteins, fats, celluloses and sugars, but are also rich in antioxidant flavonoids such as rutin, quercetin, catechins, and catechins which could satisfy various livestock’s demand for feed [5,6]. Due to these advantages, tartary buckwheat is deemed as a high-quality forage resource with promising development potential.
With the social development and ever-increasing world population, the current per capita consumption of animal husbandry products is also gradually rising, such as milk, milk powder and common edible meat. In addition to the increasing demand for animal husbandry products, people are paying more attention to the quality of animal husbandry products, which largely depend on the quality of forage [7]. Currently, the whole plants of crops alfalfa [8,9,10], sorghum [11], and forage maize [12] are the main forage widely used; however, they have obvious shortcomings such as low protein content and utilization rate [13], poor environmental adaptability [14], and high soil water consumption for growth [15]. In addition, these forages usually lack antibacterial and antiviral bioactive substances that could greatly benefit the health of the livestock. Although addition of some specific substances such as vitamins and antibiotics could confer to forage more comprehensive function, antibiotics added to livestock feed, after ingestion, were incompletely metabolized and poorly absorbed in the gastrointestinal tract, resulting in excretion of parent compounds and metabolites [16], which could bring potential harm to consumer’s health via livestock products. Therefore, antibiotics are currently rarely used in livestock production, which might lead to decreased disease resistance. Extensive research has been done over the last couple decades to search for natural alternatives to in-feed antibiotics, and some plant compounds have been identified to have great potentials [17]. Tartary buckwheat, when used as forage, might be full of nutritional value since its component could not only satisfy the livestocks’ need for basic nutrients, but also improve the livestocks’ ability to resist disease as it was reported that buckwheat flavonoids displayed anti-oxidation [18], anti-bacteria [19], and anti-virus activities [20]. Studies have indicated that both the whole tartary buckwheat plants and grains can be used as potential high-quality forages. Cui et al. confirmed that tartary buckwheat could alleviate rumen methane emissions by improving the morphology of gut microbes [21]. Scuderi et al. reported that adding buckwheat ingredients to forage could effectively improve the morphology of intestinal microbes in ruminant animals by affecting the fermentation activity of ruminant rumen microbes [22]. Amelchanka et al. also found that addition of a proper amount of buckwheat to forage could improve the palatability and productivity of dairy cows [23]. Therefore, finding and breeding novel tartary buckwheat varieties suitable for forage might be of great value.
In our previous research aiming to select buckwheat varieties suitable for forage, eight tartary buckwheat varieties with large leaves, tall plants, thick stems, more branches, and high production of the whole plant were bred in Liangshan Yi Autonomous Prefecture of Sichuan Province, including Xiqiao No. 1 (XQ-1), Youqiao No. 1 (YQ-1), Meng-09125 (M-09125), Chuanqiao No. 3 (CQ-3), Zhaoku No. 1 (ZK-1), Ewu Pedgree selection (EWPS), Buyue (BY), and Pedgree selection-07 (PS-07). In order to further clarify the potential forage application value of these eight tartary buckwheat varieties, so as to select the tartary buckwheat varieties that are relatively suitable for forage use, especially considering that the component content of the whole plant of tartary buckwheat in different growth stages, including some very important flavonoids and other active components change greatly with the change of growth stage, the main nutrients related to forage use and the contents of flavonoids with important biological activities in these eight tartary buckwheat varieties at different growth stages were determined. In addition, a more comprehensive analysis and evaluation was carried out using relative forage value (RFV) and relative feed quality (RFQ) to further evaluate the potential forage value of these eight tartary buckwheat varieties. This study provided a strong theoretical basis for the selection of these eight tartary buckwheat varieties as forage, especially in the harvest stage of forage.

2. Materials and Methods

2.1. Plant Material

Whole-crop of eight tartary buckwheat varieties including Xiqiao No. 1 (XQ-1), Youqiao No. 1 (YQ-1), Meng-09125 (M-09125), Chuanqiao No. 3 (CQ-3), Zhaoku No. 1 (ZK-1), Ewu Pedgree selection (EWPS), Buyue (BY), and Pedgree selection-07 (PS-07) were from Mengzi feed factory, Zhaojue County, Liangshan Yi Autonomous Prefecture, Sichuan Province, China. The samples of buckwheat varieties were harvested and dried in the whole field, and 1.0 kg of samples were randomly selected for quality testing and analysis from each field to ensure that the samples were representative.

2.2. Nutritional Analysis

2.2.1. Materials Pretreatment

Tartary buckwheat samples were dried at 65 °C for 72 h (Shanghai Longyue Co., Ltd., Shanghai, China), smashed, and then ground through a 0.27 mm screen (Wenzhou Dingli Medical Instrument Co., Ltd., Wenzhou, China).

2.2.2. Ash Content

Ash content was determined according to the procedure by Neu et al. [24]. In brief, 5.0 g of each tartary buckwheat sample were charred and then incinerated in the muffle furnace (Shanghai Lichenkeyi Co., Ltd., Shanghai, China) at 550 °C for 5.5 h. The ash was cooled at room temperature and weighed.

2.2.3. Crude Protein Content

CP was determined according to the procedure by the Folin–Ciocalteu method. Briefly, 0.3 g of each plant sample were digested with 16 mL 1.0 mol/L NaOH at 50 °C for 4 h. The product was diluted by 500 times. In addition, 4 mL Folin-Phenol reagent A were added to 0.8 mL diluted sample and then placed at 37 °C water bath (Hangzhou Bioer Technology Co. Ltd., Hangzhou, China) for 10 min, followed by addition of 0.4 mL Folin-Phenol regent B and for another 30 min. Bovine Serum Albumin (Beyotime Biotechnology Co., Ltd., Shanghai, China) was used as the standard. CP content was determined by the absorbance at 750 nm using an ultraviolet spectrophotometer (Shanghai Meipuda instrument Co., Ltd., Shanghai, China).

2.2.4. Crude Fiber Content

CF was determined according to the procedure by D’Heer et al. [25]. Furthermore, 1.0 g of each plant sample was weighed into filter bags. In addition, 150 mL 0.13 ± 0.05 mol/L H2SO4 and 150 mL 0.23 ± 0.05 mol/L KOH of each sample were pre-heated to 95 °C in the reaction vessel, respectively, after submerging the samples, brought to a boiling point by a heating plate (Shuzhou Guofei Laboratory Instrument Co., Ltd., China) as soon as possible. Digestion times, 30 min for both steps, were measured from the moment the samples were put in the vessel. After the first and the second digestion, samples were washed respectively two and three times for 5 min with boiling water. After expelling the excess water, the bags were soaked in acetone for 3–5 min. The air-dried filter bags were completely dried for 4 h at 103 °C (Shanghai Longyue Co., Ltd., China) and ashed for 2 h at 550 °C. CF-values were corrected for ash content.

2.2.5. Crude Fat Content

EE was determined according to the procedure by Thiex et al. [26]. In addition, 2.0 g of each plant sample were dissolved in 10 mL 12 mol/L HCL with water bathed at 70–80 °C for 50 min (Hangzhou Bioer Technology Co. Ltd., China). Furthermore, 10 mL ethanol and 25 mL absolute ether were mixed with the sample by shaking, and then allowed it to stand for 15 min. Water bathed at 100 °C (Hangzhou Bioer Technology Co. Ltd., China) to make the samples be dry. Finally, the samples were completely dried for 2 h at 105 °C (Shanghai Longyue Co., Ltd., China), and then weighed.

2.2.6. Acid or Neutral Detergent Fiber Content

ADF and NDF were determined according to the procedure by D’Heer et al. [25]. In addition, 1.0 g of each plant sample were weighed into filter bags, after submerging in 2 L preheated acid detergent solution and neutral detergent solution at 95 °C by water bath (Hangzhou Bioer Technology Co. Ltd., China), respectively, brought to a boiling point by a heating plate (Shuzhou Guofei Laboratory Instrument Co., Ltd., China) as soon as possible. After digestion for 60 min, bags were washed 3 times for 5 min with boiling water and then, after removal of the free water, soaked in acetone for 3 min with agitation. Finally, the air-dried filter bags were completely dried for 4 h at 103 °C (Shanghai Longyue Co., Ltd., China) and ashed for 2 h at 550 °C (Shanghai Lichenkeyi Co., Ltd., China).

2.2.7. Nitrogen Free Extract Content

The percentage NFE was then calculated by the laboratory using the formula NFE = 100 − (crude protein + crude fat + crude fiber + moisture + ash) % [27], moisture was determined according to the procedure by Chinese standard GB/T 6435-2014. In addition, 5.0 g of each plant sample were weighed and completely dried for 4 h at 103 °C.

2.2.8. Phosphorus Content

Phosphorus content was determined according to the Chinese standard (GB/T 6437-2018). Furthermore, 5.0 g of each plant sample were processed as 4.2.2, dissolved with 10 mL 50% HCL and made it to 100 mL with water. In addition, 1 mL supernatant was mixed with 10 mL Vanadium ammonium molybdate. Phosphorus content was run through an ultraviolet spectrophotometer (Shanghai Meipuda Instrument Co., Ltd., China) to determine the absorbance at 400 nm.

2.2.9. Calcium Content

Calcium content was determined according to the procedure by Chinese standards (GB/T 6436-2018). In addition, 5.0 g of each plant sample were processed as 4.2.2, dissolved with 10 mL 25% HCL and few drops of HNO3, boiled and made it to 100 mL with water. Furthermore, 10 mL of sample were added with 50 mL H2O, 10 mL starch solution, 2 mL Triethanolamine (C2H8N2), 1 mL Ethylenedia-mine (EDA, C₆H15NO₃), and a drop of Malachite Green (C23H25CN2), added with 3 drops of calconcarboxylic acid; then, Ca content was assayed by titration with EDTA.

2.2.10. Total Flavonoids Content

Total flavonoids were determined according to the procedure by Bhandari et al. [28]. All samples were dissolved in 80% methanol (v/v) with supersonic extraction. Rutin (Beijing Solarbio Science & technology Co., Ltd., Beijing, China) was used as standard. In addition, 2.5 mL of each extract (80 mg/mL) were mixed with 5 mL 0.1 mol/L AlCl3 and 7.5 mL 1 mol/L CH3COOK into 25 mL volumetric flask after centrifugation, diluted with 80% methanol to volume. The absorbance read at 420 nm after 30 min.

2.2.11. Rutin Content

The rutin present in the tartary buckwheat was quantified by HPLC [29]. All samples were dissolved in 80% methanol (v/v) with supersonic extraction, and filtered by 0.45 μm membrane for injection. Rutin (Beijing Solarbio Science & Technology Co., Ltd., Beijing, China) was used as the standard. Eclipse Plus C18 5 μm, 4.6 mm × 250 mm column was used in this HPLC (LC-20AT, Shimadzu, Shang hai, China.) analysis with a flow rate of 0.5 mL/min. The mobile phase consisted of (A) ultrapure water and (B) methanol with the following gradient: 50% B (0.01–18 min), 80% B (18.01–21 min), 50% B (21.01–30 min). The rutin was detected at a wavelength of 350 nm.

2.3. Relative Feed Value and Relative Forage Quality

Dry matter intake, digestible dry matter, total digestible nutrients, relative feed value, and relative feed quality were calculated by formulas [30]:
DMI (%BW) = 120/NDF (%DM),
DDM (%DW) = 88.9 − 0.779 × ADF (% DM),
TDN = 82.38 − (0.751 × ADF),
RFV = DMI (% BW) × DDM (% DM)/1.29,
RFQ = TDN × DMI/1.23.

2.4. Statistical Analyses

Microsoft Excel 2016 was used for data input, processing of the original data, and basic statistical analysis. IBM SPSS Statistics 23 (SPSS software version 23) was used to perform one way analysis of variance (ANOVA) to assess the difference of forage nutritional quality of each tartary buckwheat growth period, and principal component analysis (PCA) was used to screen the principal components of tartary buckwheat samples by using the correlated nutrient indicators of the samples. Fisher’s Least Significant Difference (LSD) was used to compare the means when the treatment effects were significant at α = 0.05, and the data are present as the mean ± standard errors of three independent replicates.

3. Results

3.1. Nutritional Values of Eight Tartary Buckwheat Varieties

Results in Table 1 showed that the content of ash in eight tartary buckwheat varieties at the flowering stage varied between 14.54% and 17.49%, the content of crude protein (CP) between 3.15% and 7.08%, the content of fiber (CF) between 6.00% and 13.50%, the content of crude fat (ether extract, EE) between 3.95% and 5.39%, the content of acid detergent fiber (ADF) between 24.39% and 39.07%, the content of neutral detergent fiber (NDF) between 29.92% and 41.92%, the content of nitrogen free extract (NFE) between 52.25% and 59.99%, the content of calcium between 0.21% and 0.35%, and the content of phosphorus between 0.22% and 0.40%. In terms of the content of crude protein and fat, CQ-3 and PS-07 at the flowering stage might have relatively more advantages as forage. Ash in eight tartary buckwheat varieties at the pustulation stage varied between 7.70% and 12.65% CP between 3.80% and 5.93%, CF between 9.04% and 12.85%, EE between 3.70% and 4.54%, ADF between 28.14% and 33.07%, NDF between 31.77% and 50.04%, NFE between 56.06% and 65.99%, calcium between 0.21% and 0.32%, and phosphorus between 0.23% and 0.38% (Table 1). The advantage of CQ-3 and PS-07 at the pustulation stage as forage is, however, not obvious in terms of the content of crude protein and fat. Ash in eight tartary buckwheat varieties of the mature stage varied between 7.38% and 11.76%, CP between 3.44% and 6.96%, CF between 7.45% and 20.20%, EE between 3.42% and 5.39%, ADF between 33.20% and 42.02%, NDF between 31.34% and 45.17%, NFE between 51.52% and 68.35%, calcium between 0.20% and 0.32%, and the phosphorus between 0.16% and 0.25% (Table 1). The advantage of CQ-3 at the mature stage as forage becomes relatively more obvious in terms of the content of fat. Overall, ash of PS-07 at the flowering stage is the highest of 17.49%, CP of CQ-3 at the flowering stage is the highest of 7.08%, CF of YQ-1 at the mature stage is the highest of 20.20%, EE of PS-07 at the flowering stage is the highest of 5.39%, ADF of EWPS at the mature stage is the highest of 42.02%, NDF of ZK-1 at the pustulation stage is the highest of 50.04%, NFE of M-09125 at the mature stage is the highest of 68.35%, calcium content of CQ-3 at the flowering stage is the highest of 0.35%, phosphorus content of ZK-1 at the flowering stage is the highest of 0.40%.

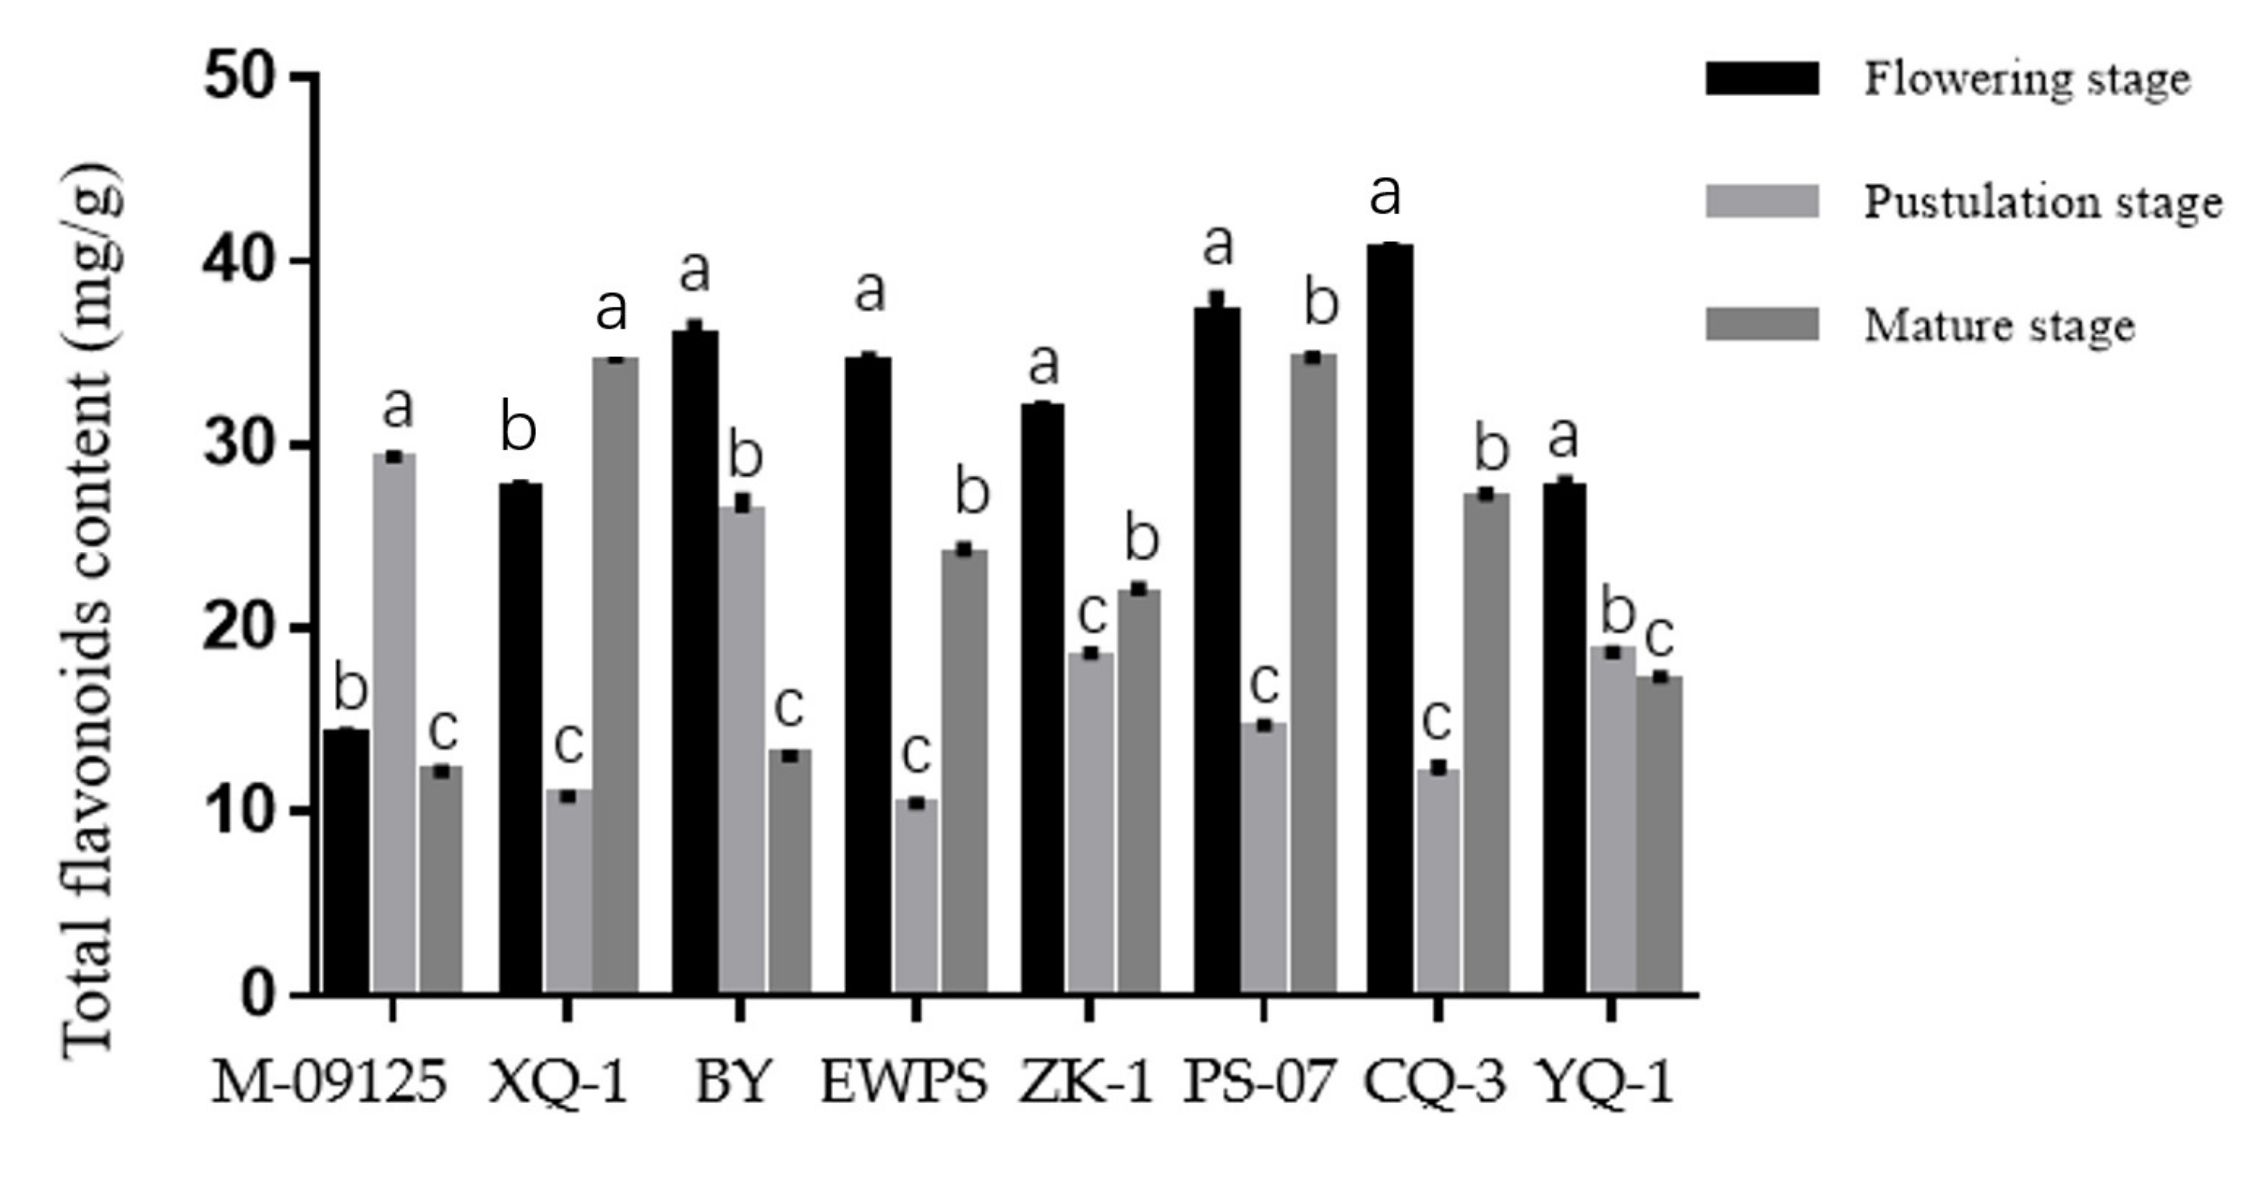
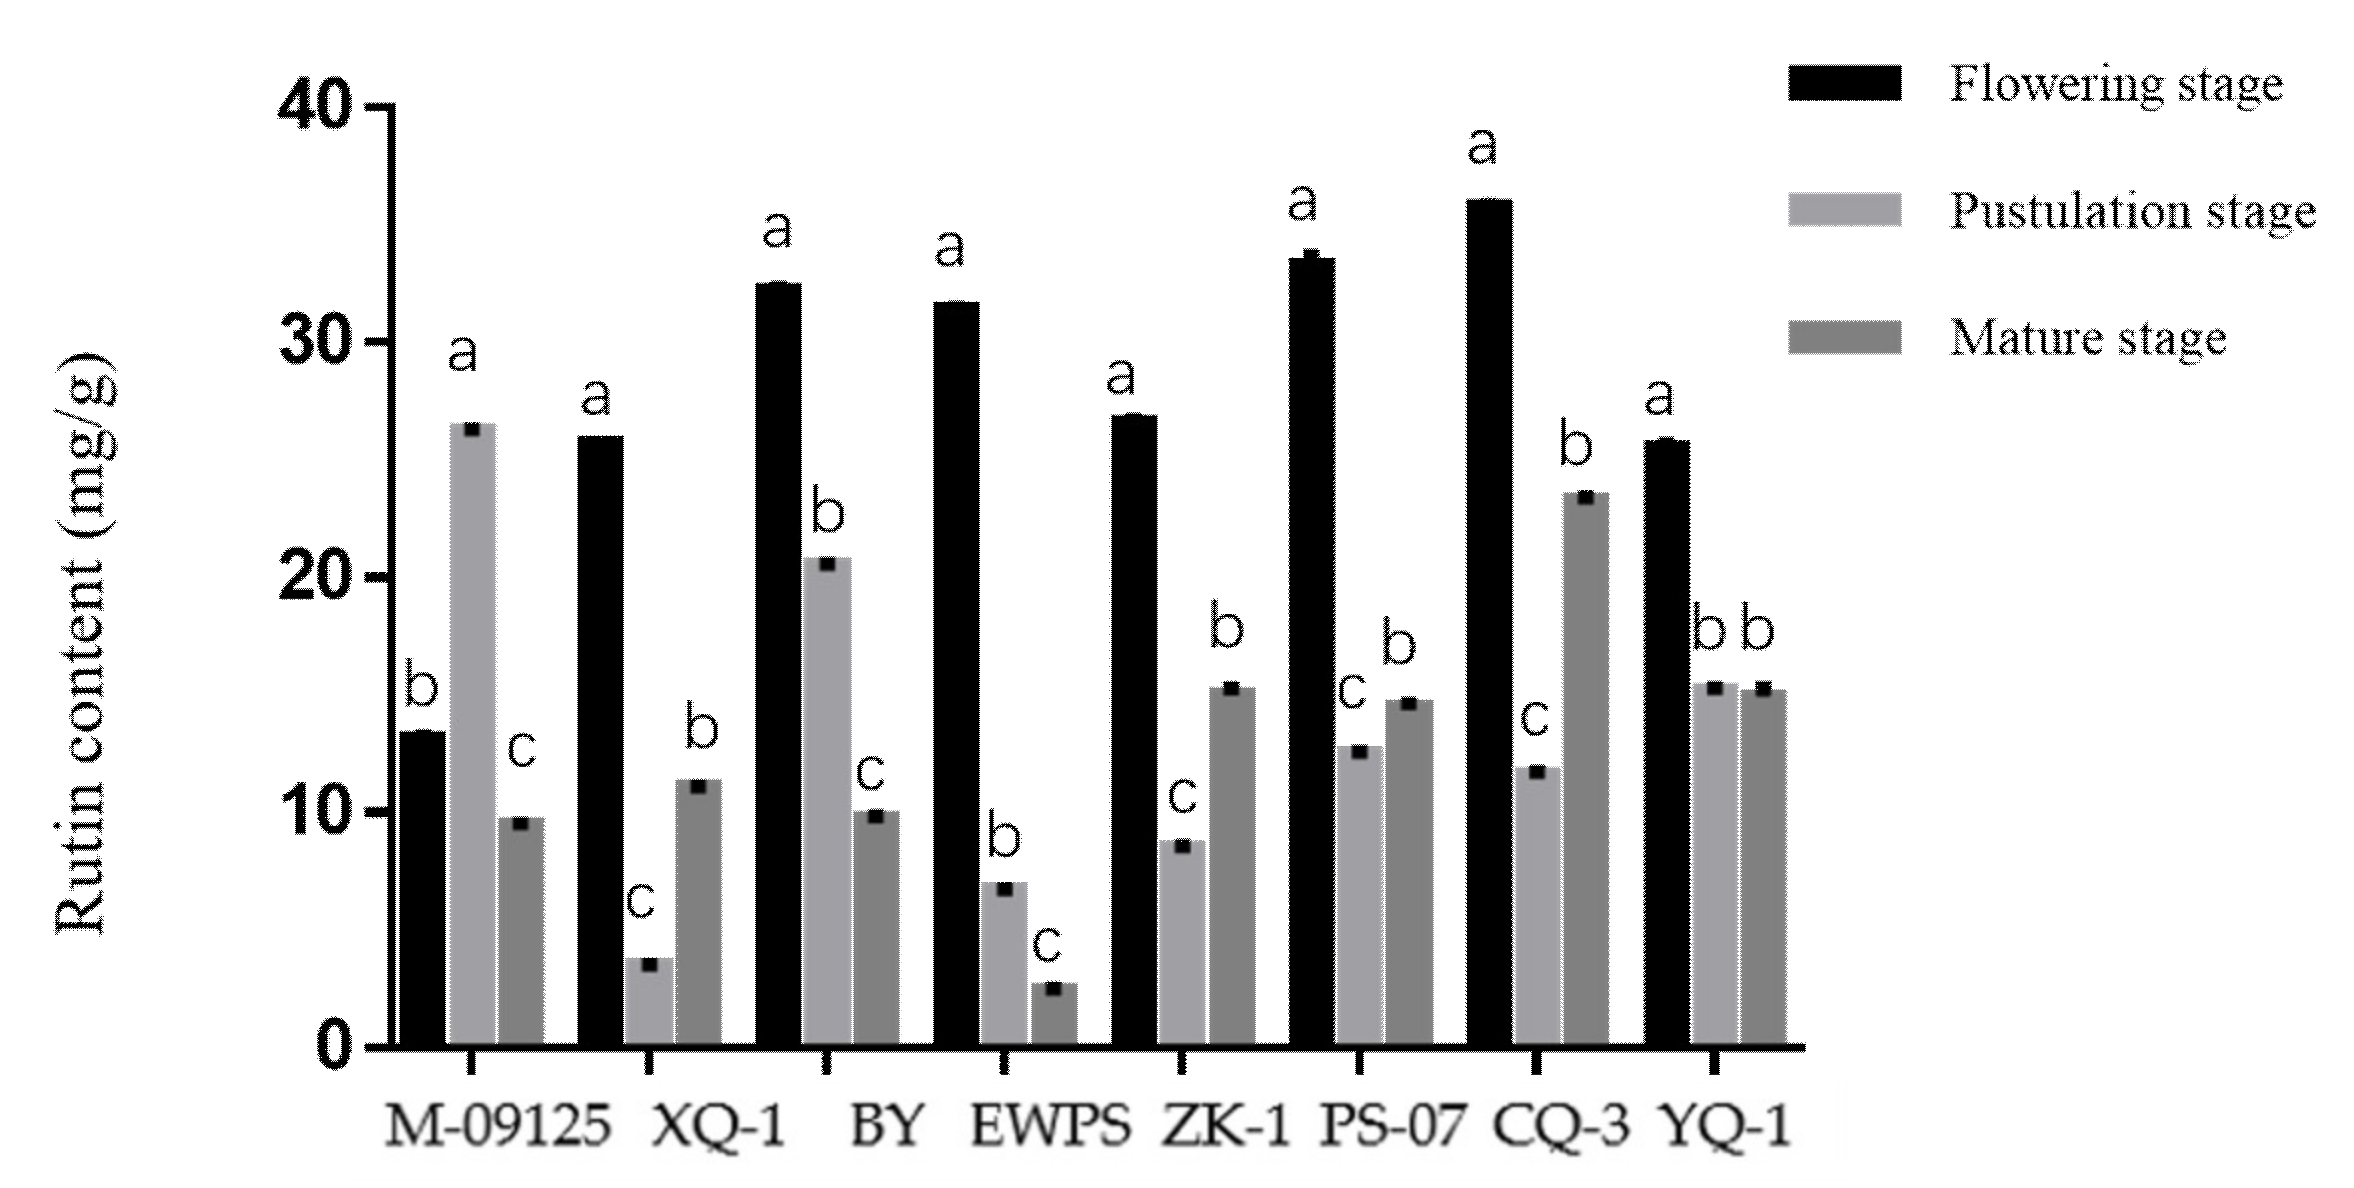
3.2. Total Flavonoids and Rutin Contents of Eight Tartary Buckwheat Varieties

Results showed that CQ-3 has the highest total flavonoids content at the flowering stage, while M-09125 and XQ-1 have the highest total flavonoids content at the pustulation stage and mature stage, respectively (Figure 1). Similarly, CQ-3 has the highest rutin content at the flowering stage, while M-09125 and CQ-3 have the highest content of rutin at the postulation and mature stage, respectively (Figure 2). In general, our results indicated that the content of total flavonoids of tartary buckwheat varieties M-09125 and XQ-1 were the highest at the pustulation stage and at the mature stage, respectively, and rutin content of tartary buckwheat varieties M-09125 and XQ-1 were the highest at the pustulation stage and at the flowering stage, respectively, while the total flavonoids and rutin contents of all other six tartary buckwheat varieties were the highest at the flowering stage.

3.3. Relative Feed Value and Relative Forage Quality Analysis of Eight Tartary Buckwheat Varieties

Based on the data in Table 1, the dry matter intakes (DMI), digestible dry matter (DDM), and total digestible nutrients (TDN) were calculated (Table 2), with which the relative feed value (RFV) and relative forage quality (RFQ) were also calculated (Table 2). Results showed that all these eight tartary buckwheat varieties at three growth stages presented high index values of RFV (121.31% to 217.39%) and RFQ (117.26% to 224.54%), indicating that they could be considered as forage candidates with high quality. However, based on the RFV and RFQ values, BY might be more suitable to be popularized for forage harvesting at the pustulation stage, while the other seven tartary buckwheat varieties might be more suitable to be popularized for forage harvesting at the flowering stage.

3.4. Principal Component Analysis

With the assayed contents of CP, CF, EE, ADF, NDF, NFE, calcium, phosphorus, total flavonoids, and rutin, principal components analysis (PCA) was performed. Results showed that two components (PC1 and PC2) retained from PCA at the flowering stage, explaining 68.888% of total variability of original data (Table S1), indicating PC1 and PC2 mainly represent most of the data contained in original indices, while principal components were retained from the pustulation (Table S2) and mature stages (Table S3), explaining 54.025% and 66.319% of total variability of original data, respectively. The eigenvector matrix reflects the load of each index on each principal component. Data in Table S1 showed that in PC1, EE, NDF, and NFE, calcium and ADF had higher loads and were the main factors of this principal component, while, in PC2, rutin and total flavonoids were the main factors and had relatively large loads. Thus, PC1 mainly represented the possibility of metabolic and energy supply, digestibility, and the mineral element content of tartary buckwheat varieties, while PC2 mainly represented the resistance to oxidation of tartary buckwheat varieties. In Table S2, while the tartary buckwheat varieties at the pustulation stage, NFE and NDF had higher loads and were the main factors of PC1, which mainly represented the possibility of metabolic of tartary buckwheat varieties, while rutin, total flavonoids, and EE were the main factors of PC2, which represented the resistance to oxidation. Results in Table S3 showed that calcium, calcium, CF, EE, total flavonoids, and NFE had higher loads and were the main factors of PC1 at the mature stage of the tartary buckwheat varieties, which mainly represented the mineral element content, the possibility of metabolic and energy supply, and the resistance to oxidation of tartary buckwheat varieties, while CP and ADF were the main factors of PC2, which represented protein nutritive value and digestibility of tartary buckwheat varieties. In summary, these indices could be used as comprehensive indicators for evaluating the quality of tartary buckwheat varieties as forage. In addition, the single score of one principal component was calculated as F, and then the comprehensive score of different tartary buckwheat varieties was further calculated as Dn based on the F values (Tables S4–S6). Results showed that PS-07 obtained the highest score among the eight tartary buckwheat varieties at the flowering stage, which was consistent with the result of RFQ and RFV analysis.

4. Discussion

Consumers are paying more and more attention to the quality of livestock products, and thus quality and safety of forage as well [31]. At present, commonly used forages can meet the basic nutritional requirements in the process of livestock feeding, but additional additives are usually needed for comprehensive nutrition, especially to improve the quality of meat and milk, improve the litter rate, and enhance immune and disease resistance [18,19,20]. The whole plant of tartary buckwheat as a promising feeding crop, including seeds, flowers, leaves, and stems, is rich in bioactive components, which play an important and complex physiological regulation role in tartary buckwheat forage-fed livestock [32]. Here, the major nine forage nutrient index were analyzed (including Ash, CP, CF, EE, ADF, NDF, NFE, calcium, and phosphorus content) of the whole plant of eight tartary buckwheat varieties, and the rutin content and total flavonoids as well to explore their potential forage values and quality. Our data showed that CQ-3 at the flowering stage contained the highest content of CP, followed by XQ-1 at pustulation and mature stages. PS-07 at the flowering stage contained the lowest content of NDF, followed by BY at the pustulation stage and CQ-3 at the flowering stage. PS-07 at the flowering stage also contained the lowest level of ADF, but followed by EWPS and ZK-1 at the flowering stages. It is known that more attention is usually paid to the content of CP, ADF, and NDF in view of the forage nutritional index. It was reported that NDF and ADF were related to the forage DM digestibility of ruminant animals, and the CP content was regarded as the decisive factor in the nutritional value of forage for herbivores [33]. Meanwhile, the other six nutritional content indices of these eight tartary buckwheat varieties all met the standard range of forage. Taking the assayed nutritional contents (Table 1) into comprehensive consideration, CQ-3 and PS-07 at the flowering stage are thus suggested to be relatively more suitable for harvesting as forage, although all the eight tartary buckwheat varieties are suitable for forage.
In order to exactly evaluate the potential forage value for these eight tartary buckwheat varieties, RFV and RFQ analysis were further performed. According to the definition of RFV value, if the value is higher than 100, it indicates that the nutritional value of the plant met the requirements for forage selection [34]. Moreover, the higher RFV means the higher potential nutritional value of forage crop [35]. Turk et al. concluded that pea grass harvested in the early growth stage with high nutritional value displayed high RFV of 212.5 [36]. Gürsoy et al. showed that brogated varigatus had high RFQ and thus is widely used to eliminate the quality roughage deficit [37]. Our data showed that, at the flowering stage, PS-07 displayed the highest level of RFV and RFQ, indicating that BY at the flowering stage is the most relatively suitable for forage and feed application. At the pustulation stage, however, BY displayed the highest level of RFV and RFQ, indicating that PS-07 at the pustulation stage is the most relatively suitable for forage and feed application. At the mature stage, PS-07 has the highest level of RFV, while CQ-3 has the highest level of RFQ, suggesting that PS-07 at the mature stage is the most relatively suitable for forage and CQ-3 at the mature stage most suitable for feed application. Taking RFV and RFQ in consideration together, PS-07, BY, and CQ-3 are relatively more suitable for forage, which is consistent with the above findings as a whole.
In addition, PCA was performed for these eight tartary buckwheat varieties. PCA was applied to simplify the interpretation of results and narrow down the number of variables that are mainly related to specific parameters of interest. PCA ranked the samples with the factors that eigenvalue is more than one to reduce errors as far as possible, which could be seemed as a comprehensive evaluation of forage crop [38]. As it is shown in Table S1, when harvested at the flowering stage for forage, CQ-3 might be ranked at the Top 1 based on PCA, followed by PS-07. When harvested at the mature stage for forage, CQ-3 might still be ranked at Top 1, followed by XQ-1 and PS-07 (Table S6). Although the PCA ranking when harvested at the pustulation stage used as forage is not exactly the same as that harvested at the flowering stage and mature stage, CQ-3 and PS-07 still are considered to be more relatively suitable for forage under comprehensive comparison, which is generally in agreement with that from RFV and RFQ analysis, as well as the analysis of nine major nutrient indexes.
Buckwheat is regarded as a crop possessing high nutritional value [39], and especially is the only source of dietary rutin among the cereals and pseudocereals’ crops [40]. It is known that rutin is the main content of tartary buckwheat flavonoid. Tartary buckwheat rutin is not only a potential drug material with high medicinal value to humans [41], but also has lots of beneficial effects to animals in the field of forage. Hassan et al. found that the supplemented broiler daily ration with rutin could promote its growth and suppress lipogenesis [42]. Leiber et al. verified that buckwheat rutin could improve rumen fermentation of dairy cows [43]. In addition, Sayed et al. reported that feeding 20% or more buckwheat could have a positive effect on the lipid profiles of broilers [44]. Other researchers also reported that tartary buckwheat protein can help to lower cholesterol [45,46]. Therefore, the rutin content and total flavonoids were determined in the whole plant of these eight tartary buckwheat varieties at different stages. Our data showed that the whole plant of the eight tartary buckwheat varieties were rich in flavonoids at all three growth stages, and the content of total flavonoids in tartary buckwheat varieties PS-07 and CQ-3 reached the highest at the flowering stage. Accordingly, the whole plant of the eight tartary buckwheat varieties were rich in rutin, and the PS-07 and CQ-3 at the flowering stage also contained the highest rutin content. Based on the comprehensive analysis, CQ-3 and PS-07 harvested at the flowering stage when used as forage might more effectively improve the function of forage to promote livestock immunity and disease resistance.

5. Conclusions

In this study, we identified that eight tartary buckwheat varieties are suitable for forage application, among which tartary buckwheat varieties PS-07 and CQ-3 have relatively higher potential forage value especially when harvested at the flowering stage. Our research will greatly benefit the forage use of these eight tartary buckwheat varieties and provide a theoretical basis for the best harvest stage of these tartary buckwheat varieties as forage.

Supplementary Materials

The following supporting information can be downloaded at: https://www.mdpi.com/article/10.3390/ijpb13020005/s1, Table S1: Principal component eigenvector, eigenvalue, contribution rate and accumulative contribution rate of eight tartary buckwheat varieties at flowering stage, Table S2: Principal component eigenvector, eigenvalue, contribution rate and accumulative contribution rate of eight tartary buckwheat varieties at pustulation stage, Table S3: Principal component eigenvector, eigenvalue, contribution rate and accumulative contribution rate of eight tartary buckwheat varieties at mature stage, Table S4: Comprehensive scoring of principal component values of eight tartary buckwheat varieties at flowering stage, Table S5: Comprehensive scoring of principal component values of eight tartary buckwheat varieties at pustulation stage, Table S6: Comprehensive scoring of principal component values of eight tartary buckwheat varieties at mature stage.

Author Contributions

Data curation, M.Z. (Mengjie Zhou), M.H., and J.W. (Jiankang Wang); Investigation, J.W. (Junzhen Wang); Methodology, T.S.; Writing—original draft, M.Z. (Mengjie Zhou) and Z.L.; Writing—review and editing, M.Z. (Meiliang Zhou), F.L. and Z.L. All authors have read and agreed to the published version of the manuscript.

Funding

This work was supported by the National Key R & D Program of China (2017YFE0117600), the Key Research and Development Projects of Zhejiang Province (2022C04003).

Institutional Review Board Statement

Not applicable.

Informed Consent Statement

Not applicable.

Data Availability Statement

The data presented in this study are available on request from the corresponding author.

Acknowledgments

We acknowledge the College of Life and Environmental Science, Wenzhou University, Wenzhou, China, for providing the laboratory facilities, and thank Mengqi Qing for helping us to modify the manuscript.

Conflicts of Interest

The authors declare no conflict of interest.

Abbreviations

Abbreviation  Full Name
XQ-1  Xiqiao No. 1
YQ-1  Youqiao No. 1
M-09125  Meng-09125
CQ-3  Chuanqiao No. 3
ZK-1  Zhaoku No. 1
EWPS  Ewu pedgree selection
BY  Buyue
PS-07  Pedgree selection-07
CP  Crude protein
CF  Crude fiber
EE  Crude fat content
ADF  Acid detergent fiber
NDF  Neutral detergent fiber
NFE  Nitrogen free extract
RFV  Relative feed value
RFQ  Relative forage quality
DMI  Dry matter intake
DDM  Digestible dry matter
TDN  Total digestible nutrients

References

  1. Yao, H.; Li, C.; Zhao, H.; Zhao, J.; Chen, H.; Bu, T.; Anhu, W.; Wu, Q. Deep sequencing of the transcriptome reveals distinct flavonoid metabolism features of black tartary buckwheat (Fagopyrum tataricum Garetn.). Prog. Biophys. Mol. Biol. 2017, 124, 49–60. [Google Scholar] [CrossRef] [PubMed]
  2. Singh, M.; Malhotra, N.; Sharma, K. Buckwheat (Fagopyrumsp.) genetic resources: What can they contribute towards nutritional security of changing world? Genet. Resour. Crop Evol. 2020, 67, 1639–1658. [Google Scholar] [CrossRef]
  3. Aubert, L.; Konradova, D.; Barris, S.; Quinet, M. Different drought resistance mechanisms between two buckwheat species Fagopyrum esculentum and Fagopyrum tataricum. Physiol. Plant. 2021, 172, 577–586. [Google Scholar] [CrossRef] [PubMed]
  4. Lu, Q.H.; Wang, Y.Q.; Yang, H.B. Effect of exogenous calcium on physiological characteristics of salt tolerance in tartary buckwheat. Biologia 2021, 76, 3621–3630. [Google Scholar] [CrossRef]
  5. Er, M.; Keles, G. Buckwheat conservation as hay or silage: Agronomic evaluation, nutritive value, conservation quality, and intake by lactating dairy goats. Trop Anim. Health Prod. 2021, 53, 215–222. [Google Scholar] [CrossRef]
  6. Liu, N.; Zeller, F.J.; Chen, Q.F. The flavonoid content in leaves and inflorescences of the wild perennial Fagopyrum cymosum complex. Genet. Resour. Crop Evol. 2013, 60, 825–838. [Google Scholar] [CrossRef]
  7. Kalac, P.; Samkova, E. The effects of feeding various forages on fatty acid composition of bovine milk fat: A review. Czech J. Anim. Sci. 2010, 55, 521–537. [Google Scholar] [CrossRef] [Green Version]
  8. Eugene, M.; Klumpp, K.; Sauvant, D. Methane mitigating options with forages fed to ruminants. Grass Forage Sci. 2021, 76, 196–204. [Google Scholar] [CrossRef]
  9. Song, Y.; Lv, J.; Ma, Z.; Dong, W. The mechanism of alfalfa (Medicago Sativa L.) response to abiotic stress. Plant Growth Regul. 2019, 89, 239–249. [Google Scholar] [CrossRef]
  10. Jonker, A.; Yu, P. The role of proanthocyanidins complex in structure and nutrition interaction in alfalfa forage. Int. J. Mol. Sci. 2016, 17, 793. [Google Scholar] [CrossRef] [Green Version]
  11. Silva, T.N.; Thomas, J.B.; Dahlberg, J.; Rhee, S.Y.; Mortimer, J.C. Progress and challenges in sorghum biotechnology, a multipurpose feedstock for the bioeconomy. J. Exp. Bot. 2022, 73, 646–664. [Google Scholar] [CrossRef] [PubMed]
  12. Klopfenstein, T.J.; Erickson, G.E.; Berger, L.L. Maize is a critically important source of food, feed, energy and forage in the USA. Field Crop. Res. 2013, 153, 5–11. [Google Scholar] [CrossRef]
  13. Jonker, A.; Yu, P. The Occurrence, Biosynthesis, and molecular structure of proanthocyanidins and their effects on legume forage protein precipitation, digestion and absorption in the ruminant digestive tract. Int. J. Mol. Sci. 2017, 18, 1105. [Google Scholar] [CrossRef] [PubMed] [Green Version]
  14. Balota, M.; Payne, W.A.; Veeragom, S.K.; Stewart, B.A.; Rosenow, D.T. Respiration and its relationship to germination, emergence, and early growth under cool temperatures in sorghum. Crop Sci. 2010, 50, 1414–1422. [Google Scholar] [CrossRef]
  15. Huang, Z.; Dunkerley, D.; Lopez-Vicente, M.; Wu, G.L. Trade-offs of dryland forage production and soil water consumption in a semi-arid area. Agric. Water Manag. 2020, 241, 106349. [Google Scholar] [CrossRef]
  16. Huang, Q.; Liu, X.; Zhao, G.; Hu, T.; Wang, Y. Potential and challenges of tannins as an alternative to in-feed antibiotics for farm animal production. Anim. Nutr. 2018, 4, 137–150. [Google Scholar] [CrossRef]
  17. Chattopadhyay, M.K. Use of antibiotics as feed additives: A burning question. Front. Microbiol. 2014, 5, 334. [Google Scholar] [CrossRef] [Green Version]
  18. Sedej, I.; Sakac, M.; Mandic, A.; Misan, A.; Tumbas, V.; Canadanovic-Brunet, J. Buckwheat (Fagopyrum esculentum moench) grain and fractions: Antioxidant compounds and activities. J. Food Sci. 2012, 77, C954–C959. [Google Scholar] [CrossRef]
  19. Idowu, A.T.; Olatunde, O.O.; Adekoya, A.E.; Idowu, S. Germination: An alternative source to promote phytonutrients in edible seeds. Food Qual. Saf. 2020, 4, 129–133. [Google Scholar] [CrossRef] [Green Version]
  20. Luthar, Z.; Golob, A.; Germ, M.; Vombergar, B.; Kreft, I. Tartary buckwheat in human nutrition. Plants 2021, 10, 700. [Google Scholar] [CrossRef]
  21. Cui, K.; Wang, Q.; Wang, S.; Diao, Q.; Zhang, N. The facilitating effect of tartary buckwheat flavonoids and lactobacillus plantarum on the growth performance, nutrient digestibility, antioxidant capacity, and fecal microbiota of weaned piglets. Animals 2019, 9, 986. [Google Scholar] [CrossRef] [PubMed] [Green Version]
  22. Scuderi, R.A.; Lam, Y.W.; Ebenstein, D.B.; Tacoma, R.; Cersosimo, L.M.; Kraft, J.; Brito, A.F.; Greenwood, S.L. Comparative analysis of the skim milk and milk fat globule membrane proteomes produced by jersey cows grazing pastures with different plant species diversity. J. Dairy Sci. 2020, 103, 7498–7508. [Google Scholar] [CrossRef] [PubMed]
  23. Amelchanka, S.L.; Kreuzer, M.; Leiber, F. Utility of buckwheat (Fagopyrum esculentum moench) as feed: Effects of forage and grain on in vitro ruminal fermentation and performance of dairy cows. Anim. Feed Sci. Technol. 2010, 155, 111–121. [Google Scholar] [CrossRef]
  24. Neu, A.E.; Sheaffer, C.C.; Undersander, D.J.; Hall, M.H.; Kniffen, D.M.; Wells, M.S.; Catalano, D.N.; Martinson, K.L. Hay rake-type effect on ash and forage nutritive values of alfalfa hay. Agron. J. 2017, 109, 2163–2171. [Google Scholar] [CrossRef]
  25. D’Heer, B.; Boever, J.; Vanacker, J.M.; Boucqué, C.V. The filter bag versus the conventional filtration technique for the determination of crude fibre and Van Soest cell wall constituents. J. Anim. Feed Sci. 2000, 9, 513–526. [Google Scholar] [CrossRef]
  26. Thiex, N.J.; Anderson, S.; Gildemeister, B. Crude fat, diethyl ether extraction, in feed, cereal grain, and forage (randall/soxtec/submersion method): Collaborative study. J. Aoac. Int. 2003, 86, 888–898. [Google Scholar] [CrossRef] [Green Version]
  27. Prantil, L.R.; Heinze, C.R.; Freeman, L.M. Comparison of carbohydrate content between grain-containing and grain-free dry cat diets and between reported and calculated carbohydrate values. J. Feline Med. Surg. 2018, 20, 349–355. [Google Scholar] [CrossRef]
  28. Bhandari, S.; Khadayat, K.; Poudel, S.; Shrestha, S.; Shrestha, R.; Devkota, P.; Khanal, S.; Marasini, B.P. Phytochemical analysis of medicinal plants of nepal and their antibacterial and antibiofilm activities against uropathogenic Escherichia coli. BMC Complement. Med. Ther. 2021, 21, 116. [Google Scholar] [CrossRef]
  29. Kim, J.; Jho, K.H.; Choi, Y.H.; Nam, S.Y. Chemopreventive effect of cactus (opuntia humifusa) extracts: Radical scavenging activity, pro-apoptosis, and anti-Inflammatory effect in human colon (SW480) and breast cancer (MCF7) cells. Food Funct. 2013, 4, 681–688. [Google Scholar] [CrossRef]
  30. Ward, R.; de Ondarza, M.B. Relative Feed Value (RFV) vs. Relative Forage Quality (RFQ). 6. Available online: https://www.foragelab.com/Media/RFV_vs_RFQ-CVASPerspective.pdf (accessed on 14 February 2008).
  31. Singer, S.D.; Weselake, R.J.; Acharya, S. Molecular enhancement of alfalfa: Improving quality traits for superior livestock performance and reduced environmental impact. Crop Sci. 2018, 58, 55–71. [Google Scholar] [CrossRef]
  32. Li, J.; Yang, P.; Yang, Q.; Gong, X.; Ma, H.; Dang, K.; Chen, G.; Gao, X.; Feng, B. Analysis of flavonoid metabolites in buckwheat leaves using UPLC-ESI-MS/MS. Molecules 2019, 24, 1310. [Google Scholar] [CrossRef] [PubMed] [Green Version]
  33. Lemaire, G.; Belanger, G. Allometries in plants as drivers of forage nutritive value: A review. Agriculture 2019, 10, 5. [Google Scholar] [CrossRef] [Green Version]
  34. Rohweder, D.A.; Barnes, R.; Jorgensen, N. Proposed hay grading standards based on laboratory analyses for evaluating quality. J. Anim. Sci. 1978, 47, 747–759. [Google Scholar] [CrossRef]
  35. Geng, Y.; Ranjitkar, S.; Yan, Q.; He, Z.; Su, B.; Gao, S.; Niu, J.; Bu, D.; Xu, J. Nutrient value of wild fodder species and the implications for improving the diet of mithun (Bos Frontalis) in Dulongjiang area, Yunnan province, China. Plant Divers. 2020, 42, 455–463. [Google Scholar] [CrossRef] [PubMed]
  36. Turk, M.; Albayrak, S. Effect of harvesting stages on forage yield and quality of different leaf types pea cultivar. Turk. J. Field Crops 2012, 17, 111–114. [Google Scholar]
  37. Gürsoy, E.; Kaya, A.; Gül, M. Determining the nutrient content, energy, and in vitro true digestibility of some grass forage plants. Emir. J. Food Agric. 2021, 33, 417–422. [Google Scholar] [CrossRef]
  38. Gallo, A.; Moschini, M.; Cerioli, C.; Masoero, F. Use of principal component analysis to classify forages and predict their calculated energy content. Animal 2013, 7, 930–939. [Google Scholar] [CrossRef] [Green Version]
  39. Maxin, G.; Graulet, B.; Le Morvan, A.; Picard, F.; Portelli, J.; Andueza, D. Cover crops as alternative forages for ruminants: Nutritive characteristics, in vitro digestibility, methane and ammonia production. Anim. Prod. Sci. 2020, 60, 823–832. [Google Scholar] [CrossRef]
  40. Lu, L.; Murphy, K.; Baik, B.K. Genotypic variation in nutritional composition of buckwheat groats and husks. Cereal Chem. 2013, 90, 132–137. [Google Scholar] [CrossRef]
  41. Ruan, J.J.; Zhou, Y.X.; Yan, J.; Zhou, M.L.; Woo, S.H.; Weng, W.F.; Cheng, J.P.; Zhang, K.X. Tartary Buckwheat: An Under-utilized edible and medicinal herb for food and nutritional security. Food Res. Int. 2020. [Google Scholar] [CrossRef]
  42. Hassan, F.; Roushdy, E.M.; Kishawy, A.; Zaglool, A.W.; Tukur, H.A.; Saadeldin, I.M. Growth performance, antioxidant capacity, lipid-related transcript expression and the economics of broiler chickens fed different levels of rutin. Animals 2019, 9, 7. [Google Scholar] [CrossRef] [PubMed] [Green Version]
  43. Leiber, F.; Kunz, C.; Kreuzer, M. Influence of different morphological parts of buckwheat (Fagopyrum esculentum) and its major secondary metabolite rutin on rumen fermentation in vitro. Czech J. Anim. Sci. 2012, 57, 10–18. [Google Scholar] [CrossRef] [Green Version]
  44. Sayed, M.; Islam, M.; Haque, M.; Shah, M.; Ahmed, R.; Siddiqui, M.; Hossain, M. Dietary effects of chitosan and buckwheat (Fagopyrum esculentum) on the performance and serum lipid profile of broiler chicks. SA J. Anim. Sci. 2015, 45, 429–440. [Google Scholar] [CrossRef] [Green Version]
  45. Zhang, C.; Zhang, R.; Li, Y.M.; Liang, N.; Zhao, Y.; Zhu, H.; He, Z.; Liu, J.; Hao, W.; Jiao, R.; et al. Cholesterol-lowering activity of tartary buckwheat protein. J. Agric. Food Chem. 2017, 65, 1900–1906. [Google Scholar] [CrossRef]
  46. Liu, J.; Song, Y.; Zhao, Q.; Wang, Y.; Li, C.; Zou, L.; Hu, Y. Effects of tartary buckwheat protein on gut microbiome and plasma metabolite in rats with high-fat diet. Foods 2021, 10, 2457. [Google Scholar] [CrossRef]
Figure 1. Total flavonoids content of tartary buckwheat varieties at different growth stages. The value is flavonoids (mg) per gram dry matter basis. M-09125: Meng-09125; XQ-1: Xiqiao No. 1; BY: Buyue; EWPS: Ewu Pedgree selection; ZK-1: Zhaoku No. 1; PS-07: Pedgree selection-07; CQ-3: Chuanqiao No.3 and YQ-1: Youqiao No. 1. Different lowercase letters on each column indicate significant differences between stages at p < 0.05.
Ijpb 13 00005 g001
Figure 2. Rutin content of tartary buckwheat varieties at different growth stages. The value is rutin (mg) per gram dry matter basis. M-09125: Meng-09125; XQ-1: Xiqiao No. 1; BY: Buyue; EWPS: Ewu Pedgree selection; ZK-1: Zhaoku No. 1; PS-07: Pedgree selection-07; CQ-3: Chuanqiao No. 3 and YQ-1: Youqiao No. 1. Different lowercase letters on each column indicate significant differences between stages at p < 0.05.
Ijpb 13 00005 g002
Table 1. Nutritional contents of eight tartary buckwheat varieties at different growth stages on a dry matter basis (%).
StagesVarietiesAshCPCFEEADFNDFNFECalciumPhosphorus
Flowering stageM-0912515.69 ± 0.09 ab5.06 ± 0.14 cd 10.24 ± 0.18 bcd3.95 ± 0.06 a26.98 ± 0.26 c36.46 ± 0.64 cd56.73 ± 0.18 b0.29 ± 0.01 cd0.38 ± 0.00 b
XQ-115.39 ± 0.03 ab3.15 ± 0.09 a 9.99 ± 1.30 bc4.06 ± 0.08 ab29.03 ± 0.08 e41.92 ± 0.83 e59.99 ± 0.87 c0.34 ± 0.00 b0.32 ± 0.00 f
BY16.30 ± 0.03 ab3.74 ± 0.13 b8.70 ± 0.60 b4.31 ± 0.06 c39.07 ± 0.90 f37.16 ± 0.16 d58.14 ± 0.02 bc0.21 ± 0.00 a0.22 ± 0.00 a
EWPS16.27 ± 0.04 ab3.95 ± 0.30 b13.50 ± 1.00 f5.01 ± 0.10 d24.72 ± 0.29 a34.44 ± 0.49 b53.25 ± 1.40 a0.34 ± 0.00 c0.37 ± 0.00 f
ZK-116.15 ± 0.13 ab5.50 ± 0.05 e12.31 ± 0.20 ef4.15 ± 0.05 bc25.59 ± 0.54 b37.35 ± 0.89 d54.30 ± 0.10 a0.31 ± 0.00 e0.40 ± 0.00 c
PS-0717.49 ± 0.07 a4.83 ± 0.20 c11.70 ± 1.30 de5.39 ± 0.19 e24.39 ± 0.33 a29.92 ± 0.43 a52.25 ± 1.52 a0.33 ± 0.00 d0.39 ± 0.00 e
CQ-315.14 ± 3.46 ab7.08 ± 0.07 f6.00 ± 0.75 a4.88 ± 0.07 d28.10 ± 0.23 d33.42 ± 0.63 b57.19 ± 2.70 b0.35 ± 0.01 cd0.38 ± 0.00 g
YQ-114.54 ± 0.03 b5.21 ± 0.11 d10.48 ± 0.96 cd4.06 ± 0.08 ab26.62 ± 0.53 c35.83 ± 0.80 c57.84 ± 0.58 bc0.32 ± 0.00 b0.31 ± 0.00 d
Pustulation stageM-091257.70 ± 0.06 a5.69 ± 0.15 cd10.38 ± 0.53 b3.72 ± 0.02 b31.76 ± 0. 51 bcd47.74 ± 0. 66 e65.36 ± 0.45 e0.27 ± 0.00 c0.31 ± 0.00 b
XQ-111.91 ± 0.00 c5.93 ± 0.20 d9.96 ± 0.39 ab4.54 ± 0.04 e30.86 ± 0. 66 bc39.95 ± 0. 36 b59.11 ± 0.25 b0.27 ± 0.00 e0.34 ± 0.00 b
BY12.65 ± 0.10 d5.53 ± 0.22 c12.85 ± 0.85 d4.00 ± 0.06 cd30.51 ± 0. 20 b31.77 ± 0. 31 c56.06 ± 0.16 a0.27 ± 0.00 d0.32 ± 0.00 b
EWPS9.64 ± 0.06 c4.52 ± 0.16 b10.84 ± 0.52 bc3.70 ± 0.07 b28.14 ± 0.05 a41.82 ± 0.55 a63.91 ± 0.47 d0.30 ± 0.00 b0.29 ± 0.00 c
ZK-19.84 ± 0.28 c4.30 ± 0.11 b11.68 ± 0.91 cd3.70 ± 0.06 b28.89 ± 0. 87 a50.04 ± 0.74 f63.10 ± 0.45 cd0.30 ± 0.00 g0.38 ± 0.00 c
PS-078.94 ± 0.02 b3.82 ± 0.08 a11.15 ± 1.04 bc3.39 ± 0.07 a33.03 ± 1.63 d44.01 ± 0.39 d64.92 ± 0.84 e0.32 ± 0.00 g0.37 ± 0.00 d
CQ-39.12 ± 0.03 b3.80 ± 0.20 a9.04 ± 0.62 a3.91 ± 0.00 c33.07 ± 0.20 d48.42 ± 0.29 e65.99 ± 0.70 f0.21 ± 0.00 f0.35 ± 0.00 a
YQ-18.96 ± 0.10 b3.95 ± 0.11 a12.00 ± 0.27 cd4.02 ± 0.04 d32.12 ± 0.23 cd42.07 ± 1.13 c62.74 ± 0.09 c0.27 ± 0.00 a0.23 ± 0.00 b
Mature stageM-091257.38 ± 0.03 a4.73 ± 0.12 c8.60 ± 1.07 a4.19 ± 0.10 c36.57 ± 0.53 c39.77 ± 0.84 ab68.35 ± 0.50 f0.23 ± 0.00 c0.16 ± 0.00 a
XQ-18.11 ± 0.07 c6.96 ± 0.10 f11.07 ± 1.97 b3.76 ± 0.07 b39.07 ± 0.90 d44.36 ± 0.72 b61.52 ± 0.23 c0.22 ± 0.00 b0.21 ± 0.00 c
BY10.38 ± 0.04 f5.10 ± 0.06 d16.77 ± 0.75 c3.42 ± 0.20 a33.20 ± 0.32 a45.17 ± 0.57 b56.95 ± 0.01 a0.22 ± 0.01 b0.21 ± 0.00 c
EWPS9.16 ± 0.01 d5.79 ± 0.17 e12.43 ± 1.11 b4.16 ± 0.08 c42.02 ± 0.23 e42.50 ± 0.16 b59.92 ± 0.03 b0.30 ± 0.00 e0.22 ± 0.01 d
ZK-19.89 ± 0.14 e5.15 ± 0.08 d11.74 ± 0.34 b3.88 ± 0.10 b38.99 ± 0.02 d43.56 ± 0.97 b61.72 ± 0.25 c0.28 ± 0.00 d0.23 ± 0.00 e
PS-0711.76 ± 0.54 g5.36 ± 0.22 d7.45 ± 1.05 a4.72 ± 0.05 d35.79 ± 0.45 b31.34 ± 1.21 a64.18 ± 0.01 d0.32 ± 0.01 f0.25 ± 0.00 f
CQ-37.77 ± 0.09 bc4.08 ± 0.39 b8.71 ± 0.67 a5.23 ± 0.03 e35.61 ± 0.35 b41.88 ± 0.29 b66.31 ± 0.51 e0.30 ± 0.00 e0.25 ± 0.00 f
YQ-17.66 ± 0.13 ab3.44 ± 0.07 a20.20 ± 2.21 d3.79 ± 0.09 b33.70 ± 0.20 a38.84 ± 0.77 ab56.55 ± 1.72 a0.20 ± 0.00 a0.18 ± 0.00 b
M-09125: Meng-09125; XQ-1: Xiqiao No. 1; BY: Buyue; EWPS: Ewu Pedgree selection; ZK-1: Zhaoku No. 1; PS-07: Pedgree selection-07; CQ-3: Chuanqiao No.3 and YQ-1: Youqiao No. 1. The data in the table are represented as the mean ± standard deviation. Different lowercase letters on each column indicate significant differences between stages at p < 0.05.
Table 2. The dry matter intakes, digestible dry matter, total digestible nutrients, relative feed value and relative forage quality of eight tartary buckwheat varieties at different growth stages.
StagesVarietiesDMI(%DM)DDM(%DM)TDN(%DM)RFVRFQ
Flowering stageM-091253.69 ± 0.66 bc67.88 ± 0.20 d62.12 ± 0.19 d173.23 ± 3.51 b186.29 ± 32.64 b
XQ-13.29 ± 0.73 a66.29 ± 0.06 b60.58 ± 0.06 b147.12 ± 2.82 a162.20 ± 35.79 a
BY3.18 ± 0.09 b58.47 ± 0.70 a53.04 ± 0.68 a146.36 ± 1.30 a137.16 ± 5.69 a
EWPS3.93 ± 0.80 d69.64 ± 0.22 f63.82 ± 0.22 f188.13 ± 3.16 c204.03 ± 42.21 c
ZK-13.73 ± 0.83 b68.96 ± 0.42 e63.16 ± 0.40 e171.81 ± 4.39 b191.89 ± 43.66 b
PS-074.31 ± 0.53 f69.90 ± 0.26 f64.07 ± 0.25 f217.39 ± 3.89 d224.54 ± 26.76 d
CQ-33.83 ± 0.39 e67.01 ± 0.18 c61.28 ± 0.17 c186.59 ± 3.08 c190.74 ± 19.89 c
YQ-13.71 ± 0.69 c68.16 ± 0.41 d62.39 ± 0.40 d176.99 ± 3.45 b188.16 ± 33.88 b
Pustulation stageM-091252.94 ± 0.73 b64.16 ± 0.51 abc58.53 ± 0.50 abc125.03 ± 0.57 a140.05 ± 35.77 a
XQ-13.31 ± 0.50 e64.68 ± 0.51 bc59.21 ± 0.49 bc151.03 ± 1.79 d159.17 ± 22.94 c
BY3.82 ± 0.10 f65.13 ± 0.15 c59.47 ± 0.15 c190.72 ± 1.66 e184.56 ± 5.38 d
EWPS3.34 ± 0.80 d66.98 ± 0.04 d61.24 ± 0.04 d149.01 ± 1.86 d166.11 ± 40.17 c
ZK-12.97 ± 1.03 a66.39 ± 0.68 d60.68 ± 0.66 d123.43 ± 2.15 a146.81 ± 52.23 a
PS-073.04 ± 0.52 c63.17 ± 1.27 a57.57 ± 1.22 a133.53 ± 2.78 b142.51 ± 27.03 b
CQ-32.86 ± 0.67 b63.14 ± 0.16 a57.55 ± 0.15 a121.31 ± 0.70 a133.69 ± 31.64 a
YQ-13.15 ± 0.52 d63.88 ± 0.18 ab58.26 ± 0.17 ab141.32 ± 4.17 c149.06 ± 24.87 c
Mature stageM-091253.23 ± 0.05 d60.41 ± 0.41 c54.92 ± 0.40 c147.98 ± 3.67 d144.04 ± 3.07 d
XQ-12.84 ± 0.20 ab58.47 ± 0.70 b53.04 ± 0.68 b122.65 ± 3.27 a122.35 ± 7.33 a
BY2.96 ± 0.56 c63.04 ± 0.25 e57.45 ± 0.24 e129.82 ± 1.62 b137.16 ± 5.69 b
EWPS2.84 ± 0.02 bc56.17 ± 0.18 a50.83 ± 0.17 a122.94 ± 0.67 a138.47 ± 26.91 a
ZK-12.88 ± 0.17 ab58.52 ± 0.02 b53.10 ± 0.02 b125.01 ± 2.76 ab117.26 ± 0.31 ab
PS-073.71 ± 0.33 e61.02 ± 0.35 d55.50 ± 0.34 d181.28 ± 6.31 e124.50 ± 7.36 e
CQ-33.04 ± 0.29 c61.16 ± 0.27 d55.64 ± 0.26 d135.86 ± 1.46 c167.28 ± 14.33 c
YQ-13.22 ± 0.29 d62.65 ± 0.16 e57.07 ± 0.15 e150.10 ± 2.99 d137.49 ± 13.56 d
M-09125: Meng-09125; XQ-1: Xiqiao No. 1; BY: Buyue; EWPS: Ewu Pedgree selection; ZK-1: Zhaoku No. 1; PS-07: Pedgree selection-07; CQ-3: Chuanqiao No.3 and YQ-1: Youqiao No. 1. The data in the table are represented as the mean ± standard deviation. Different lowercase letters on each column indicate significant differences between stages at p < 0.05.
Publisher’s Note: MDPI stays neutral with regard to jurisdictional claims in published maps and institutional affiliations.

