
Dynamics of Chromatin Opening across Larval Development in the Urochordate Ascidian Ciona savignyi

1
Fang Zongxi Center for Marine EvoDevo, MoE Key Laboratory of Marine Genetics and Breeding, College of Marine Life Sciences, Ocean University of China, Qingdao 266003, China
2
Liaoning Key Laboratory of Marine Animal Immunology, Dalian Ocean University, Dalian 116023, China
3
College of Animal Science, Inner Mongolia Agricultural University, Hohhot 010018, China
4
Laboratory for Marine Biology and Biotechnology, Qingdao Marine Science and Technology Center, Qingdao 266237, China
5
MoE Key Laboratory of Evolution & Marine Biodiversity, Institute of Evolution & Marine Biodiversity, Ocean University of China, Qingdao 266003, China
*
Author to whom correspondence should be addressed.
†
These authors contribute equally to this work.
Int. J. Mol. Sci. 2024, 25(5), 2793; https://doi.org/10.3390/ijms25052793
Submission received: 21 January 2024
/
Revised: 20 February 2024
/
Accepted: 26 February 2024
/
Published: 28 February 2024
(This article belongs to the Section Molecular Biology)
Abstract
:Ascidian larvae undergo tail elongation and notochord lumenogenesis, making them an ideal model for investigating tissue morphogenesis in embryogenesis. The cellular and mechanical mechanisms of these processes have been studied; however, the underlying molecular regulatory mechanism remains to be elucidated. In this study, assays for transposase-accessible chromatin using sequencing (ATAC-seq) and RNA sequencing (RNA-seq) were applied to investigate potential regulators of the development of ascidian Ciona savignyi larvae. Our results revealed 351 and 138 differentially accessible region genes through comparisons of ATAC-seq data between stages 21 and 24 and between stages 24 and 25, respectively. A joint analysis of RNA-seq and ATAC-seq data revealed a correlation between chromatin accessibility and gene transcription. We further verified the tissue expression patterns of 12 different genes. Among them, Cs-matrix metalloproteinase 24 (MMP24) and Cs-krüppel-like factor 5 (KLF5) were highly expressed in notochord cells. Functional assay results demonstrated that both genes are necessary for notochord lumen formation and expansion. Finally, we performed motif enrichment analysis of the differentially accessible regions in different tailbud stages and summarized the potential roles of these motif-bearing transcription factors in larval development. Overall, our study found a correlation between gene expression and chromatin accessibility and provided a vital resource for understanding the mechanisms of the development of ascidian embryos.
1. Introduction
The ascidian Ciona savignyi belongs to the urochordate subphylum [1,2,3], which comprises the closest relatives of vertebrates [4,5,6,7]. Ciona is an ideal model organism for studying tissue formation during chordate embryonic development [8]. Its early embryonic processes are relatively simple, its transgenic technology has been developed [9], and its genome has been sequenced [10,11] and deposited in the EDomics database [12]. Distinct morphological changes occur in various tissues of the ascidian from the early to the late tailbud stages, including tail bending [13] and epidermal and muscle cell extension, and notochord cells also undergo a series of complex morphological events, including elongation [14], migration, lumen formation [15,16,17,18], and lumen fusion [14,19,20]. The cytological process of ascidian tailbud development has been extensively studied, but the molecular mechanism of its regulation is poorly understood.
Assay for transposase-accessible chromatin with high-throughput sequencing (ATAC-seq) is a highly efficient technology for detecting accessible open chromatin [21]. In the last decade, 65 species have been subjected to ATAC-seq, and more than 2000 datasets have been generated, including data for protozoa, fungi, plants, and animals [22]. Moreover, ATAC-seq is useful for analyzing marine invertebrate embryos [23]. Ascidian chromosomal loci exhibit time-dependent dynamic changes in chromatin accessibility and conserved open chromatin regulatory elements around developmental regulatory genes [24], which are similar to those observed in Drosophila [25], Caenorhabditis elegans [26], and vertebrates [27]. However, the key regulatory factors in tailbud development remain unclear.
In our current work, we investigated accessible chromatin and the expression profiles of genes at three different developmental stages of C. savignyi, namely stages 21 (tail is 1-2-fold longer than the trunk and curves ventrally, complete with the intercalation of notochord cells), 24 (notochord vacuolation begins, palps start to be visible at the front end of the embryo, tail straightens), and 25 (ocellus melanization, all notochord cells have vacuoles), using ATAC-seq and RNA sequencing (RNA-seq). An integrated analysis of ATAC-seq and RNA-seq data was performed to identify changes in chromatin accessibility that influence gene expression as well as key regulators in the development of ascidian tailbuds, such as Krüppel-like factor 5 (KLF5) and matrix metalloproteinase 24 (MMP24), which regulate notochord lumen formation and expansion. We further identified nine transcription factors (t-box transcription factor 15/18/22 [Tbx15/18/22], forkhead box protein e [FoxE], forkhead box d-b [FoxD-b], six homeobox 3/6 [Six3/6], forkhead box i-a[FoxI-a], forkhead box protein k [FoxK], gata binding protein-a [GATA-a], fosb proto-oncogene [Fos-B], and forkhead box l2 [FoxL2]) that potentially affect ascidian development. These findings provide useful resources for further investigation of the mechanisms underlying ascidian larval development.
2. Results
2.1. ATAC-Seq and RNA-Seq of Ciona Tailbud Embryos
We collected embryos at three stages (St. 21, St. 24, and St. 25; Figure 1A) to perform ATAC-seq and RNA-seq with two biological replicates. To construct the ATAC-seq library, cell isolation and nuclei extraction were performed after embryo collection (Figure S1A). The embryos were then isolated as single cells. A portion of the single-cell suspension was used for activity detection. Furthermore, 0.4% trypan blue staining revealed high cell activity, and the cell viability rate exceeded 80%. After nucleus extraction, blue dot structures stained by DAPI were identified, indicating that intact nuclei were successfully extracted. Six ATAC-seq libraries were constructed, and sequencing data were obtained using an Illumina Nova Seq sequencer (Tables S1 and S2). Clean reads were aligned with the reference genome Ciona_savignyi_51511_TX_20220104_seqkit. fasta.
Pearson’s correlation analysis was performed for ATAC-seq data, and the results revealed high correlation coefficients between the biological repeats of St. 21 (0.96), St. 24 (0.99), and St. 25 (0.98; Figure S1B). Pearson’s correlation analysis for RNA-seq data also revealed high correlation coefficients of 0.98, 0.99, and 0.97, respectively, for the aforementioned stages (Figure S1C). A large number of peaks were located near the transcriptional start site, which is a regulatory area (Figure S1D). This suggests that chromatin regions are involved in transcriptional regulation. Surprisingly, we also observed strong ATAC-seq signals at transcription end sites (TESs). TES open chromatin might reflect the binding of factors engaged in transcription termination [28]. All ATAC-seq libraries yielded fragment lengths with expected distributions [21,29], including most small fragments corresponding to nucleosome-free regions (≤100 bp) and mononucleosome- and dinucleosome-associated fragments (200 and 400 bp, respectively; Figure S1E), confirming the good quality of the ATAC-seq data.
2.2. Chromatin Accessibility at Different Developmental Stages
We mapped the genomic coordinates from the peak data to the 13 chromosomes of the C. savignyi genome (Figure S2A), and most regions of each chromosome were covered. We counted the number of peaks in different developmental stages, and the average number was 13,650 in St. 21, 31,369 in St. 24, and 19,645 in St. 25. Statistical analysis (t-test) revealed that the number of accessible peaks was significantly higher in St. 24 (p < 0.05; Figure S2B), indicating that gene expression is more active during this stage. ATAC-seq peaks were enriched in 3′-UTRs, 5′-UTRs, exons, introns, promoters, and intergenic regions (Figure 1B). The promoter region accounted for the largest proportion, confirming that chromatin opening is related to gene transcriptional regulation.
The open regions of these three stages were annotated, and multiple open chromatin regions might correspond to the same gene. A total of 351 and 138 genes adjacent to differentially accessible regions (DARs) were found to contain upregulated and downregulated regions between St. 21 and St. 24 (Figure 1C, Table S3) and between St. 24 and St. 25, respectively (Figure 1D, Table S4). These results indicate that the chromosomal loci of ascidians exhibit time-dependent dynamics concerning chromatin accessibility. These DARs were further compared with genomic sequences, and genes adjacent to these differentially open regions were analyzed using clusterProfiler for GO enrichment (Table S5). The results revealed that calcium ion binding, ion binding, homophilic cell adhesion via plasma membrane adhesion molecules, and transmembrane signaling receptor activity were the enriched pathways in St. 24 compared to St. 21 (Figure 1E). Compared to St. 25, the DAR-associated genes of St. 24 were enriched in the cell adhesion and exocytosis pathways (Figure 1F). Seven genes were randomly selected from the GO terms in the comparison of St. 21 and St. 24 (delta like non-canonical notch ligand 2 [DLK2], bone morphogenetic protein 5 [BMP5], bone morphogenetic protein 2 [BMP2], jagged 1 [JAG], protocadherin 18 [PCDH18]) and the comparison of St. 24 and St. 25 (fibrillin 1 [FBN1], solute carrier family 37 member 1 [SLC37A1]) to examine the tissue expression patterns. Although some of the GO terms were not significantly enriched, these genes belonged to genes adjacent to open regions of chromatin with significant differences. The promoter constructs of these genes were electroplated into the embryos and most of the signaling was observed in epidermal and/or muscle cells (Figure S2C). These results indicate the existence of substantial dynamic regulation and function in muscle and epidermal cells during larval development.
2.3. Transcriptome Profiling of C. savignyi at Different Developmental Stages
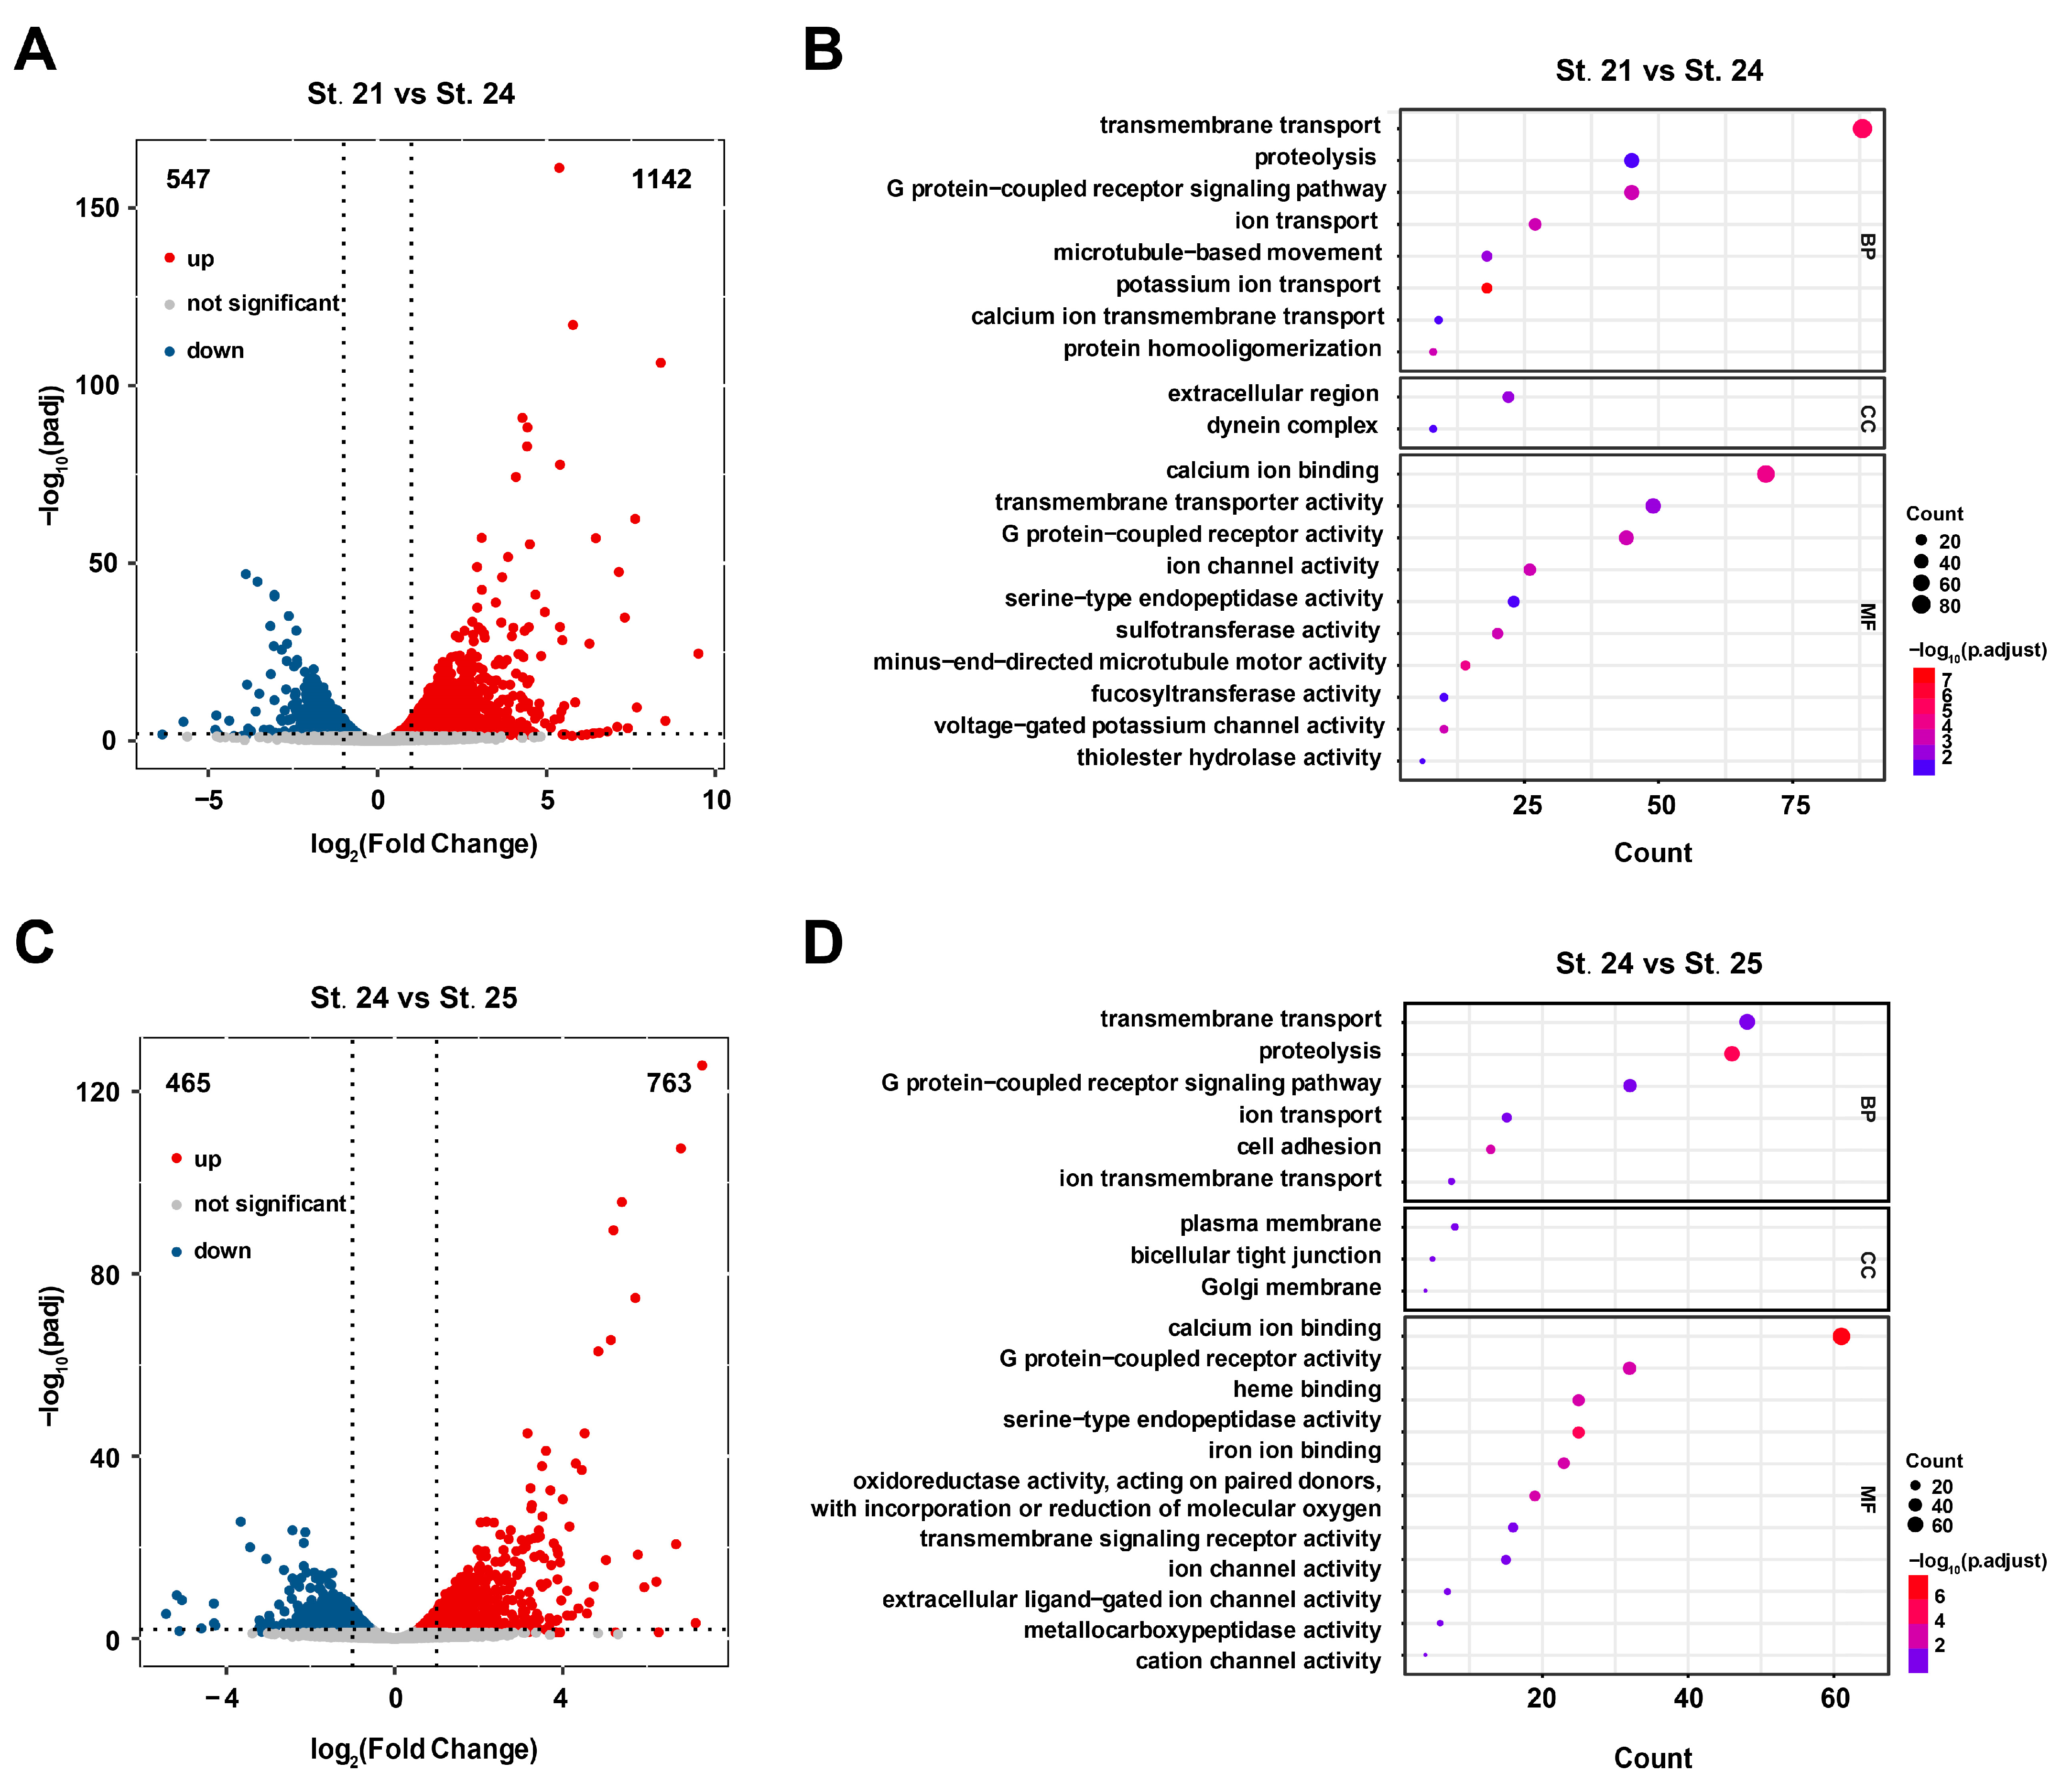
Differentially expressed genes (DEGs) were obtained from RNA-seq for the three stages, and the results identified 1142 upregulated genes and 547 downregulated genes in St. 24 compared to St. 21 (Figure 2A, Table S6). In total, 763 upregulated and 465 downregulated genes were identified in St. 25 compared to St. 24 (Figure 2C, Table S7). Furthermore, all DEGs were mapped to GO database terms, enabling their annotation (Table S8). DEGs were mostly enriched in the membrane transport and ion transport-related pathways (Figure 2B,D). These results suggest that in addition to basic gene expression, transcription, and translation, a wide range of processes such as ion transport, membrane transport, and cell attachment are involved in ascidian tailbud development.
2.4. Correlation of ATAC-Seq and RNA-Seq Data
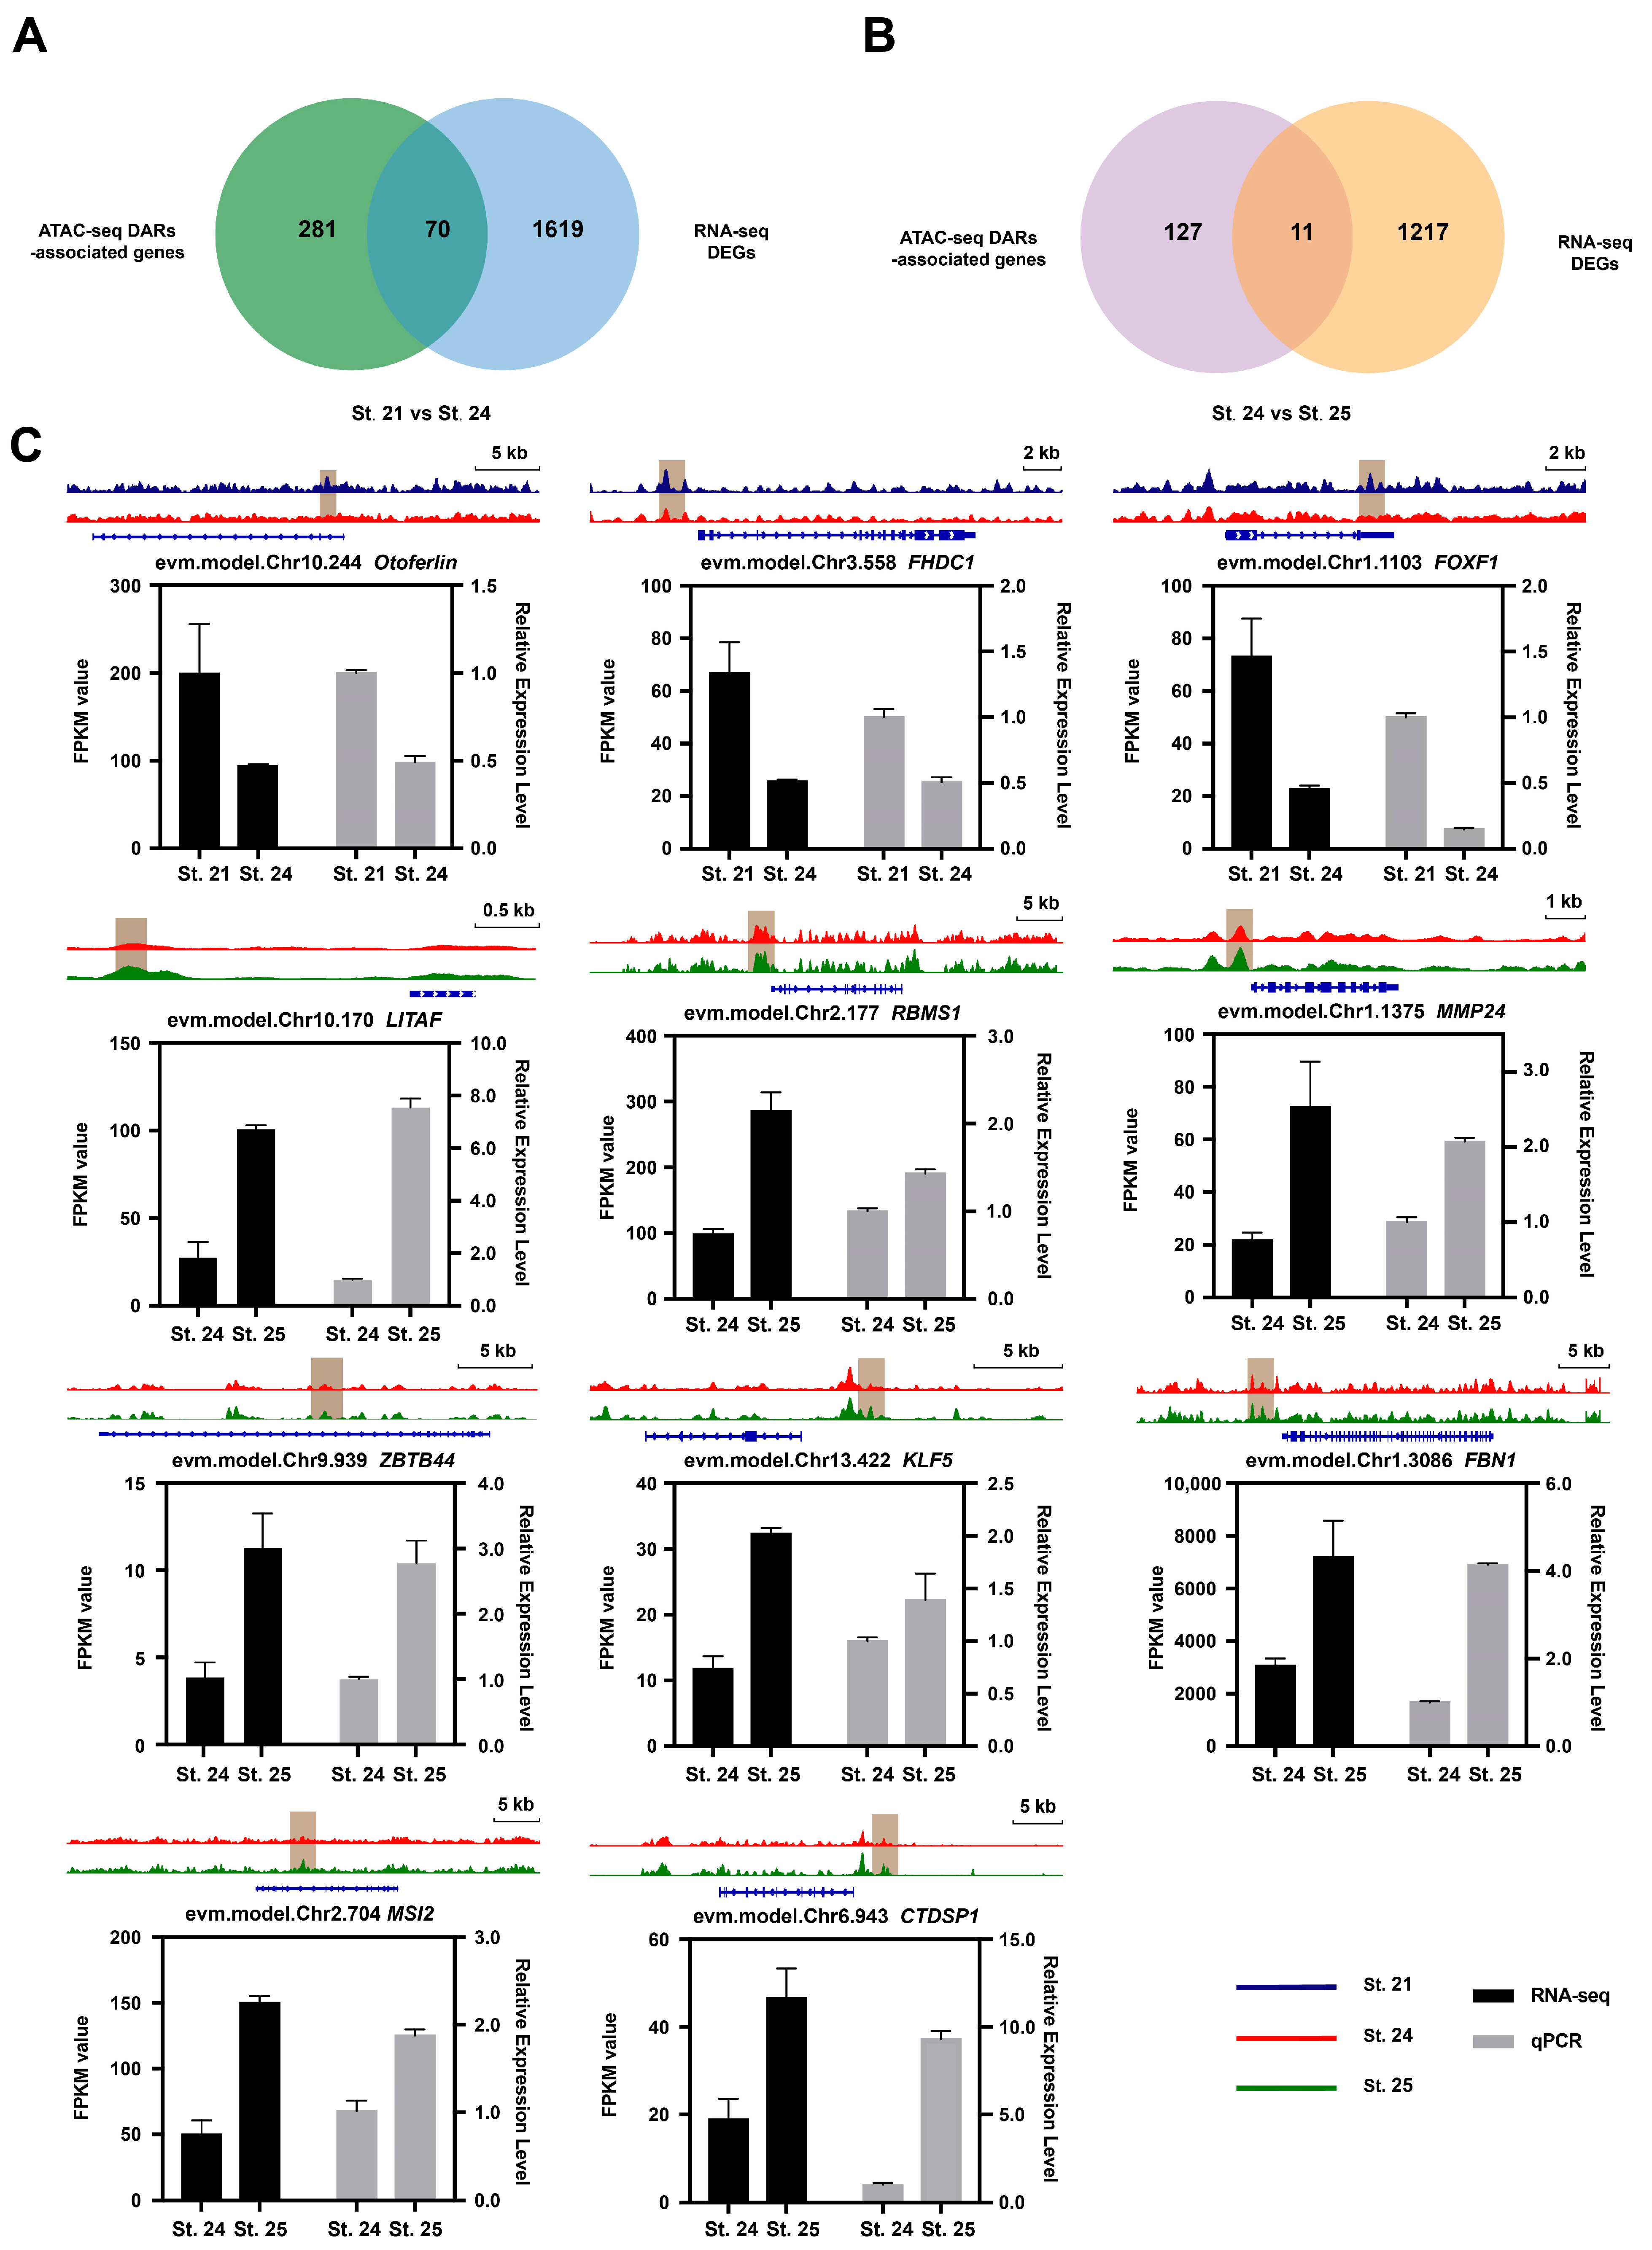
Combined analysis of ATAC-seq and RNA-seq data can provide more biological information that can be used to investigate the relationship between changes in open chromatin regions identified through ATAC-seq analysis and corresponding changes in gene expression. In total, 70 DEGs were identified in St. 24 compared to St. 21, and 11 DEGs were identified in St. 25 compared to St. 24 (Figure 3A,B, Table S9). In the region characterized by low chromatin openness in St. 24, 30 genes were downregulated, whereas 40 genes were upregulated (Figure S3A). Meanwhile, the region with high chromatin openness in St. 25 featured two downregulated and nine upregulated genes (Figure S3B). Eight genes were randomly selected from the GO terms for the comparison between St. 21 and St. 24 (Figure S3C, Table S10), and all eleven genes for St. 24 versus St. 25 were analyzed by qRT-PCR. Our RNA-seq and qRT-PCR analyses revealed comparable gene expression patterns (Figure 3C, Figure S3D and Table S11), which validated the accuracy of our RNA-seq data in all three stages.
2.5. Target Genes in DARs during Chordate Larval Development
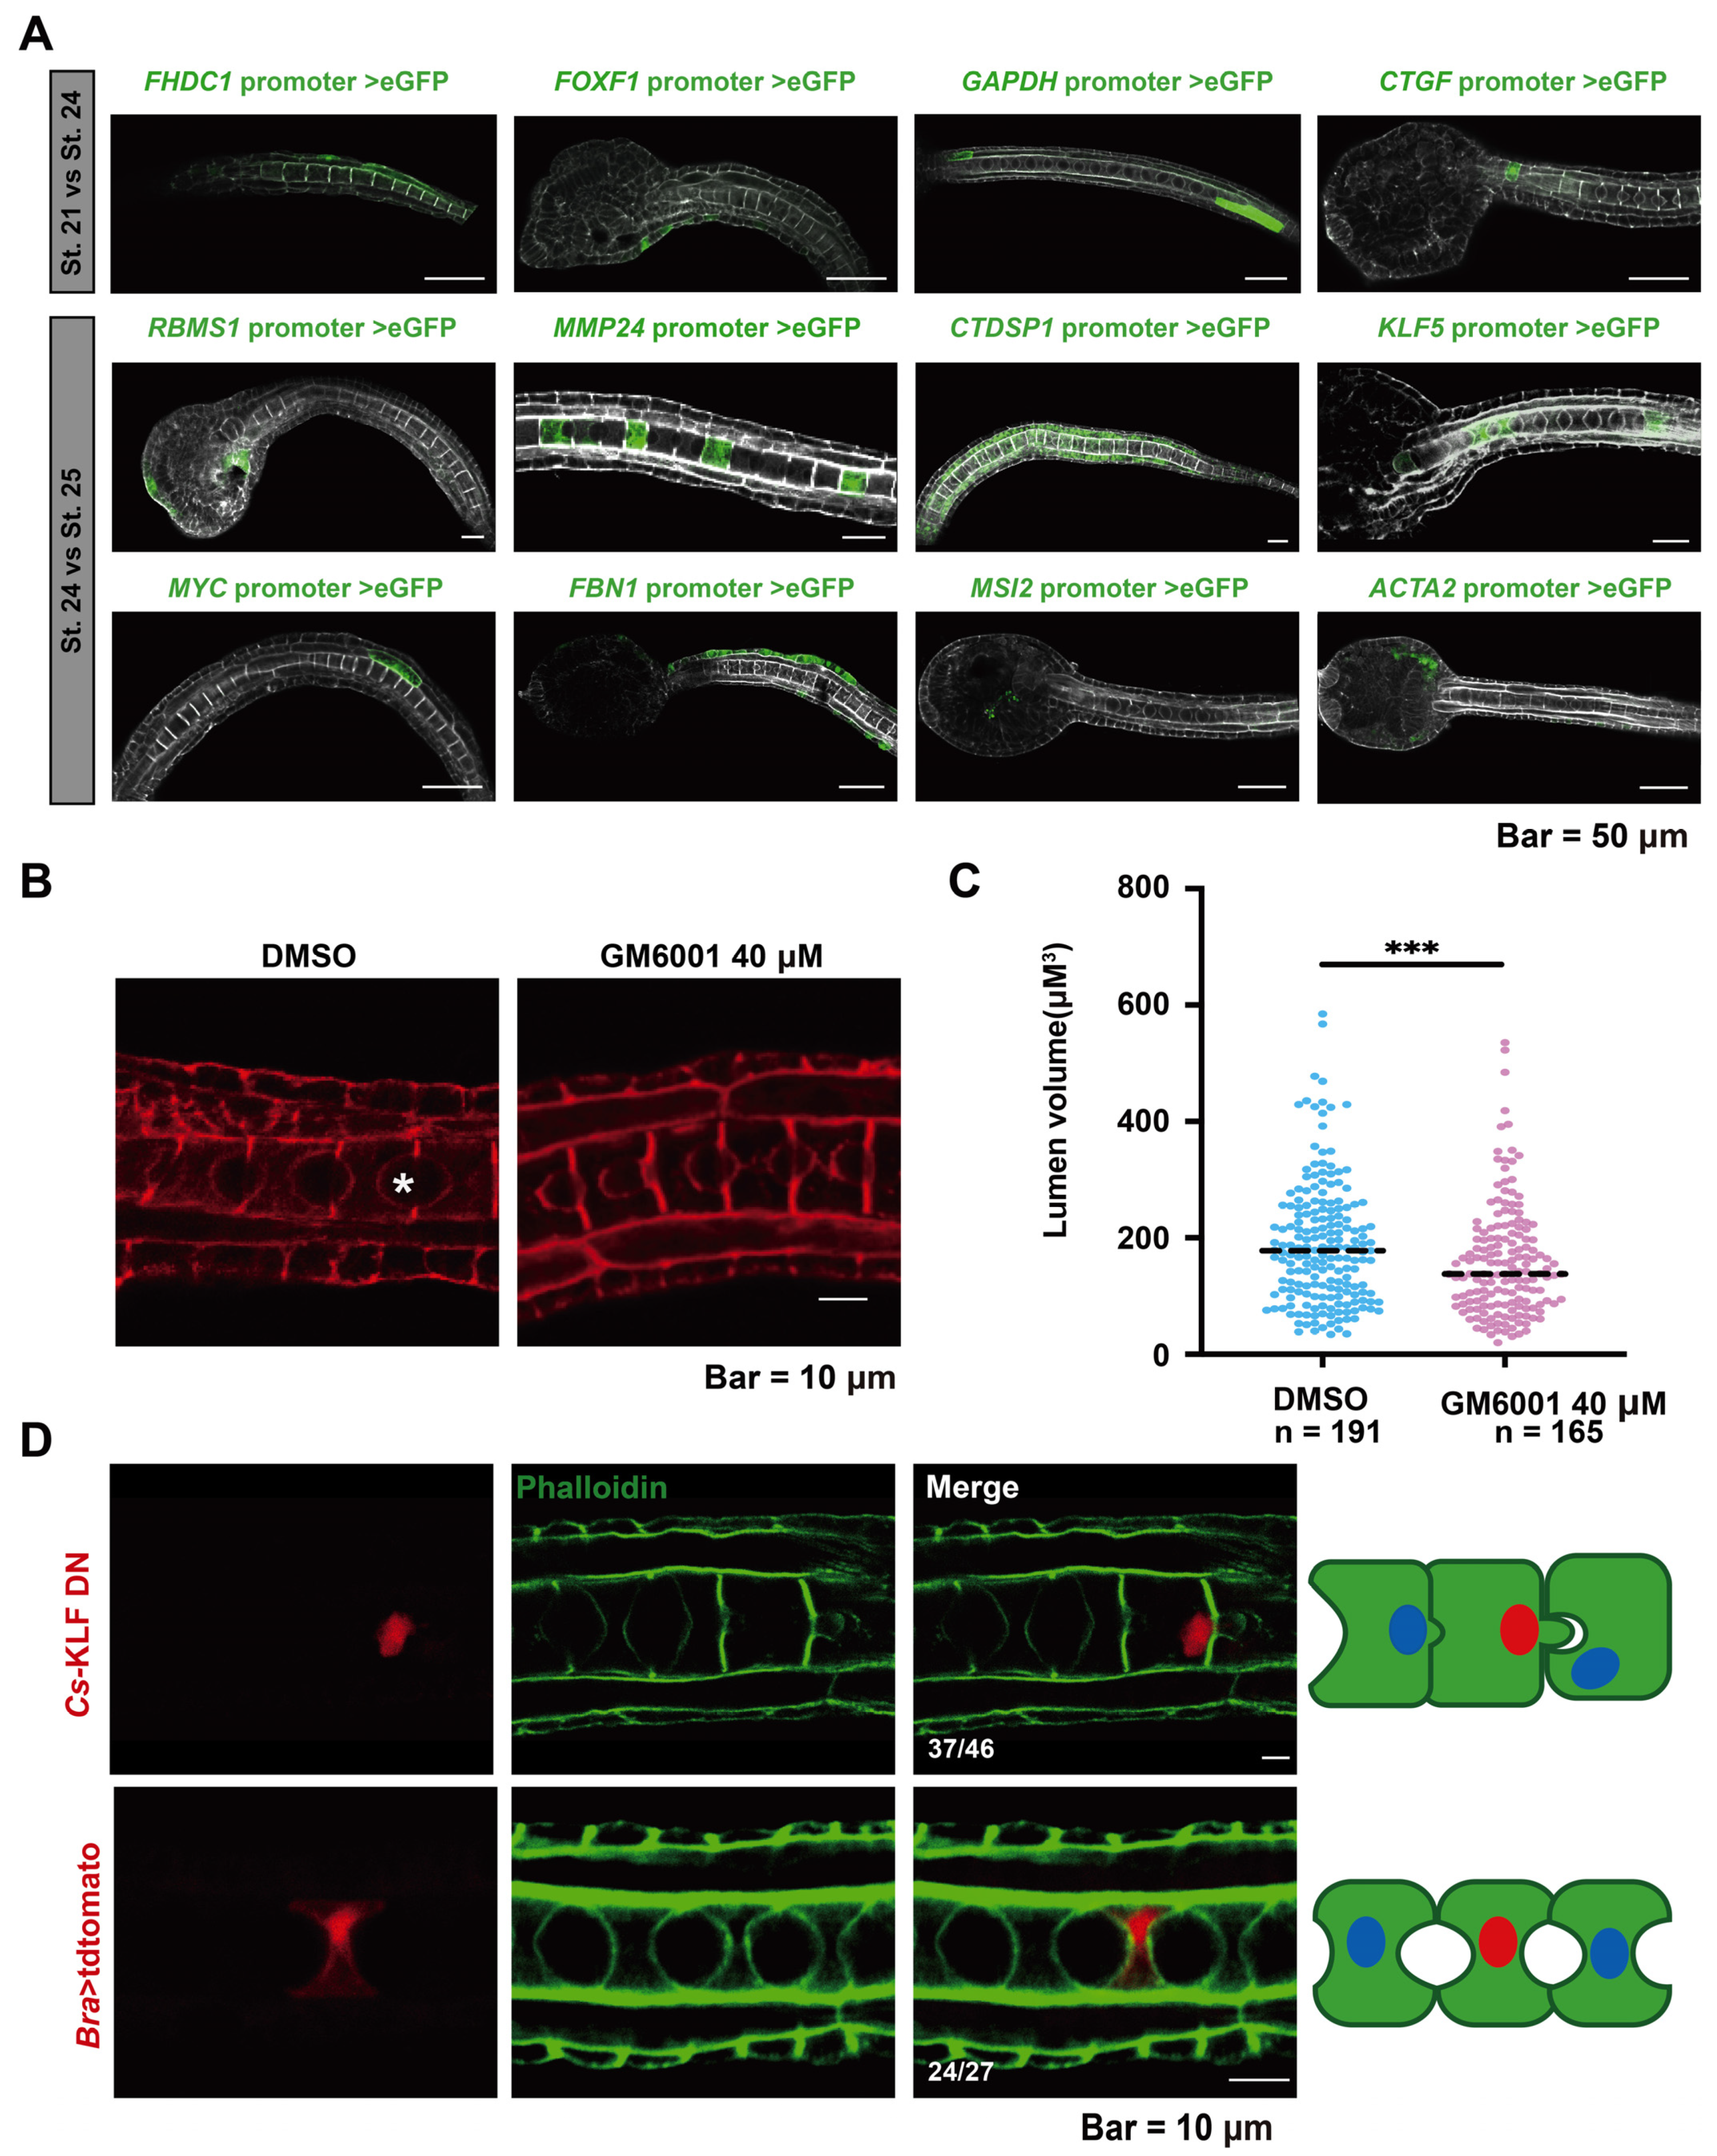
To determine the tissue expression patterns of DAR-associated genes ([fh2 domain containing 1 [FHDC1], forkhead box f1 [FOXF1], connective tissue growth factor [CTGF], glyceraldehyde-3-phosphate dehydrogenase [GAPDH], rna binding motif single-strand interacting protein 1 [RBMS1], CTD small phosphatase 1 [CTDSP1], myc proto-oncogene [MYC], musashi rna binding protein 2 [MSI2], actin alpha 2 [ACTA2], MMP24 and KLF5), we created a gene promoter construct and expressed it in Ciona embryos (Figure 4A). FHDC1, FOXF1, and CTGF were expressed in epidermal cells, and GAPDH was expressed in muscle cells. The expression of these genes might be associated with muscle and epidermal cell extension during early embryonic development. RBMS1 was expressed in epidermal cells and cells near the eye spot, CTDSP1 and MYC were expressed in muscle cells, FBN1 was expressed in epidermal cells, and MSI2 and ACTA2 in mesenchymal cells. MMP24 and KLF5 were expressed in the notochord during the lumen formation stage.
Lumen formation is an obvious cytological process during the development of the ascidian tailbud. To investigate the role of Cs-MMP24 in lumen formation, we used ilomastat (GM6001), a potent and broad-spectrum MMP inhibitor [30], to inhibit Cs-MMP24 in Ciona tailbud embryos. At 12 h post fertilization (hpf), embryos were treated with 40 µM GM6001 or DMSO and then collected for phalloidin staining to mark the cell boundary (Figure 4B). We measured the A-P and D-V diameters of the extracellular lumen and calculated lumen volume (Figure S4, Table S12). The results illustrated that the volume of the notochord lumen in the drug-treated group was significantly smaller than that in the control groups in St. 25 (Figure 4C). We constructed an N-terminal (activating domain) deletion construct of the Cs-KLF5 fusion protein (Cs-KLF5 DN), which retained the nuclear localization signal and the zinc finger domain, to determine the roles of Cs-KLF5 in notochord lumen formation [31,32]. Cs-KLF5 DN expression in the notochord resulted in abnormalities in lumen formation (Figure 4D). Taken together, these results indicate that Cs-KLF5 and Cs-MMP24 are necessary for notochord lumen formation and expansion.
2.6. Motif Enrichment Analysis of DARs in the Tailbud Stage
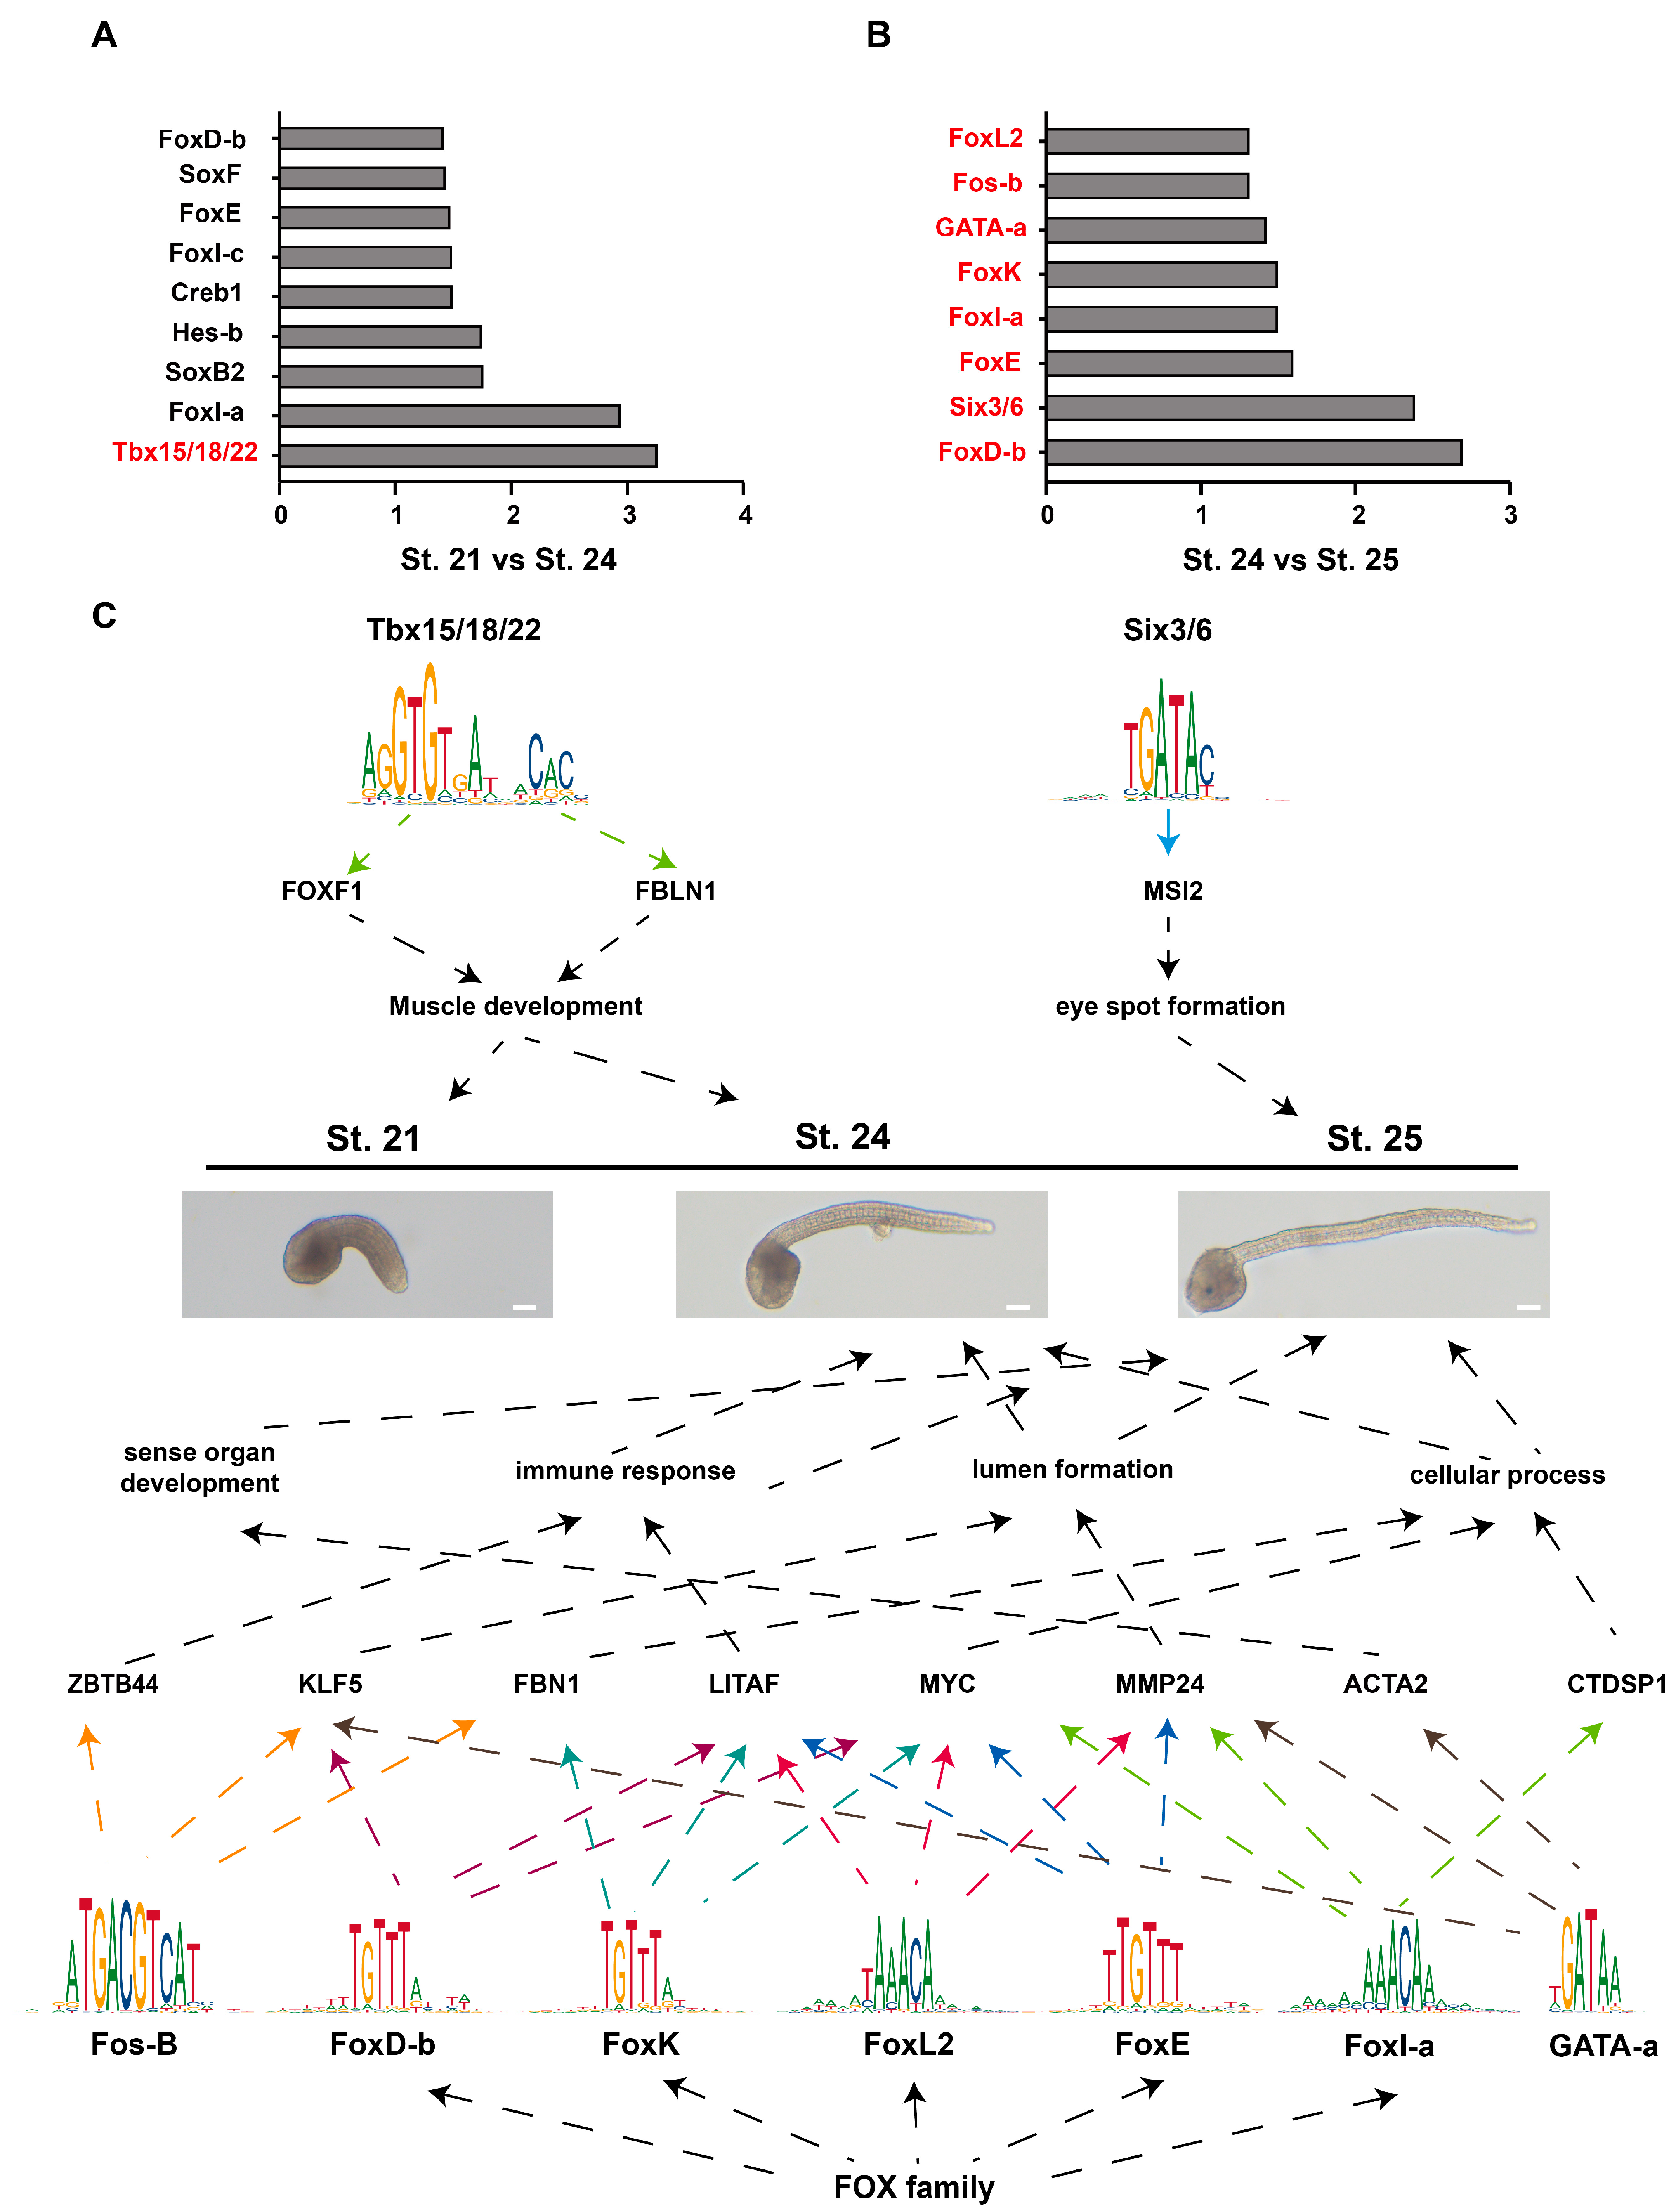
Transcription factors (TFs) can bind accessible regions to regulate gene expression. We analyzed the enriched motifs in the different peaks in different developmental stages. To identify potential TFs responsible for the observed differences in chromatin accessibility, the enrichment of TF motifs was screened in accessible regions in St. 21 versus St. 24 and in St. 24 versus St. 25. The enrichment of the motifs is listed in Figure 5A,B. We identified 690 TFs belonging to 143 TF families (Figure S5A, Table S13). To investigate the mRNA expression of TFs in tailbud stages, we determined the FPKM value of each TF in St. 21, St. 24, and St. 25 by RNA-seq. The TF genes were grouped into six clusters (Figure S5B, Table S14). The results illustrated that Tbx15/18/22 was upregulated from St. 21 to St. 24, and FoxD-b, Six3/6, FoxE, FoxI-a, FoxK, GATA-a, Fos-B, and FoxL2 were upregulated from St. 24 to St. 25 (Figure 5A,B). Tbx15/18/22 has been reported to maintain the expression of muscle structural genes. In Tbx15/18/22 morphant embryos, many muscle-structural genes, such as muscle actin, myosin heavy chain, troponin t, and troponin c, are downregulated [33]. Previous studies reported that NvSix3/6 plays a key regulatory role in the development of a broad aboral territory in Nematostella [34], and deregulation of the Six3/6 pathway led to evolution of the pinhole eye in nautili [35]. The forkhead TF family is involved in various developmental processes of the embryo. FoxD activates vegetal hemisphere-specific genes (Lhx3/4 and Zic-r.b) and represses animal hemisphere-specific genes in ascidians (Dmrt.a and Dlx.b) [36]. FoxD is also essential for notochord differentiation or induction [37]. Ci-FoxE is specifically expressed at the endostyle of adults, being prominent in the thyroid-equivalent region of zone 7 [38]. FoxI is essential for formation of the otic placode, survival of the branchial arch neural crest, and developmental remodeling of the branchial arch ectoderm [39]. FoxK activity is necessary for the formation of midgut constrictions and the development of midgut vesicles [40]. FoxL2 is an evolutionarily conserved gene involved in the germinal differentiation of gonadal sex [41,42]. GATA2 enhances the expression of MMP2 in microvascular endothelial cells cultured within a 3D type I collagen matrix [43]. We speculated that MMP2 is involved in notochord formation. Fos-B overexpression resulted in aberrant axon branching in zebrafish [44].
In conclusion, we identify 15 TFs responsible for the observed differences in chromatin accessibility. The expression profiles of these TFs provided a possible clue for their functions (Figure 5C).
3. Discussion
Gene expression is regulated by changes in gene regulatory programs through the integration of Cis-regulatory elements (CREs), which include core promoters, promoter proximal elements [45], and TF binding sites. The binding of TFs to CREs promotes the recruitment of RNA polymerase II to the promoter of the target gene, thereby regulating the gene expression [46]. Identification of the sequences of CREs and clarification of their localization on chromosomes and binding TFs will be helpful in understanding the epigenetic information of chromatin and its molecular mechanisms in a specific biological context [46,47]. In addition, transposable elements (TEs) may also have a significant role in organizing chromatin structure and gene regulation, which contribute to controlling the expression of genes locally and even far away at the transcriptional and post-transcriptional levels [48]. In a study of Zootoca vivipara, TE was found to be highly conserved and played a positive role in scaly animal genome evolution [49]. In this study, we screened key regulatory genes in the complex regulatory network through high-throughput sequencing and revealed the molecular regulatory mechanisms of the development of ascidian larvae.
Our ATAC-seq results identified vital genes associated with notochord tubulogenesis and lumen expansion, including DLK2, BMP5, BMP2, JAG, PCDH18, FBN1, and SLC37A1. DLK2 belongs to the Notch/Delta/Serrata family, and it has been reported to regulate metastatic melanoma cell proliferation in a dose-dependent manner [50]. JAG1 is the ligand for Notch1, and upregulated JAG1 promotes cell proliferation in adrenocortical carcinoma [51]. BMP2 [52] and BMP5 [53] have been reported to regulate cell proliferation. They target epidermal and muscle cells, and they might be involved in regulating the proliferation of epidermal and muscle cells used for tail extension. It has been reported that BMP signaling regulates anterior neurectoderm specification and differentiation in C. intestinalis [54]. PCDH18 expression was observed near the eyespot and CNS, which is similar to its localization in zebrafish [55]. Diversified PCDH molecules contribute to neural circuit development. In in vivo and in vitro mouse hippocampal neurons, Pcdha knockout resulted in the decreased dendrite arborization, and this arborization defect was dependent on a PYK2/Rho/Rac pathway [56,57,58]. From St. 24 to St. 25, FBN1 was expressed in epidermal cells, and SLC37A1 was expressed in notochord cells. They might be involved in epidermal cell extension and notochordal lumen formation and expansion. The RNA-seq results identified DEGs enriched in membrane transport and ion transport-related pathways, consistent with the formation of the notochordal lumen through the establishment of polarity, cytoskeletal rearrangement, and expansion of the notochordal lumen with ion flow (SLC26A), proteoglycan secretion, vesicle trafficking (ELMOD3), and replenishment of the apical membrane (14-3-3εa and caveolin) [17,59,60,61,62].
A comprehensive analysis of ATAC-seq and RNA-seq data demonstrated that all 12 DEGs had high chromatin openness in St. 25. The analysis revealed that increased chromatin accessibility was correlated with increased transcription, although there was a clear increase in regional accessibility corresponding to decreased transcription, which might be attributable to transcriptional repressors binding to open chromatin regions [63]. Among them, MMP24 and KLF5 targeted notochord cells in the lumen formation stage. The dominant-negative effect of Cs-KLF5 and drug treatment targeting Cs-MMP24 resulted in abnormal lumen formation and expansion. KLF5 induces ECM degradation by promoting MMP expression and secretion [64]. KLF5 has been identified as a crucial factor in cardiovascular diseases [65]. We hypothesize that Cs-KLF5 and Cs-MMP24 coregulate the formation of the notochord lumen.
Motif enrichment analysis of open regions revealed enriched TFs, including Tbx15/18/22, FoxD-b, Six3/6, FoxE, FoxI-a, FoxK, GATA-a, Fos-B, and FoxL2. The potential roles of these TFs were summarized according to the functions of these genes in ascidian larval development (Figure 5C).
Overall, we identified 12 candidate genes through a combination analysis of ATAC-seq and RNA-seq data. Cs-KLF5 and Cs-MMP24 were proven necessary for the formation and expansion of the notochord lumen. Our approach for identifying open chromatin regions and predicting TFs involved in the regulation of ascidian development offers new resources for further mechanistic exploration in ascidian embryonic development.
4. Materials and Methods
4.1. Animals
Adult specimens of C. savignyi were collected from Huangdao, Qingdao, China. The animals were kept in the laboratory under controlled conditions, in seawater with a salinity of 32‰. We obtained eggs and sperms through dissecting adult animals. After fertilization and dechorionation, embryos were cultured at 16 °C. We collected embryos at three different stages for ATAC-seq and RNA-sequencing.
4.2. ATAC-Seq Analysis
Raw sequencing reads were initially processed and adapter sequences were removed using Fastp [66]. Clean reads were obtained from the raw data by quality control and then aligned to the reference genome Ciona_savignyi_51511_TX_20220104_seqkit. fasta (unpublished data) with Bowtie2 [67] using default settings. MACS2 software (v2.2.7.1) [68] was used to detect peaks. The parameters of peak calling are --nomodel, --shift -100, --extsize 200. According to the genomic location and gene annotation information of peaks, peak-related genes can be annotated using ChIPseeker [69]. Moreover, the distribution of peaks in different genomic regions (such as exon, intron, promoter, downstream regions, intergenic regions, 3’-UTRs, 5’-UTRs) was estimated. Promoters are defined as 2 kb upstream and downstream of TSS. Differentially accessible chromatin regions (DARs) were identified by DiffBind software (v3.8.4) [70]. Peaks with FDR under 0.05 were considered differentially accessible peaks. And the R-package ChIPseeker was used to associate differentially accessible peaks with their putative target genes [69]. Transcription factor enrichment of sequences from the known urochordate motif database from JASPAR was performed using SEA (Simple Enrichment Analysis, evalue ≤ 10) [71]. Downstream gene prediction was performed by motif scanning of open chromatin regions using FIMO.
4.3. RNA-Seq Analysis
RNA-seq reads that passed the filter were trimmed to eliminate low-quality reads and adapters by Fastp [66]. Reads were aligned by STAR [72]. The edgeR method has high sensitivity and accuracy for medium-scale RNA sequencing data, so differential gene expression was analyzed using edgeR [73]. Significantly differentially expressed genes (DEGs) were identified based on the following criteria: |log2 fold change| ≥ 1 and padj < 0.05. Two biological replicates were used. The R package ggplot2 was used to plot heatmap and volcano plots [74].
4.4. GO Enrichment Analysis
GO enrichment analysis of DEGs and genes adjacent to DARs was implemented using the clusterprofiler (v4.6.2) [75] R package. GO annotations came from annotations on C. savignyi genomes (unpublished data) using interproscan. GO terms with a corrected p-value < 0.05 were considered significantly enriched.
4.5. Integration Analysis of ATAC-Seq and RNA-Seq
We compared the expression profiles of differentially accessible peak-related genes in ATAC-seq with DEGs in RNA-sequencing. Genes associated with closed-to-open peaks in ATAC-seq were compared with DEGs upregulated in RNA-seq. Genes associated with open-to-closed peaks in ATAC-seq were compared with DEGs downregulated in RNA-seq [76]. Genes with changes in both gene expression and chromatin accessibility were shortlisted, followed by Spearman’s correlation analysis.
4.6. Identification and Classification of TFs
The methods used here follow a previously described protocol [77]. TFs were identified and categorized according to the conserved DNA binding domains (DBDs). The protein domains were analyzed using Hidden Markov Model (HMM) profiles from the Pfam database [78], applying the hmmscan program in the HMMER package. Pfam ID of DBDs were identified from the REGULATOR database [79]. Genes containing DBDs were screened and classified as TFs with an e-value threshold of 10−4. Pfam IDs are shown in Table S13. TFs were classified into different families according to the DBDs.
4.7. Quantitative Real-Time PCR (qPCR)
These methods are described in detail in [80]. RNAiso plus (TAKARA, Kusatsu, Shiga Japan) was used to isolate total RNA from frozen embryos at different stages. For reverse transcription, HiScript II Q RT SuperMix for qPCR (+gDNA wiper) was utilized. The expression levels of DEG/DAR-associated genes were detected by 2-step qPCR (Vazyme, Nanjing, China). We calculated data using 2−ΔΔCt. Statistical analysis was conducted using paired Student’s t-tests, with a significance level of p < 0.05. Prism 9 software (v 8.0.2) was used to plot the graph of qPCR results. The primers used in qPCR are listed in Table S15.
4.8. Plasmid Constructions
Tissue expression patterns were performed by gene promoter analysis. DNA sequences upstream of DEG/DAR-associated genes were amplified and subcloned into the pEGFP-1 vector for promoter analysis. And the promoter sequence was compared to the genes encoded in the genome through BLAST [81] to ensure that the promoter did not contain other genes. Then, these constructs were confirmed by sequencing. The primers used in plasmid construction are listed in Table S15.
4.9. Electroporation
We performed electroporation experiments according to a previously described method with some modifications. Specifically, the parameter of the exponential protocol was used with 50 V and 1500 μF [82]. The electroporation system consisted of a plasmid of 60–80 μg, 420 μL 0.77 M D-mannitol, and ddH2O. Dechorionated fertilized eggs (300 μL) were mixed with the electroliquid system in 0.4 cm cuvettes of a Gene PulserX cell System (BIO-RAD, Hercules, CA, USA).
4.10. Drug Treatment and Immunostaining
Embryos were treated with 40 µM of the inhibitors ilomastat (GM6001, HY-15768, MedChemExpres, Monmouth Junction, NJ, USA) [83] and DMSO at 12 h post fertilization (hpf). Up to 22 hpf, embryos were collected and fixed with 4% paraformaldehyde (PFA) at room temperature for 2 h. Fixed embryos were washed three times with PBS containing 0.1% Triton X-100 (PBST), and then stained with phalloidin in PBST (1:300) overnight at 4 °C to mark the cell boundary of embryos. Embryos were then washed three times with PBST. DAPI staining was performed in the dark to label the cell nucleus.
4.11. Statistics
Lumen volume was measured according to the method described previously [84]. We also measured the anteroposterior (A-P) diameter (d1) and dorsoventral (D-V) diameter (d2) using ImageJ and calculated lumen volume using the spheroid formula (V = ⅙πd1d22) (Figure S4). Then, we counted the lumen volume in the DMSO and inhibitor treatment group separately. All data are presented as mean ± SEM. We performed statistical analysis using Student’s t-test. p < 0.05 (*) and p < 0.01 (**) indicate statistical significance.
Supplementary Materials
The following supporting information can be downloaded at: https://www.mdpi.com/article/10.3390/ijms25052793/s1.
Author Contributions
Conceptualization, M.H. and B.D.; methodology, M.H., Y.L. (Yuting Li) and Y.L. (Yajuan Li); investigation, M.H. and Y.L. (Yuting Li); data curation, B.D.; writing—original draft preparation, M.H.; writing—review and editing, B.D. and H.Y.; supervision, B.D.; project administration: H.Y.; funding acquisition: H.Y. and B.D.; All authors have read and agreed to the published version of the manuscript.
Funding
This research was funded the National Key Research and Development Program of China (2022YFC2601302), the Science and Technology Innovation Project of Laoshan Laboratory (No. LSKJ202203002), the Natural Science Foundation of Shandong Province (ZR2023MD029), and the Taishan Scholar Program of Shandong Province, China.
Institutional Review Board Statement
Not applicable.
Informed Consent Statement
Not applicable.
Data Availability Statement
The datasets presented in this study can be found in online reposito- ries. The ATAC-seq data of all stages and RNA-seq data of St. 21 and St. 24 are deposited in NCBI under the BioProject number PRJNA1064177. The RNA-seq data of St. 25 were downloaded from the NCBI SRA database, with access numbers SRR6431994 and SRR6431995.
Acknowledgments
We thank the members of Dong Laboratory, including Wei Zhang, Jin Zhang, Zhuqing Wang, and Shanhao Han, for experimental technical guidance, and Jiankai Wei for bioinformatics analysis.
Conflicts of Interest
The authors declare no conflicts of interest.
References
- Corbo, J.C.; Erives, A.; Di Gregorio, A.; Chang, A.; Levine, M. Dorsoventral patterning of the vertebrate neural tube is conserved in a protochordate. Development 1997, 124, 2335–2344. [Google Scholar] [CrossRef] [PubMed]
- Schaeffer, B. Deuterostome Monophyly and Phylogeny. Evol. Biol. 1987, 21, 179–235. [Google Scholar]
- Turbeville, J.M.; Schulz, J.R.; Raff, R.A. Deuterostome phylogeny and the sister group of the chordates: Evidence from molecules and morphology. Mol. Biol. Evol. 1994, 11, 648–655. [Google Scholar] [CrossRef] [PubMed]
- Delsuc, F.; Brinkmann, H.; Chourrout, D.; Philippe, H. Tunicates and not cephalochordates are the closest living relatives of vertebrates. Nature 2006, 439, 965–968. [Google Scholar] [CrossRef] [PubMed]
- Bourlat, S.J.; Juliusdottir, T.; Lowe, C.J.; Freeman, R.; Aronowicz, J.; Kirschner, M.; Lander, E.S.; Thorndyke, M.; Nakano, H.; Kohn, A.B.; et al. Deuterostome phylogeny reveals monophyletic chordates and the new phylum Xenoturbellida. Nature 2006, 444, 85–88. [Google Scholar] [CrossRef]
- Lemaire, P. Unfolding a chordate developmental program, one cell at a time: Invariant cell lineages, short-range inductions and evolutionary plasticity in ascidians. Dev. Biol. 2009, 332, 48–60. [Google Scholar] [CrossRef]
- Lemaire, P. Evolutionary crossroads in developmental biology: The tunicates. Development 2011, 138, 2143–2152. [Google Scholar] [CrossRef]
- Hotta, K.; Mitsuhara, K.; Takahashi, H.; Inaba, K.; Oka, K.; Gojobori, T.; Ikeo, K. A web-based interactive developmental table for the ascidian Ciona intestinalis, including 3D real-image embryo reconstructions: I. From fertilized egg to hatching larva. Dev. Dyn. 2007, 236, 1790–1805. [Google Scholar] [CrossRef]
- Stolfi, A.; Gandhi, S.; Salek, F.; Christiaen, L. Tissue-specific genome editing in Ciona embryos by CRISPR/Cas9. Development 2014, 141, 4115–4120. [Google Scholar] [CrossRef]
- Hill, M.M.; Broman, K.W.; Stupka, E.; Smith, W.C.; Jiang, D.; Sidow, A. The C. savignyi genetic map and its integration with the reference sequence facilitates insights into chordate genome evolution. Genome Res. 2008, 18, 1369–1379. [Google Scholar] [CrossRef]
- Satou, Y.; Nakamura, R.; Yu, D.; Yoshida, R.; Hamada, M.; Fujie, M.; Hisata, K.; Takeda, H.; Satoh, N. A Nearly Complete Genome of Ciona intestinalis Type A (C. robusta) Reveals the Contribution of Inversion to Chromosomal Evolution in the Genus Ciona. Genome Biol. Evol. 2019, 11, 3144–3157. [Google Scholar] [CrossRef] [PubMed]
- Wei, J.; Liu, P.; Liu, F.; Jiang, A.; Qiao, J.; Pu, Z.; Wang, B.; Zhang, J.; Jia, D.; Li, Y.; et al. EDomics: A comprehensive and comparative multi-omics database for animal evo-devo. Nucleic Acids Res. 2023, 51, D913–D923. [Google Scholar] [CrossRef] [PubMed]
- Lu, Q.; Gao, Y.; Fu, Y.; Peng, H.; Shi, W.; Li, B.; Lv, Z.; Feng, X.Q.; Dong, B. Ciona embryonic tail bending is driven by asymmetrical notochord contractility and coordinated by epithelial proliferation. Development 2020, 147, dev185868. [Google Scholar] [CrossRef]
- Lu, Q.; Bhattachan, P.; Dong, B. Ascidian notochord elongation. Dev. Biol. 2019, 448, 147–153. [Google Scholar] [CrossRef]
- Dong, B.; Horie, T.; Denker, E.; Kusakabe, T.; Tsuda, M.; Smith, W.C.; Jiang, D. Tube formation by complex cellular processes in Ciona intestinalis notochord. Dev. Biol. 2009, 330, 237–249. [Google Scholar] [CrossRef] [PubMed]
- Miyamoto, D.M.; Crowther, R.J. Formation of the notochord in living ascidian embryos. J. Embryol. Exp. Morphol. 1985, 86, 1–17. [Google Scholar] [CrossRef]
- Liu, A.; Ouyang, X.; Wang, Z.; Dong, B. ELMOD3-Rab1A-Flotillin2 cascade regulates lumen formation via vesicle trafficking in Ciona notochord. Open Biol. 2023, 13, 220367. [Google Scholar] [CrossRef]
- Ouyang, X.; Wu, B.; Yu, H.; Dong, B. DYRK1-mediated phosphorylation of endocytic components is required for extracellular lumen expansion in ascidian notochord. Biol. Res. 2023, 56, 10. [Google Scholar] [CrossRef]
- Peng, H.; Qiao, R.; Dong, B. Polarity Establishment and Maintenance in Ascidian Notochord. Front. Cell Dev. Biol. 2020, 8, 597446. [Google Scholar] [CrossRef]
- Jiang, D.; Smith, W.C. Ascidian notochord morphogenesis. Dev. Dyn. 2007, 236, 1748–1757. [Google Scholar] [CrossRef]
- Buenrostro, J.D.; Giresi, P.G.; Zaba, L.C.; Chang, H.Y.; Greenleaf, W.J. Transposition of native chromatin for fast and sensitive epigenomic profiling of open chromatin, DNA-binding proteins and nucleosome position. Nat. Methods 2013, 10, 1213–1218. [Google Scholar] [CrossRef]
- Luo, L.; Gribskov, M.; Wang, S. Bibliometric review of ATAC-Seq and its application in gene expression. Brief. Bioinform. 2022, 23, bbac061. [Google Scholar] [CrossRef] [PubMed]
- Magri, M.S.; Jimenez-Gancedo, S.; Bertrand, S.; Madgwick, A.; Escriva, H.; Lemaire, P.; Gomez-Skarmeta, J.L. Assaying Chromatin Accessibility Using ATAC-Seq in Invertebrate Chordate Embryos. Front. Cell Dev. Biol. 2019, 7, 372. [Google Scholar] [CrossRef] [PubMed]
- Madgwick, A.; Magri, M.S.; Dantec, C.; Gailly, D.; Fiuza, U.M.; Guignard, L.; Hettinger, S.; Gomez-Skarmeta, J.L.; Lemaire, P. Evolution of embryonic cis-regulatory landscapes between divergent Phallusia and Ciona ascidians. Dev. Biol. 2019, 448, 71–87. [Google Scholar] [CrossRef] [PubMed]
- Thomas, S.; Li, X.Y.; Sabo, P.J.; Sandstrom, R.; Thurman, R.E.; Canfield, T.K.; Giste, E.; Fisher, W.; Hammonds, A.; Celniker, S.E.; et al. Dynamic reprogramming of chromatin accessibility during Drosophila embryo development. Genome Biol. 2011, 12, R43. [Google Scholar] [CrossRef] [PubMed]
- Daugherty, A.C.; Yeo, R.W.; Buenrostro, J.D.; Greenleaf, W.J.; Kundaje, A.; Brunet, A. Chromatin accessibility dynamics reveal novel functional enhancers in C. elegans. Genome Res. 2017, 27, 2096–2107. [Google Scholar] [CrossRef]
- Wu, J.; Huang, B.; Chen, H.; Yin, Q.; Liu, Y.; Xiang, Y.; Zhang, B.; Liu, B.; Wang, Q.; Xia, W.; et al. The landscape of accessible chromatin in mammalian preimplantation embryos. Nature 2016, 534, 652–657. [Google Scholar] [CrossRef] [PubMed]
- Glover-Cutter, K.; Kim, S.; Espinosa, J.; Bentley, D.L. RNA polymerase II pauses and associates with pre-mRNA processing factors at both ends of genes. Nat. Struct. Mol. Biol. 2008, 15, 71–78. [Google Scholar] [CrossRef] [PubMed]
- Buenrostro, J.D.; Wu, B.; Chang, H.Y.; Greenleaf, W.J. ATAC-seq: A Method for Assaying Chromatin Accessibility Genome-Wide. Curr. Protoc. Mol. Biol. 2015, 109, 21.29.1–21.29.9. [Google Scholar] [CrossRef]
- Li, C.; Cantor, W.J.; Nili, N.; Robinson, R.; Fenkell, L.; Tran, Y.L.; Whittingham, H.A.; Tsui, W.; Cheema, A.N.; Sparkes, J.D.; et al. Arterial repair after stenting and the effects of GM6001, a matrix metalloproteinase inhibitor. J. Am. Coll. Cardiol. 2002, 39, 1852–1858. [Google Scholar] [CrossRef]
- Conkright, M.D.; Wani, M.A.; Anderson, K.P.; Lingrel, J.B. A gene encoding an intestinal-enriched member of the Krüppel-like factor family expressed in intestinal epithelial cells. Nucleic Acids Res. 1999, 27, 1263–1270. [Google Scholar] [CrossRef]
- Yang, X.O.; Doty, R.T.; Hicks, J.S.; Willerford, D.M. Regulation of T-cell receptor D beta 1 promoter by KLF5 through reiterated GC-rich motifs. Blood 2003, 101, 4492–4499. [Google Scholar] [CrossRef] [PubMed]
- Yu, D.; Iwamura, Y.; Satou, Y.; Oda-Ishii, I. Tbx15/18/22 shares a binding site with Tbx6-r.b to maintain expression of a muscle structural gene in ascidian late embryos. Dev. Biol. 2022, 483, 1–12. [Google Scholar] [CrossRef] [PubMed]
- Sinigaglia, C.; Busengdal, H.; Leclère, L.; Technau, U.; Rentzsch, F. The bilaterian head patterning gene six3/6 controls aboral domain development in a cnidarian. PLoS Biol. 2013, 11, e1001488. [Google Scholar] [CrossRef] [PubMed]
- Ogura, A.; Yoshida, M.A.; Moritaki, T.; Okuda, Y.; Sese, J.; Shimizu, K.K.; Sousounis, K.; Tsonis, P.A. Loss of the six3/6 controlling pathways might have resulted in pinhole-eye evolution in Nautilus. Sci. Rep. 2013, 3, 1432. [Google Scholar] [CrossRef] [PubMed]
- Tokuhiro, S.; Satou, Y. Cis-regulatory code for determining the action of Foxd as both an activator and a repressor in ascidian embryos. Dev. Biol. 2021, 476, 11–17. [Google Scholar] [CrossRef] [PubMed]
- Imai, K.S.; Satoh, N.; Satou, Y. An essential role of a FoxD gene in notochord induction in Ciona embryos. Development 2002, 129, 3441–3453. [Google Scholar] [CrossRef] [PubMed]
- Ogasawara, M.; Satou, Y. Expression of FoxE and FoxQ genes in the endostyle of Ciona intestinalis. Dev. Genes Evol. 2003, 213, 416–419. [Google Scholar] [CrossRef] [PubMed]
- Edlund, R.K.; Birol, O.; Groves, A.K. The role of foxi family transcription factors in the development of the ear and jaw. Curr. Top. Dev. Biol. 2015, 111, 461–495. [Google Scholar] [CrossRef]
- Casas-Tinto, S.; Gomez-Velazquez, M.; Granadino, B.; Fernandez-Funez, P. FoxK mediates TGF-beta signalling during midgut differentiation in flies. J. Cell Biol. 2008, 183, 1049–1060. [Google Scholar] [CrossRef]
- Bertho, S.; Pasquier, J.; Pan, Q.; Le Trionnaire, G.; Bobe, J.; Postlethwait, J.H.; Pailhoux, E.; Schartl, M.; Herpin, A.; Guiguen, Y. Foxl2 and Its Relatives Are Evolutionary Conserved Players in Gonadal Sex Differentiation. Sex. Dev. 2016, 10, 111–129. [Google Scholar] [CrossRef] [PubMed]
- Verdin, H.; De Baere, E. FOXL2 impairment in human disease. Horm. Res. Paediatr. 2012, 77, 2–11. [Google Scholar] [CrossRef]
- Han, X.; Boyd, P.J.; Colgan, S.; Madri, J.A.; Haas, T.L. Transcriptional up-regulation of endothelial cell matrix metalloproteinase-2 in response to extracellular cues involves GATA-2. J. Biol. Chem. 2003, 278, 47785–47791. [Google Scholar] [CrossRef] [PubMed]
- Akiyama, T.; Suzuki, N.; Ishikawa, M.; Fujimori, K.; Sone, T.; Kawada, J.; Funayama, R.; Fujishima, F.; Mitsuzawa, S.; Ikeda, K.; et al. Aberrant axon branching via Fos-B dysregulation in FUS-ALS motor neurons. eBioMedicine 2019, 45, 362–378. [Google Scholar] [CrossRef] [PubMed]
- Lenhard, B.; Sandelin, A.; Carninci, P. Metazoan promoters: Emerging characteristics and insights into transcriptional regulation. Nat. Rev. Genet. 2012, 13, 233–245. [Google Scholar] [CrossRef]
- Spitz, F.; Furlong, E.E. Transcription factors: From enhancer binding to developmental control. Nat. Rev. Genet. 2012, 13, 613–626. [Google Scholar] [CrossRef]
- Long, H.K.; Prescott, S.L.; Wysocka, J. Ever-Changing Landscapes: Transcriptional Enhancers in Development and Evolution. Cell 2016, 167, 1170–1187. [Google Scholar] [CrossRef] [PubMed]
- Gebrie, A. Transposable elements as essential elements in the control of gene expression. Mob. DNA 2023, 14, 9. [Google Scholar] [CrossRef]
- Petraccioli, A.; Guarino, F.M.; Kupriyanova, L.; Mezzasalma, M.; Odierna, G.; Picariello, O.; Capriglione, T. Isolation and Characterization of Interspersed Repeated Sequences in the Common Lizard, Zootoca vivipara, and Their Conservation in Squamata. Cytogenet. Genome Res. 2019, 157, 65–76. [Google Scholar] [CrossRef]
- Nueda, M.L.; Naranjo, A.I.; Baladrón, V.; Laborda, J. The proteins DLK1 and DLK2 modulate NOTCH1-dependent proliferation and oncogenic potential of human SK-MEL-2 melanoma cells. Biochim. Biophys. Acta 2014, 1843, 2674–2684. [Google Scholar] [CrossRef]
- Simon, D.P.; Giordano, T.J.; Hammer, G.D. Upregulated JAG1 enhances cell proliferation in adrenocortical carcinoma. Clin. Cancer Res. 2012, 18, 2452–2464. [Google Scholar] [CrossRef]
- Prados, B.; Gómez-Apiñániz, P.; Papoutsi, T.; Luxán, G.; Zaffran, S.; Pérez-Pomares, J.M.; de la Pompa, J.L. Myocardial Bmp2 gain causes ectopic EMT and promotes cardiomyocyte proliferation and immaturity. Cell Death Dis. 2018, 9, 399. [Google Scholar] [CrossRef]
- Johnsen, I.K.; Kappler, R.; Auernhammer, C.J.; Beuschlein, F. Bone morphogenetic proteins 2 and 5 are down-regulated in adrenocortical carcinoma and modulate adrenal cell proliferation and steroidogenesis. Cancer Res. 2009, 69, 5784–5792. [Google Scholar] [CrossRef]
- Roure, A.; Chowdhury, R.; Darras, S. Regulation of anterior neurectoderm specification and differentiation by BMP signaling in ascidians. Development 2023, 150, dev201575. [Google Scholar] [CrossRef]
- Kubota, F.; Murakami, T.; Tajika, Y.; Yorifuji, H. Expression of protocadherin 18 in the CNS and pharyngeal arches of zebrafish embryos. Int. J. Dev. Biol. 2008, 52, 397–405. [Google Scholar] [CrossRef] [PubMed]
- Hirayama, T.; Yagi, T. The role and expression of the protocadherin-alpha clusters in the CNS. Curr. Opin. Neurobiol. 2006, 16, 336–342. [Google Scholar] [CrossRef] [PubMed]
- Peek, S.L.; Mah, K.M.; Weiner, J.A. Regulation of neural circuit formation by protocadherins. Cell. Mol. Life Sci. 2017, 74, 4133–4157. [Google Scholar] [CrossRef] [PubMed]
- Suo, L.; Lu, H.; Ying, G.; Capecchi, M.R.; Wu, Q. Protocadherin clusters and cell adhesion kinase regulate dendrite complexity through Rho GTPase. J. Mol. Cell Biol. 2012, 4, 362–376. [Google Scholar] [CrossRef] [PubMed]
- Bhattachan, P.; Rae, J.; Yu, H.; Jung, W.; Wei, J.; Parton, R.G.; Dong, B. Ascidian caveolin induces membrane curvature and protects tissue integrity and morphology during embryogenesis. FASEB J. Off. Publ. Fed. Am. Soc. Exp. Biol. 2020, 34, 1345–1361. [Google Scholar] [CrossRef] [PubMed]
- Deng, W.; Nies, F.; Feuer, A.; Bocina, I.; Oliver, D.; Jiang, D. Anion translocation through an Slc26 transporter mediates lumen expansion during tubulogenesis. Proc. Natl. Acad. Sci. USA 2013, 110, 14972–14977. [Google Scholar] [CrossRef] [PubMed]
- Mizotani, Y.; Suzuki, M.; Hotta, K.; Watanabe, H.; Shiba, K.; Inaba, K.; Tashiro, E.; Oka, K.; Imoto, M. 14-3-3εa directs the pulsatile transport of basal factors toward the apical domain for lumen growth in tubulogenesis. Proc. Natl. Acad. Sci. USA 2018, 115, E8873–E8881. [Google Scholar] [CrossRef] [PubMed]
- Wei, J.; Wang, G.; Li, X.; Ren, P.; Yu, H.; Dong, B. Architectural delineation and molecular identification of extracellular matrix in ascidian embryos and larvae. Biol. Open 2017, 6, 1383–1390. [Google Scholar] [CrossRef]
- Truskina, J.; Han, J.; Chrysanthou, E.; Galvan-Ampudia, C.S.; Lainé, S.; Brunoud, G.; Macé, J.; Bellows, S.; Legrand, J.; Bågman, A.M.; et al. A network of transcriptional repressors modulates auxin responses. Nature 2021, 589, 116–119. [Google Scholar] [CrossRef] [PubMed]
- Delgado-Olguín, P.; Dang, L.T.; He, D.; Thomas, S.; Chi, L.; Sukonnik, T.; Khyzha, N.; Dobenecker, M.W.; Fish, J.E.; Bruneau, B.G. Ezh2-mediated repression of a transcriptional pathway upstream of Mmp9 maintains integrity of the developing vasculature. Development 2014, 141, 4610–4617. [Google Scholar] [CrossRef]
- Xie, Z.; Chen, J.; Wang, C.; Zhang, J.; Wu, Y.; Yan, X. Current knowledge of Krüppel-like factor 5 and vascular remodeling: Providing insights for therapeutic strategies. J. Mol. Cell Biol. 2021, 13, 79–90. [Google Scholar] [CrossRef]
- Chen, S.; Zhou, Y.; Chen, Y.; Gu, J. fastp: An ultra-fast all-in-one FASTQ preprocessor. Bioinformatics 2018, 34, i884–i890. [Google Scholar] [CrossRef] [PubMed]
- Langmead, B.; Salzberg, S.L. Fast gapped-read alignment with Bowtie 2. Nat. Methods 2012, 9, 357–359. [Google Scholar] [CrossRef]
- Zhang, Y.; Liu, T.; Meyer, C.A.; Eeckhoute, J.; Johnson, D.S.; Bernstein, B.E.; Nusbaum, C.; Myers, R.M.; Brown, M.; Li, W.; et al. Model-based analysis of ChIP-Seq (MACS). Genome Biol. 2008, 9, R137. [Google Scholar] [CrossRef]
- Yu, G.; Wang, L.G.; He, Q.Y. ChIPseeker: An R/Bioconductor package for ChIP peak annotation, comparison and visualization. Bioinformatics 2015, 31, 2382–2383. [Google Scholar] [CrossRef]
- Stark, R.; Brown, G. DiffBind: Differential Binding Analysis of ChIP-Seq Peak Data. Bioconductor. 2011. Available online: http://bioconductor.org/packages/release/bioc/vignettes/DiffBind/inst/doc/DiffBind.pdf (accessed on 20 January 2024).
- Bailey, T.L.; Grant, C.E. SEA: Simple Enrichment Analysis of motifs. bioXiv 2021. [Google Scholar] [CrossRef]
- Dobin, A.; Davis, C.A.; Schlesinger, F.; Drenkow, J.; Zaleski, C.; Jha, S.; Batut, P.; Chaisson, M.; Gingeras, T.R. STAR: Ultrafast universal RNA-seq aligner. Bioinformatics 2013, 29, 15–21. [Google Scholar] [CrossRef]
- Robinson, M.D.; McCarthy, D.J.; Smyth, G.K. edgeR: A Bioconductor package for differential expression analysis of digital gene expression data. Bioinformatics 2010, 26, 139–140. [Google Scholar] [CrossRef]
- Wickham, H. ggplot2: Elegant Graphics for Data Analysis; Springer: New York, NY, USA, 2016. [Google Scholar]
- Wu, T.; Hu, E.; Xu, S.; Chen, M.; Guo, P.; Dai, Z.; Feng, T.; Zhou, L.; Tang, W.; Zhan, L.; et al. clusterProfiler 4.0: A universal enrichment tool for interpreting omics data. Innovation 2021, 2, 100141. [Google Scholar] [CrossRef]
- Sun, Z.; Li, J.; Lv, L.; Gou, Y.; Wang, B.; Hao, T. Integration of ATAC-seq and RNA-seq identifies active G-protein coupled receptors functioning in molting process in muscle of Eriocheir sinensis. Front. Mar. Sci. 2022, 9, 900160. [Google Scholar] [CrossRef]
- Zhang, J.; Wei, J.; Yu, H.; Dong, B. Genome-Wide Identification, Comparison, and Expression Analysis of Transcription Factors in Ascidian Styela clava. Int. J. Mol. Sci. 2021, 22, 4317. [Google Scholar] [CrossRef]
- Mistry, J.; Chuguransky, S.; Williams, L.; Qureshi, M.; Salazar, G.A.; Sonnhammer, E.L.L.; Tosatto, S.C.E.; Paladin, L.; Raj, S.; Richardson, L.J.; et al. Pfam: The protein families database in 2021. Nucleic Acids Res. 2021, 49, D412–D419. [Google Scholar] [CrossRef] [PubMed]
- Wang, K.; Nishida, H. REGULATOR: A database of metazoan transcription factors and maternal factors for developmental studies. BMC Bioinform. 2015, 16, 114. [Google Scholar] [CrossRef] [PubMed]
- He, M.; Wei, J.; Li, Y.; Dong, B. Nuclear Factor of Activated T Cells-5 Regulates Notochord Lumenogenesis in Chordate Larval Development. Int. J. Mol. Sci. 2022, 23, 14407. [Google Scholar] [CrossRef] [PubMed]
- Altschul, S.F.; Gish, W.; Miller, W.; Myers, E.W.; Lipman, D.J. Basic local alignment search tool. J. Mol. Biol. 1990, 215, 403–410. [Google Scholar] [CrossRef] [PubMed]
- Corbo, J.C.; Levine, M.; Zeller, R.W. Characterization of a notochord-specific enhancer from the Brachyury promoter region of the ascidian, Ciona intestinalis. Development 1997, 124, 589–602. [Google Scholar] [CrossRef] [PubMed]
- Huntley, G.W. Synaptic circuit remodelling by matrix metalloproteinases in health and disease. Nat. Rev. Neurosci. 2012, 13, 743–757. [Google Scholar] [CrossRef] [PubMed]
- Wang, Z.; Tan, Z.; Bi, J.; Liu, A.; Jiang, A.; Dong, B. Proteomic identification of intracellular vesicle trafficking and protein glycosylation requirements for lumen inflation in Ciona notochord. Proteomics 2023, 23, e2200460. [Google Scholar] [CrossRef] [PubMed]
Figure 1.
Morphological characterization of embryonic development in C. savignyi and the landscape of DNA accessibility in three developmental stages. (A) St. 21, St. 24, and St. 25 C. savignyi embryos cultured at 16 °C were stained with phalloidin. The upper images present the intact ascidian embryo, and the lower images present the notochord tissue. Scale bar, 10 μm. (B) Peak distribution ratio of gene functional elements. Six regions were detected: 3’-UTRs, 5’-UTRs, exon, intron, promoter, and intergenic regions. (C,D) Scatter plot indicates the pattern of differentially accessible regions (DARs) in different developmental stages, including both FDR < 0.05 (red) and FDR ≥ 0.05 (blue) genes. (E,F) GO enrichment analysis of DAR-associated genes. C and E: St. 21 vs. St. 24; D and F: St. 24 vs. St. 25.

Figure 2.
Visualization of DEGs. (A,C) Visualization of gene expression changes. padj is represented by −log10(padj) in the ordinate, and gene expression is represented by log2 (fold change) in the abscissa. Blue, red, and gray dots indicate downregulated DEGs, upregulated DEGs, and genes with no significant expression change, respectively. (B,D) GO enrichment analysis of DEGs at different stages. B: St. 21 vs. St. 24, D: St. 24 vs. St. 25.

Figure 3.
Integrated analysis of ATAC-seq and RNA-seq data. (A,B) Intersection of different mRNAs and target genes of different peaks. DAR-associated genes (green and purple indicate St. 21 vs. St. 24 and St. 24 vs. St. 25, respectively) and DEGs (blue and orange indicate St. 21 vs. St. 24 and St. 24 vs. St. 25, respectively). (C) Chromatin opening and expression changes of associated genes. IGV plots present ATAC-seq signals in selected gene loci. Gene expression was determined by quantitative fluorescence PCR and transcriptomic analysis. Blue, red, and green represent chromatin fragments of St. 21, St. 24, and St. 25, respectively. Black and gray bars represent transcriptome data and quantitative fluorescence PCR results of genes, respectively.

Figure 4.
Expression and functional assay of key genes in larval development. (A) Tissue expression patterns of the selected genes as determined by promoter assay. Scale bar, 50 μm. (B) Treatment with an MMP24 inhibitor (GM6001, 40 μM) arrested lumen expansion. Scale bar, 10 μm. The asterisk marks the lumen. (C) Quantification of lumen volume in DMSO- (n = 191) and GM6001-treated embryos (n = 165) embryos at 22 hpf. Statistical analysis was performed using Student’s t-test, p < 0.001 (***). (D) Overexpression of dominant-negative Cs-KLF5 led to failure of lumen formation. Schematic images located on the right side of confocal images present the phenotypes of Cs-KLF5 knockdown and control. The green, blue, and red areas represent the notochord cells, nuclei, and nuclei in cells expressing Bra>Cs-KLF5DN::tdtomato/Bra> tdtomato (red), respectively. Scale bar, 10 μm.

Figure 5.
TF binding motif enrichment analysis. (A) Nine TF binding motifs enriched in accessible regions from closed to open in St. 21 versus St. 24. (B) Eight TF binding motifs enriched in accessible regions from closed to open in St. 24 versus St. 25. Red highlights the upregulation of TFs. (A,B). The X-axis represents −log10 (p-value) in the motif enrichment analysis. The Y-axis represents the predicted TF binding motifs. (C) Summary of the potential roles of TFs in Ciona larval development. Different colored arrows represent downstream genes that may be regulated by different transcription factors.

Disclaimer/Publisher’s Note: The statements, opinions and data contained in all publications are solely those of the individual author(s) and contributor(s) and not of MDPI and/or the editor(s). MDPI and/or the editor(s) disclaim responsibility for any injury to people or property resulting from any ideas, methods, instructions or products referred to in the content. |
© 2024 by the authors. Licensee MDPI, Basel, Switzerland. This article is an open access article distributed under the terms and conditions of the Creative Commons Attribution (CC BY) license (https://creativecommons.org/licenses/by/4.0/).
Share and Cite
MDPI and ACS Style
He, M.; Li, Y.; Li, Y.; Dong, B.; Yu, H. Dynamics of Chromatin Opening across Larval Development in the Urochordate Ascidian Ciona savignyi. Int. J. Mol. Sci. 2024, 25, 2793. https://doi.org/10.3390/ijms25052793
AMA Style
He M, Li Y, Li Y, Dong B, Yu H. Dynamics of Chromatin Opening across Larval Development in the Urochordate Ascidian Ciona savignyi. International Journal of Molecular Sciences. 2024; 25(5):2793. https://doi.org/10.3390/ijms25052793
Chicago/Turabian StyleHe, Muchun, Yuting Li, Yajuan Li, Bo Dong, and Haiyan Yu. 2024. "Dynamics of Chromatin Opening across Larval Development in the Urochordate Ascidian Ciona savignyi" International Journal of Molecular Sciences 25, no. 5: 2793. https://doi.org/10.3390/ijms25052793
Note that from the first issue of 2016, this journal uses article numbers instead of page numbers. See further details here.