
Calcium Signaling Consequences of RyR2-S4938F Mutation Expressed in Human iPSC-Derived Cardiomyocytes

1
Cardiac Signaling Center, University of South Carolina, Medical University of South Carolina and Clemson University, Charleston, SC 29425, USA
2
Department of Regenerative Medicine and Cell Biology, Medical University of South Carolina, Charleston, SC 29425, USA
*
Author to whom correspondence should be addressed.
Int. J. Mol. Sci. 2023, 24(20), 15307; https://doi.org/10.3390/ijms242015307
Submission received: 14 September 2023
/
Revised: 2 October 2023
/
Accepted: 14 October 2023
/
Published: 18 October 2023
(This article belongs to the Special Issue iPSC-Derived Cardiomyocytes as a Disease Model: Novel Molecular Research on Inherited Cardiac Pathologies and Therapeutic Opportunities)
Abstract
:Type-2 ryanodine receptor (RyR2) is the major Ca2+ release channel of the cardiac sarcoplasmic reticulum (SR) that controls the rhythm and strength of the heartbeat, but its malfunction may generate severe arrhythmia leading to sudden cardiac death or heart failure. S4938F-RyR2 mutation in the carboxyl-terminal was expressed in human induced pluripotent stem cells derived cardiomyocytes (hiPSC-CMs) using CRISPR/Cas9 gene-editing technique. Ca2+ signaling and electrophysiological properties of beating cardiomyocytes carrying the mutation were studied using total internal reflection fluorescence microscopy (TIRF) and patch clamp technique. In mutant cells, L-type Ca2+ currents (ICa), measured either by depolarizations to zero mV or repolarizations from +100 mV to –50 mV, and their activated Ca2+ transients were significantly smaller, despite their larger caffeine-triggered Ca2+ release signals compared to wild type (WT) cells, suggesting ICa-induced Ca2+ release (CICR) was compromised. The larger SR Ca2+ content of S4938F-RyR2 cells may underlie the higher frequency of spontaneously occurring Ca2+ sparks and Ca2+ transients and their arrhythmogenic phenotype.
1. Introduction
Cardiac excitation–contraction (EC) coupling is the key regulator of cardiomyocyte function as it links the action potential to the contraction. EC coupling is initiated by Ca2+ influx through the voltage-gated L-type Ca2+ channels (Cav1.2) [1,2], which activate the opening of type-2 ryanodine receptors (RyR2s) of dyadic Ca2+ stores of the sarcoplasmic reticulum (SR), triggering a much larger release of Ca2+ via the Ca2+-induced Ca2+ release (CICR) mechanism [1,2,3]. Dyadic releases of Ca2+ from the RyR2 appear as localized Ca2+ sparks [4]. Sparks last ~7 ms, carrying ~100,000 Ca2+ ions that invade the myocyte along its t-tubular system as Ca2+ stripes that fully activate the myocyte [4]. The magnitude of the Ca2+ current determines the frequency of the Ca2+ sparks but not their magnitude [4]. Spatial and temporal summation of the released Ca2+ produces an average global rise in cytosolic Ca2+ of ~500 nM to ~1000 nM, activating myofilament contraction. Relaxation begins by sequestration of entered and released Ca2+ mostly by Ca2+ ATPase (SERCA2a) of SR and extrusion of Ca2+ across the membrane by Na+/Ca2+ exchanger (NCX). Since calcium cycling is fundamentally a precise release and uptake process, its dysfunction often underlies cardiac arrhythmias leading to cardiac hypertrophy and failure [5]. In this precise cellular calcium cycling process, the opening and closing of RyR2 play a central role in the activation of calcium transients that regulates the release of Ca2+ for cardiac pacing and contraction [6]. Over 150 point mutations in the human type-2 ryanodine receptor gene (RYR2) have been identified to associate with catecholaminergic polymorphic ventricular tachycardia (CPVT1). Most of the CPVT1-associated RyR2 mutations cause enhanced Ca2+ release with delayed afterdepolarizations (DADs) and arrhythmias and are considered as gain-of-function mutations. The functional consequences of CPVT1-associated RyR2 mutations have been studied mostly in human embryonic kidney (HEK) 293 cell lines expressing recombinant mutant RyR2s and more recently in human iPSC-derived cardiomyocytes (hiPSC-CMs) created directly from patients carrying the mutation or genetically engineered by genome editing [7,8,9,10]. Such studies have shown that CPVT1 may result from SR Ca2+ overload- or enhanced RyR2 leakiness-induced aberrant Ca2+ releases. Although CPVT1 was the first arrhythmia syndrome linked to gain-of-function of RyR2 [5], more recent studies have identified other inherited arrhythmia syndromes associated with loss of RyR2 function [11,12,13,14,15,16]. The loss-of-function RyR2 mutations and a novel, emerging disease entity termed Ca2+ release deficiency syndrome (CRDS) [15,16], appear to be expressed predominantly in the carboxyl-terminal (C-terminal) region. CRDS patients are susceptible to arrhythmogenic events, such as polymorphic ventricular tachycardia, cardiac alternans and ventricular fibrillation, which may result in sudden death. Although several RyR2 mutations, including S4938F RyR2, have been identified as loss-of-function mutations, with a range of clinical phenotypes, there are only few studies reporting the functional consequences of these mutations in human or mammalian cardiomyocyte platforms [17,18,19].
The main regulator of RyR2 is the cytoplasmic calcium, that binds to Ca2+ binding residues of RyR2 located at the interface between the central and C-terminal domains. Near-atomic structural analysis of RyR has identified the Ca2+-binding sites of RyR2 to be formed essentially by five amino acid residues (E3848, E3922, T4931, H3850 and Q3925), and the caffeine binding site to be located parallel to aromatic chain of W4645, forming a hydrophobic interaction with I4926, and possibly with hydrogen bonds of E4194, suggesting possible allosteric interaction between caffeine and calcium binding sites of RyR2 [20,21,22]. Caffeine is the most used RyR agonist that fully activates RyR2 by sensitizing it to resting calcium, allowing quantification of SR Ca2+ content. It has been proposed that CPVT1 or ventricular tachycardia (VT)-associated RyR2 mutations similarly increase the sensitivity of the channel to luminal Ca2+, which results in an increased open probability of the channel causing aberrant releases of calcium [23]. It should be noted, however, that near-atomic structural studies of RyR2 show that most CPVT1-associated mutations are not in the Ca2+- or caffeine-binding sites, even though they alter the caffeine responses, suggesting that such regulation is mediated through allosteric modulation of the channel. Ca2+ release deficiency-associated C-terminal domain mutations have been shown to have varied effects on caffeine activation of RyR2 expressed in HEK293 cells [24], which requires further studies. Here we chose to examine the effects of S4938F-RyR2 mutation located in the C-terminal region, in close proximity to both RyR2 Ca2+- and caffeine-binding sites of RyR2 structure [20]. Clinically, S4938F has been identified to cause premature ventricular contractions with a short (<300 ms) coupling interval causing episodic ventricular tachycardia in patients [25]. Studies in HEK293 cells expressing heterologous recombinant S4938F mutant RyR2s have shown lower activity of RyR2 and reduced Ca2+ release [25].
In our study, we introduced S4938F-RyR2 mutation in hiPSCs using CRISPR/Cas9 gene editing and characterized the Ca2+ signaling properties of S4938F-RyR2 mutant cardiomyocytes. We found higher frequencies of Ca2+ sparks and spontaneously triggered Ca2+ transients consistent with a larger SR Ca2+ content and lower SR Ca2+ leak but suppressed magnitude of ICa-gated or spontaneously triggered Ca2+ transients.
2. Results
2.1. Creation of hiPSC Line Harboring the S4938F-RyR2 Mutation
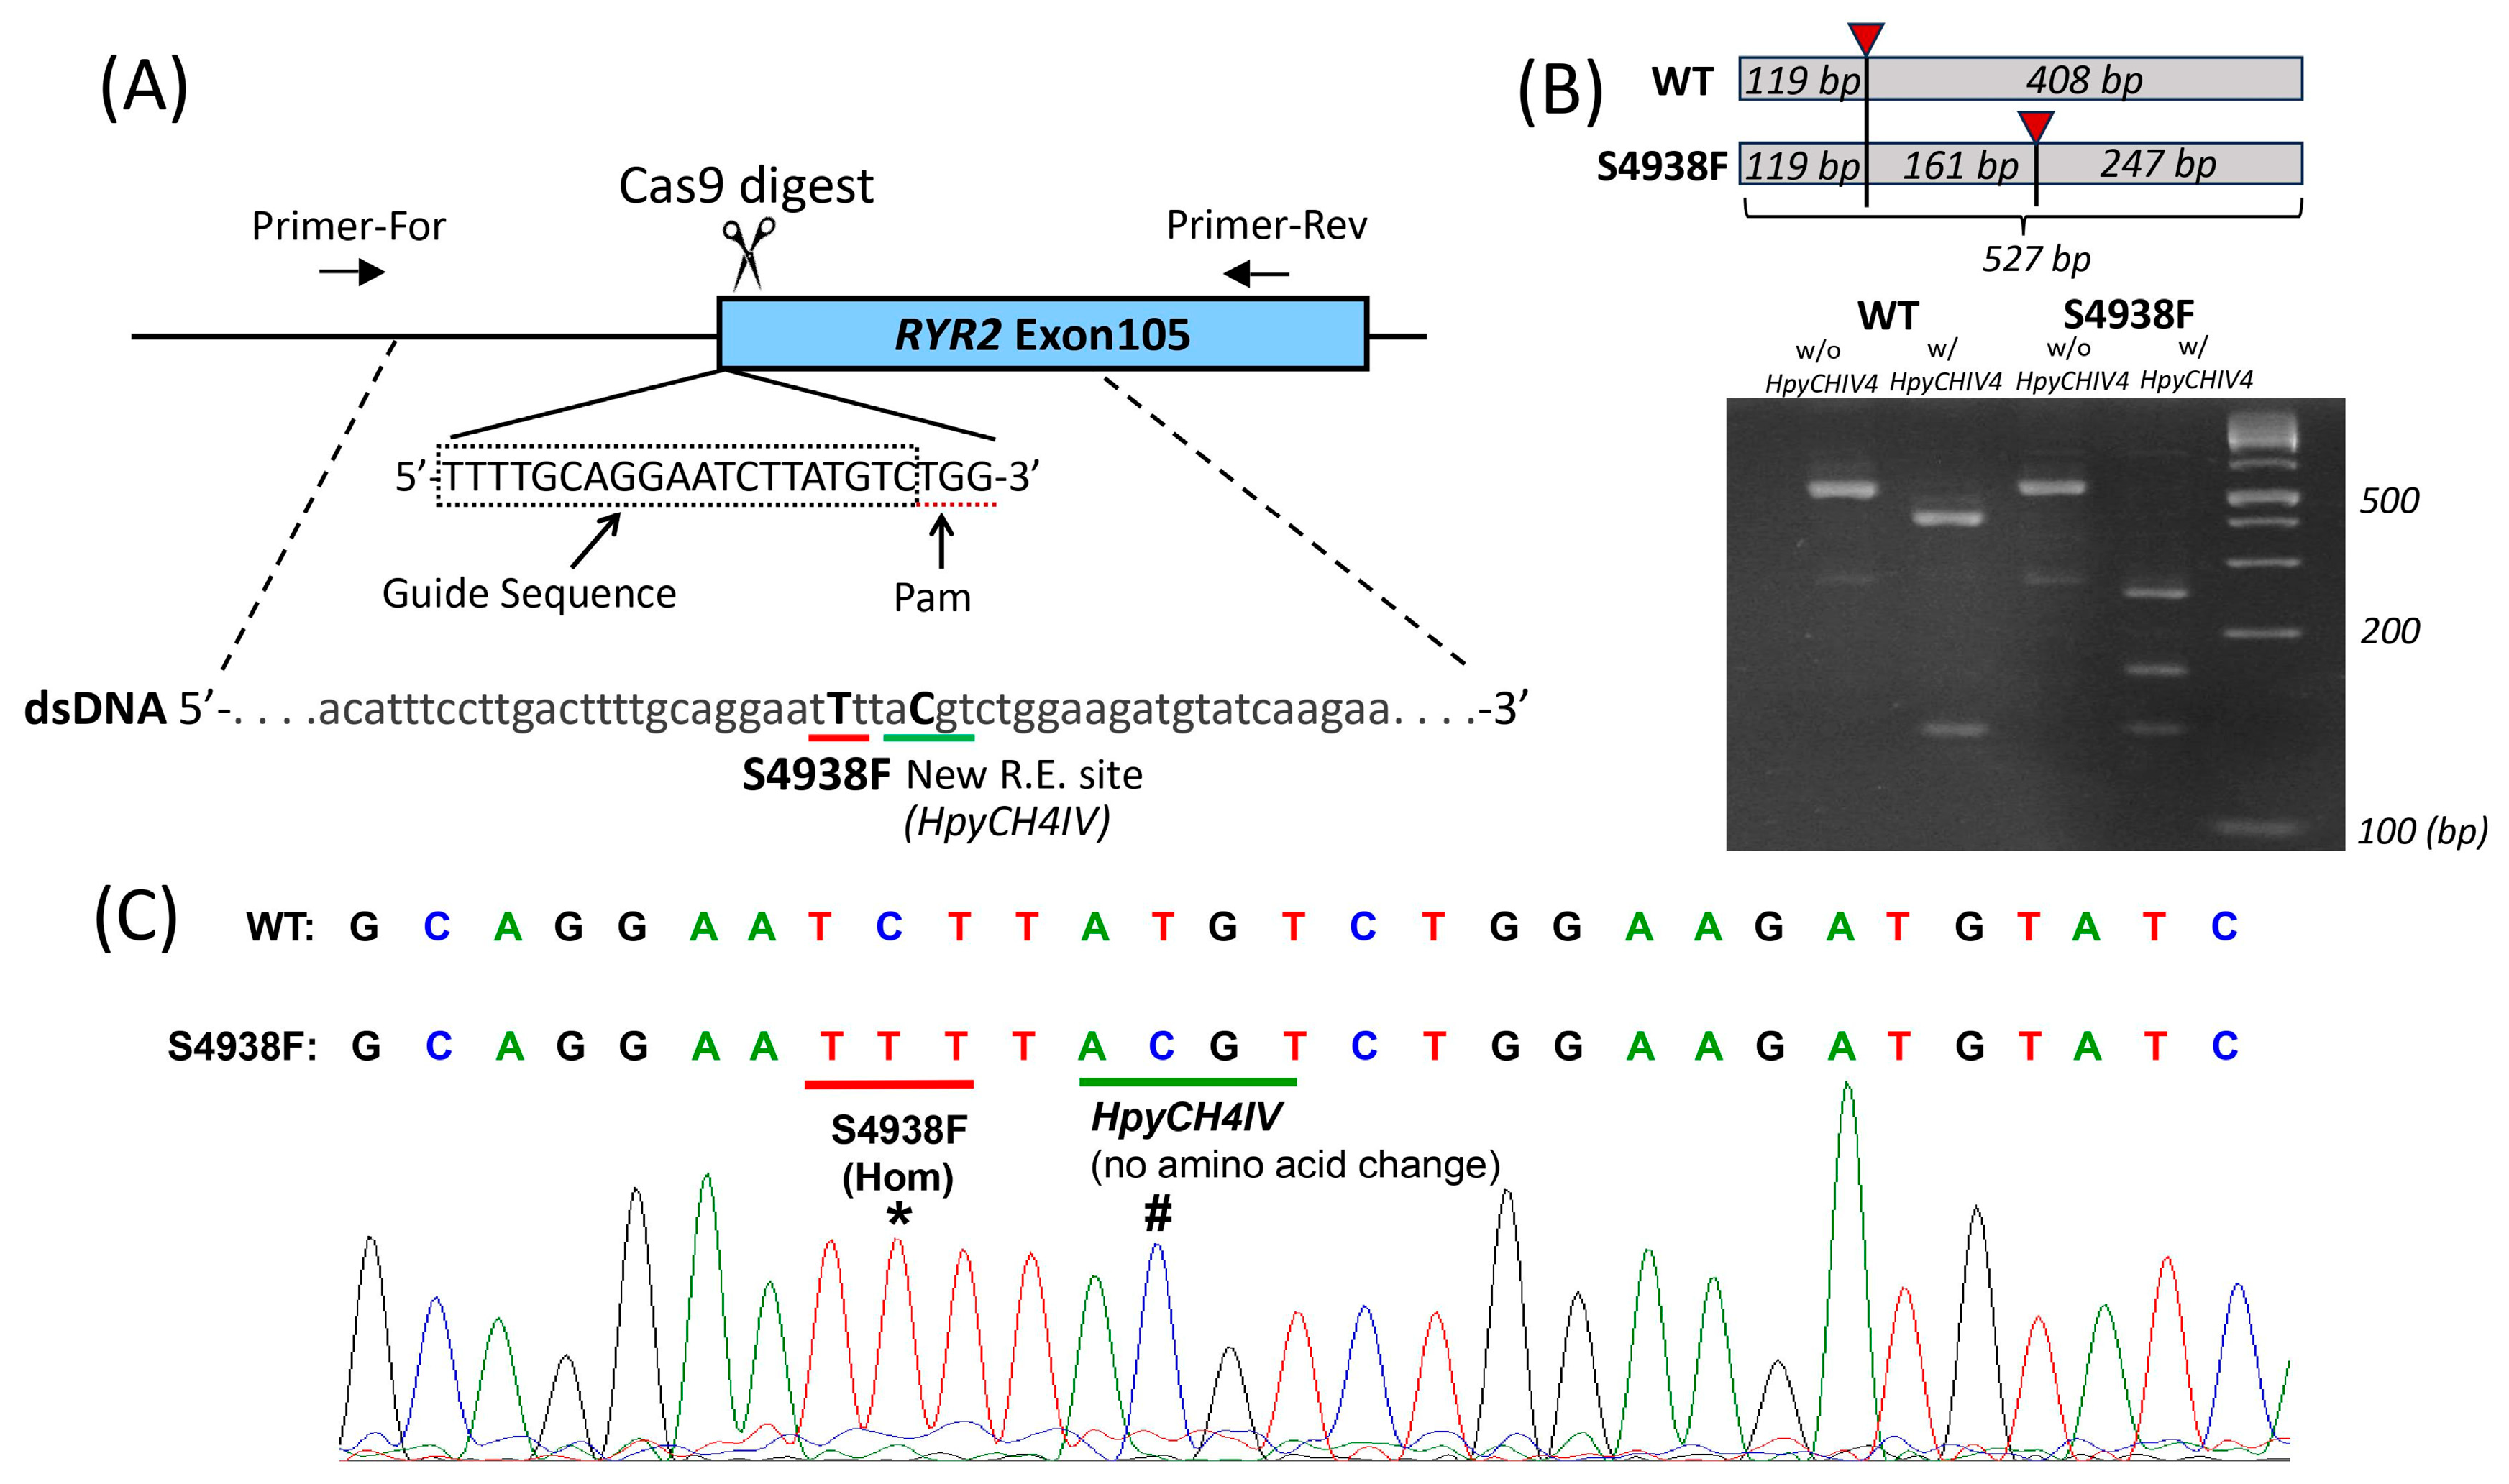
To introduce the S4938F mutation in the RYR2 gene of wild type hiPSC-CMs, CRISPR/Cas9 gene-editing technique was used, as described in Section 4.2. (Figure 1A). Mutations were introduced during homology-directed repair with double-stranded plasmid DNA containing a homologous RYR2 sequence with mutations (Figure 1A). After electroporation of two plasmid DNAs for homology-directed repair and expression of RNA-guided Cas9, cells were screened by puromycin resistance, and each surviving colony was isolated. The DNA of the gene-edited locus of each colony was amplified by PCR to verify correct gene editing. The homologous sequence harbors the S4938F mutation (TCT to TTT) and a silent mutation that creates a new restriction enzyme site HpyCH4IV, allowing us to identify the correctly gene-edited clones by restriction enzyme digestion of the PCR products (Figure 1B). Figure 1B shows non-digested and HpyCH4IV-digested PCR products of WT and S4938F clones. The full-size PCR product is 527 base pairs (bp) long (Figure 1B). HpyCH4IV cuts the PCR product of WT into 408 + 119 bp fragments, while in the homozygous (Hom) S4938F mutant, the 408 bp fragment was further digested into two fragments, resulting in three fragments of 247 + 161 + 119 bp (Figure 1B). Sequencing of PCR products (Figure 1C) showed single peaks of the S4938F mutation (labeled with *) and the silent mutation creating a new HpyCHIV4 restriction enzyme site (#), confirming that mutations were introduced in both gene alleles, i.e., homozygous mutations.
2.2. Spontaneous Ca2+ Release in Intact WT and S4938F-RyR2 Mutant hiPSC-CMs
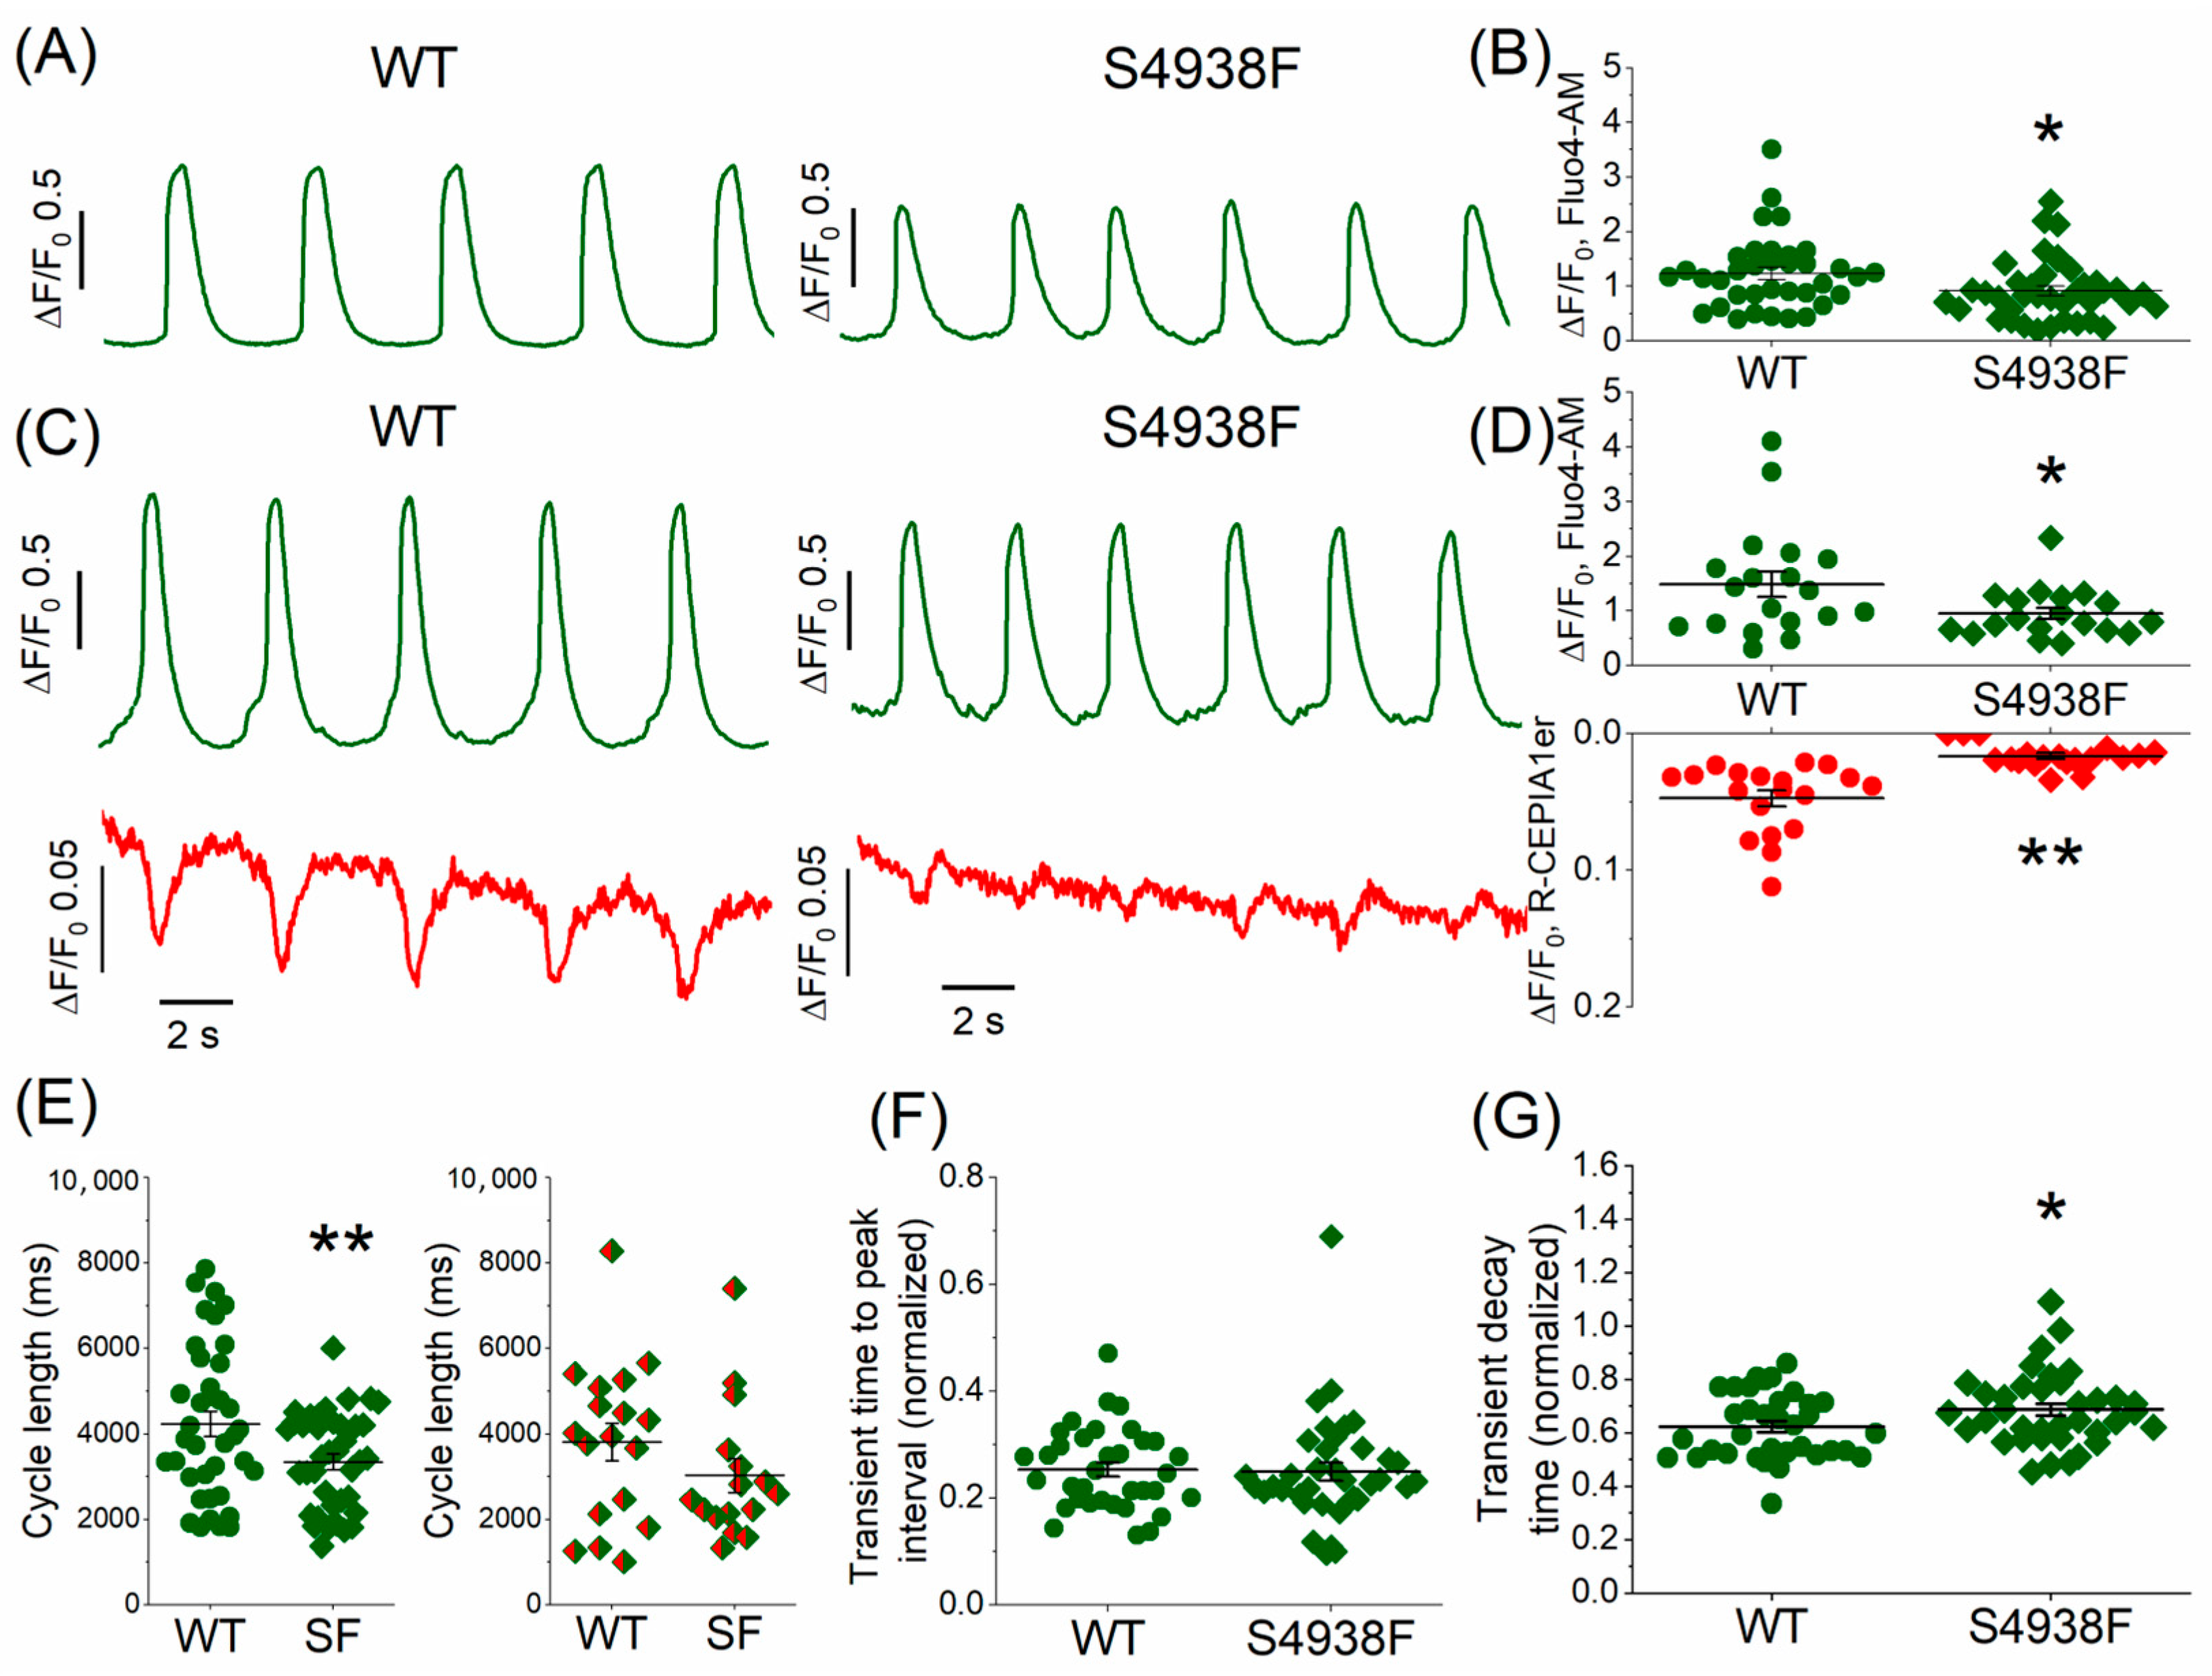
Unlike adult ventricular cardiomyocytes, WT hiPSC-CMs exhibit spontaneous automaticity. To determine whether the spontaneous Ca2+ release characteristics of S4938F RyR2 mutant cells were altered compared with WT cells, in one set of experiments we measured the cytosolic Fluo-4 AM Ca2+ transients (Figure 2A,B), and in another set of experiments we also measured their Ca2+ release signal simultaneously using the SR-targeted Ca2+ probe R-CEPIA1er along with their cytosolic Ca2+ transients (Figure 2C,D). Figure 2A,E (left panel) show that mutant cells loaded with Fluo-4 AM had faster spontaneous oscillation frequency compared to WT (cycle length 3343.3 ± 186.5 ms in S4938F vs. 4237.7 ± 289.8 ms in WT). Similarly, the cycle length seemed to be shorter in S4938F when the cells were infected with the SR-targeted probe R-CEPIA1er along with Fluo-4 AM, although the difference was not statistically significant (3026.3 ± 399.2 ms in S4938F vs. 3813.1 ± 444.5 ms in WT, Figure 2E (right panel)). While spontaneously beating WT hiPSC-CMs showed both significant cytosolic Ca2+ transients (Fluo-4 AM) and SR Ca2+ release, S4938F cells failed to generate significant SR Ca2+ release signals (0.02 ± 0.002 ΔF/F0 in S4938F vs. 0.05 ± 0.006 ΔF/F0 in WT, Figure 2C,D). Note that the amplitude of spontaneous cytosolic Ca2+ transients (Fluo4-AM signal) was also significantly suppressed in S4938F mutant hiPSC-CMs, both measured alone (0.92 ± 0.09 ΔF/F0 in S4938F vs. 1.23 ± 0.11 ΔF/F0 in WT, Figure 2A,B) or along with the SR Ca2+ sensor (0.95 ± 0.10 ΔF/F0 in S4938F vs. 1.48 ± 0.23 ΔF/F0 in WT, Figure 2C,D).
The time-to-peak intervals of spontaneous Ca2+ transients were essentially the same between WT and S4938F cells (normalized to their cycle length: 0.25 ± 0.02 in S4938F vs. 0.25 ± 0.01 in WT, Figure 2F). The decay time of Ca2+ transients in S4938F cells was longer than in WT hiPSC-CMs when normalized to their cycle length: 0.69 ± 0.02 in S4938F vs. 0.62 ± 0.02 in WT, Figure 2G). The longer decay of Ca2+ transients raise the possibility of slower inactivation of ICa.
2.3. SR Ca2+ Content of WT and S4938F-RyR2 Mutant hiPSC-CMs
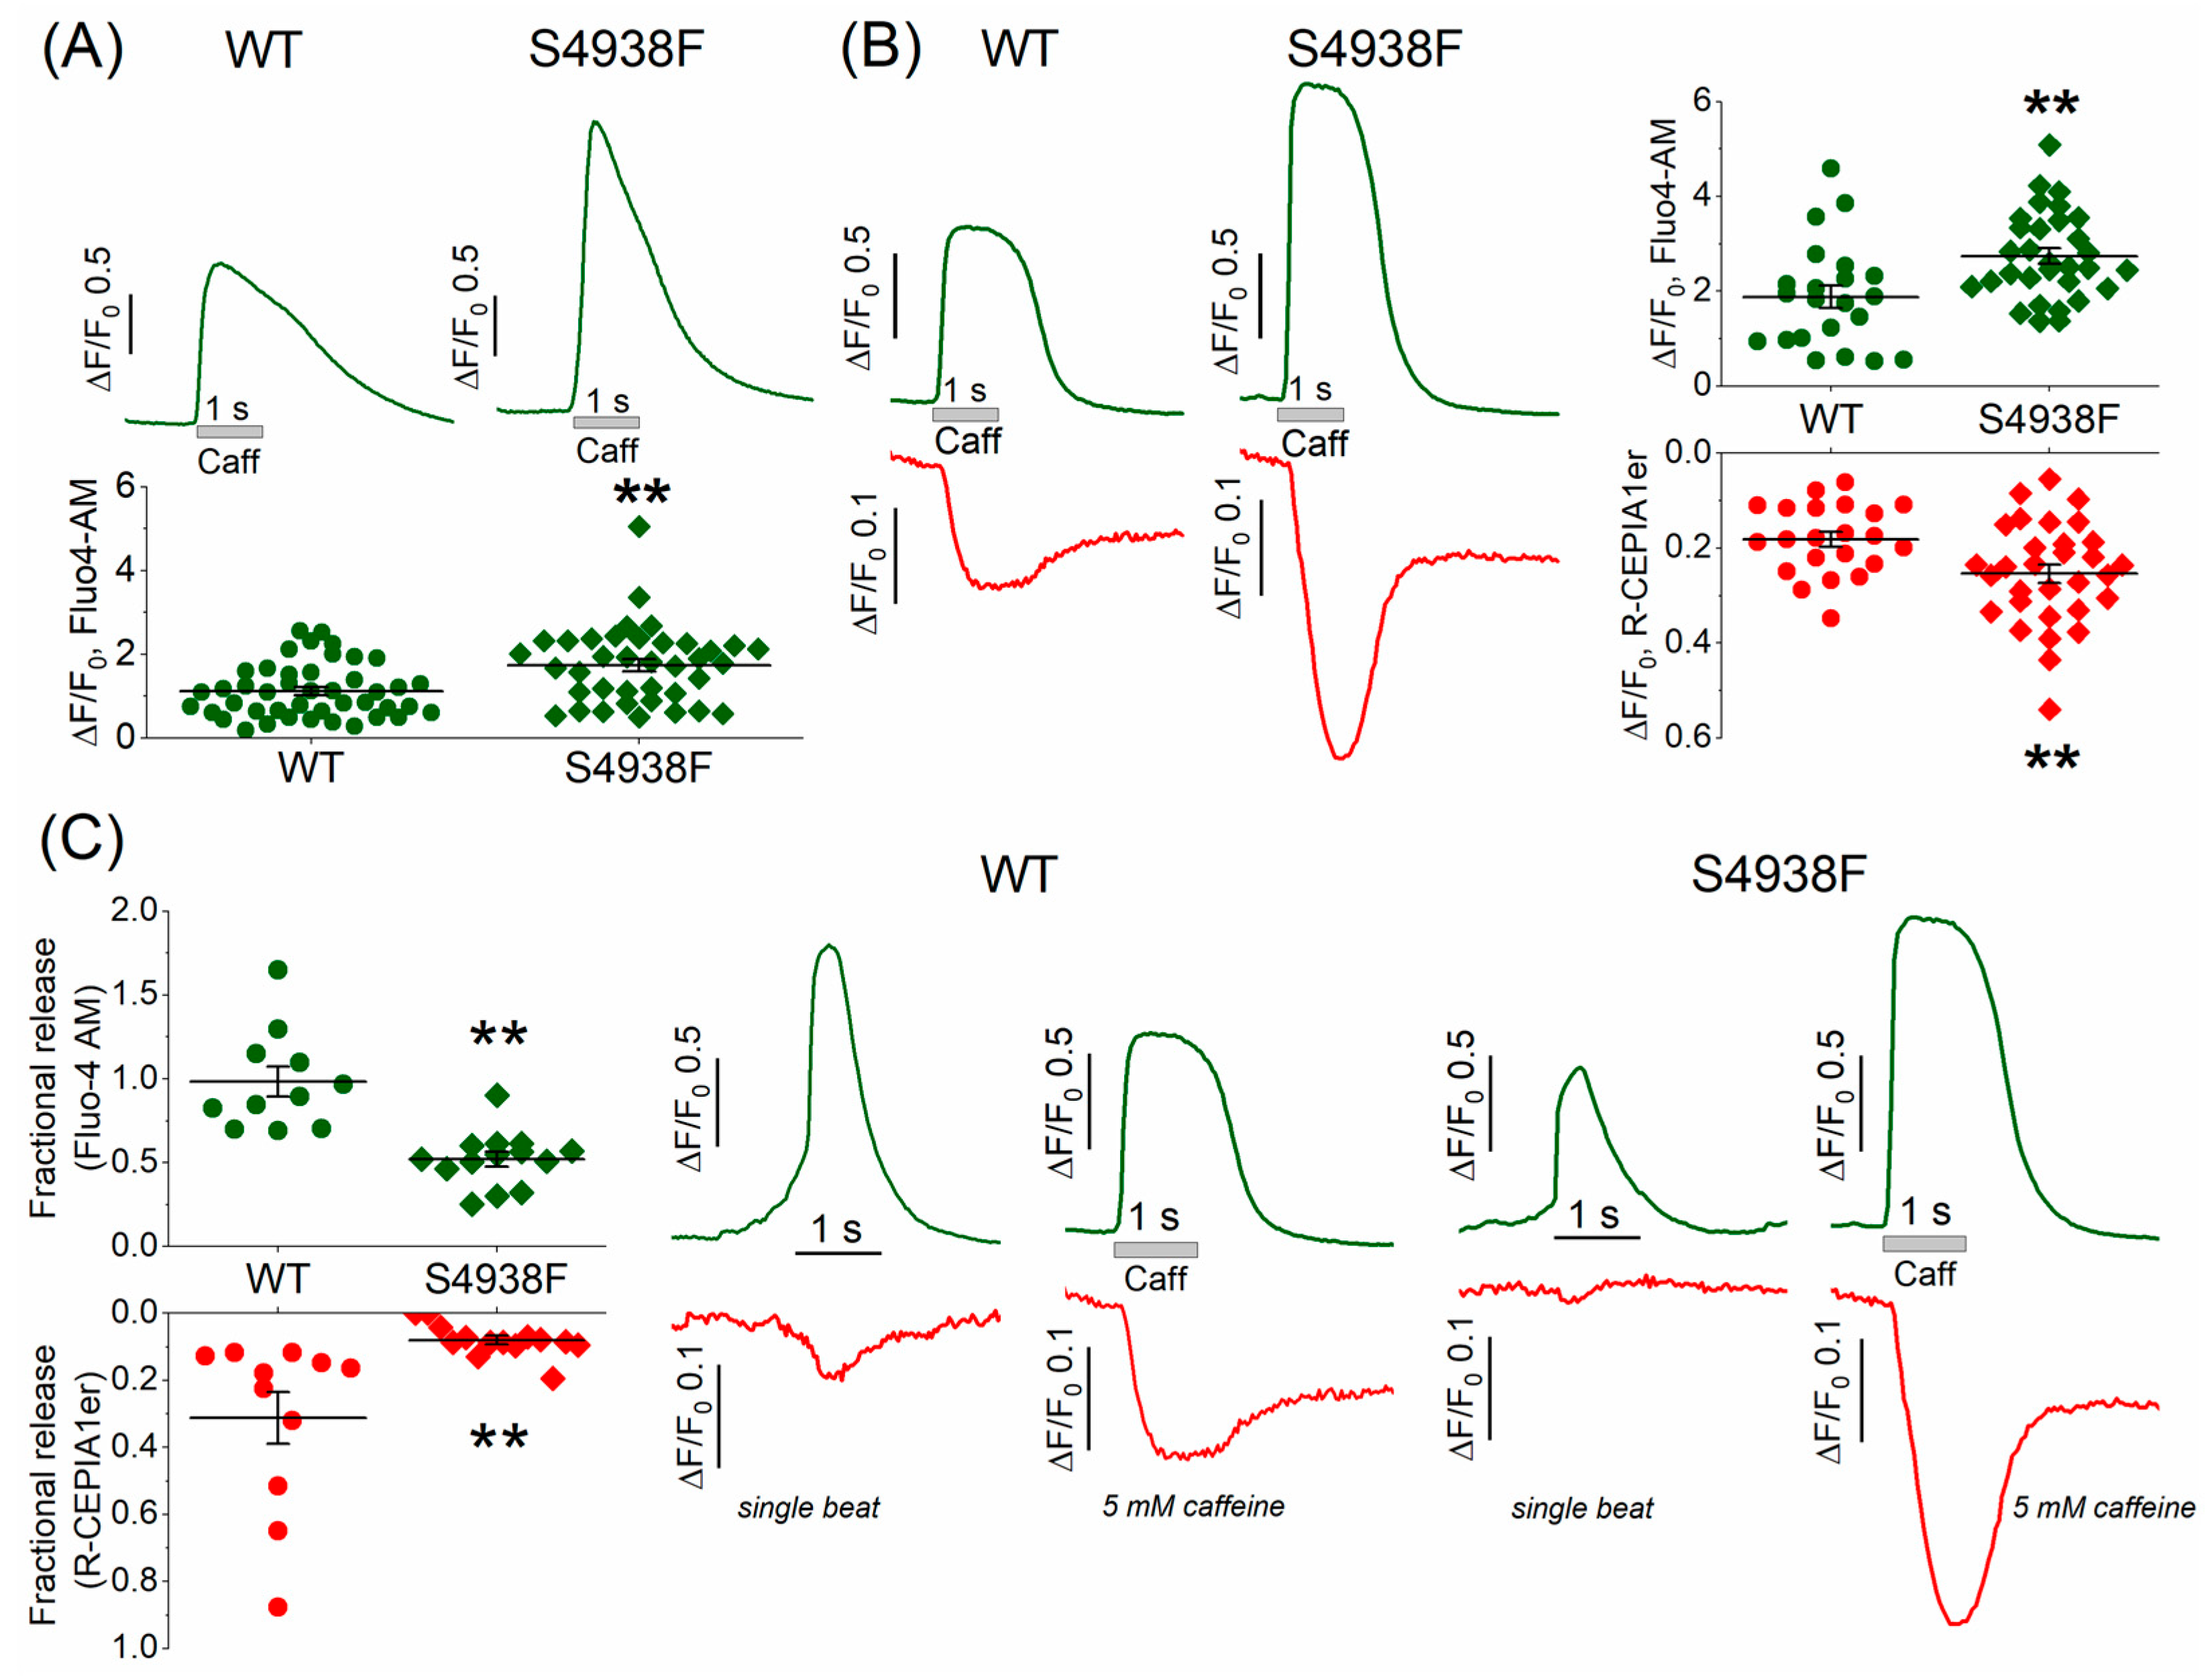
SR Ca2+ content was measured by rapid application of 5 mM caffeine in intact WT and S4938F mutant hiPSC-CMs. In Fluo-4 AM loaded mutant cells, caffeine-induced cytosolic Ca2+ rise was significantly higher than WT cells (1.73 ± 0.15 ΔF/F0 vs. 1.12 ± 0.1 ΔF/F0, Figure 3A). In mutant cells, where SR Ca2+ release signal and cytosolic Ca2+ transients were measured simultaneously, 5 mM caffeine also consistently caused significantly larger SR Ca2+ release signal (0.25 ± 0.019 ΔF/F0 vs. 0.18 ± 0.016 ΔF/F0) and cytosolic Ca2+ rise compared to WT cells (2.74 ± 0.16 ΔF/F0 vs. 1.88 ± 0.24 ΔF/F0) (Figure 3B). Fractional Ca2+ release, defined as the ratio of spontaneous Ca2+ release to caffeine-triggered Ca2+ release, was larger in WT compared to S4938F cells (R-CEPIA1er: 0.08 ± 0.01 in S4938F vs. 0.31 ± 0.08 in WT; Fluo-4 AM: 0.52 ± 0.04 in S4938F vs. 0.98 ± 0.09 in WT, Figure 3C). The larger caffeine-triggered cytoplasmic Ca2+ rise in the mutant cells indicated higher SR Ca2+ levels, but the smaller spontaneous Ca2+ release transients suggest impaired ICa gating and down-regulated CICR.
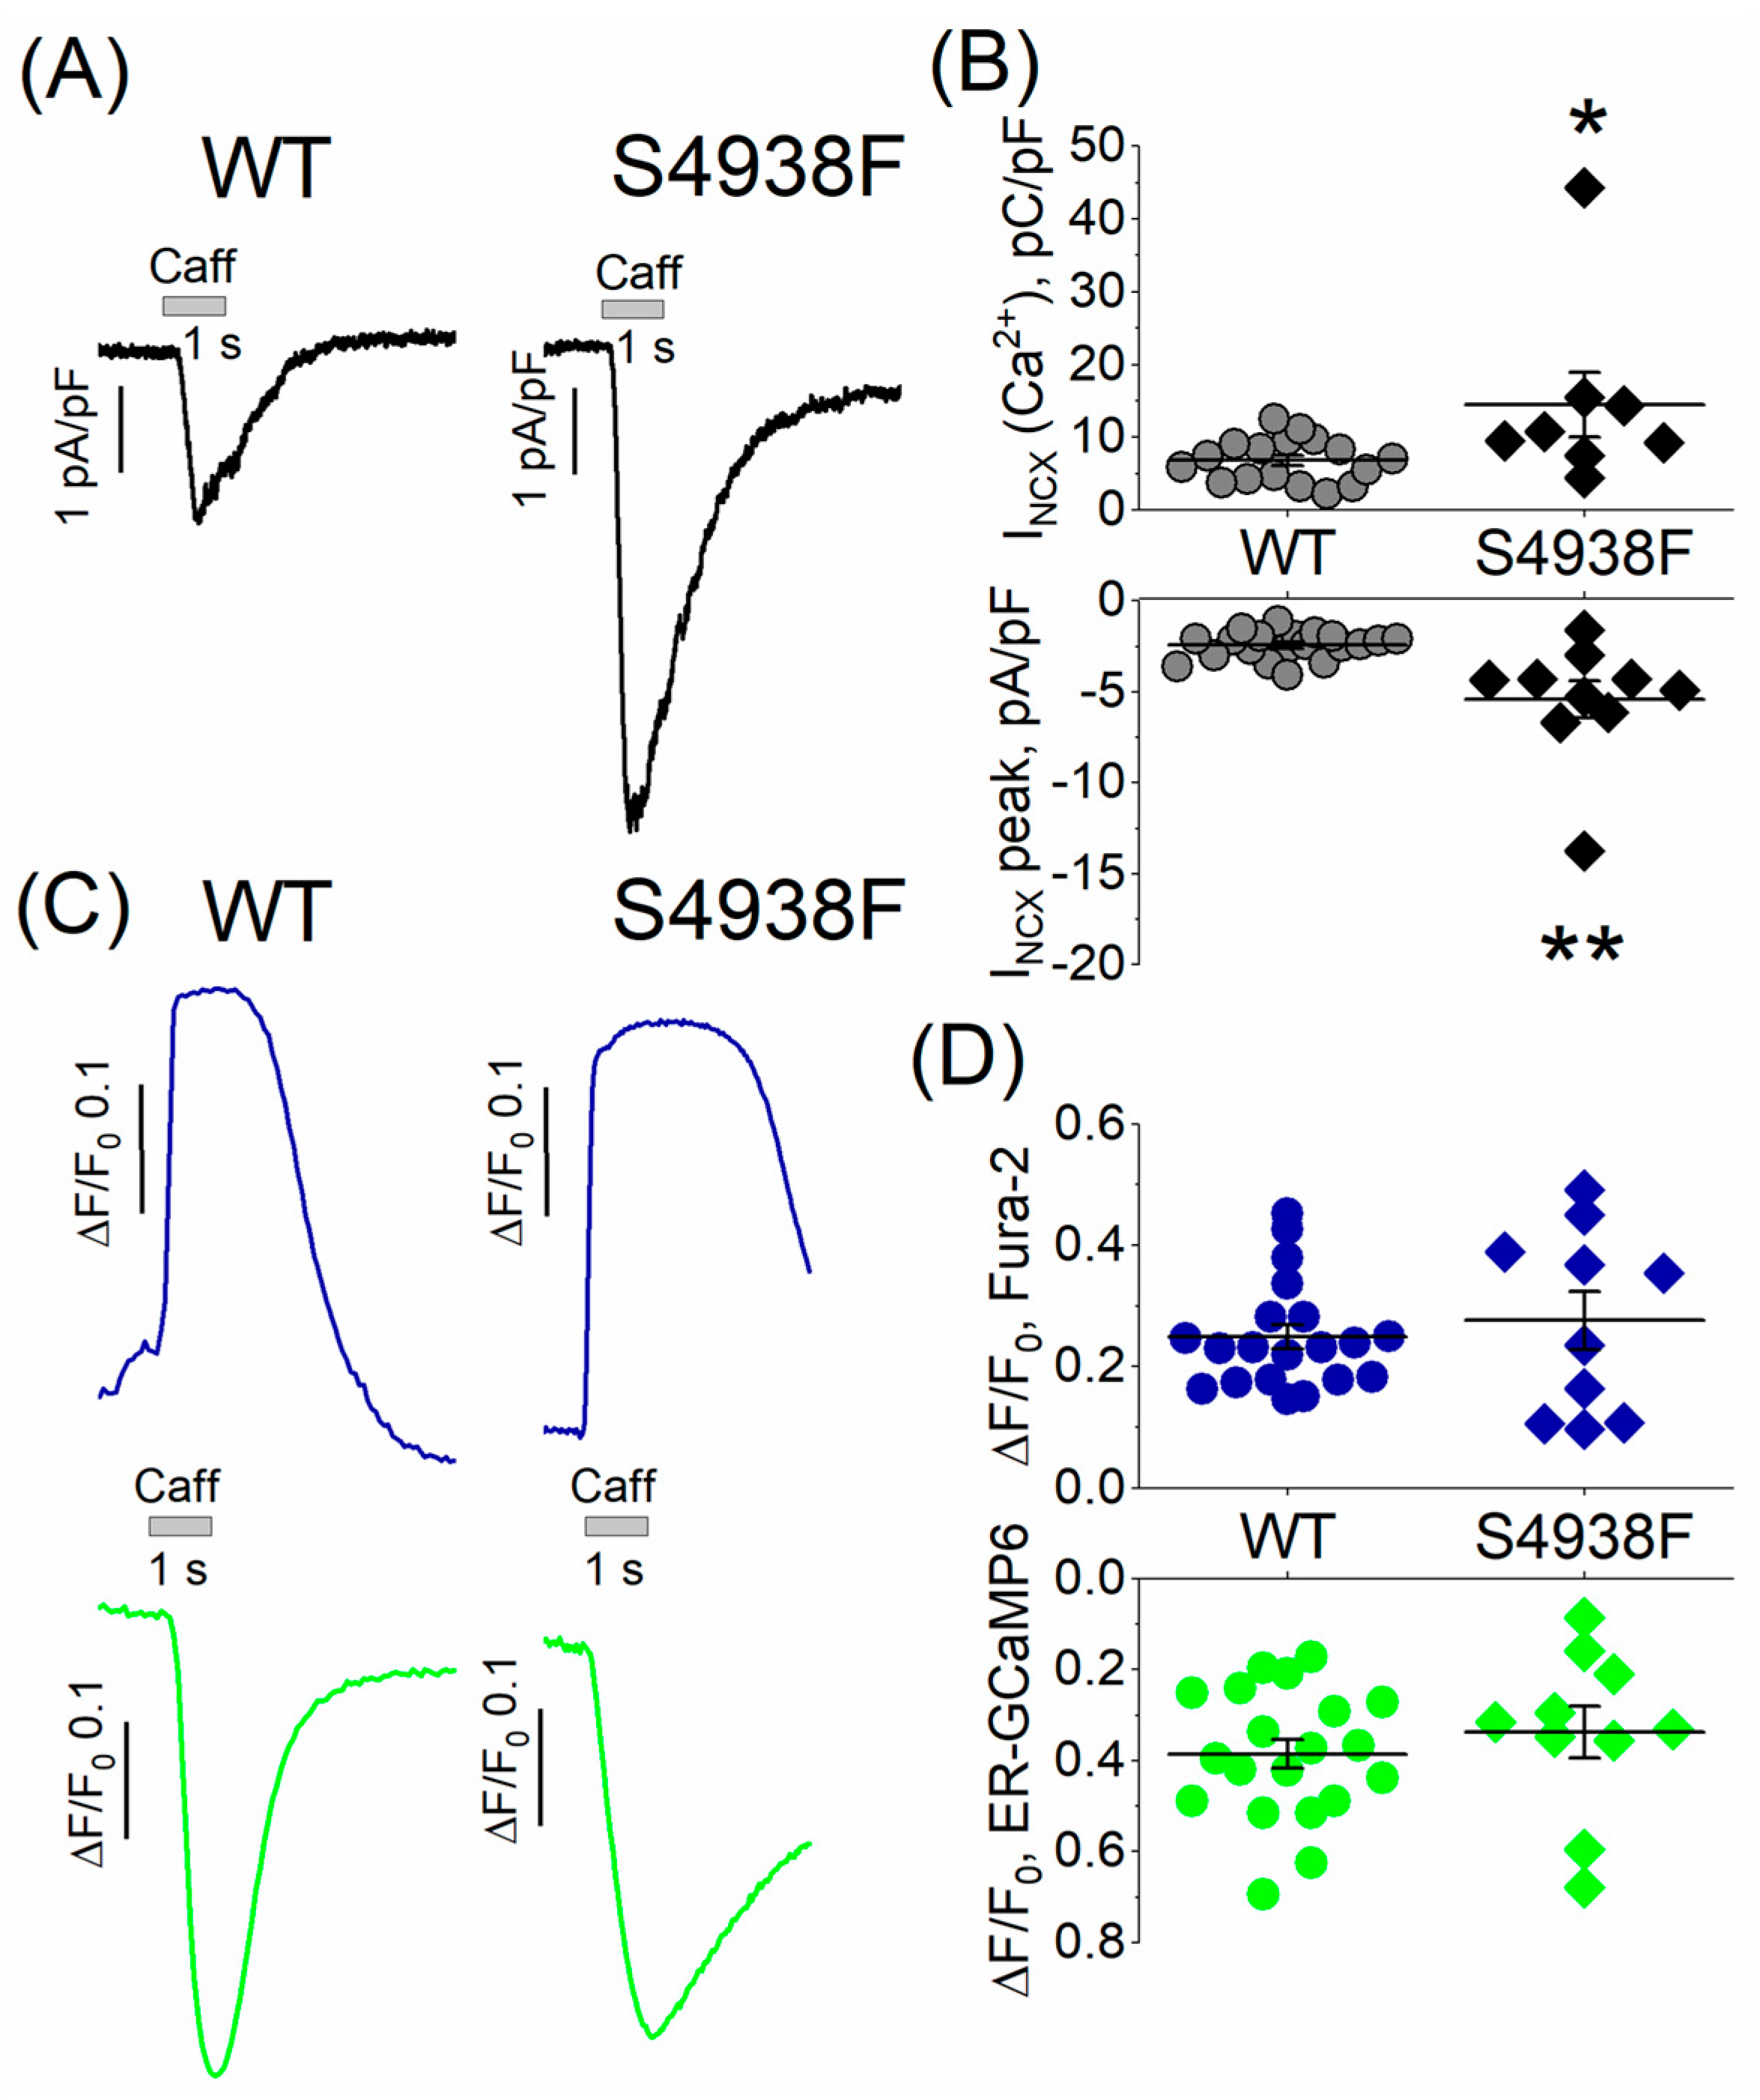
In whole cell patch-clamped and TIRF-imaged cells, caffeine-activated peak INCX was also significantly larger in mutant compared with WT cells (5.4 ± 1.03 pA/pF vs. 2.5 ± 0.2 pA/pF, Figure 4A,B), consistent with the enhanced caffeine-triggered Ca2+ stores in mutant cells (Figure 3A,B). The net charge carried by INCX was also significantly larger in S4938F hiPSC-CMs compared with WT (14.5 ± 4.4 pC/pF vs. 7.2 ± 0.8 pC/pF, Figure 4A,B). Despite increased INCX in S4938F mutant hiPSC-CMs, there was no difference in the caffeine-induced SR Ca2+ release or cytosolic Ca2+ transients in patched conditions compared with WT (0.34 ± 0.06 ΔF/F0 in S4938F vs. 0.39 ± 0.04 ΔF/F0 in WT and 0.28 ± 0.05 ΔF/F0 in S4938F vs. 0.26 ± 0.02 ΔF/F0, respectively, Figure 4C,D). This discrepancy between the calcium indicator probes and membrane current measurements of calcium release signal simultaneously measured in patch-clamped myocytes may result from fluorescent probe-calcium saturation kinetics or cellular calcium buffering consequences of whole cell patched cells. Nevertheless, INCX measurements of enhanced cytosolic calcium release in voltage-clamped mutant cells (Figure 4) are consistent with enhanced fluorescent probe signal measurements of calcium in intact non-patched mutant cells of Figure 3.
2.4. ICa and ICa-Induced Ca2+ Release in WT and S4938F-RyR2 hiPSC-CMs
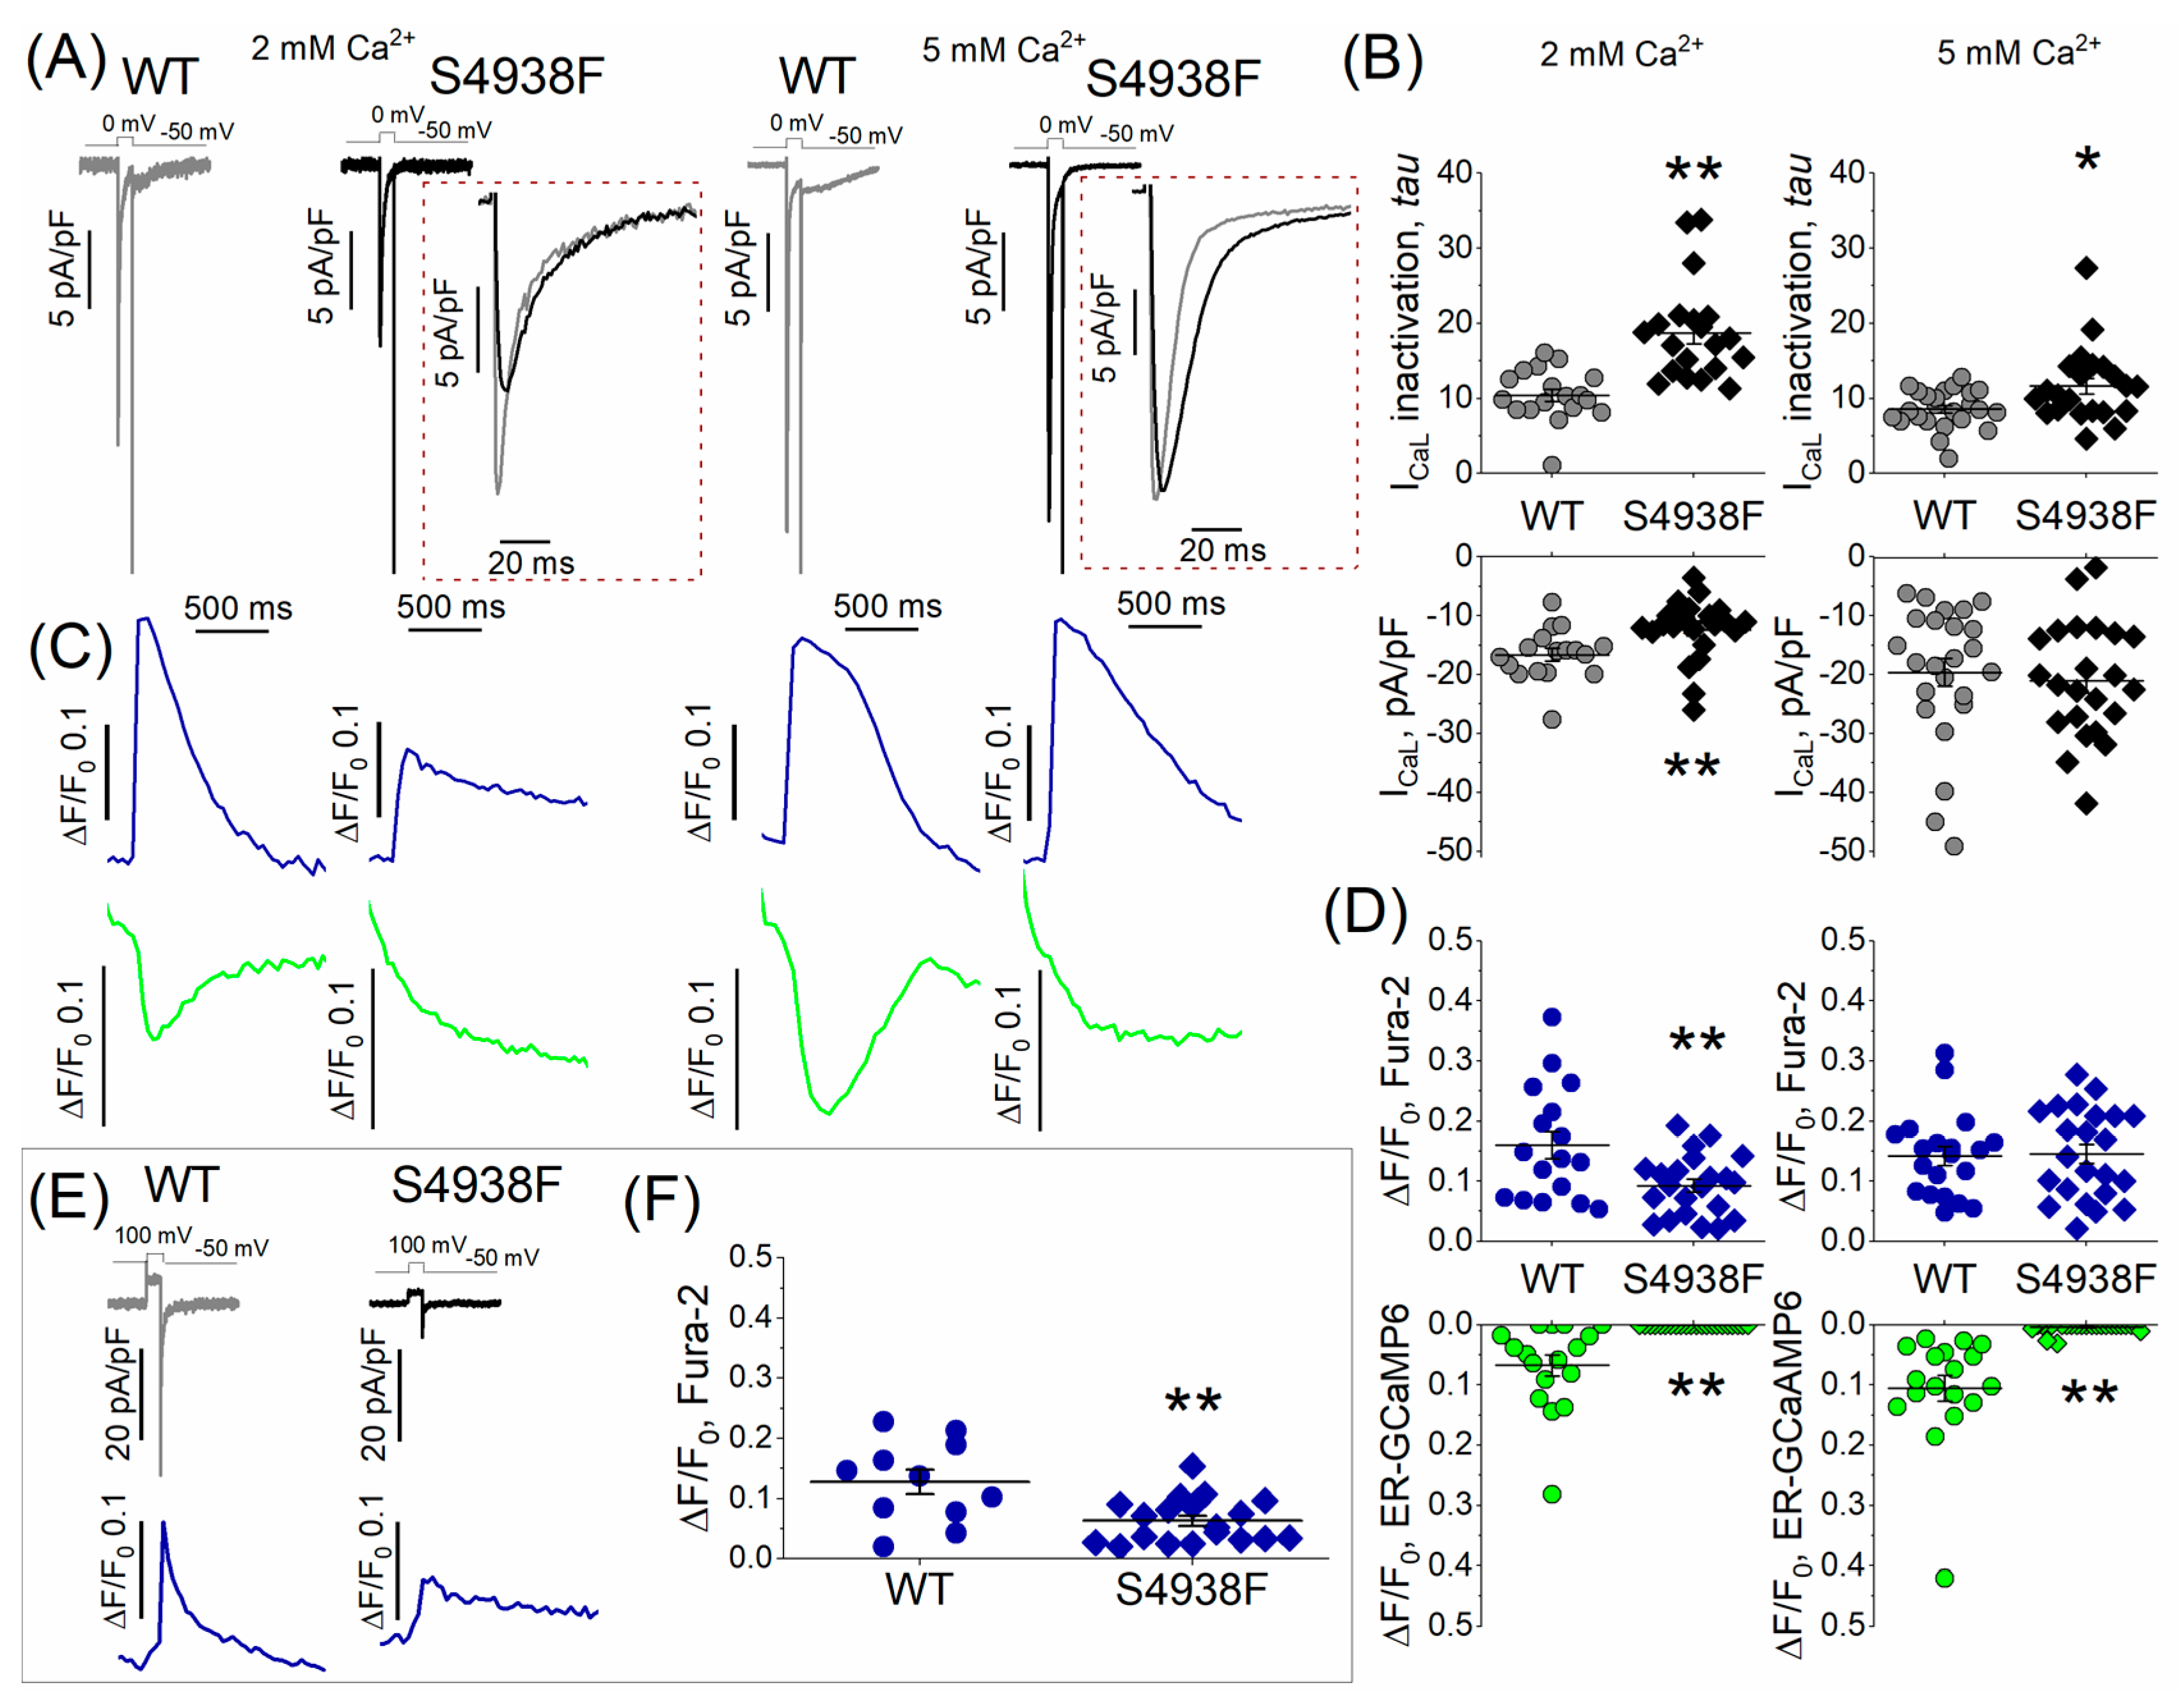
ICa and activation of SR Ca2+ release and the resultant cytosolic Ca2+ transients were measured in patch-clamped and TIRF-imaged WT and S4938F hiPSC-CMs dialyzed with 0.1 mM Fura-2-pentasodium salt through the patch pipette. To minimize the contribution of the influx of calcium during the 100 ms long depolarization pulse, yet to activate fully the channel, ICa tail current-induced Ca2+ transients were measured using repolarization pulses from 100 mV to −50 mV. Figure 5A and C show representative recordings of ICa and the accompanying SR Ca2+ release signals and cytosolic Ca2+ transients measured by ER-GCaMP6 and Fura-2, respectively, while Figure 5E shows ICa tail current-induced Ca2+ transients measured by Fura-2. ICa density was significantly smaller in S4938F hiPSC-CMs in 2 mM extracellular Ca2+ solutions (12.35 ± 1.1 pA/pF vs. 16.62 ± 1.05 pA/pF), and the current inactivated significantly slower (Figure 5A,B). ICa inactivation in S4938F hiPSC-CMswas significantly slower as compared to WT hiPSC-CMs, measured either in 2 or 5 mM extracellular Ca2+ (18.74 ± 1.45 ms in S4938F vs. 10.41 ± 0.82 ms in WT, and 11.63 ± 1.04 ms in S4938F vs. 8.57 ± 0.52 ms in WT), respectively (Figure 5A,B (insets)).
ICa activated significantly suppressed cytosolic Ca2+ transients in S4938F mutant hiPSC-CMs (0.093 ± 0.01 ΔF/F0 in S4938F vs. 0.16 ± 0.02 ΔF/F0 in WT), even when normalized to the smaller current density, and failed to trigger SR Ca2+ release compared with WT cells (0 ΔF/F0 in S4938F vs. 0.07 ± 0.02 ΔF/F0 in WT, Figure 5C,D). As the Ca2+ release was completely attenuated in 2 mM extracellular Ca2+ conditions, we tried to enhance the Ca2+ release by increasing the calcium to 5 mM in the extracellular solution. Increasing the extracellular Ca2+ concentration from 2 mM to 5 mM, increased the ICa density in both cell types (21.0 ± 2.05 pA/pF in S4938F vs. 19.6 ± 2.4 pA/pF in WT, Figure 5B (right)) and elevated the cytosolic Fura-2 Ca2+ signals in mutant cells to levels comparable with those in WT cells (0.15 ± 0.02 ΔF/F0 in S4938F vs. 0.14 ± 0.02 in WT, Figure 5D (right panel)), but did not significantly enhance the ICa-induced Ca2+ release signal from the SR, Figure 5D (right, green).
Quantified data of ICa tail current-induced Ca2+ transients indicate significantly reduced cytosolic Ca2+ transients in S4938F cells in 2 mM extracellular Ca2+ (0.06 ± 0.009 ΔF/F0 in S4938F vs. 0.13 ± 0.02 ΔF/F0 in WT), Figure 5E,F.
2.5. Ca2+ Sparks in WT and S4938F-RyR2 Mutant hiPSC-CMs
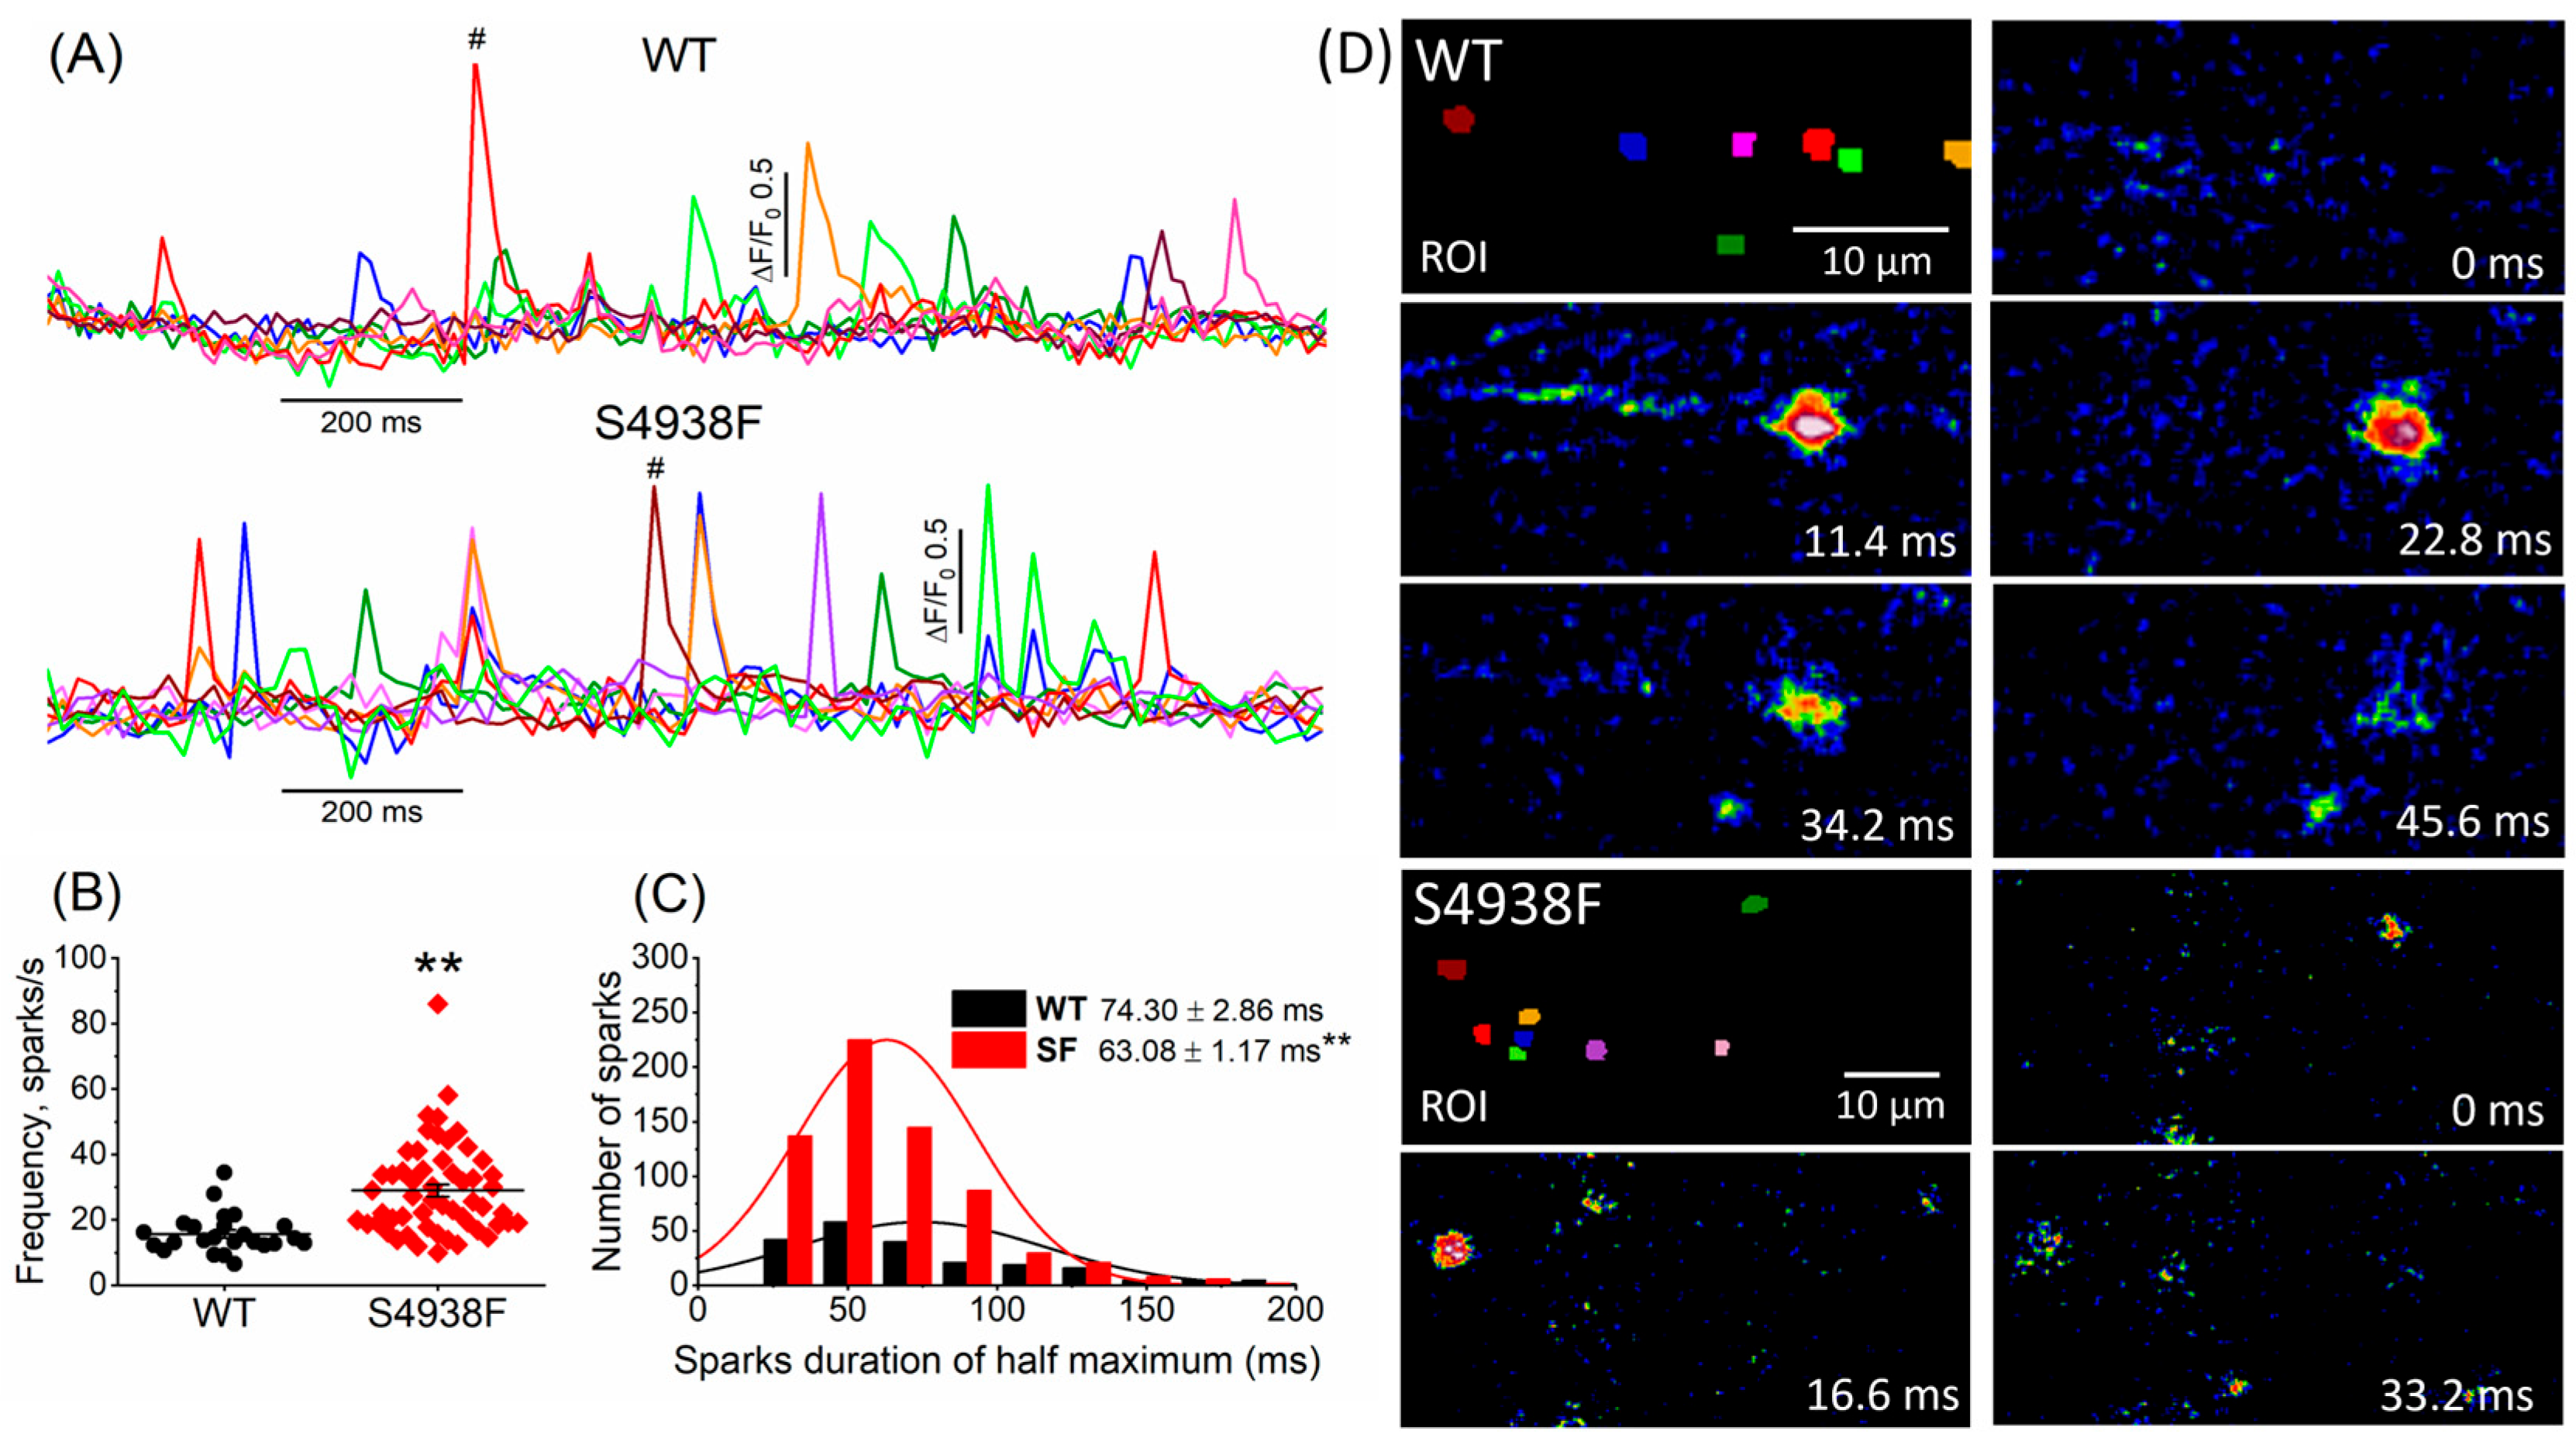
Ca2+ sparks were measured in intact S4938F RyR2 mutant and WT cells incubated with Fluo4-AM. Two-dimensional imaging of spontaneously igniting calcium sparks were recorded from different cellular regions of interest (ROI). Figure 6A shows the time courses of Ca2+ sparks recorded from different color-coded cellular regions in WT and S4938F mutant cells. Spontaneous sparks ignited more frequently in S4938F mutants compared with WT hiPSC-CMs (29.0 spark/s in S4938F vs. 15.7 spark/s in WT) (Figure 6B), consistent with the elevated SR Ca2+ content. The sparks histogram in Figure 6C depicts the spark duration distribution that averaged 74.30 ± 2.86 ms in WT and 63.08 ± 1.17 ms in S4938F mutant cells. Although spark durations showed larger cellular variability in WT cells, resulting in longer average duration, their peak occurrences in the number of the sparks were similar in both cell lines. Figure 6D shows TIRF images of the evolution of Ca2+ sparks (labeled by #) in WT and S4938F mutant cells.
2.6. Ca2+ Leak in WT and S4938F Mutant hiPSC-CMs
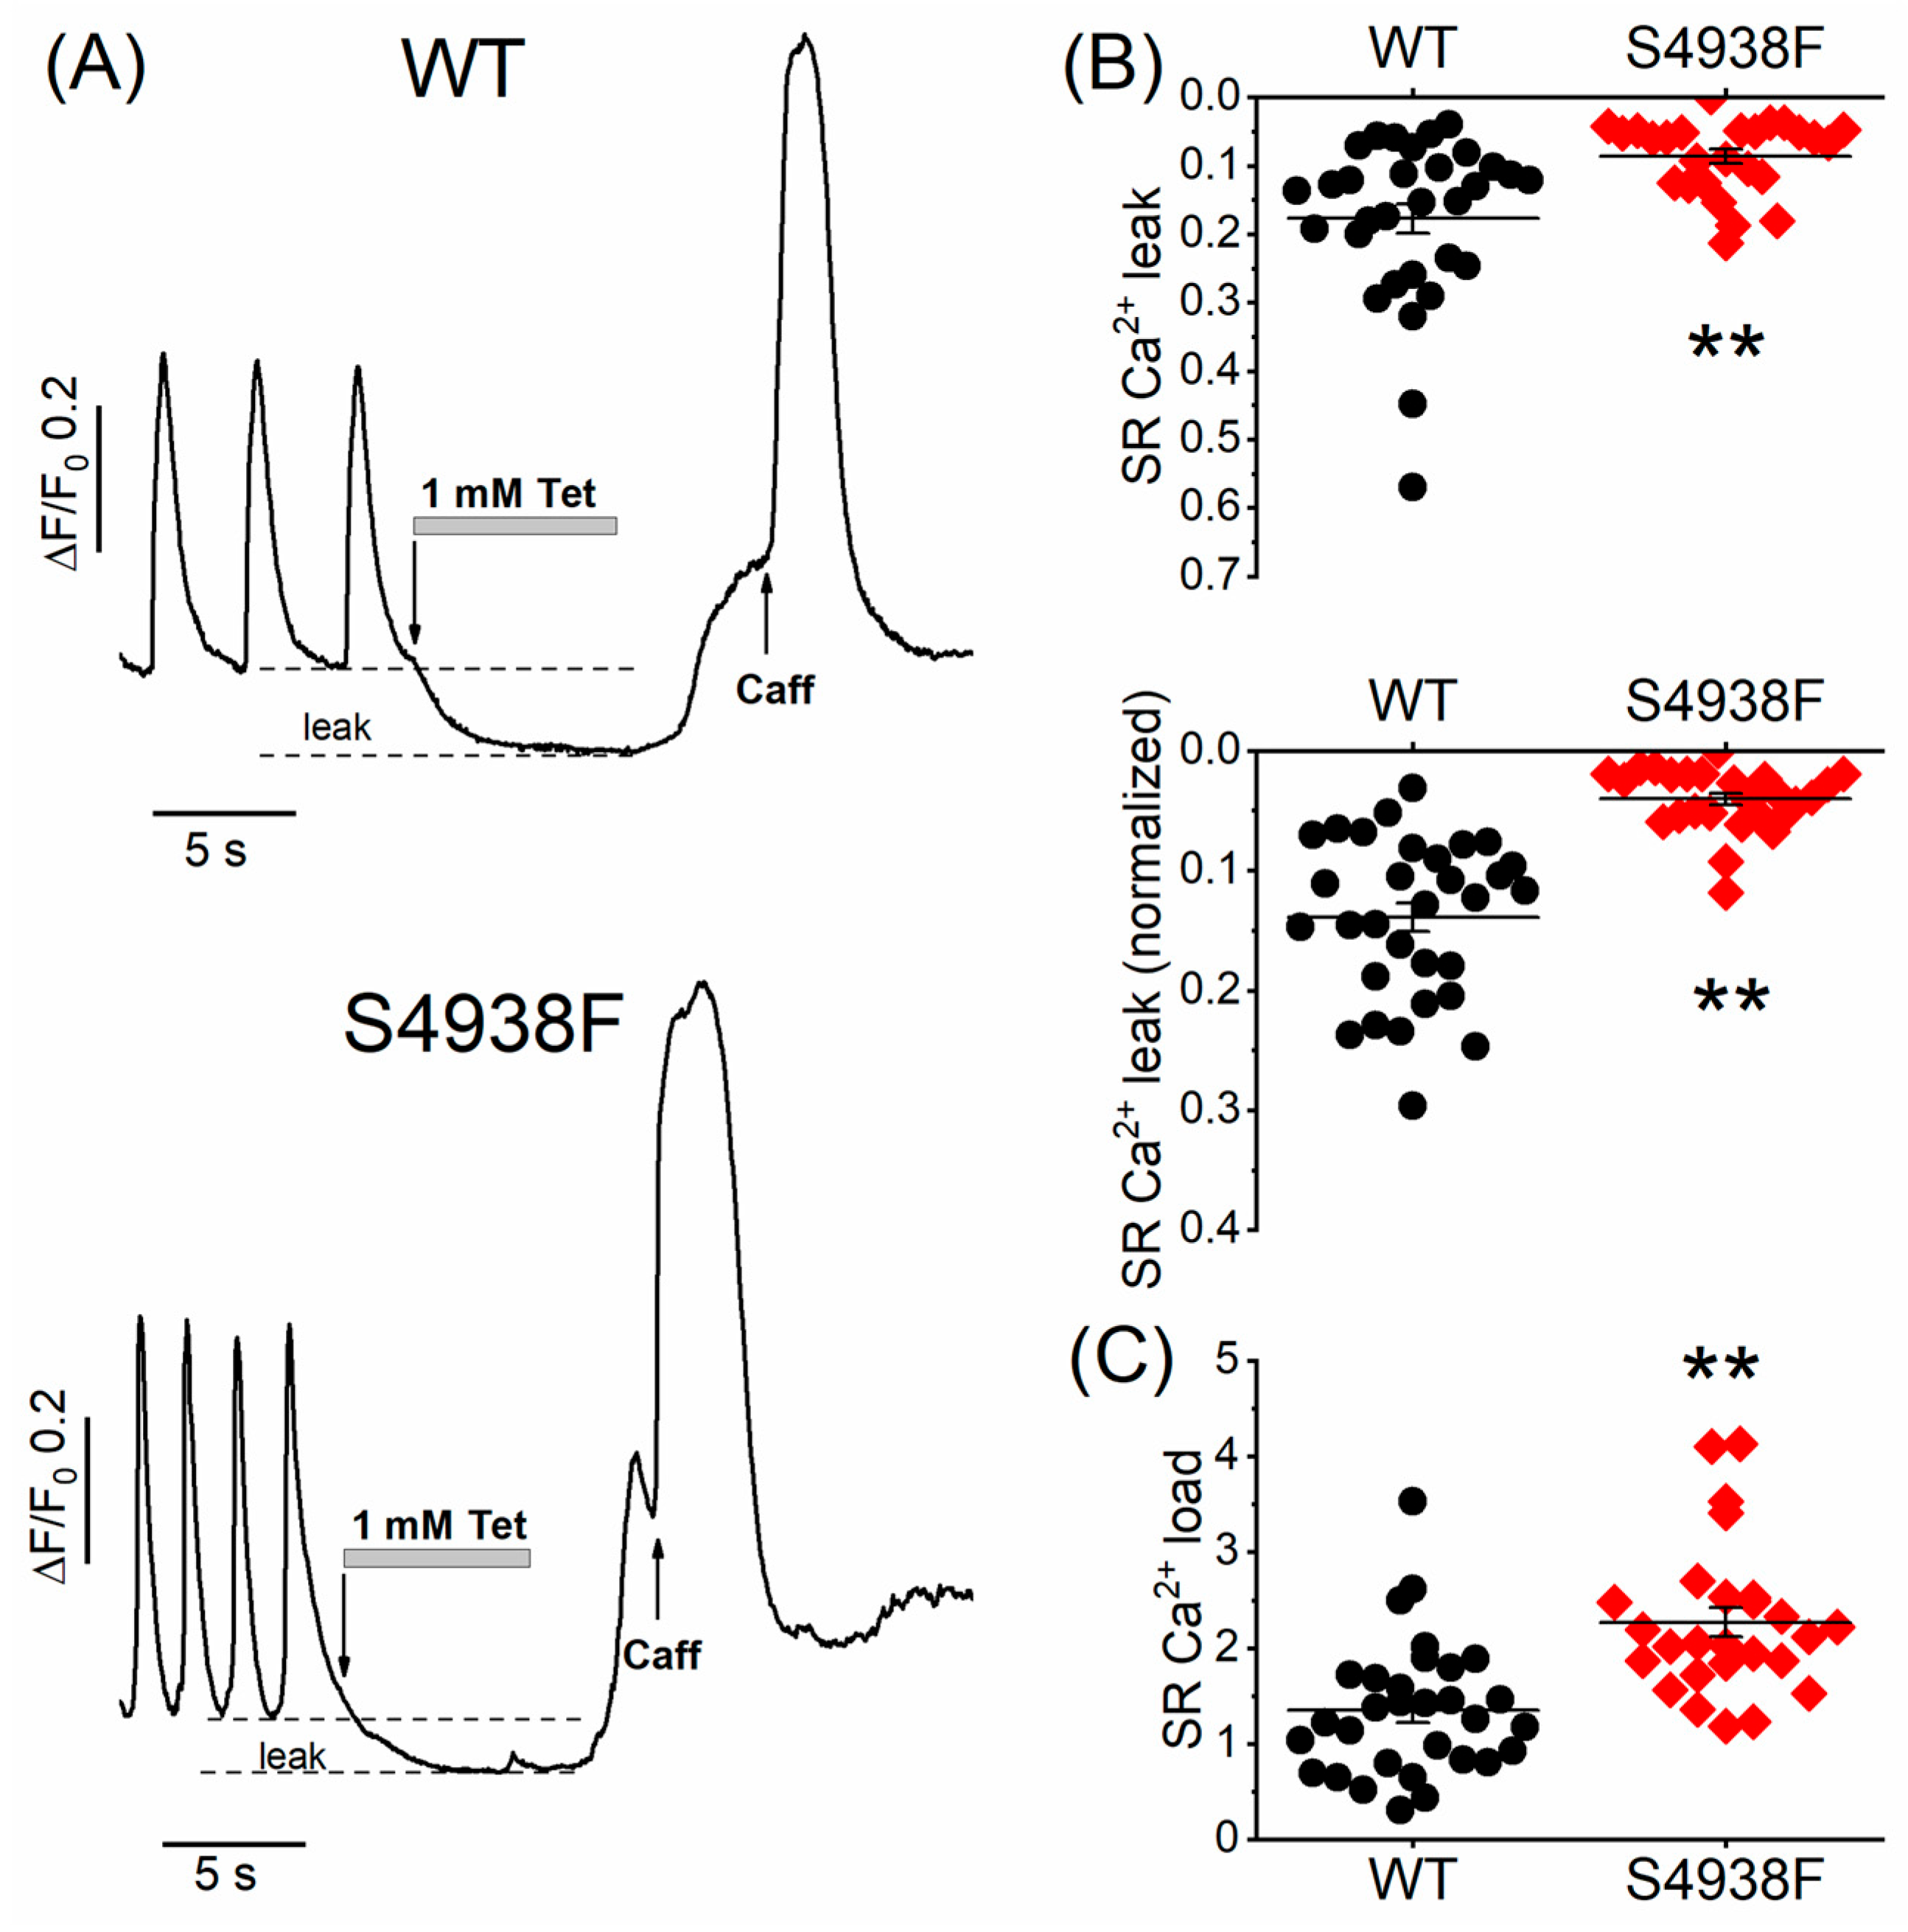
To measure whether S4938F RyR2 mutation altered the magnitude of the SR Ca2+ leak, WT and mutant cells were first bathed in a normal Tyrode solution that supports spontaneous Ca2+ releases and beating and then cells were exposed to a zero Ca2+/Na+ solution containing 1 mM tetracaine, followed by rapid application of 5 mM caffeine to quantify the SR Ca2+ content. SR Ca2+ leak was quantified as the decrease in the diastolic fluorescence level in the zero Ca2+/Na+ solution and then was normalized to the SR Ca2+ content triggered by caffeine. Figure 7A shows representative time courses of normalized Ca2+ fluorescence changes in spontaneous beating WT and S4938F cells after application of tetracaine followed by 5 mM caffeine in zero Ca2+/Na+ solution. Both the raw (0.09 ± 0.01 ΔF/F0 vs. 0.18 ± 0.03 ΔF/F0, Figure 7B (top)) and normalized SR Ca2+ leak (0.04 ± 0.005 ΔF/F0 vs. 0.13 ± 0.015 ΔF/F0, Figure 7B (bottom)) were significantly smaller in S4938F hiPSC-CMs than those of WT hiPSC-CMs, consistent with the higher SR Ca2+ load triggered by 5 mM caffeine (2.27 ± 0.15 ΔF/F0 vs. 1.51 ± 0.16 ΔF/F0, Figure 7C). Although higher SR Ca2+ content should have induced higher Ca2+ leak in S4938F cells, we consistently found reduced SR Ca2+ leak, supporting the possibility of allosteric modulation of the channel.
3. Discussion
The major finding of this study was that ICa-gated or spontaneously triggered calcium release signals of S4938F-RyR2 mutant hiPSC-CMs were suppressed compared with WT myocytes even though the caffeine-triggered SR Ca2+ release was larger and the SR Ca2+ leak was smaller. It is likely that mutation induces either a conformational change in the channel or the cellular proximity of dyads to the surface membrane is altered, leading to impaired CICR. Structural dissociation of dyads from the plasma membrane may also alter the regulatory control of calcium channels over RyR2, which may lead to the observed enhanced frequency of calcium sparks in mutant S4938F cells. The higher Ca2+ spark frequency along with the higher SR Ca2+ content is most likely responsible for the arrhythmogenic phenotype of the S4938F mutation.
3.1. Enhanced SR Ca2+ Content of S4938F-RyR2 Mutant hiPSC-CMs
The SR Ca2+ content was measured using the R-CEPIA1er Ca2+ sensor targeted to SR and monitoring the Fluo-4 AM cytosolic signal in response to rapid application of 5mM caffeine or by measuring INCX triggered by caffeine-induced intracellular Ca2+ rise. Application of 5 mM caffeine induced significantly larger Ca2+ transients and INCX in S4938F hiPSC-CMs than in WT hiPSC-CMs, consistent with a higher Ca2+ content of SR in S4938F-RyR2 mutant hiPSC-CMs. It is likely that the smaller calcium leak of S4938F mutant cells causes the higher Ca2+ content of SR, which may underlie the higher frequency of spontaneously occurring Ca2+ sparks or Ca2+ waves (Figure 6). The higher frequency of occurrence of Ca2+ sparks in S4938F mutant hiPSC-CMs is consistent with the higher Ca2+ waves frequency reported in HL-1 cardiomyocytes expressing S4938F-RyR2 [26]. The suppressed spontaneous calcium release also contributes to the increased SR Ca2+ stores, as in the absence of significant release, the accumulation of the residual Ca2+ in the SR increases.
3.2. Suppression of Spontaneous and ICa-Gated SR Ca2+ Release in S4938F-RyR2 Mutants
A previous study in HEK293 cells expressing recombinant S4938F-RyR2 mutation failed to show spontaneous Ca2+ oscillations using Fura-2 AM probe [25,26]. In sharp contrast, our data in the hiPSC-CM platform not only show that the S4938F-RyR2 mutant exhibited spontaneous cytosolic Ca2+ oscillations, but also that their frequency of occurrence was significantly higher than those measured in WT cells. It should be noted, however, that the spontaneous SR Ca2+ releases were significantly smaller and relaxed slowly. Since the decay times of spontaneous Ca2+ transients were longer, an impaired SERCA2a function could not be ruled out in mutant cells. This finding, along with significant suppression of CICR in S4938F compared with WT hiPSC-CMs, is consistent with the studies of Fujii et al. showing greatly reduced [3H]ryanodine binding and decreased CICR activity in S4938F mutant HEK293 cells [25]. Since increasing the extracellular Ca2+ concentration to 5 mM failed to enhance the SR Ca2+ release, we suggest that decreased Ca2+ gating of mutant RyR2 underlies the phenotype of this mutation in heart cells.
3.3. Pathophysiological Implications of S4938F-RyR2 Mutation
Clinically, S4938F-RyR2 mutation has been identified in patients who have bouts of premature ventricular contractions with a short (<300 ms) coupling interval, causing episodic ventricular tachycardia [25].
We chose to study the homozygous variant of this mutation, even though in patients this mutation is expressed as heterozygous variant, to minimize complications arising from the heterotetrametric structure of RyR2. Although this approach does not fully reflect the patient pathology, it does provide more precise data on the structure function implications of the mutation.
The S4938F site is located in the carboxyl-terminal tail of RyR2 that directly lines the helix of the ion channel conducting pore in close proximity to the channel’s activation core where the channel binding sites for Ca2+, caffeine and ATP are also located. It is not surprising, therefore, that several human-disease-associated C-terminal and pore mutations are expressed as “loss-of-function” mutations. It is likely, therefore, that S4938F-RyR2 mutation affects the transmission of the activating ligand signal to the C-terminal that regulates the ion channel pore open/close state. Indeed, Ca2+-dependent activation of RyR2 in recombinant protein platforms have shown such reduced activating Ca2+ affinity in the S4938F-RyR2 mutant, consistent with our ICa-induced Ca2+ release results. It remains of interest to investigate whether “affinities” to caffeine or other activating ligands are similarly altered by S4938F mutation. We have already reported that mutations in the calcium binding site that disable CICR also suppress caffeine-triggered responses, which suggests crossover effects between calcium and other ligand binding site functions [7]. It was, therefore, unexpected to find that in S4938F-expressing cells, even though CICR was suppressed, the caffeine-triggered responses were enhanced, suggesting a more complex interaction between the pore and calcium binding site residues. It is likely that there may be crossover effects of this mutation on other binding sites of the channel, which helps to preserve or enhance the caffeine response even when CICR is suppressed.
4. Materials and Methods
4.1. Cell Culture of hiPSC Lines
The wild-type (K3) line of hiPSC was established previously by Si-Tayeb et al. [27] and was provided for our studies. The cell line was maintained in StemFlex medium (Gibco, Thermo Fisher Scientific, Waltham, MA, USA) on Vitronectin-coated dishes at 37 °C with 5% CO2. The culture medium was replaced every 2 days and hiPSCs were passaged with Accutase (Thermo Fisher) every 4–6 days. A 10 μM quantity of Y-27632 ROCK inhibitor (Tocris) was added to the culture media for 24 h after each passage. Cell passages between No. 50 and No. 60 were used for the experiments.
4.2. CRISPR/Cas9 Genome Editing
CRISPR/Cas9 gene editing technique was used to introduce the S4938F mutation into the RYR2 gene of hiPSCs. The guide sequence 5′-TTTTGCAGGAATCTTATGTC-3′ adjacent to the Pam sequence (TGG) was identified in exon105 of the RYR2 gene by CRISPR Design Tool and was cloned into the pSpCas9 (BB)-2A-Puro vector (pX459, Addgene) to guide Cas9 exonuclease (Figure 1A), which digests the RYR2 gene within the guide sequence. Site-directed mutations were introduced by homology-directed repair of the Cas9-digested site using double-stranded plasmid DNA containing a ~400 bp homologous RYR2 genome sequence with mutations (Figure 1A). The homologous sequence harbors the S4938F mutation (TCT to TTT) and a silent mutation (no amino acid change: TAC to TAT) that creates a new restriction enzyme site HpyCH4IV to facilitate a process screening for correctly gene-edited hiPSC clones (Figure 1B,C). The plasmid DNA expressing RNA-guided Cas9 (15 µg) and the linearized double-stranded plasmid DNA (5 µg) carrying mutations were co-transfected by electroporation with two 30 ms pulses at 1050 V. The transfected cells were then plated in 60 mm vitronectin-coated dishes with 10 μM Y-27632 ROCK inhibitor in the culture medium. Then, 24 h after transfection, the cells were incubated with 1 μg/mL puromycin (Thermo) for 48 h. The surviving cell colonies were harvested 7–10 days after antibiotics treatment. Genomic DNAs of each cell colony were extracted from the harvested cells, and the S4938F mutations were screened by polymerase chain reaction (PCR) followed by restriction enzyme HpyCH4IV digestion (Figure 1B), and direct sequencing of PCR products (Figure 1C). Two sets of PCR primer pairs, F4xR4 or F6xR4, were used for screening the colonies (sequences shown below). Figure 1C shows the S4938F mutation site (*) and the silent mutation creating a new HpyCHIV4 restriction enzyme site (#) which was used for screening correct cell clones.
Screening primers for S4938F:
F4-5′-AGG CTG GTC TTG AAT GCC TG-3′
F6-5′-AAC TCA AGC GAT CCT CCC AC-3′
R4-5′-GGA GGA AAC AGC TCT TCC GA-3′.
4.3. Differentation of hiPSCs into Cardiomyocytes
Wild type and S4938F mutant hiPSCs were differentiated into cardiomyocytes in 24-well plates, as described in detail previously [28,29]. Briefly, the cells were dissociated in Matrigel (Corning)-coated wells and were treated with 10 µM CHIR 99021, a GSK3β inhibitor, for 24 h in RPMI/B-27 without insulin. Then, 72 h after this treatment, 5 µM IWR-1, a Wnt signaling inhibitor, was added to the cell cultures for 48 h in RPMI/B-27 without insulin. After removal of the drug, the cells were cultured with RPMI/B-27 without insulin until spontaneous beating started. Once beating was observed, the medium was changed, and the cells were kept in RPMI/B-27 with insulin medium.
4.4. Dissociation of Single hiPSC-CMs for Electrophysiological Experiments
The beating hiPSC-CMs were grown in monolayer cell cultures for a minimum of 5 weeks before they were enzymatically (TrypLE Select Enzyme 10×, Gibco) dissociated into single cardiomyocytes for electrophysiological and Ca2+ signaling experiments. The cells were plated on Vitronectin- or Matrigel-coated 25 mm glass coverslips and were incubated for three to four days before the experiments.
4.5. ER Ca2+ Probes
ER-GCaMP6-150 cDNA plasmid [30] (#86918) and R-CEPIA1er plasmid [31] (#58216) were purchased from Addgene (Watertown, MA, USA). Adenovirus carrying ER-GCaMP6-150 was produced by Vector Biosystems Inc (Malvern, PA, USA), and adenovirus carrying R-CEPIA1er was produced by Welgen Inc. (Worcester, MA, USA). At 24–48 h after plating the hiPSC-CMs on 25 mm coverslips, the cells were infected by a solution containing ER-GCaMP6 or R-CEPIA1er adenovirus containing (MOI) of 300–500 virus particles per cell (vp/cell). After 6–8 h, the virus medium was removed, and hiPSC-CMs were supplemented with B27+ medium at 37 °C until their use between 48 and 72 h post infection.
4.6. Ca2+ Imaging
WT and S4938F mutant hiPSC-CMs were imaged using a total internal reflection fluorescence (TIRF) imaging system. Directly before the experiments, the cells were loaded with either 1 µM Fluo-4 AM or 1 µM Fura-2 AM fluorescent dyes for 20 min at 37 °C in Tyrode’s solution containing (in mM) 137 NaCl, 5.4 KCl, 2 CaCl2, 1 MgCl2, 10 glucose and 10 HEPES, titrated to pH 7.4 with NaOH. Ca2+ transient and Ca2+ sparks were recorded at 70–80 Hz with a depth of penetration of 150 nm. Image sequences and fluorescence signals were detected and analyzed with LASX Leica software (Leica Microsystems Inc., Wetzlar, Germany). The fluorescence signals were quantified as the ratio of the changes in whole-cell fluorescence (ΔF) and the baseline fluorescence level (F0). The Ca2+ sparks were exported and analyzed with our custom-developed Con2j software [32]. The method of Ca2+ spark analysis was illustrated and described previously [4,32].
4.7. SR Ca2+ Leak and Load Measurement
Spontaneously beating WT and mutant hiPSC-CMs were imaged after 25–30 min of incubation of Fluo-4 AM at 37 °C. The Ca2+ leak of the SR was measured in spontaneously contracting cells when normal Tyrode solution was rapidly switched to zero Na+/Ca2+ solution containing 1 mM tetracaine to block RyR2. After tetracaine removal, the SR Ca2+ load was measured by rapid administration of 5 mM caffeine. The SR Ca2+ leak was quantified as the difference between the baseline fluorescence level and tetracaine-induced decrease in the diastolic Ca2+ level.
4.8. Electrophysiological Measurements
WT and S4938F mutant hiPSC-CMs were voltage-clamped in the whole cell configuration mode of patch clamp technique. The membrane voltage was obtained using a Dagan amplifier connected to a Digidata 1320A (Molecular Devices, San Jose, CA, USA) analogue–digital converter and pClamp software (Clampex 10.6, Molecular Devices). Borosilicate patch pipettes with resistances of 2–4 MΩ were pulled using a horizontal pipette puller (Model P-87, Sutter Instruments, Novato, CA, USA). The cells were dialyzed with Cs+-based internal solution containing (in mM) 100 Cs+-Aspartate, 15 NaCl, 30 TEA-Cl, 5 Mg-ATP, 0.5 MgCl2, 0.2 EGTA, 0.3 CaCl2, 10 HEPES and 0.1 Fura-2 pentasodium salt, at pH 7.2 and an osmolality of 300 Osmls. ICa was activated by a 100 ms depolarizing voltage pulse to 0 mV from a holding potential of –50 mV. The ICa-induced SR Ca2+ release and the corresponding cytosolic Ca2+ rise were simultaneously measured with the current. The amplitude of the ICa current was normalized to the membrane capacitance termed ICa density. Single exponential fits were applied to analyze the inactivation of ICaL with tau time constants of inactivation. The magnitude of the Ca2+ fluorescence changes were quantified as ΔF/F0, where ΔF is the amplitude of the fluorescence transient and F0 is the basal fluorescence intensity. ICa tail current-induced Ca2+ transients were measured by repolarization from 100 mV to -50 mV. The Ca2+ content of the SR was measured by rapid application of 5 mM caffeine for 1 s. The carried charge was estimated by calculating the integral of caffeine activated INCX. All the experiments were performed at 25–30 °C. The data were analyzed with the Clampfit10.7 (Molecular Devices) and Origin 9 (Origin lab) software.
4.9. Statistical Analysis
Statistical comparisons were performed using Student’s t-test or one-way ANOVA followed by the Tukey post hoc test. The statistical significance level was set to p ≤ 0.05 (labeled with one asterisk) and p ≤ 0.01 (labeled with two asterisks on each plot). Statistical analysis was performed using Origin 9 software (Origin lab) and MS Excel software (Microsoft, Redmond, WA). The data are presented as mean ± SEM.
5. Conclusions
A higher SR Ca2+ content and more frequent Ca2+ sparks underlie the increased arrhythmogenicity of the S4938F-RyR2 mutant. The smaller RyR2 Ca2+ leak and suppressed ICa-gated calcium release are likely to result from the close proximity of the mutation and the pore.
Author Contributions
Conceptualization, M.M.; molecular biology, A.Z., X.-H.Z. and N.T.; performing experiments, N.T.; data analysis, N.T.; resources, M.M.; writing—original draft preparation, N.T. and X.-H.Z.; writing—review and editing, M.M.; visualization, N.T.; supervision, M.M. All authors have read and agreed to the published version of the manuscript.
Funding
This research was funded by National Institutes of Health 1R01HL153504 to M.M., the Jennifer Friedman Hillis Foundation, and the SC Blue Cross and Blue Shield Foundation.
Institutional Review Board Statement
Not applicable.
Informed Consent Statement
Not applicable.
Data Availability Statement
The data presented in this study are available on request from the corresponding author.
Acknowledgments
We thank Naohiro Yamaguchi for his help creating the mutation and supervising the CRISPR/Cas9 experiments.
Conflicts of Interest
The authors declare no conflict of interest.
References
- Näbauer, M.; Callewaert, G.; Cleemann, L.; Morad, M. Regulation of calcium release is gated by calcium current, not gating charge, in cardiac myocytes. Science 1989, 244, 800–803. [Google Scholar] [CrossRef]
- Varró, A.; Tomek, J.; Nagy, N.; Virág, L.; Passini, E.; Rodriguez, B.; Baczkó, I. Cardiac transmembrane ion channels and action potentials: Cellular physiology and arrhythmogenic behavior. Physiol. Rev. 2021, 101, 1083–1176. [Google Scholar] [CrossRef] [PubMed]
- Cleemann, L.; Wang, W.; Morad, M. Two-dimensional confocal images of organization, density, and gating of focal Ca2+ release sites in rat cardiac myocytes. Proc. Natl. Acad. Sci. USA 1998, 95, 10984–10989. [Google Scholar] [CrossRef]
- Cheng, H.; Lederer, W.J.; Cannell, M.B. Calcium sparks: Elementary events underlying excitation-contraction coupling in heart muscle. Science 1993, 262, 740–744. [Google Scholar] [CrossRef]
- Priori, S.G.; Napolitano, C.; Tiso, N.; Memmi, M.; Vignati, G.; Bloise, R.; Sorrentino, V.; Danieli, G.A. Mutations in the cardiac ryanodine receptor gene (hRyR2) underlie catecholaminergic polymorphic ventricular tachycardia. Circulation 2001, 103, 196–200. [Google Scholar] [CrossRef] [PubMed]
- Astashev, M.E.; Serov, D.A.; Gudkov, S.V. Application of Spectral Methods of Analysis for Description of Ultradian Biorhythms at the Levels of Physiological Systems, Cells and Molecules (Review). Mathematics 2023, 11, 3307. [Google Scholar] [CrossRef]
- Zhang, X.H.; Wei, H.; Xia, Y.; Morad, M. Calcium signaling consequences of RyR2 mutations associated with CPVT1 introduced via CRISPR/Cas9 gene editing in human-induced pluripotent stem cell-derived cardiomyocytes: Comparison of RyR2-R420Q, F2483I, and Q4201R. Heart Rhythm 2021, 18, 250–260. [Google Scholar] [CrossRef]
- Fatima, A.; Xu, G.; Shao, K.; Papadopoulos, S.; Lehmann, M.; Arnáiz-Cot, J.J.; Rosa, A.O.; Nguemo, F.; Matzkies, M.; Dittmann, S.; et al. In vitro modeling of ryanodine receptor 2 dysfunction using human induced pluripotent stem cells. Cell. Physiol. Biochem. 2011, 28, 579–592. [Google Scholar] [CrossRef]
- Park, S.J.; Zhang, D.; Qi, Y.; Li, Y.; Lee, K.Y.; Bezzerides, V.J.; Yang, P.; Xia, S.; Kim, S.L.; Liu, X.; et al. Insights Into the Pathogenesis of Catecholaminergic Polymorphic Ventricular Tachycardia From Engineered Human Heart Tissue. Circulation 2019, 140, 390–404. [Google Scholar] [CrossRef]
- Itzhaki, I.; Maizels, L.; Huber, I.; Gepstein, A.; Arbel, G.; Caspi, O.; Miller, L.; Belhassen, B.; Nof, E.; Glikson, M.; et al. Modeling of Catecholaminergic Polymorphic Ventricular Tachycardia With Patient-Specific Human-Induced Pluripotent Stem Cells. J. Am. Coll. Cardiol. 2012, 60, 990–1000. [Google Scholar] [CrossRef]
- Steinberg, C.; Roston, T.M. RYR2-ryanodinopathies: From calcium overload to calcium deficiency. Europace 2023, 25, euad156. [Google Scholar] [CrossRef]
- Bhuiyan, Z.A.; van den Berg, M.P.; van Tintelen, J.P.; Bink-Boelkens, M.T.; Wiesfeld, A.C.; Alders, M.; Postma, A.V.; van Langen, I.; Mannens, M.M.; Wilde, A.A. Expanding spectrum of human RYR2-related disease: New electrocardiographic, structural, and genetic features. Circulation 2007, 116, 1569–1576. [Google Scholar] [CrossRef]
- Ohno, S.; Omura, M.; Kawamura, M.; Kimura, H.; Itoh, H.; Makiyama, T.; Ushinohama, H.; Makita, N.; Horie, M. Exon 3 deletion of RYR2 encoding cardiac ryanodine receptor is associated with left ventricular non-compaction. EP Eur. 2014, 16, 1646–1654. [Google Scholar] [CrossRef]
- Campbell, M.J.; Czosek, R.J.; Hinton, R.B.; Miller, E.M. Exon 3 deletion of ryanodine receptor causes left ventricular noncompaction, worsening catecholaminergic polymorphic ventricular tachycardia, and sudden cardiac arrest. Am. J. Med. Genet. Part A 2015, 167, 2197–2200. [Google Scholar] [CrossRef]
- Ormerod, J.O.M.; Ormondroyd, E.; Li, Y.; Taylor, J.; Wei, J.; Guo, W.; Wang, R.; Sarton, C.N.S.; McGuire, K.; Dreau, H.M.P.; et al. Provocation Testing and Therapeutic Response in a Newly Described Channelopathy: RyR2 Calcium Release Deficiency Syndrome. Circ. Genom. Precis. Med. 2022, 15, e003589. [Google Scholar] [CrossRef]
- Roston, T.M.; Wei, J.; Guo, W.; Li, Y.; Zhong, X.; Wang, R.; Estillore, J.P.; Peltenburg, P.J.; Noguer, F.R.I.; Till, J.; et al. Clinical and Functional Characterization of Ryanodine Receptor 2 Variants Implicated in Calcium-Release Deficiency Syndrome. JAMA Cardiol. 2022, 7, 84–92. [Google Scholar] [CrossRef] [PubMed]
- Sun, B.; Yao, J.; Ni, M.; Wei, J.; Zhong, X.; Guo, W.; Zhang, L.; Wang, R.; Belke, D.; Chen, Y.-X.; et al. Cardiac ryanodine receptor calcium release deficiency syndrome. Sci. Transl. Med. 2021, 13, eaba7287. [Google Scholar] [CrossRef] [PubMed]
- Zhao, Y.T.; Valdivia, C.R.; Gurrola, G.B.; Powers, P.P.; Willis, B.C.; Moss, R.L.; Jalife, J. Arrhythmogenesis in a catecholaminergic polymorphic ventricular tachycardia mutation that depresses ryanodine receptor function. Proc. Natl. Acad. Sci. USA 2015, 112, E1669–E1677. [Google Scholar] [CrossRef]
- Tester, D.J.; Kim, C.S.J.; Hamrick, S.K.; Ye, D.; O’Hare, B.J.; Bombei, H.M.; Fitzgerald, K.K.; Haglund-Turnquist, C.M.; Atkins, D.L.; Nunez, L.A.O.; et al. Molecular characterization of the calcium release channel deficiency syndrome. JCI Insight 2020, 5, e135952. [Google Scholar] [CrossRef]
- Chi, X.; Gong, D.; Ren, K.; Zhou, G.; Huang, G.; Lei, J.; Zhou, Q.; Yan, N. Molecular basis for allosteric regulation of the type 2 ryanodine receptor channel gating by key modulators. Proc. Natl. Acad. Sci. USA 2019, 116, 25575–25582. [Google Scholar] [CrossRef] [PubMed]
- Murayama, T.; Ogawa, H.; Kurebayashi, N.; Ohno, S.; Horie, M.; Sakurai, T. A tryptophan residue in the caffeine-binding site of the ryanodine receptor regulates Ca2+ sensitivity. Commun. Biol. 2018, 1, 98. [Google Scholar] [CrossRef] [PubMed]
- Chirasani, V.R.; Pasek, D.A.; Meissner, G. Structural and functional interactions between the Ca2+-, ATP-, and caffeine-binding sites of skeletal muscle ryanodine receptor (RyR1). J. Biol. Chem. 2021, 297, 101040. [Google Scholar] [CrossRef] [PubMed]
- Jiang, D.; Xiao, B.; Yang, D.; Wang, R.; Choi, P.; Zhang, L.; Cheng, H.; Chen, S.R. RyR2 mutations linked to ventricular tachycardia and sudden death reduce the threshold for store-overload-induced Ca2+ release (SOICR). Proc. Natl. Acad. Sci. USA 2004, 101, 13062–13067. [Google Scholar] [CrossRef]
- Zhong, X.; Guo, W.; Wei, J.; Tang, Y.; Liu, Y.; Zhang, J.Z.; Tan, V.H.; Zhang, L.; Wang, R.; Jones, P.P.; et al. Identification of loss-of-function RyR2 mutations associated with idiopathic ventricular fibrillation and sudden death. Biosci. Rep. 2021, 41, BSR20210209. [Google Scholar] [CrossRef]
- Fujii, Y.; Itoh, H.; Ohno, S.; Murayama, T.; Kurebayashi, N.; Aoki, H.; Blancard, M.; Nakagawa, Y.; Yamamoto, S.; Matsui, Y.; et al. A type 2 ryanodine receptor variant associated with reduced Ca2+ release and short-coupled torsades de pointes ventricular arrhythmia. Heart Rhythm 2017, 14, 98–107. [Google Scholar] [CrossRef]
- Hirose, S.; Murayama, T.; Tetsuo, N.; Hoshiai, M.; Kise, H.; Yoshinaga, M.; Aoki, H.; Fukuyama, M.; Wuriyanghai, Y.; Wada, Y.; et al. Loss-of-function mutations in cardiac ryanodine receptor channel cause various types of arrhythmias including long QT syndrome. EP Eur. 2022, 24, 497–510. [Google Scholar] [CrossRef] [PubMed]
- Si-Tayeb, K.; Noto, F.K.; Sepac, A.; Sedlic, F.; Bosnjak, Z.J.; Lough, J.W.; Duncan, S.A. Generation of human induced pluripotent stem cells by simple transient transfection of plasmid DNA encoding reprogramming factors. BMC Dev. Biol. 2010, 10, 81. [Google Scholar] [CrossRef]
- Wei, H.; Zhang, X.H.; Clift, C.; Yamaguchi, N.; Morad, M. CRISPR/Cas9 Gene editing of RyR2 in human stem cell-derived cardiomyocytes provides a novel approach in investigating dysfunctional Ca2+ signaling. Cell Calcium 2018, 73, 104–111. [Google Scholar] [CrossRef]
- Lian, X.; Zhang, J.; Azarin, S.M.; Zhu, K.; Hazeltine, L.B.; Bao, X.; Hsiao, C.; Kamp, T.J.; Palecek, S.P. Directed cardiomyocyte differentiation from human pluripotent stem cells by modulating Wnt/beta-catenin signaling under fully defined conditions. Nat. Protoc. 2013, 8, 162–175. [Google Scholar] [CrossRef] [PubMed]
- de Juan-Sanz, J.; Holt, G.T.; Schreiter, E.R.; de Juan, F.; Kim, D.S.; Ryan, T.A. Axonal Endoplasmic Reticulum Ca2+ Content Controls Release Probability in CNS Nerve Terminals. Neuron 2017, 93, 867–881.e866. [Google Scholar] [CrossRef]
- Suzuki, J.; Kanemaru, K.; Ishii, K.; Ohkura, M.; Okubo, Y.; Iino, M. Imaging intraorganellar Ca2+ at subcellular resolution using CEPIA. Nat. Commun. 2014, 5, 4153. [Google Scholar] [CrossRef] [PubMed]
- Zhang, X.H.; Haviland, S.; Wei, H.; Sarić, T.; Fatima, A.; Hescheler, J.; Cleemann, L.; Morad, M. Ca2+ signaling in human induced pluripotent stem cell-derived cardiomyocytes (iPS-CM) from normal and catecholaminergic polymorphic ventricular tachycardia (CPVT)-afflicted subjects. Cell Calcium 2013, 54, 57–70. [Google Scholar] [CrossRef] [PubMed]
Figure 1.
Introduction of S4938F mutation into the ryanodine receptor 2 (RYR2) gene of hiPSC-CMs. (A) Schematic of gene editing showing RYR2 gene was digested by Cas9 exonuclease at the target sequence. (B) The targeted locus of the genome was amplified by polymerase chain reaction (PCR) with primers F6 and R4 (see Section 4.2), followed by restriction digestion by HpyCH4IV. Total size of unrestricted PCR was 527 bp. WT PCR product was cut into two fragments by the enzyme indicated with red triangle (119 + 408 bp). The larger fragment was cut into two fragments in the PCR product of homozygous S4938F mutant, resulting in total of three digested fragments (119 + 161 + 247 bp). (C) Sequencing of PCR products show S4938F (TCT to TTT) mutation (*) and a silent mutation creating a new HpyCHIV4 restriction enzyme site (#).

Figure 2.
Spontaneous cytoplasmic and SR Ca2+ oscillations in intact WT and S4938F-RyR2 mutant hiPSC-CMs. (A) Representative traces of spontaneous Ca2+ transients measured in WT and S4938F mutant hiPSC-CMs incubated with Fluo-4 AM showing increased spontaneous frequency and decreased Ca2+ transients in S4938F. (B) Quantified data show that S4938F-RyR2 mutant hiPSC-CMs exhibited decreased spontaneous Ca2+ transients as compared with WT hiPSC-CMs (0.92 ± 0.09 ΔF/F0 in S4938F vs. 1.23 ± 0.11 ΔF/F0 in WT, n = 39–36, p = 0.027). (C) Representative traces of spontaneous SR Ca2+ releases and accompanying Ca2+ transients in WT and S4938F hiPSC-CMs. SR Ca2+ release was detected by R-CEPIA1-ER (red) and the cytosolic Ca2+ levels were monitored using Fluo-4 AM (green). (D) Quantification of spontaneous SR Ca2+ release and cytosolic Ca2+ changes show greatly reduced SR Ca2+ release in the mutant cells (0.02 ± 0.002 ΔF/F0 in S4938F vs. 0.05 ± 0.006 ΔF/F0 in WT, n = 19–19, p = 1.39 × 10⁻⁵) with suppressed cytosolic Ca2+ rise compared with those of WT hiPSC-CMS (0.95 ± 0.10 ΔF/F0 in S4938F vs. 1.48 ± 0.23 ΔF/F0 in WT, n = 19–19, p = 0.04). (E) Spontaneous Ca2+ transients of Fluo-4 AM loaded mutant cells showed increased frequency (cycle length: 3343.3 ± 186.5 ms in S4938F vs. 4237.7 ± 289.8 ms in WT, n = 37–38, p = 0.01, left panel), and the cycle length continued to be shorter in mutant cells loaded with Fluo-4AM along with SR Ca2+ probe R-CEPIA1er, although due to a greater variability, the difference was not statistically significant (3026.3 ± 399.2 ms in S4938F vs. 3813.1 ± 444.5 ms in WT, n = 16–18, p = 0.20, right panel). (F,G) Scatter dots show the time-to-peak (TTP) intervals and decay rates of Ca2+ transients measured by Fluo-4 AM in WT and S4938F mutant hiPSC-CMs. TTP and decay times of Ca2+ transients were quantified as a ratio normalized to their cycle lengths, showing unaltered TTP (0.25 ± 0.02 in S4938F vs. 0.25 ± 0.01 in WT, n = 37–35, p = 0.84) and slower decay in S4938F mutant hiPSC-CMs (0.69 ± 0.02 in S4938F vs. 0.62 ± 0.02 in WT, n = 37–35, p = 0.04). Data are shown as scatter dots with mean ± SEM. * p < 0.05, ** p < 0.01.

Figure 3.
Sarcoplasmic reticulum Ca2+ content measured by 5 mM caffeine. (A) Representative traces and quantified data of 5 mM caffeine-triggered Ca2+ transients measured by Fluo-4 AM in intact WT and S4938F mutant hiPSC-CMs. Caffeine-induced Ca2+ transients were significantly higher in S4938F cells (1.73 ± 0.15 ΔF/F0 vs. 1.12 ± 0.1 ΔF/F0, n = 38–44, p = 0.0007). (B) Simultaneously measured caffeine-triggered cytosolic Ca2+ transient (green) and SR Ca2+ release (red) also showed higher Ca2+ release (0.25 ± 0.019 ΔF/F0 vs. 0.18 ± 0.016 ΔF/F0, n = 31–22, p = 0.009) and cytosolic Ca2+ rise in S4938F cells compared with those of WT cells (2.74 ± 0.16 ΔF/F0 vs. 1.88 ± 0.24 ΔF/F0, n = 31–22, p = 0.003). (C) Quantified data and representative traces show that fractional release of Ca2+ as the ratio of spontaneous Ca2+ release to caffeine-induced Ca2+ release was significantly smaller in S4938F mutant cells (R-CEPIA1er: 0.08 ± 0.01 vs. 0.31 ± 0.08, n = 14–11, p = 0.003; Fluo-4 AM: 0.52 ± 0.04 vs. 0.98 ± 0.09, n = 14–11, p = 4.6 × 10⁻⁵). Data are shown as scatter plots with mean ± SEM, ** <0.01.

Figure 4.
INCX and caffeine-induced Ca2+ release from patch-clamped and TIRF-imaged WT and S4938F mutant hiPSC-CMs. (A) Representative traces of INCX from WT and S4938F mutant cells. (B) Quantified INCX densities from WT and mutant cells. Scatter plots show that both peak INCX (5.42 ± 1.03 pA/pF vs. 2.45 ± 0.2 pA/pF, n = 10–20, p = 0.0005) and the carried Ca2+ by INCX (14.5 ± 4.4 pC/pF vs. 6.8 ± 0.8 pC/pF, n = 8–17, p = 0.02) were significantly higher in S4938F mutant hiPS-CMs compared with those of WT cells in 5 mM extracellular calcium. (C) Representative traces of caffeine-induced SR Ca2+ release (ER-GCaMP6, green) and cytosolic Ca2+ rise (Fura-2, blue) in WT and S4938F mutant CMs. (D) Scatter plots depict no significant difference in the caffeine-induced Ca2+ release or Ca2+ transients in patched conditions compared with WT (0.34 ± 0.06 ΔF/F0 in S4938F vs. 0.39 ± 0.03 ΔF/F0 in WT, n = 10–20, p = 0.4, and 0.27 ± 0.05 ΔF/F0 in S4938F vs. 0.26 ± 0.02 ΔF/F0 in WT, n = 10–20, p = 0.7, respectively). Data are shown as scatter plots with mean ± SEM. * p < 0.05, ** p < 0.01.

Figure 5.
L-type Ca2+ current (ICa) and Ca2+-induced Ca2+ release (CICR). (A) Representative traces of ICa recorded on depolarizations to zero mV from holding potential of –50 mV in WT and S4938F mutant hiPSC-CMs. (B) Quantified ICa density (bottom panel) and ICa inactivation (top panel) from WT and S4938F-RyR2 mutant hiPSC-CMs. ICa density was significantly smaller in S4938F hiPSC-CMs in 2 mM extracellular Ca2+ solutions (12.35 ± 1.1 pA/pF vs. 16.62 ± 1.05 pA/pF, n = 22–17, p = 0.009), and the current inactivated significantly slower (inactivation tau: 18.74 ± 1.45 ms in S4938F vs. 10.41 ± 0.82 ms in WT, n = 20–17, p = 2.3 × 10⁻⁵). Increasing the extracellular Ca2+ concentration from 2 mM to 5 mM, increased the ICa density in both cell types (21.0 ± 2.05 pA/pF in S4938F vs. 19.6 ± 2.4 pA/pF in WT, n = 23–24, p = 0.66). (C) Representative traces of ICa-activated Ca2+ transients and SR Ca2+ release in WT and S4938F hiPSC-CMs measured by Fura2 pentasodium salt (blue) and SR targeted probe (ER-GCaMP6, green). (D) CICR was suppressed in S4938F hiPSC-CMs compared with levels in WT hiPSC-CMs (0 ΔF/F0 in S4938F vs. 0.07 ± 0.02 ΔF/F0 in WT, n = 22–17, p = 0.0001). Increasing the extracellular Ca2+ concentration from 2 mM to 5 Mm elevated the cytosolic Fura-2 Ca2+ signals in mutant cells to levels comparable with those of WT cells (0.15 ± 0.02 ΔF/F0 in S4938F vs. 0.14 ± 0.02 in WT, but did not significantly enhance ICa-induced Ca2+ release signal from the SR. (E) ICa tail current and ICa tail current triggered Ca2+ transients in WT and S4938F cells. (F) Quantified data of ICa tail current-induced fluorescence signals indicate significantly smaller Ca2+ transients in S4938F cells in 2 mM extracellular Ca2+ (0.06 ± 0.009 ΔF/F0 in S4938F vs. 0.13 ± 0.02 ΔF/F0 in WT, n = 19–11, p = 0.002). Data are shown as scatter plots with mean ± SEM. * p < 0.05, ** p < 0.01.

Figure 6.
Ca2+ sparks recorded from WT and S4938F-RyR2 mutant hiPSC-CMs. (A) Representative time courses of normalized Ca2+ sparks from different color-coded regions in WT and S4938F mutant cells. (B) Scatter plot shows significantly higher spark frequency of S4938F mutant hiPSC-CMs compared with WT cells (29.0 spark/s in S4938F vs. 15.7 spark/s in WT, n = 55–24, p = 2.9 × 10⁻⁵). (C) Histogram and distribution curves depict the spark duration measured at half-maximum amplitude (63.08 ± 1.17 ms in S4938F vs. 74.30 ± 2.86 ms in WT, n = 212–662, p = 2.17 × 10⁻⁵). (D) Total internal reflection fluorescence images show the evolution of the # labeled sparks from WT and S4938F mutant hiPSC-CMs. Data are shown as scatter plots with mean ± SEM, ** p < 0.01.

Figure 7.
Ca2+ leak and load levels in WT and S4938F mutant hiPSC-CMs. (A) Representative time courses of normalized Ca2+ fluorescence changes in spontaneously beating WT and S4938F mutant hiPSC-CMs after rapid exposure to zero Ca2+/Na+ solution containing 1 mM tetracaine followed by 5 mM caffeine. (B) Scatter plots show decreased raw sarcoplasmic reticulum (SR) Ca2+ leak levels (0.09 ± 0.01 ΔF/F0 vs. 0.18 ± 0.02 ΔF/F0, n = 26–31, p = 0.0007) and decreased SR Ca2+ levels normalized to the SR Ca2+ store size (0.04 ± 0.005 ΔF/F0 vs. 0.14 ± 0.012 ΔF/F0, n = 26–31, p = 2.7 × 10⁻⁹). (C) Along with the reduced SR Ca2+ leak, S4938F cells showed higher SR Ca2+ load triggered by caffeine (2.27 ± 0.15 ΔF/F0 vs. 1.35 ± 0.13 ΔF/F0, n = 26–31, p = 1.94 × 10⁻⁵). Data are shown as scatter plots with mean ± SEM, ** p < 0.01.

Disclaimer/Publisher’s Note: The statements, opinions and data contained in all publications are solely those of the individual author(s) and contributor(s) and not of MDPI and/or the editor(s). MDPI and/or the editor(s) disclaim responsibility for any injury to people or property resulting from any ideas, methods, instructions or products referred to in the content. |
© 2023 by the authors. Licensee MDPI, Basel, Switzerland. This article is an open access article distributed under the terms and conditions of the Creative Commons Attribution (CC BY) license (https://creativecommons.org/licenses/by/4.0/).
Share and Cite
MDPI and ACS Style
Toth, N.; Zhang, X.-H.; Zamaro, A.; Morad, M. Calcium Signaling Consequences of RyR2-S4938F Mutation Expressed in Human iPSC-Derived Cardiomyocytes. Int. J. Mol. Sci. 2023, 24, 15307. https://doi.org/10.3390/ijms242015307
AMA Style
Toth N, Zhang X-H, Zamaro A, Morad M. Calcium Signaling Consequences of RyR2-S4938F Mutation Expressed in Human iPSC-Derived Cardiomyocytes. International Journal of Molecular Sciences. 2023; 24(20):15307. https://doi.org/10.3390/ijms242015307
Chicago/Turabian StyleToth, Noemi, Xiao-Hua Zhang, Alexandra Zamaro, and Martin Morad. 2023. "Calcium Signaling Consequences of RyR2-S4938F Mutation Expressed in Human iPSC-Derived Cardiomyocytes" International Journal of Molecular Sciences 24, no. 20: 15307. https://doi.org/10.3390/ijms242015307
Note that from the first issue of 2016, this journal uses article numbers instead of page numbers. See further details here.