
Murine Breast Cancer Radiosensitization Using Oxygen Microbubbles and Metformin: Vessels Are the Key
 , , , , and
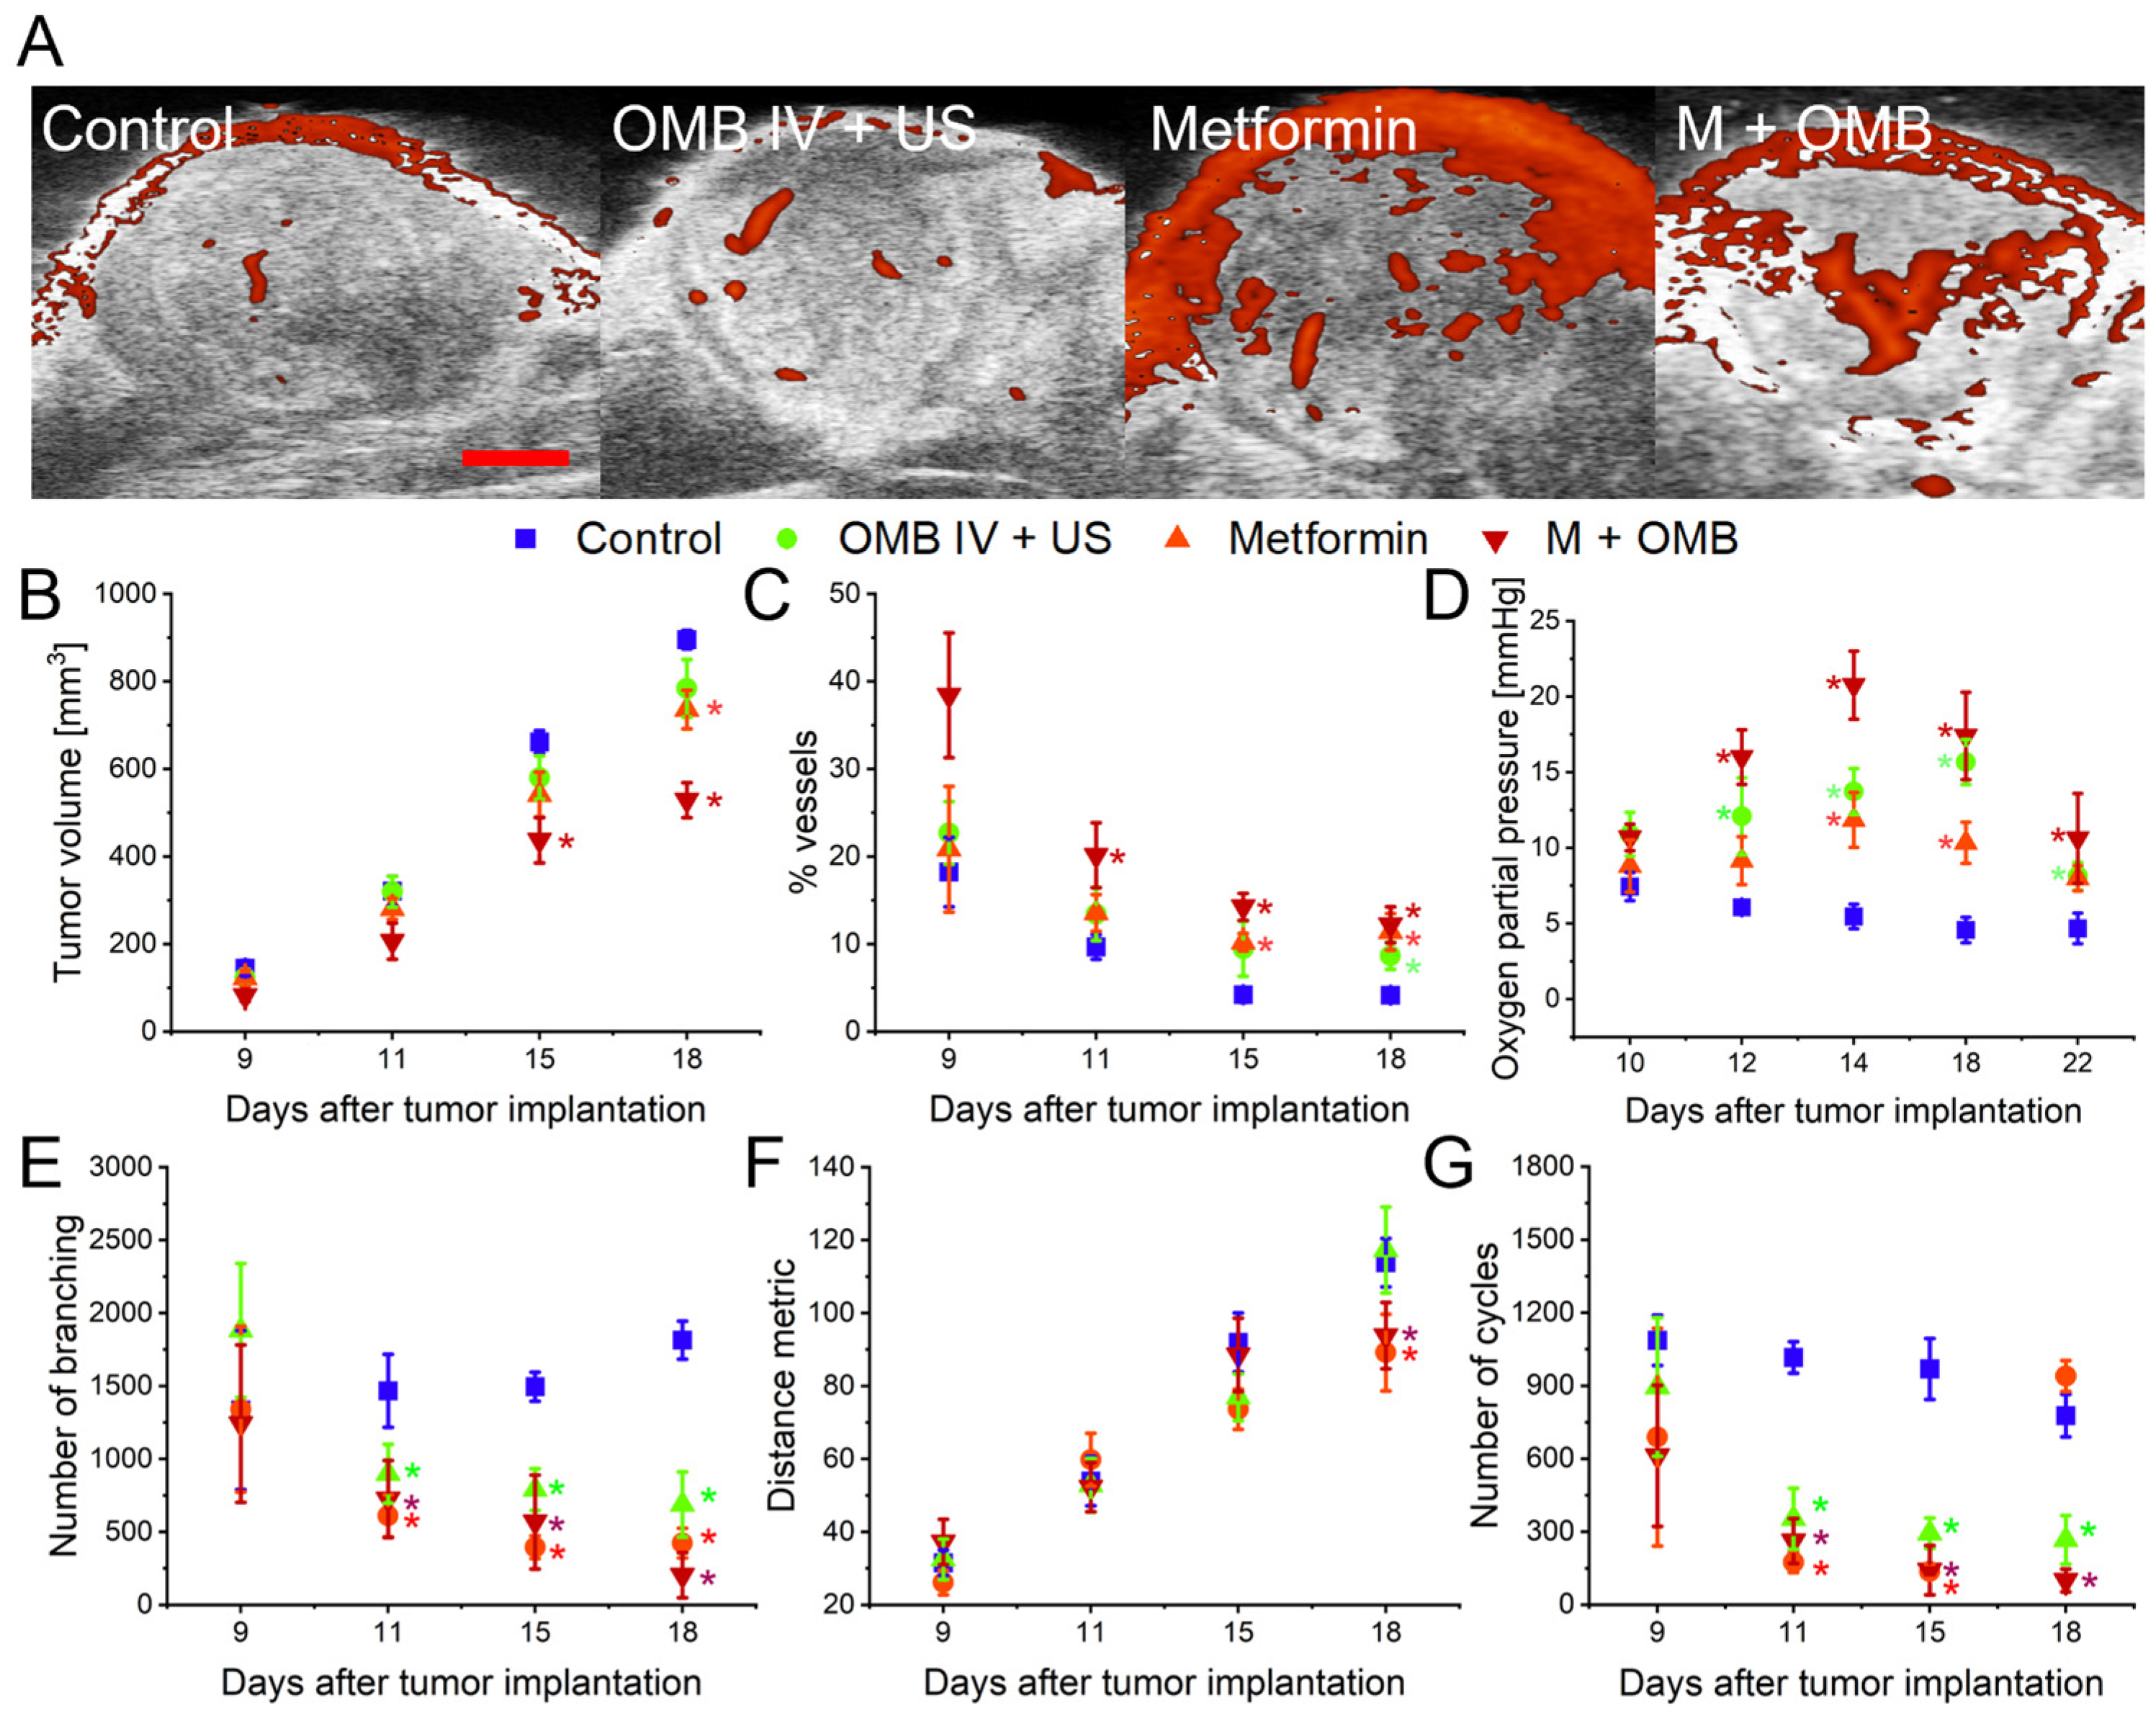
Abstract
:1. Introduction
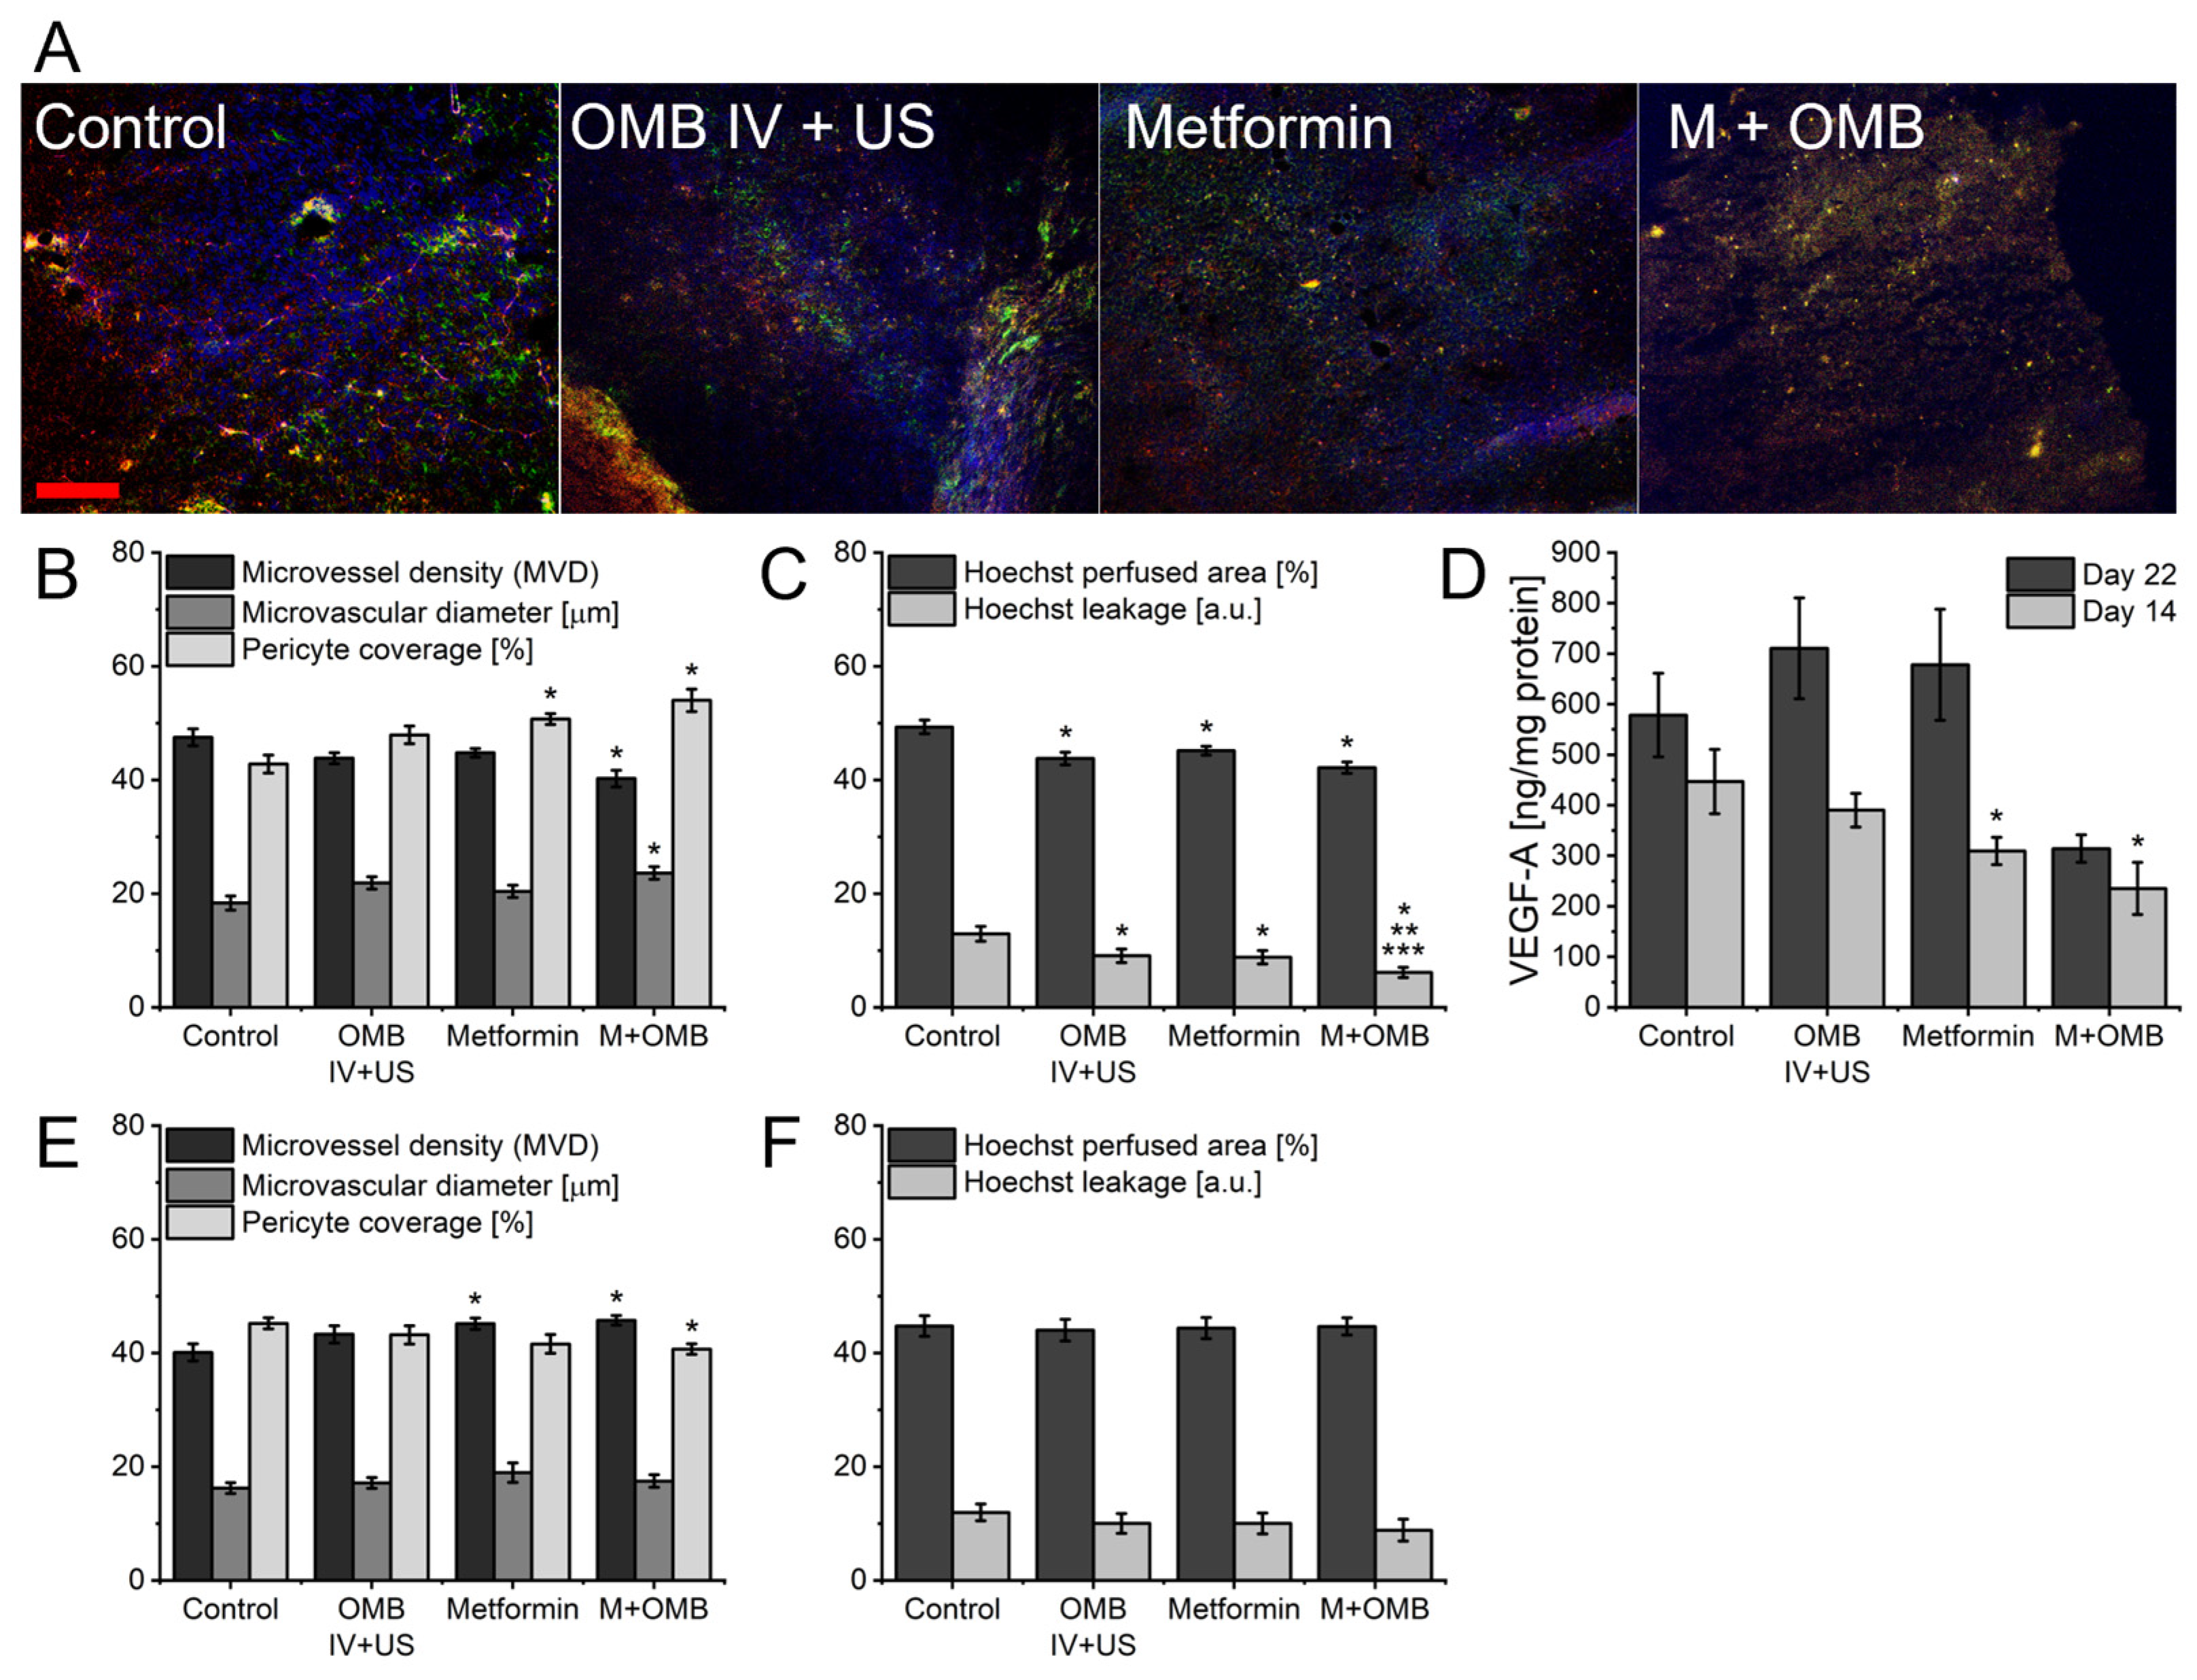
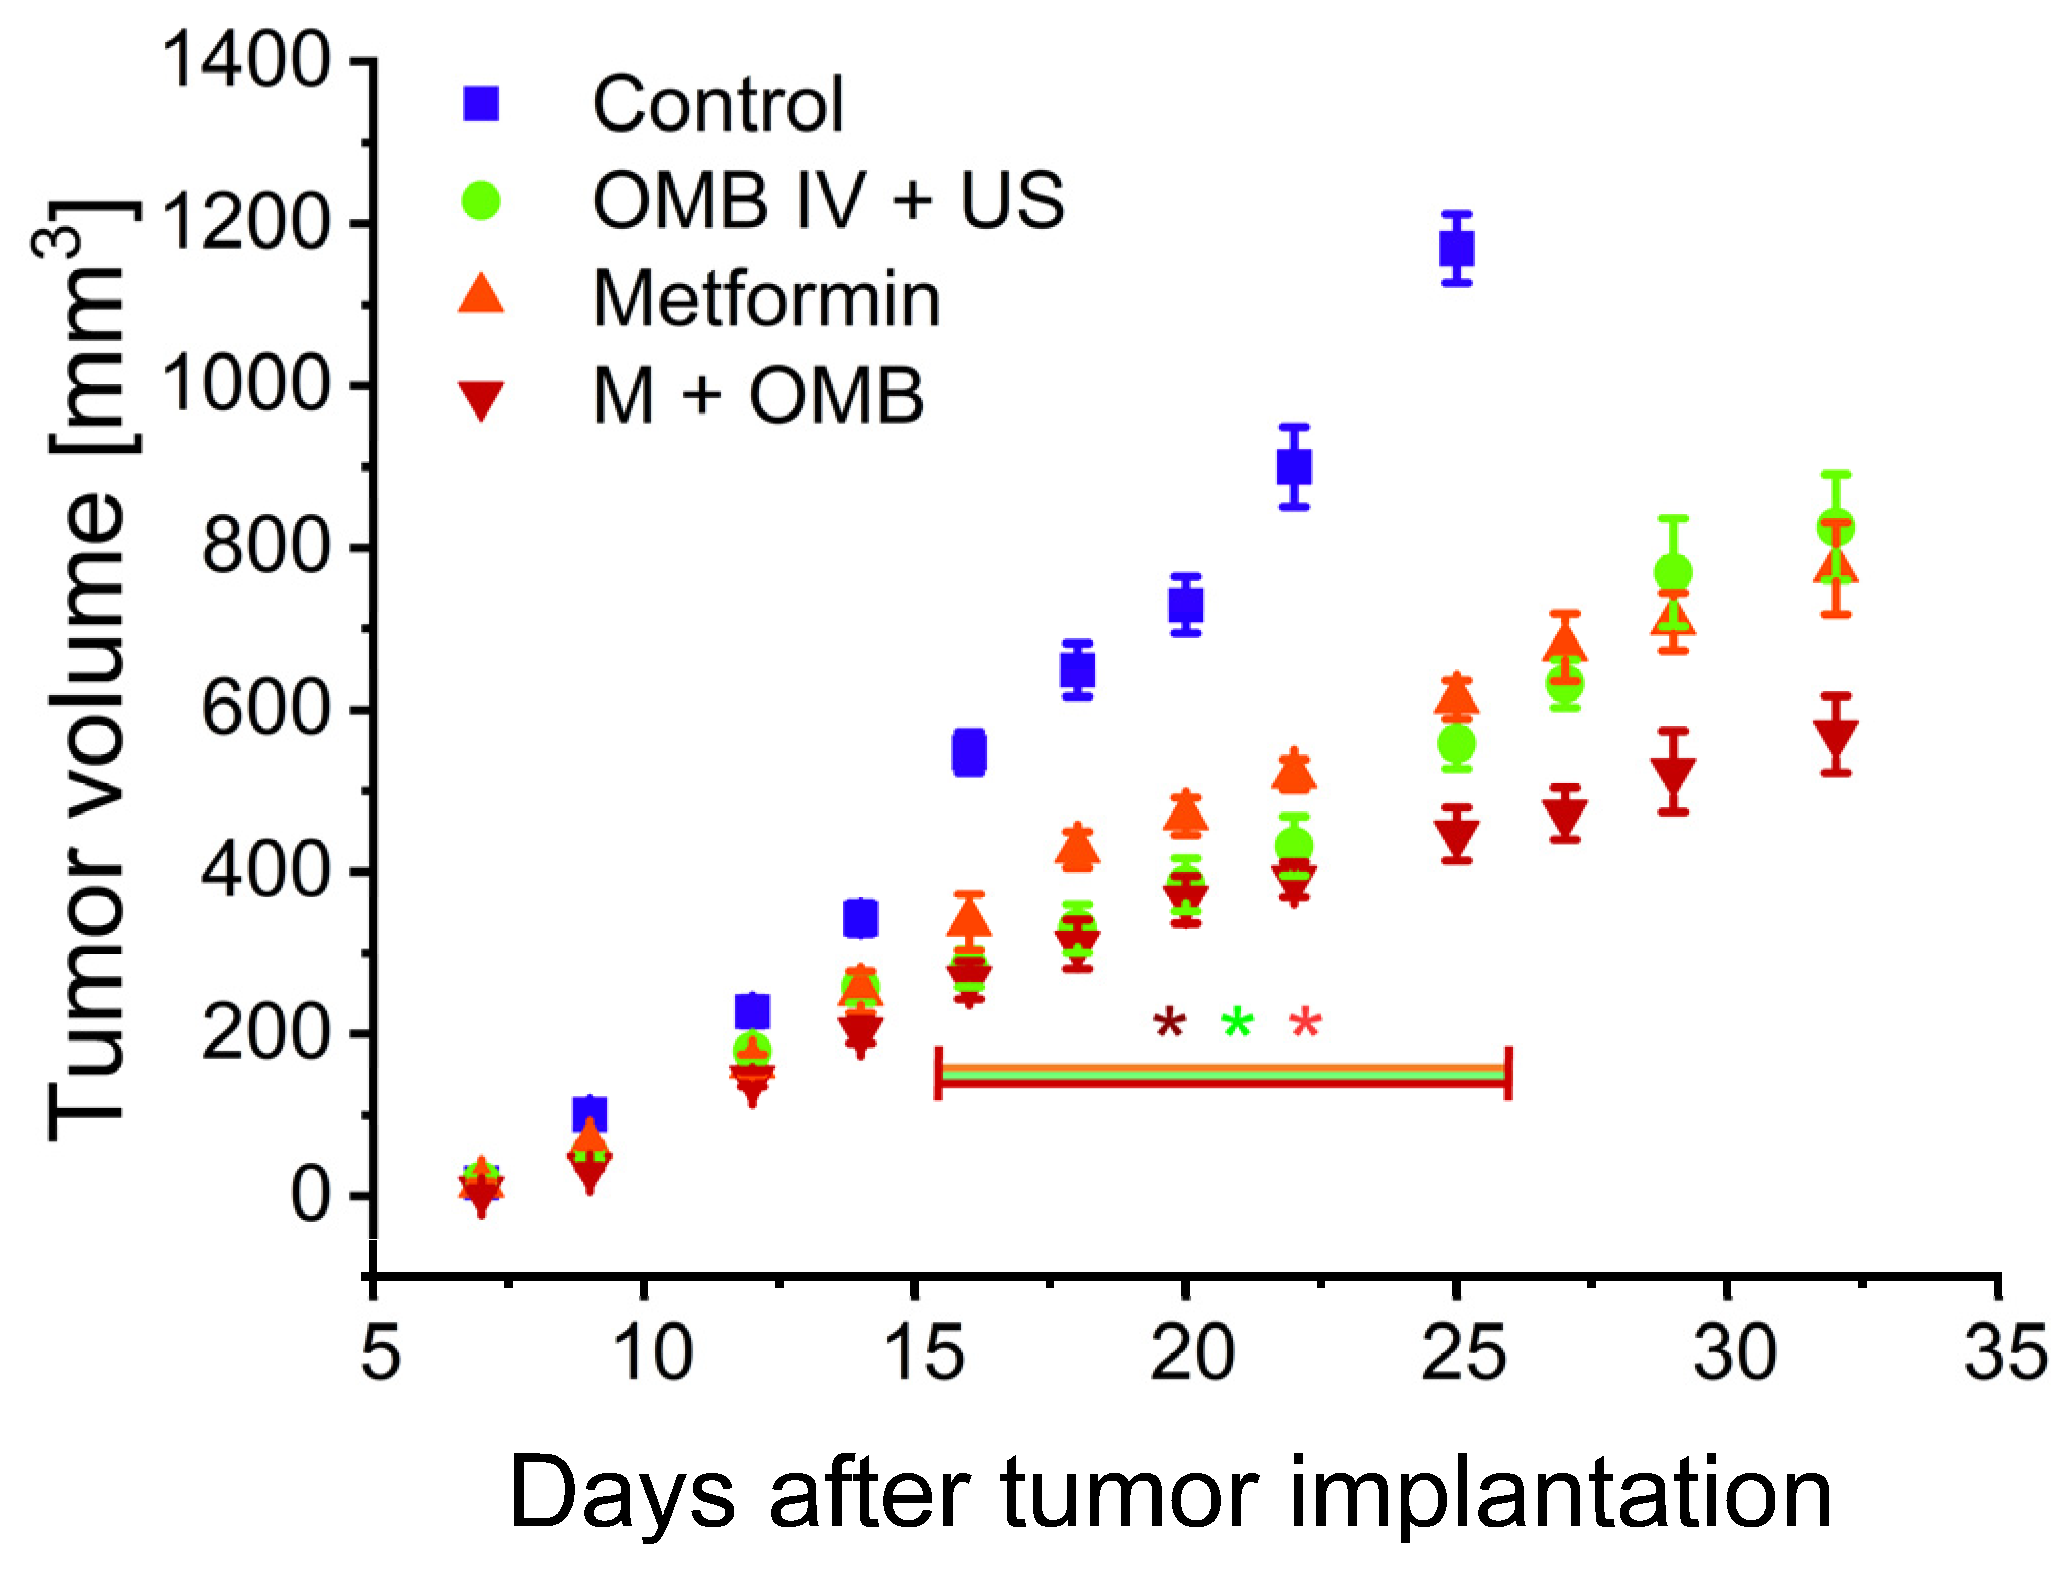
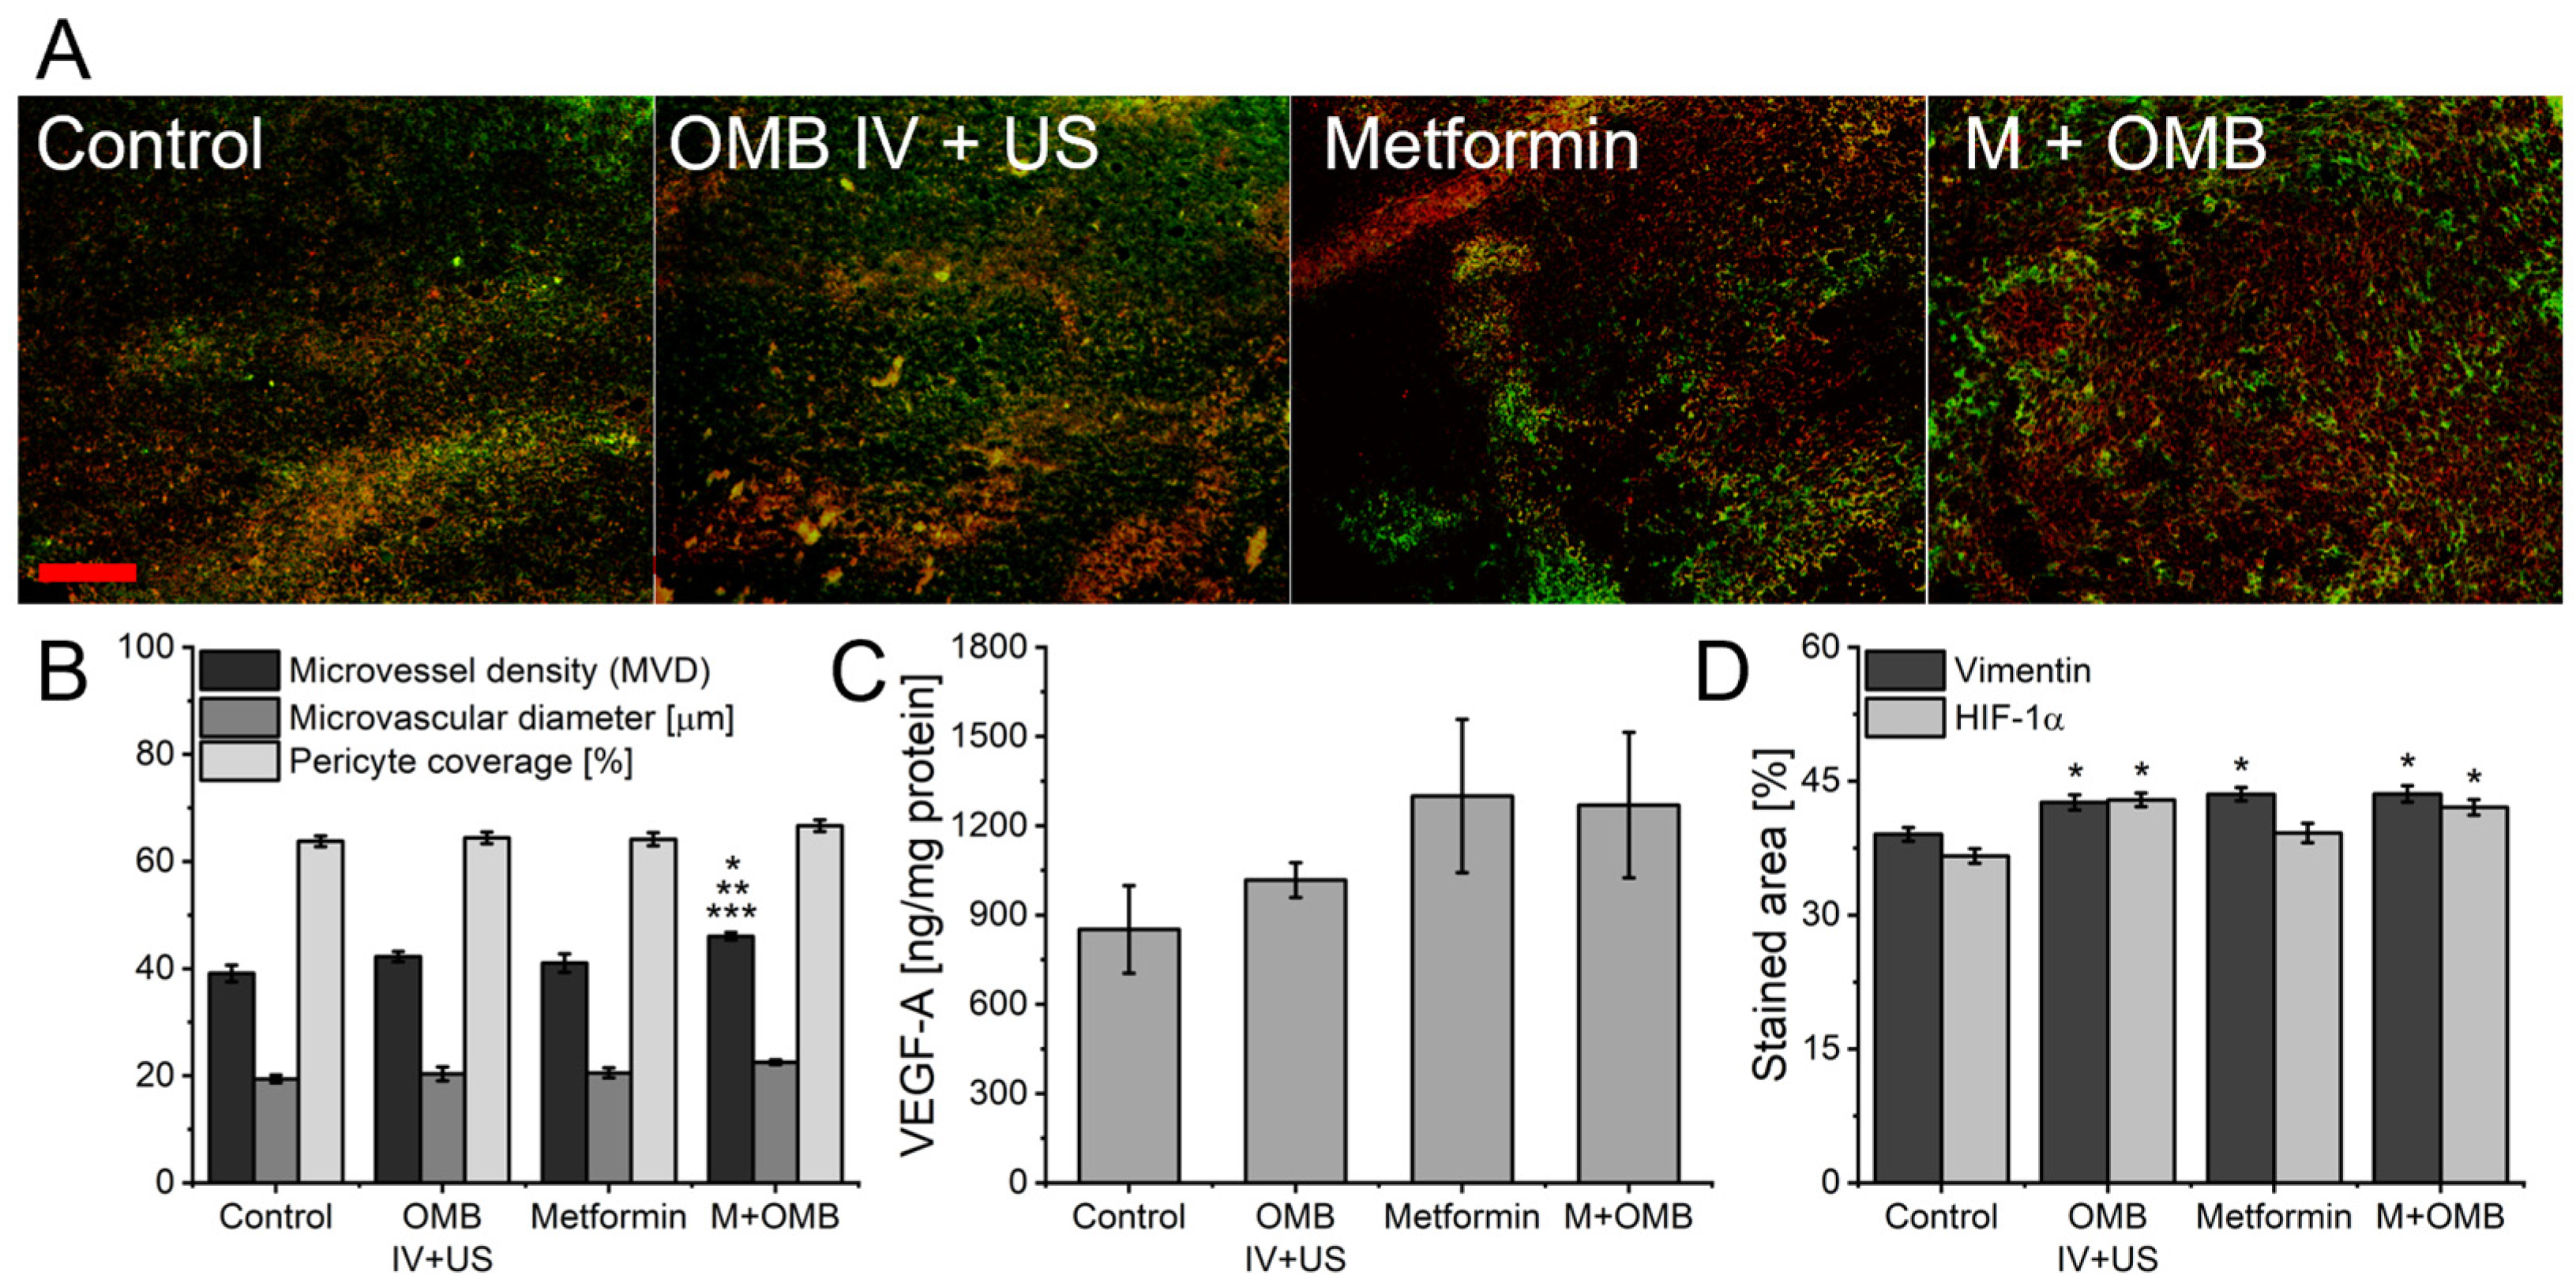
2. Results
3. Discussion
4. Materials and Methods
4.1. Microbubbles Formulation and Disruption
4.2. Animals and Tumor Model
4.3. In Vivo Electron Paramagnetic Resonance (EPR) Measurements
4.4. In Vivo Power Doppler Ultrasonographic Imaging
4.5. Irradiation
4.6. Histology
4.7. Vascular Morphology and Perfusion Assessment
4.8. Ex Vivo Hypoxia and Invasiveness Assessment
4.9. Enzyme-Linked Immunosorbent Assay (ELISA)
4.10. Statistical Analysis
5. Conclusions
Author Contributions
Funding
Institutional Review Board Statement
Informed Consent Statement
Data Availability Statement
Acknowledgments
Conflicts of Interest
References
- Bhandari, V.; Hoey, C.; Liu, L.Y.; Lalonde, E.; Ray, J.; Livingstone, J.; Lesurf, R.; Shiah, Y.J.; Vujcic, T.; Huang, X.; et al. Molecular Landmarks of Tumor Hypoxia across Cancer Types. Nat. Genet. 2019, 51, 308–318. [Google Scholar] [CrossRef] [PubMed]
- Vaupel, P.; Mayer, A. Tumor Hypoxia: Causative Mechanisms, Microregional Heterogeneities, and the Role of Tissue-Based Hypoxia Markers. In Oxygen Transport to Tissue XXXVIII; Luo, Q., Li, L.Z., Harrison, D.K., Shi, H., Bruley, D.F., Eds.; Springer International Publishing: Cham, Switzerland, 2016; pp. 77–86. ISBN 978-3-319-38810-6. [Google Scholar]
- Lugano, R.; Ramachandran, M.; Dimberg, A. Tumor Angiogenesis: Causes, Consequences, Challenges and Opportunities. Cell. Mol. Life Sci. 2020, 77, 1745–1770. [Google Scholar] [CrossRef] [Green Version]
- Kim, J.; DeBerardinis, R.J. Mechanisms and Implications of Metabolic Heterogeneity in Cancer. Cell Metab. 2019, 30, 434–446. [Google Scholar] [CrossRef]
- Tam, S.Y.; Wu, V.W.C.; Law, H.K.W. Hypoxia-Induced Epithelial-Mesenchymal Transition in Cancers: HIF-1α and Beyond. Front. Oncol. 2020, 10, 486. [Google Scholar] [CrossRef] [PubMed]
- Abou Khouzam, R.; Zaarour, R.F.; Brodaczewska, K.; Azakir, B.; Venkatesh, G.H.; Thiery, J.; Terry, S.; Chouaib, S. The Effect of Hypoxia and Hypoxia-Associated Pathways in the Regulation of Antitumor Response: Friends or Foes? Front. Immunol. 2022, 13, 646–653. [Google Scholar] [CrossRef] [PubMed]
- Fu, Z.; Mowday, A.M.; Smaill, J.B.; Hermans, I.F.; Patterson, A.V. Tumour Hypoxia-Mediated Immunosuppression: Mechanisms and Therapeutic Approaches to Improve Cancer Immunotherapy. Cells 2021, 10, 1006. [Google Scholar] [CrossRef]
- Skwarski, M.; Bowler, E.; Wilson, J.D.; Higgins, G.S.; Hammond, E.M. Targeting Tumor Hypoxia. Cancer Drug Discov. Dev. 2020, 265–299. [Google Scholar] [CrossRef]
- Jin, Z.; Zhao, Q.; Yuan, S.; Jiang, W.; Hu, Y. Strategies of Alleviating Tumor Hypoxia and Enhancing Tumor Therapeutic Effect by Macromolecular Nanomaterials. Macromol. Biosci. 2021, 21, 2100092. [Google Scholar] [CrossRef]
- Phung, C.D.; Tran, T.H.; Pham, L.M.; Nguyen, H.T.; Jeong, J.H.; Yong, C.S.; Kim, J.O. Current Developments in Nanotechnology for Improved Cancer Treatment, Focusing on Tumor Hypoxia. J. Control. Release 2020, 324, 413–429. [Google Scholar] [CrossRef]
- Guise, C.P.; Mowday, A.M.; Ashoorzadeh, A.; Yuan, R.; Lin, W.H.; Wu, D.H.; Smaill, J.B.; Patterson, A.V.; Ding, K. Bioreductive Prodrugs as Cancer Therapeutics: Targeting Tumor Hypoxia. Chin. J. Cancer 2014, 33, 80. [Google Scholar] [CrossRef]
- Varzandeh, M.; Sabouri, L.; Mansouri, V.; Gharibshahian, M.; Beheshtizadeh, N.; Hamblin, M.R.; Rezaei, N. Application of Nano-Radiosensitizers in Combination Cancer Therapy. Bioeng. Transl. Med. 2023, 8, e10498. [Google Scholar] [CrossRef] [PubMed]
- Gong, L.; Zhang, Y.; Liu, C.; Zhang, M.; Han, S. Application of Radiosensitizers in Cancer Radiotherapy. Int. J. Nanomed. 2021, 16, 1083. [Google Scholar] [CrossRef] [PubMed]
- Jászai, J.; Schmidt, M.H.H. Trends and Challenges in Tumor Anti-Angiogenic Therapies. Cells 2019, 8, 1102. [Google Scholar] [CrossRef] [PubMed] [Green Version]
- Matuszewska, K.; Pereira, M.; Petrik, D.; Lawler, J.; Petrik, J. Normalizing Tumor Vasculature to Reduce Hypoxia, Enhance Perfusion, and Optimize Therapy Uptake. Cancers 2021, 13, 4444. [Google Scholar] [CrossRef]
- Zhong, S.; Jeong, J.H.; Chen, Z.; Chen, Z.; Luo, J.L. Targeting Tumor Microenvironment by Small-Molecule Inhibitors. Transl. Oncol. 2020, 13, 57–69. [Google Scholar] [CrossRef]
- Ma, Z.; Xiang, X.; Li, S.; Xie, P.; Gong, Q.; Goh, B.C.; Wang, L. Targeting Hypoxia-Inducible Factor-1, for Cancer Treatment: Recent Advances in Developing Small-Molecule Inhibitors from Natural Compounds. Semin. Cancer Biol. 2022, 80, 379–390. [Google Scholar] [CrossRef]
- Toledo, R.A.; Jimenez, C.; Armaiz-Pena, G.; Arenillas, C.; Capdevila, J.; Dahia, P.L.M. Hypoxia-Inducible Factor 2 Alpha (HIF2α) Inhibitors: Targeting Genetically Driven Tumor Hypoxia. Endocr. Rev. 2023, 44, 312–322. [Google Scholar] [CrossRef]
- Ho, Y.J.; Chu, S.W.; Liao, E.C.; Fan, C.H.; Chan, H.L.; Wei, K.C.; Yeh, C.K. Normalization of Tumor Vasculature by Oxygen Microbubbles with Ultrasound. Theranostics 2019, 9, 7370–7383. [Google Scholar] [CrossRef]
- McEwan, C.; Owen, J.; Stride, E.; Fowley, C.; Nesbitt, H.; Cochrane, D.; Coussios, C.C.; Borden, M.; Nomikou, N.; McHale, A.P.; et al. Oxygen Carrying Microbubbles for Enhanced Sonodynamic Therapy of Hypoxic Tumours. J. Control. Release 2015, 203, 51–56. [Google Scholar] [CrossRef]
- Eisenbrey, J.R.; Shraim, R.; Liu, J.-B.; Li, J.; Stanczak, M.; Oeffinger, B.; Leeper, D.B.; Keith, S.W.; Jablonowski, L.J.; Forsberg, F.; et al. Sensitization of Hypoxic Tumors to Radiation Therapy Using Ultrasound-Sensitive Oxygen Microbubbles. Int. J. Radiat. Oncol. Biol. Phys. 2018, 101, 88–96. [Google Scholar] [CrossRef]
- Yang, C.; Xiao, H.; Sun, Y.; Zhu, L.; Gao, Y.; Kwok, S.; Wang, Z.; Tang, Y. Lipid Microbubbles as Ultrasound-Stimulated Oxygen Carriers for Controllable Oxygen Release for Tumor Reoxygenation. Ultrasound Med. Biol. 2018, 44, 416–425. [Google Scholar] [CrossRef]
- Drzał, A.; Delalande, A.; Dziurman, G.; Fournié, M.; Pichon, C.; Elas, M. Increasing Oxygen Tension in Tumor Tissue Using Ultrasound Sensitive O2 Microbubbles. Free Radic. Biol. Med. 2022, 193, 567–578. [Google Scholar] [CrossRef]
- Drzał, A.; Delalande, A.; Dziurman, G.; Pichon, C.; Swakoń, J.; Elas, M. Ultrasound Sensitive O2 Microbubbles Radiosensitize Murine Breast Cancer but Lead to Higher Metastatic Spread. Free Radic. Biol. Med. 2023, 199, 166–176. [Google Scholar] [CrossRef] [PubMed]
- Zhou, Y.; Chen, X.; Cao, J.; Gao, H. Overcoming the Biological Barriers in the Tumor Microenvironment for Improving Drug Delivery and Efficacy. J. Mater. Chem. B 2020, 8, 6765–6781. [Google Scholar] [CrossRef]
- Yang, T.; Xiao, H.; Liu, X.; Wang, Z.; Zhang, Q.; Wei, N.; Guo, X. Vascular Normalization: A New Window Opened for Cancer Therapies. Front. Oncol. 2021, 11, 3130. [Google Scholar] [CrossRef] [PubMed]
- Haibe, Y.; Kreidieh, M.; El Hajj, H.; Khalifeh, I.; Mukherji, D.; Temraz, S.; Shamseddine, A. Resistance Mechanisms to Anti-Angiogenic Therapies in Cancer. Front. Oncol. 2020, 10, 221. [Google Scholar] [CrossRef] [PubMed] [Green Version]
- Nathan, D.M.; Buse, J.B.; Davidson, M.B.; Ferrannini, E.; Holman, R.R.; Sherwin, R.; Zinman, B. Medical Management of Hyperglycemia in Type 2 Diabetes: A Consensus Algorithm for the Initiation and Adjustment of TherapyA Consensus Statement of the American Diabetes Association and the European Association for the Study of Diabetes. Diabetes Care 2009, 32, 193–203. [Google Scholar] [CrossRef] [Green Version]
- Hasanvand, A. The Role of AMPK-Dependent Pathways in Cellular and Molecular Mechanisms of Metformin: A New Perspective for Treatment and Prevention of Diseases. Inflammopharmacology 2022, 30, 775–788. [Google Scholar] [CrossRef]
- Saraei, P.; Asadi, I.; Kakar, M.A.; Moradi-Kor, N. The Beneficial Effects of Metformin on Cancer Prevention and Therapy: A Comprehensive Review of Recent Advances. Cancer Manag. Res. 2019, 11, 3295. [Google Scholar] [CrossRef] [Green Version]
- Ahn, H.K.; Lee, Y.H.; Koo, K.C. Current Status and Application of Metformin for Prostate Cancer: A Comprehensive Review. Int. J. Mol. Sci. 2020, 21, 8540. [Google Scholar] [CrossRef]
- Poli, G.; Cantini, G.; Armignacco, R.; Fucci, R.; Santi, R.; Canu, L.; Nesi, G.; Mannelli, M.; Luconi, M. Metformin as a New Anti-Cancer Drug in Adrenocortical Carcinoma. Oncotarget 2016, 7, 49636. [Google Scholar] [CrossRef] [Green Version]
- Podhorecka, M. Metformin—Its Anti-Cancer Effects in Hematologic Malignancies. Oncol. Rev. 2021, 15, 514. [Google Scholar] [CrossRef] [PubMed]
- Kheirandish, M.; Mahboobi, H.; Yazdanparast, M.; Kamal, W.; Kamal, M.A. Anti-Cancer Effects of Metformin: Recent Evidences for Its Role in Prevention and Treatment of Cancer. Curr. Drug Metab. 2018, 19, 793–797. [Google Scholar] [CrossRef] [PubMed]
- Chevalier, B.; Pasquier, D.; Lartigau, E.F.; Chargari, C.; Schernberg, A.; Jannin, A.; Mirabel, X.; Vantyghem, M.C.; Escande, A. Metformin: (Future) Best Friend of the Radiation Oncologist? Radiother. Oncol. 2020, 151, 95–105. [Google Scholar] [CrossRef]
- Koritzinsky, M. Metformin: A Novel Biological Modifier of Tumor Response to Radiation Therapy. Int. J. Radiat. Oncol. Biol. Phys. 2015, 93, 454–464. [Google Scholar] [CrossRef]
- Kannarkatt, J.; Alkharabsheh, O.; Tokala, H.; Dimitrov, N.V. Metformin and Angiogenesis in Cancer—Revisited. Oncology 2016, 91, 179–184. [Google Scholar] [CrossRef]
- Ren, Y.; Luo, H. Metformin: The next Angiogenesis Panacea? SAGE Open Med. 2021, 9. [Google Scholar] [CrossRef]
- Mäkitie, T.; Summanen, P.; Tarkkanen, A.; Kivelä, T. Microvascular Loops and Networks as Prognostic Indicators in Choroidal and Ciliary Body. J. Natl. Cancer Inst. 1999, 91, 359–367. [Google Scholar] [CrossRef] [PubMed] [Green Version]
- Viallard, C.; Larrivée, B. Tumor Angiogenesis and Vascular Normalization: Alternative Therapeutic Targets. Angiogenesis 2017, 20, 409–426. [Google Scholar] [CrossRef] [PubMed]
- Wu, X.-Y.; Xu, W.-W.; Huan, X.-K.; Wu, G.-n.; Li, G.; Zhou, Y.H.; Najafi, M. Mechanisms of Cancer Cell Killing by Metformin: A Review on Different Cell Death Pathways. Mol. Cell. Biochem. 2022, 478, 197–214. [Google Scholar] [CrossRef]
- Buczyńska, A.; Sidorkiewicz, I.; Krętowski, A.J.; Zbucka-Krętowska, M.; Adamska, A. Metformin Intervention—A Panacea for Cancer Treatment? Cancers 2022, 14, 1336. [Google Scholar] [CrossRef]
- Han, H.; Hou, Y.; Chen, X.; Zhang, P.; Kang, M.; Jin, Q.; Ji, J.; Gao, M. Metformin-Induced Stromal Depletion to Enhance the Penetration of Gemcitabine-Loaded Magnetic Nanoparticles for Pancreatic Cancer Targeted Therapy. J. Am. Chem. Soc. 2020, 142, 4944–4954. [Google Scholar] [CrossRef] [PubMed]
- Triggle, C.R.; Ding, H. Metformin Is Not Just an Antihyperglycaemic Drug but Also Has Protective Effects on the Vascular Endothelium. Acta Physiol. 2017, 219, 138–151. [Google Scholar] [CrossRef]
- Alalem, M. Metformin Treatment Represses Vascular Endothelial Growth Factor Gene Transcription in MCF-7 Breast Cancer Cells. Open Access J. Oncol. Med. 2018, 1. [Google Scholar] [CrossRef]
- Esfahanian, N.; Shakiba, Y.; Nikbin, B.; Soraya, H.; Maleki-Dizaji, N.; Ghazi-Khansari, M.; Garjani, A. Effect of Metformin on the Proliferation, Migration, and MMP-2 and -9 Expression of Human Umbilical Vein Endothelial Cells. Mol. Med. Rep. 2012, 5, 1068–1074. [Google Scholar] [CrossRef] [PubMed] [Green Version]
- Zannella, V.E.; Pra, A.D.; Muaddi, H.; McKee, T.D.; Stapleton, S.; Sykes, J.; Glicksman, R.; Chaib, S.; Zamiara, P.; Milosevic, M.; et al. Reprogramming Metabolism with Metformin Improves Tumor Oxygenation and Radiotherapy Response. Clin. Cancer Res. 2013, 19, 6741–6750. [Google Scholar] [CrossRef] [PubMed] [Green Version]
- Bai, B.; Chen, H. Metformin: A Novel Weapon Against Inflammation. Front. Pharm. 2021, 12, 622262. [Google Scholar] [CrossRef]
- Wang, J.C.; Sun, X.; Ma, Q.; Fu, G.F.; Cong, L.L.; Zhang, H.; Fan, D.F.; Feng, J.; Lu, S.Y.; Liu, J.L.; et al. Metformin’s Antitumour and Anti-Angiogenic Activities Are Mediated by Skewing Macrophage Polarization. J. Cell. Mol. Med. 2018, 22, 3825–3836. [Google Scholar] [CrossRef]
- Wang, G.; Lin, F.; Wan, Q.; Wu, J.; Luo, M. Mechanisms of Action of Metformin and Its Regulatory Effect on MicroRNAs Related to Angiogenesis. Pharm. Res. 2021, 164, 105390. [Google Scholar] [CrossRef]
- Li, G.Y.; Feng, Y.Q.; Jia, Y.F.; Wang, K.F.; Li, Y.; Zhang, S.J.; Han, S.X.; Wang, J.C. Metformin Enhances T Lymphocyte Anti-Tumor Immunity by Increasing the Infiltration via Vessel Normalization. Eur. J. Pharm. 2023, 944, 175592. [Google Scholar] [CrossRef]
- Cha, J.H.; Yang, W.H.; Xia, W.; Wei, Y.; Chan, L.C.; Lim, S.O.; Li, C.W.; Kim, T.; Chang, S.S.; Lee, H.H.; et al. Metformin Promotes Antitumor Immunity via Endoplasmic-Reticulum-Associated Degradation of PD-L1. Mol. Cell 2018, 71, 606–620.e7. [Google Scholar] [CrossRef] [PubMed] [Green Version]
- Zhou, Z.; Liu, Y.; Jiang, X.; Zheng, C.; Luo, W.; Xiang, X.; Qi, X.; Shen, J. Metformin Modified Chitosan as a Multi-Functional Adjuvant to Enhance Cisplatin-Based Tumor Chemotherapy Efficacy. Int. J. Biol. Macromol. 2023, 224, 797–809. [Google Scholar] [CrossRef] [PubMed]
- Kim, S.-H.; Kim, S.-C.; Ku, J.-L.; Kim, S.-H.; Kim, S.-C.; Ku, J.-L. Metformin Increases Chemo-Sensitivity via Gene Downregulation Encoding DNA Replication Proteins in 5-Fu Resistant Colorectal Cancer Cells. Oncotarget 2017, 8, 56546–56557. [Google Scholar] [CrossRef] [PubMed] [Green Version]
- Jain, R.K.; Duda, D.G.; Willett, C.G.; Sahani, D.V.; Zhu, A.X.; Loeffler, J.S.; Batchelor, T.T.; Sorensen, A.G. Biomarkers of Response and Resistance to Antiangiogenic Therapy. Nat. Rev. Clin. Oncol. 2009, 6, 327–338. [Google Scholar] [CrossRef]
- Bergers, G.; Hanahan, D. Modes of Resistance to Anti-Angiogenic Therapy. Nat. Rev. Cancer 2008, 8, 592–603. [Google Scholar] [CrossRef] [Green Version]
- El Alaoui-Lasmaili, K.; Faivre, B. Antiangiogenic Therapy: Markers of Response, “Normalization” and Resistance. Crit. Rev. Oncol. Hematol. 2018, 128, 118–129. [Google Scholar] [CrossRef] [PubMed]
- Jahangiri, A.; De Lay, M.; Miller, L.M.; Shawn Carbonell, W.; Hu, Y.L.; Lu, K.; Tom, M.W.; Paquette, J.; Tokuyasu, T.A.; Tsao, S.; et al. Gene Expression Profile Identifies Tyrosine Kinase C-Met as a Targetable Mediator of Anti-Angiogenic Therapy Resistance. Clin. Cancer Res. 2013, 19, 1773. [Google Scholar] [CrossRef] [Green Version]
- Liang, J.; Piao, Y.; Holmes, L.; Fuller, G.N.; Henry, V.; Tiao, N.; De Groot, J.F. Neutrophils Promote the Malignant Glioma Phenotype through S100A4. Clin. Cancer Res. 2014, 20, 187–198. [Google Scholar] [CrossRef] [Green Version]
- Martin, J.D.; Seano, G.; Jain, R.K. Normalizing Function of Tumor Vessels: Progress, Opportunities, and Challenges. 114700 Annu. Rev. 2019, 81, 505–534. [Google Scholar] [CrossRef]
- Kamarudin, M.N.A.; Sarker, M.M.R.; Zhou, J.R.; Parhar, I. Metformin in Colorectal Cancer: Molecular Mechanism, Preclinical and Clinical Aspects. J. Exp. Clin. Cancer Res. 2019, 38, 491. [Google Scholar] [CrossRef] [Green Version]
- Mallik, R.; Chowdhury, T.A. Metformin in Cancer. Diabetes Res. Clin. Pr. 2018, 143, 409–419. [Google Scholar] [CrossRef]
- Amin, S.; Lux, A.; O’Callaghan, F. The Journey of Metformin from Glycaemic Control to MTOR Inhibition and the Suppression of Tumour Growth. Br. J. Clin. Pharm. 2019, 85, 37–46. [Google Scholar] [CrossRef] [Green Version]
- Kurelac, I.; Umesh Ganesh, N.; Iorio, M.; Porcelli, A.M.; Gasparre, G. The Multifaceted Effects of Metformin on Tumor Microenvironment. Semin. Cell Dev. Biol. 2020, 98, 90–97. [Google Scholar] [CrossRef] [PubMed]
- De Bruycker, S.; Vangestel, C.; Staelens, S.; Wyffels, L.; Detrez, J.; Verschuuren, M.; De Vos, W.H.; Pauwels, P.; Van den Wyngaert, T.; Stroobants, S. Effects of Metformin on Tumor Hypoxia and Radiotherapy Efficacy: A [18F]HX4 PET Imaging Study in Colorectal Cancer Xenografts. EJNMMI Res. 2019, 9, 74. [Google Scholar] [CrossRef]
- Zhou, X.; Chen, J.; Yi, G.; Deng, M.; Liu, H.; Liang, M.; Shi, B.; Fu, X.; Chen, Y.; Chen, L.; et al. Metformin Suppresses Hypoxia-Induced Stabilization of HIF-1α through Reprogramming of Oxygen Metabolism in Hepatocellular Carcinoma. Oncotarget 2016, 7, 873. [Google Scholar] [CrossRef] [Green Version]
- Ye, J.; Chen, K.; Qi, L.; Li, R.; Tang, H.; Zhou, C.; Zhai, W. Metformin Suppresses Hypoxia-Induced Migration via the HIF-1α/VEGF Pathway in Gallbladder Cancer in Vitro and in Vivo. Oncol. Rep. 2018, 40, 3501–3510. [Google Scholar] [CrossRef] [PubMed] [Green Version]
- Goda, F.; O’Hara, J.A.; Liu, K.J.; Rhodes, E.S.; Dunn, J.F.; Swartz, H.M. Comparisons of Measurements of PO2 in Tissue In Vivo by EPR Oximetry and Micro-Electrodes. In Oxygen Transport to Tissue XVIII; Nemoto, E.M., Ed.; Advances in Experimental Medicine and Biology; Springer: Boston, MA, USA, 1997; pp. 543–549. [Google Scholar]
- Gallez, B. The Role of Imaging Biomarkers to Guide Pharmacological Interventions Targeting Tumor Hypoxia. Front Pharm. 2022, 13, 2725. [Google Scholar] [CrossRef]
- Khan, N.; Williams, B.B.; Hou, H.; Li, H.; Swartz, H.M. Repetitive Tissue PO2 Measurements by Electron Paramagnetic Resonance Oximetry: Current Status and Future Potential for Experimental and Clinical Studies. Antioxid. Redox Signal. 2007, 9, 1169–1182. [Google Scholar] [CrossRef] [PubMed] [Green Version]
- Ahmad, R.; Kuppusamy, P. Theory, Instrumentation, and Applications of Electron Paramagnetic Resonance Oximetry. Chem. Rev. 2010, 110, 3212–3236. [Google Scholar] [CrossRef] [Green Version]
- Mouron, S.; Bueno, M.J.; Muñoz, M.; Quintela-Fandino, M. Monitoring Vascular Normalization: New Opportunities for Mitochondrial Inhibitors in Breast Cancer. Oncoscience 2021, 8, 1. [Google Scholar] [CrossRef]
- Moeller, B.J.; Richardson, R.A.; Dewhirst, M.W. Hypoxia and Radiotherapy: Opportunities for Improved Outcomes in Cancer Treatment. Cancer Metastasis Rev. 2007, 26, 241–248. [Google Scholar] [CrossRef] [PubMed]
- Martin, J.D.; Jain, R.K. Normalizing the Tumor Microenvironment for Radiosensitization. Cancer Drug Discov. Dev. 2020, 301–338. [Google Scholar] [CrossRef]
- Zhou, Z.; Chen, J.; Liu, Y.; Zheng, C.; Luo, W.; Chen, L.; Zhou, S.; Li, Z.; Shen, J. Cascade Two-Stage Tumor Re-Oxygenation and Immune Re-Sensitization Mediated by Self-Assembled Albumin-Sorafenib Nanoparticles for Enhanced Photodynamic Immunotherapy. Acta Pharm. Sin. B 2022, 12, 4204. [Google Scholar] [CrossRef] [PubMed]
- Joiner, M.C.; van der Kogel, A.J. Basic Clinical Radiobiology, 5th ed.; Joiner, M.C., van der Kogel, A.J., Eds.; CRC Press: Boca Raton, FL, USA, 2018; ISBN 9780429490606. [Google Scholar]
- Chen, Y.C.; Li, H.; Wang, J. Mechanisms of Metformin Inhibiting Cancer Invasion and Migration. Am. J. Transl. Res. 2020, 12, 4885. [Google Scholar]
- Rankin, E.B.; Giaccia, A.J. Hypoxic Control of Metastasis. Science 2016, 352, 175–180. [Google Scholar] [CrossRef] [PubMed] [Green Version]
- Zhang, T.; Suo, C.; Zheng, C.; Zhang, H. Hypoxia and Metabolism in Metastasis. In Hypoxia Cancer Metastasis; Springer: Cham, Switzerland, 2019; pp. 87–95. [Google Scholar]
- Meenakshisundaram, G.; Eteshola, E.; Pandian, R.P.; Bratasz, A.; Selvendiran, K.; Lee, S.C.; Krishna, M.C.; Swartz, H.M.; Kuppusamy, P. Oxygen Sensitivity and Biocompatibility of an Implantable Paramagnetic Probe for Repeated Measurements of Tissue Oxygenation. Biomed. Microdevices 2009, 11, 817–826. [Google Scholar] [CrossRef] [Green Version]
- Eteshola, E.; Pandian, R.P.; Lee, S.C.; Kuppusamy, P. Polymer Coating of Paramagnetic Particulates for in Vivo Oxygen-Sensing Applications. Biomed. Microdevices 2009, 11, 379–387. [Google Scholar] [CrossRef] [PubMed] [Green Version]
- Wu, Z.; Zhang, B.; Yang, J.; Li, N.; Zhou, S. Segmentation of Arteriovenous Malformation Based on Weighted Breadth-First Search of Vascular Skeleton. In Medical Image Understanding and Analysis; Springer: Cham, Switzerland, 2020; pp. 294–301. [Google Scholar] [CrossRef]
- Otsu, N. Threshold selection method from gray-level histograms. IEEE Trans. Syst. Man. Cybern. 1979, SMC-9, 62–66. [Google Scholar] [CrossRef] [Green Version]


Disclaimer/Publisher’s Note: The statements, opinions and data contained in all publications are solely those of the individual author(s) and contributor(s) and not of MDPI and/or the editor(s). MDPI and/or the editor(s) disclaim responsibility for any injury to people or property resulting from any ideas, methods, instructions or products referred to in the content. |
© 2023 by the authors. Licensee MDPI, Basel, Switzerland. This article is an open access article distributed under the terms and conditions of the Creative Commons Attribution (CC BY) license (https://creativecommons.org/licenses/by/4.0/).
Share and Cite
Drzał, A.; Dziurman, G.; Hoła, P.; Lechowski, J.; Delalande, A.; Swakoń, J.; Pichon, C.; Elas, M. Murine Breast Cancer Radiosensitization Using Oxygen Microbubbles and Metformin: Vessels Are the Key. Int. J. Mol. Sci. 2023, 24, 12156. https://doi.org/10.3390/ijms241512156
Drzał A, Dziurman G, Hoła P, Lechowski J, Delalande A, Swakoń J, Pichon C, Elas M. Murine Breast Cancer Radiosensitization Using Oxygen Microbubbles and Metformin: Vessels Are the Key. International Journal of Molecular Sciences. 2023; 24(15):12156. https://doi.org/10.3390/ijms241512156
Chicago/Turabian StyleDrzał, Agnieszka, Gabriela Dziurman, Paweł Hoła, Jakub Lechowski, Anthony Delalande, Jan Swakoń, Chantal Pichon, and Martyna Elas. 2023. "Murine Breast Cancer Radiosensitization Using Oxygen Microbubbles and Metformin: Vessels Are the Key" International Journal of Molecular Sciences 24, no. 15: 12156. https://doi.org/10.3390/ijms241512156