
Correlation of the High-Resolution Computed Tomography Patterns of Intrathoracic Sarcoidosis with Serum Levels of SAA, CA 15.3, SP-D, and Other Biomarkers of Interstitial Lung Disease
 , , and
Abstract
:1. Introduction
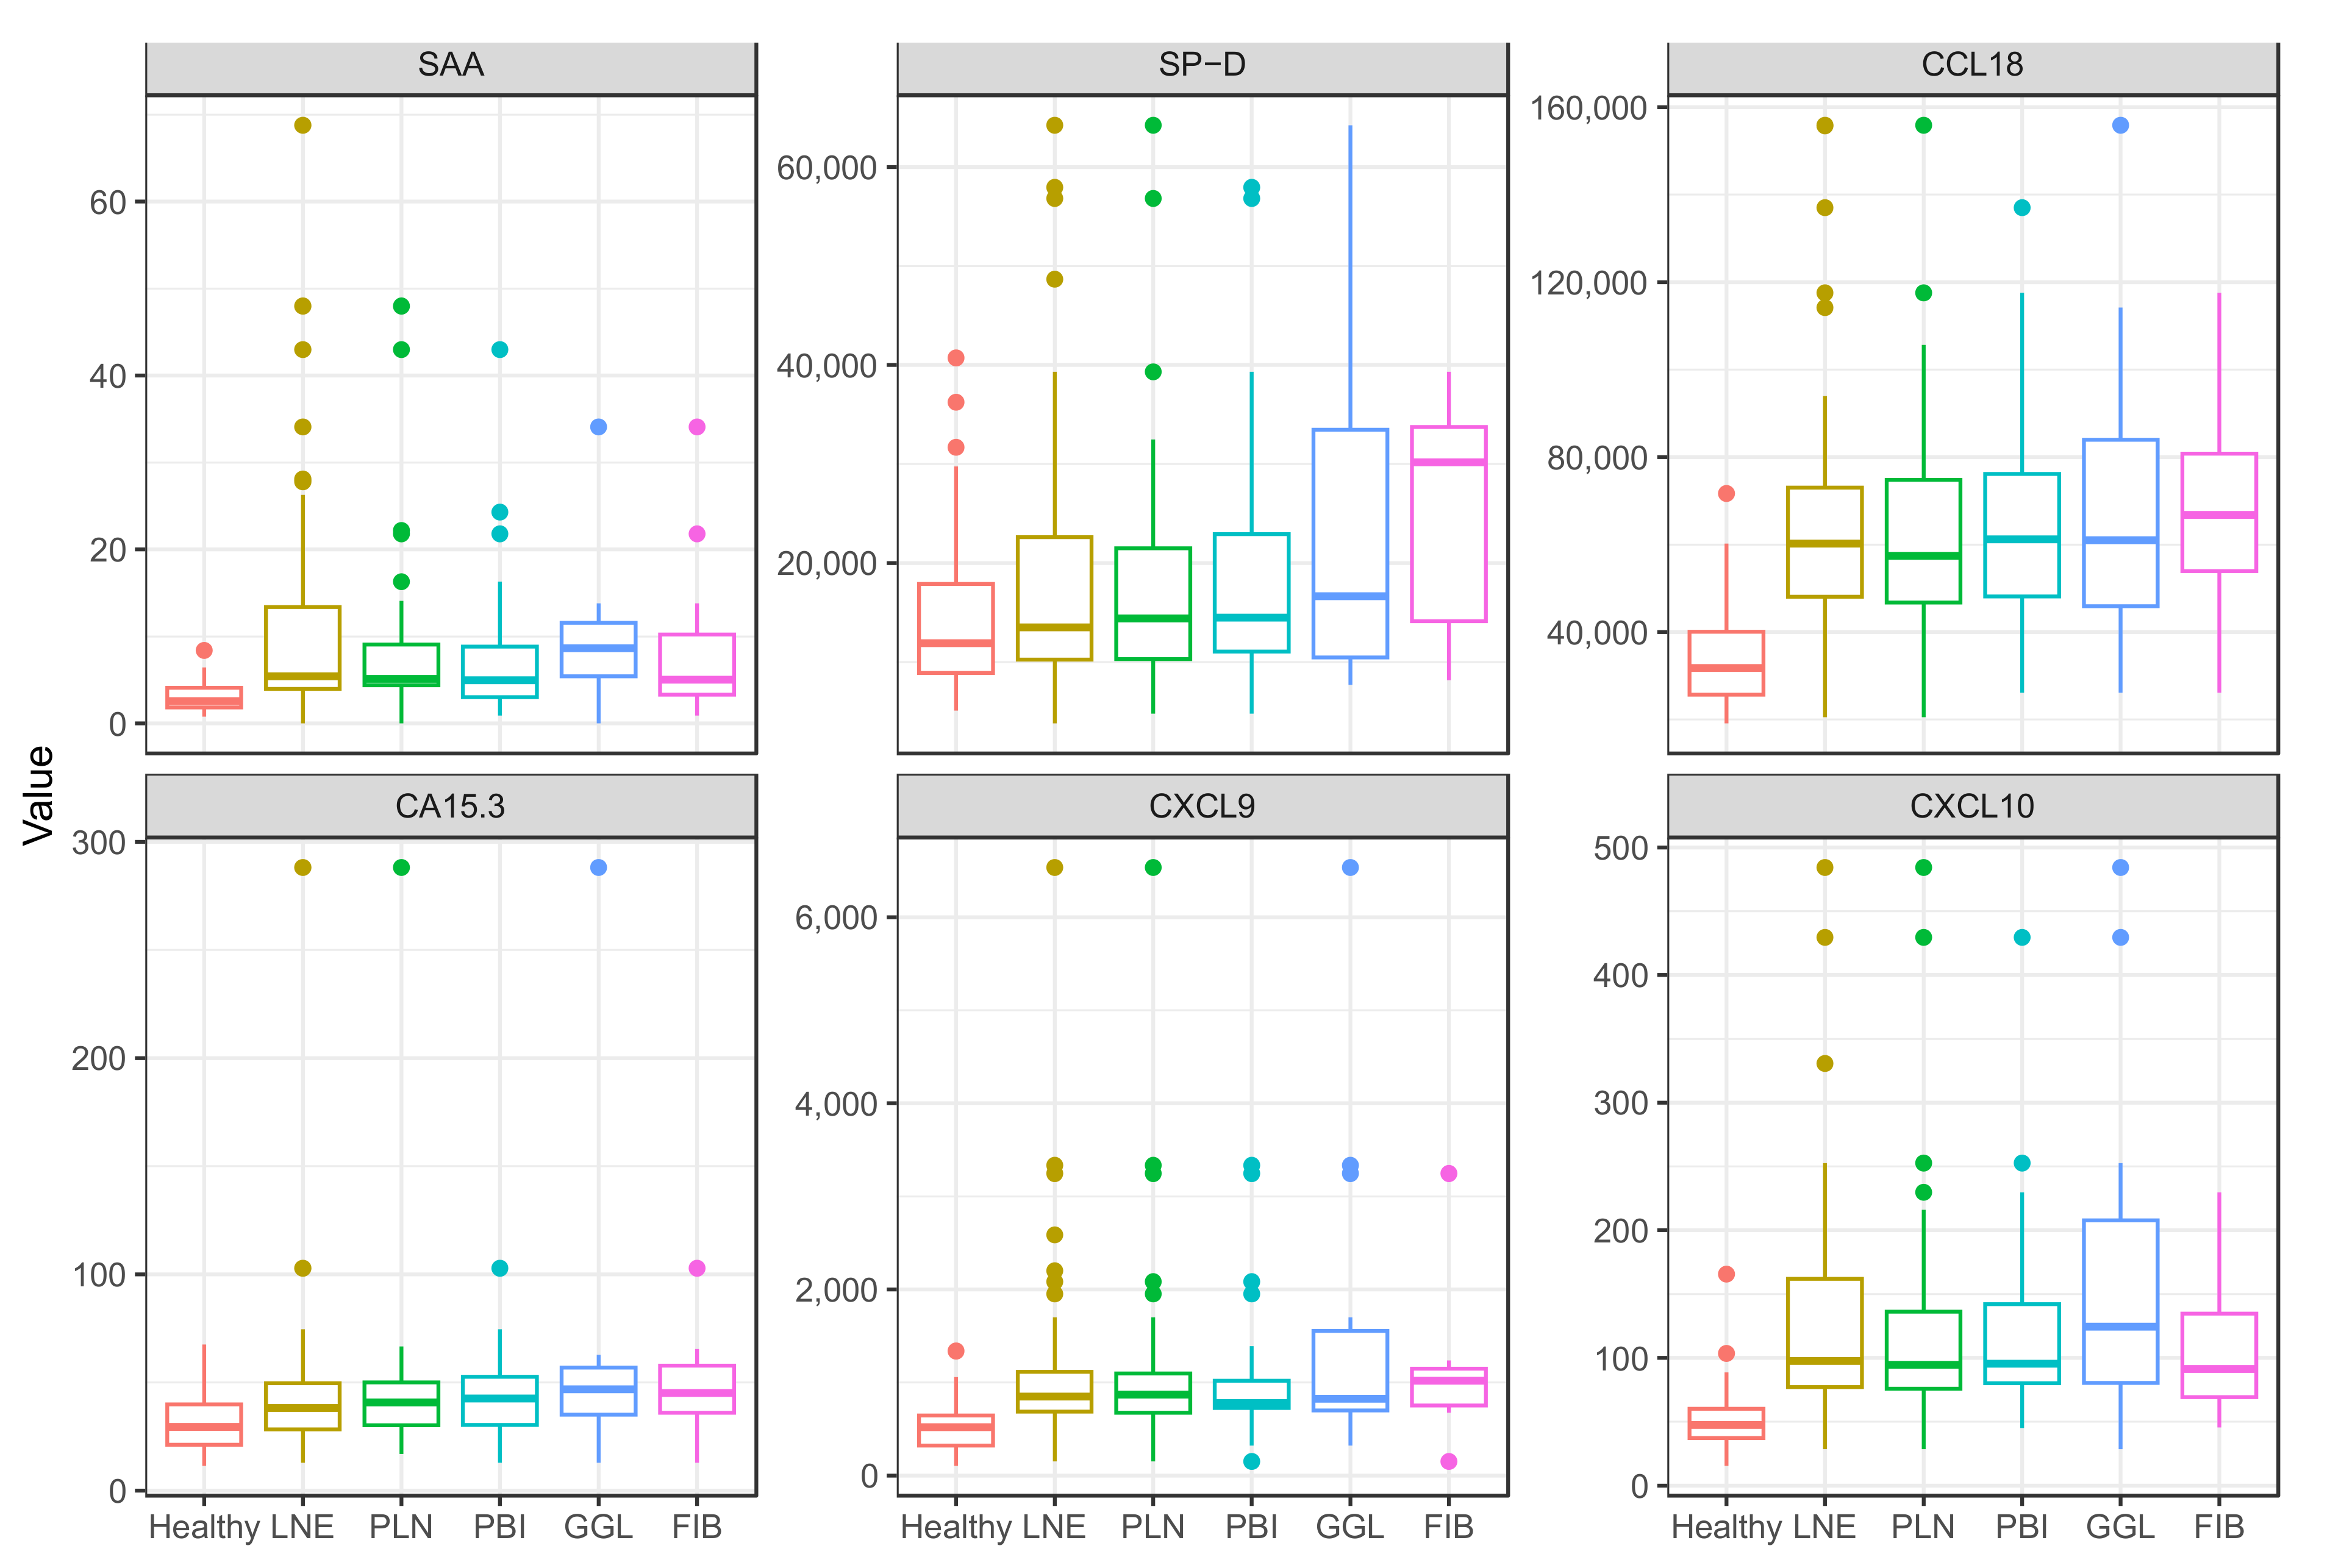
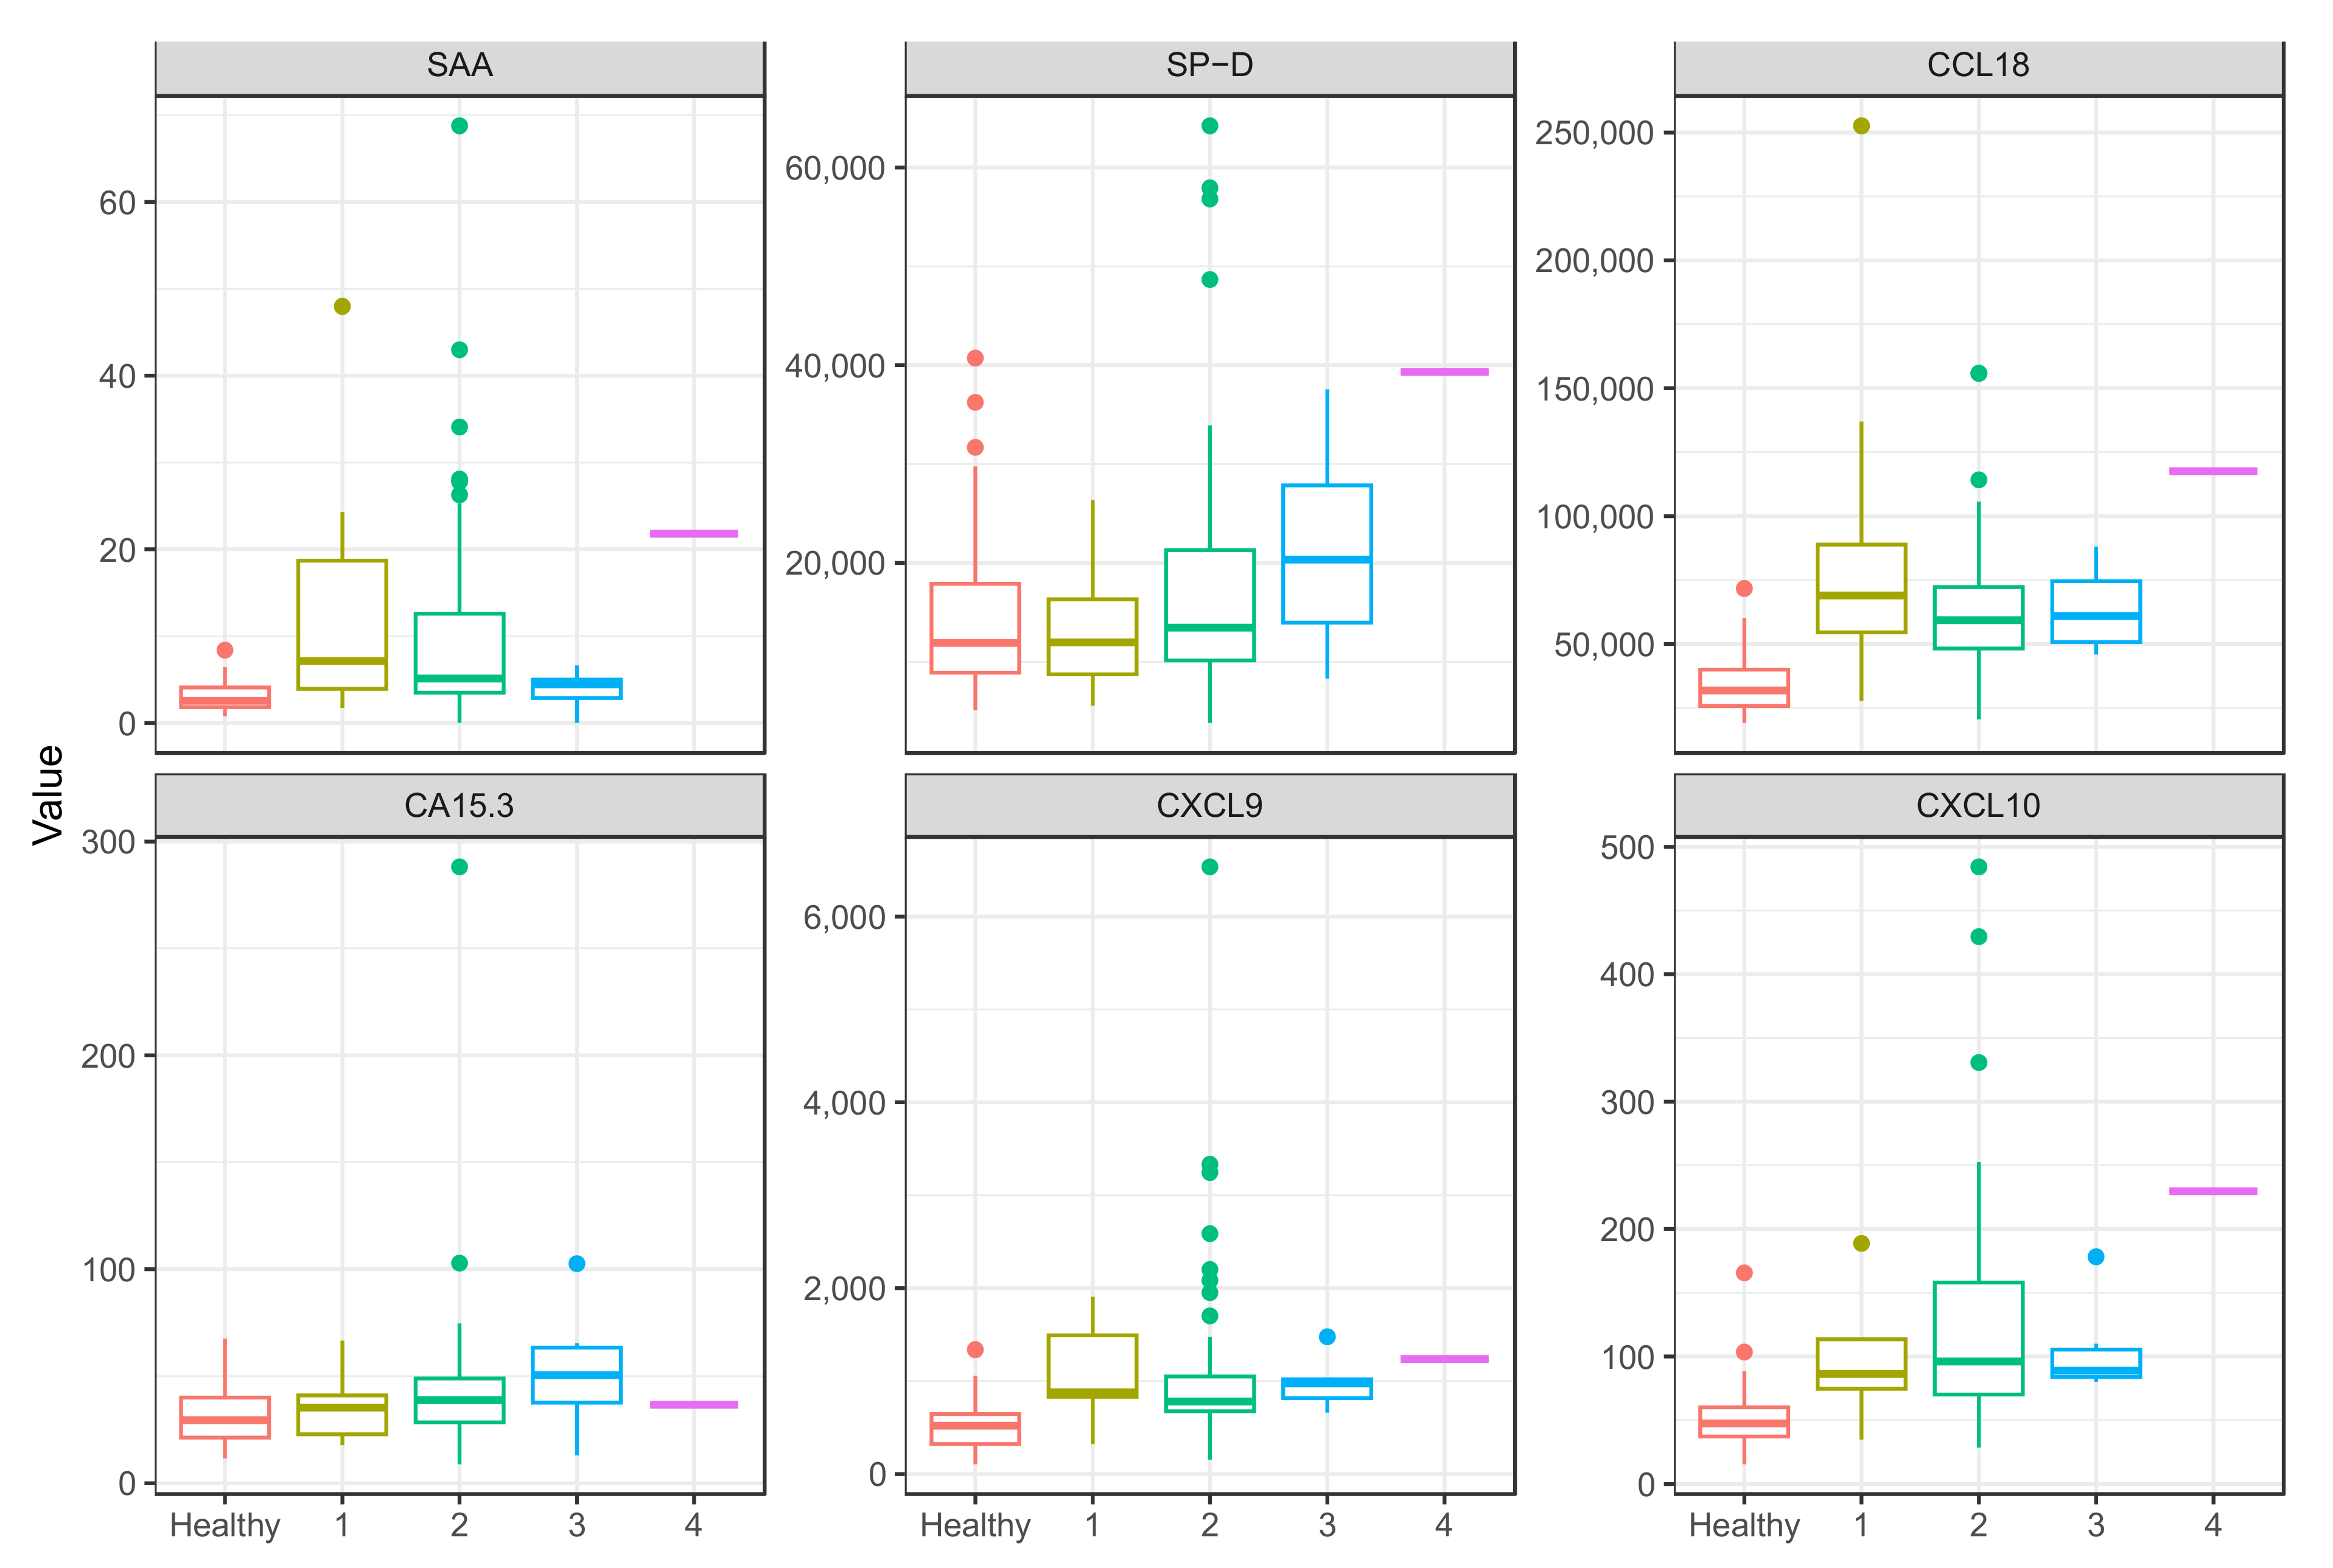
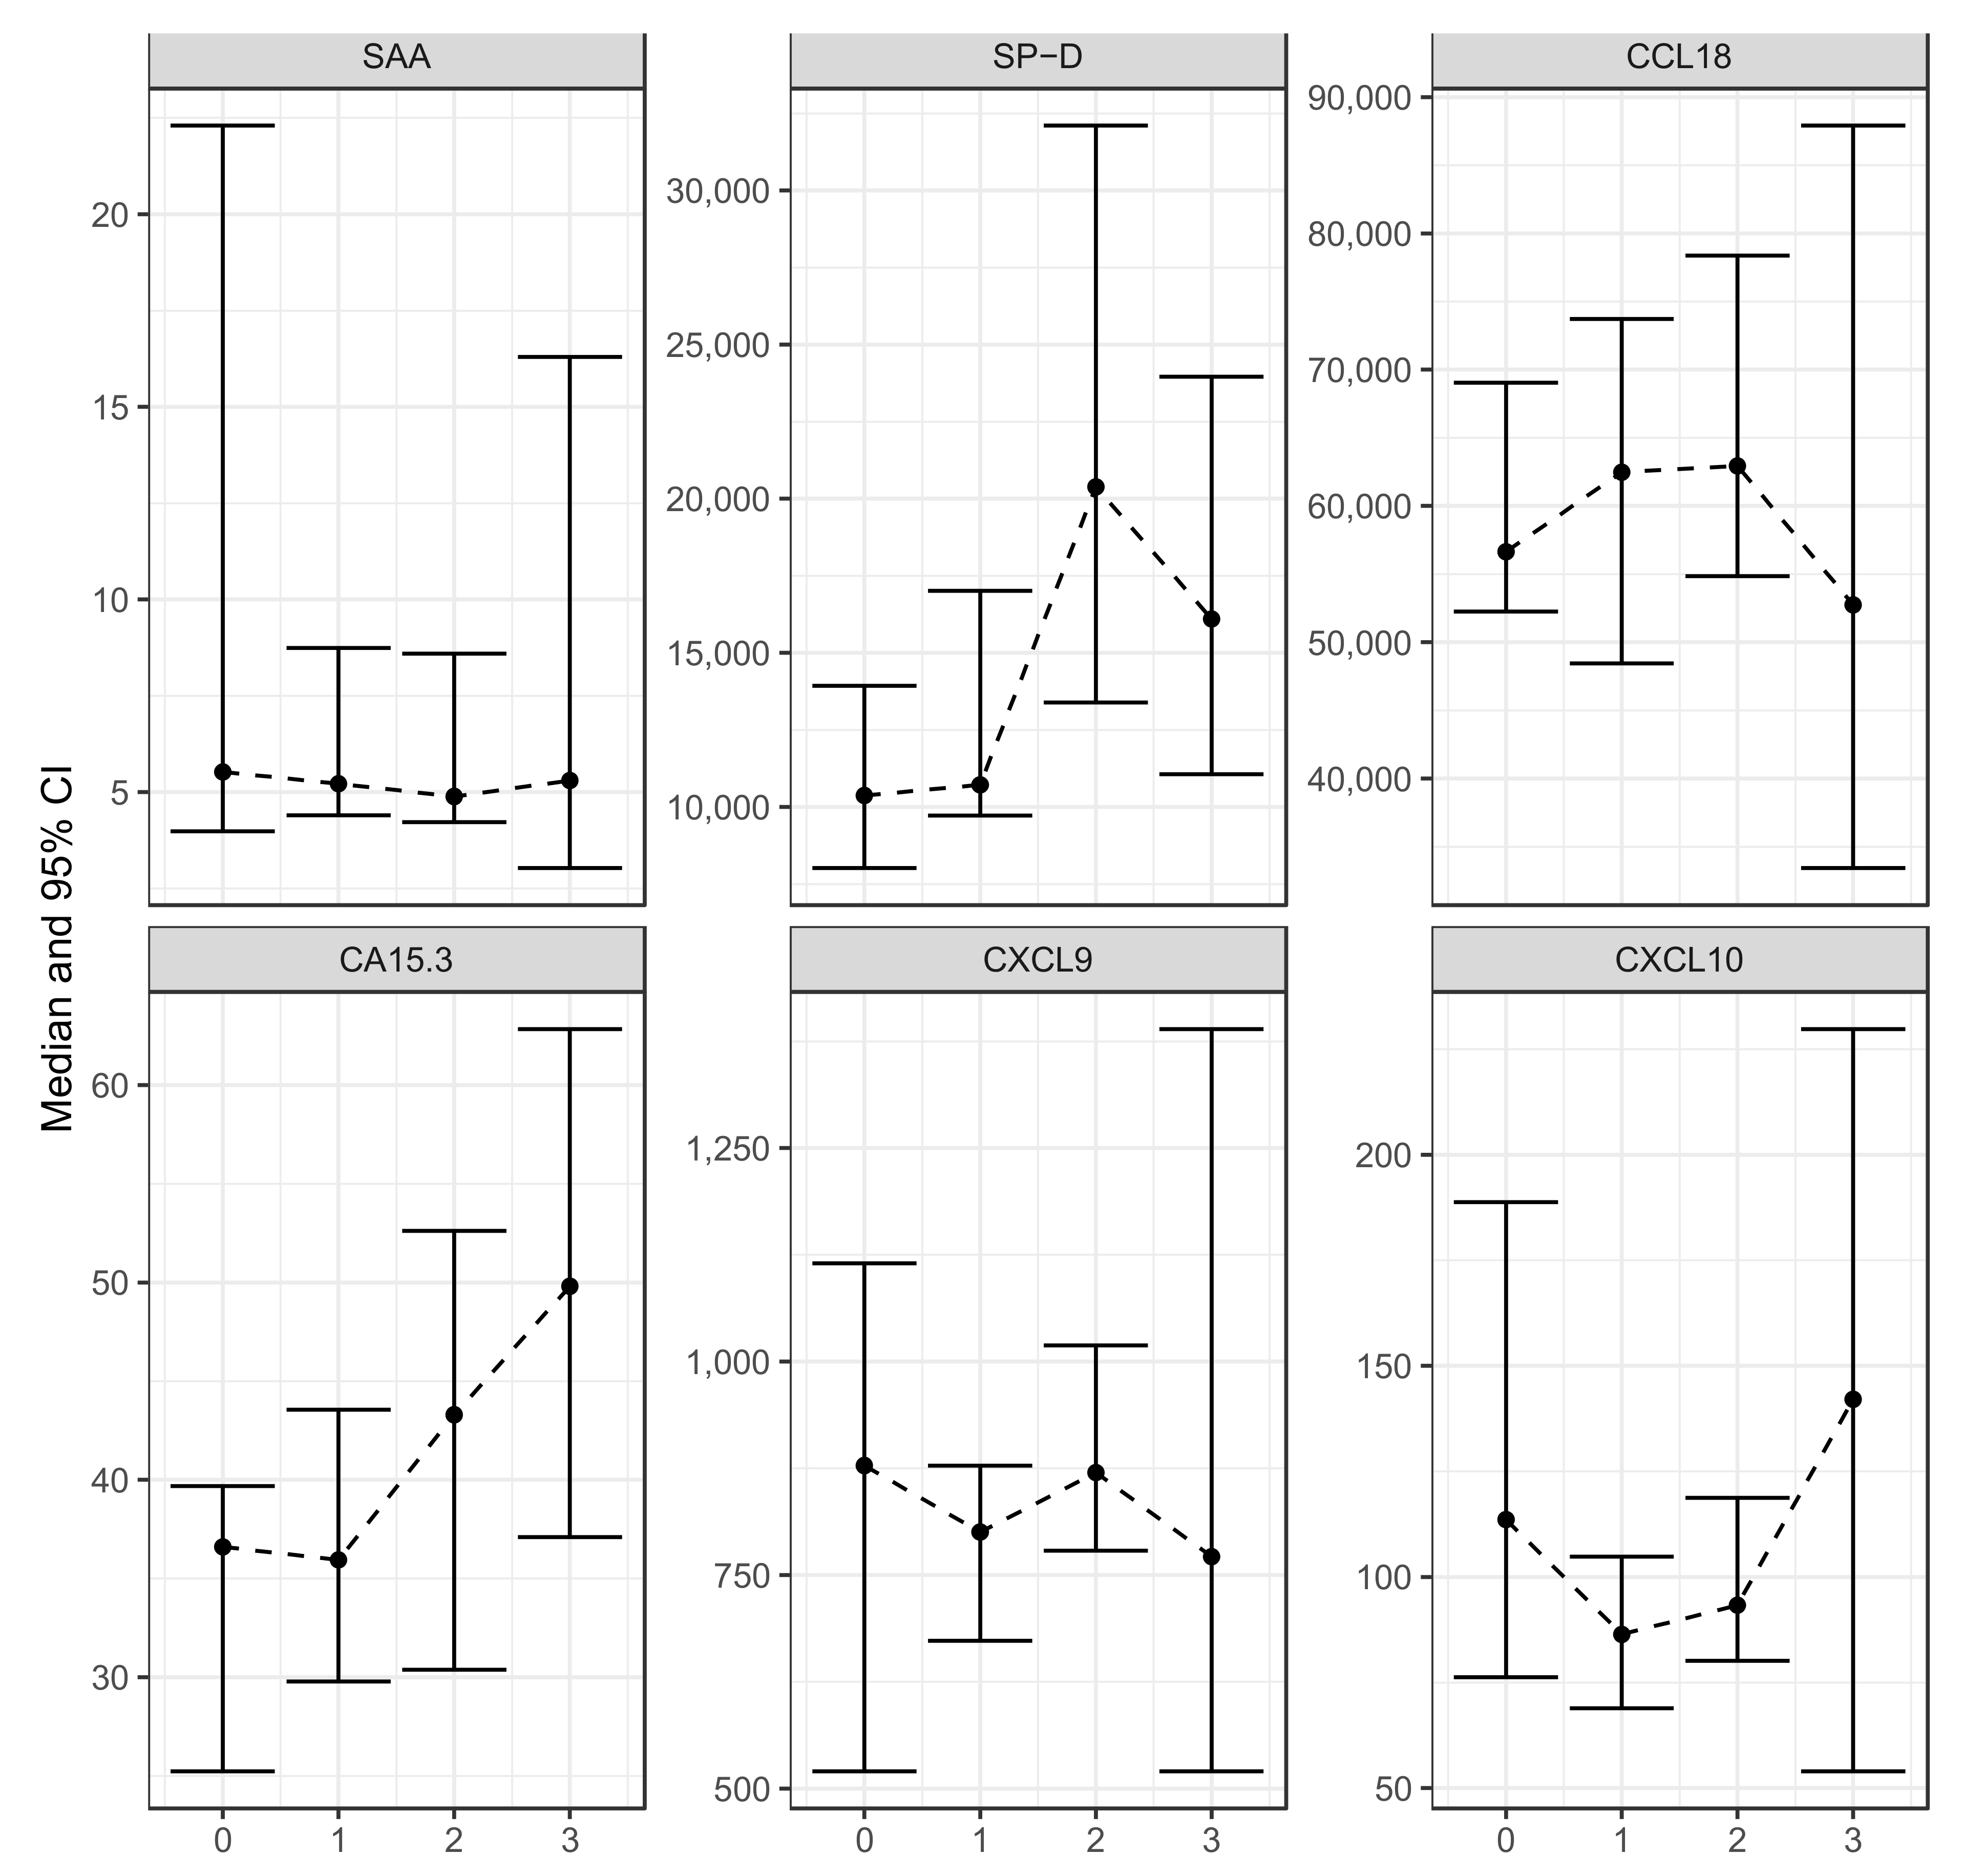
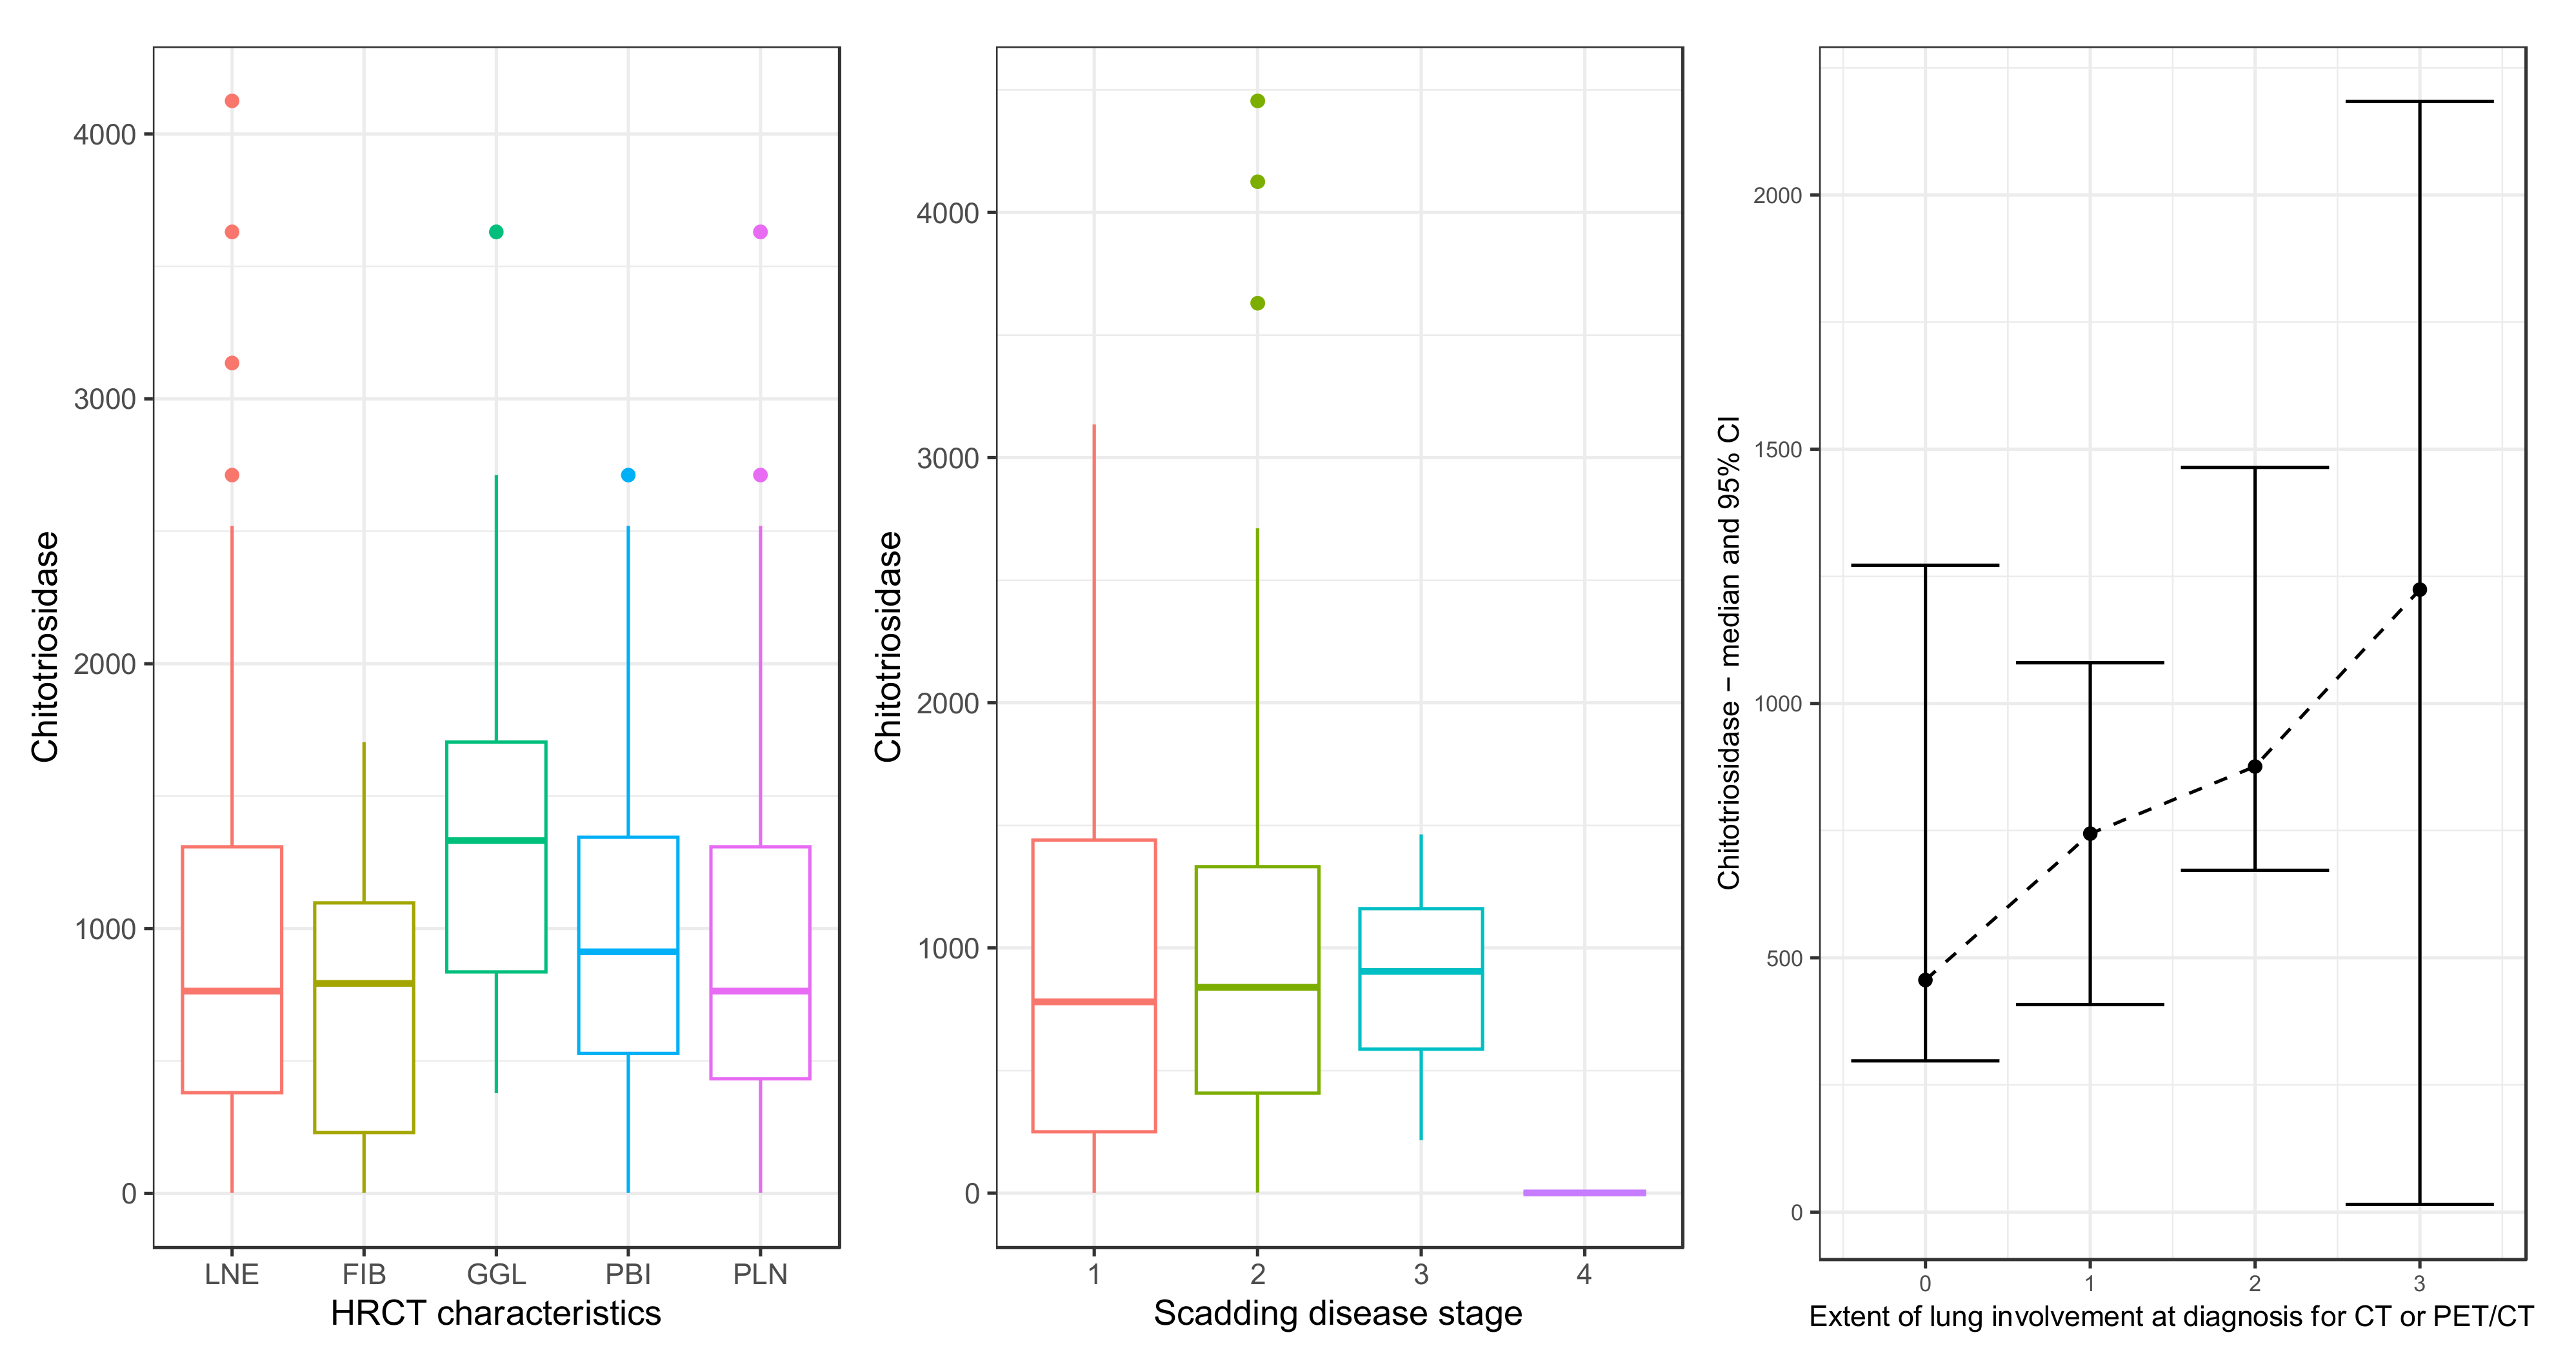
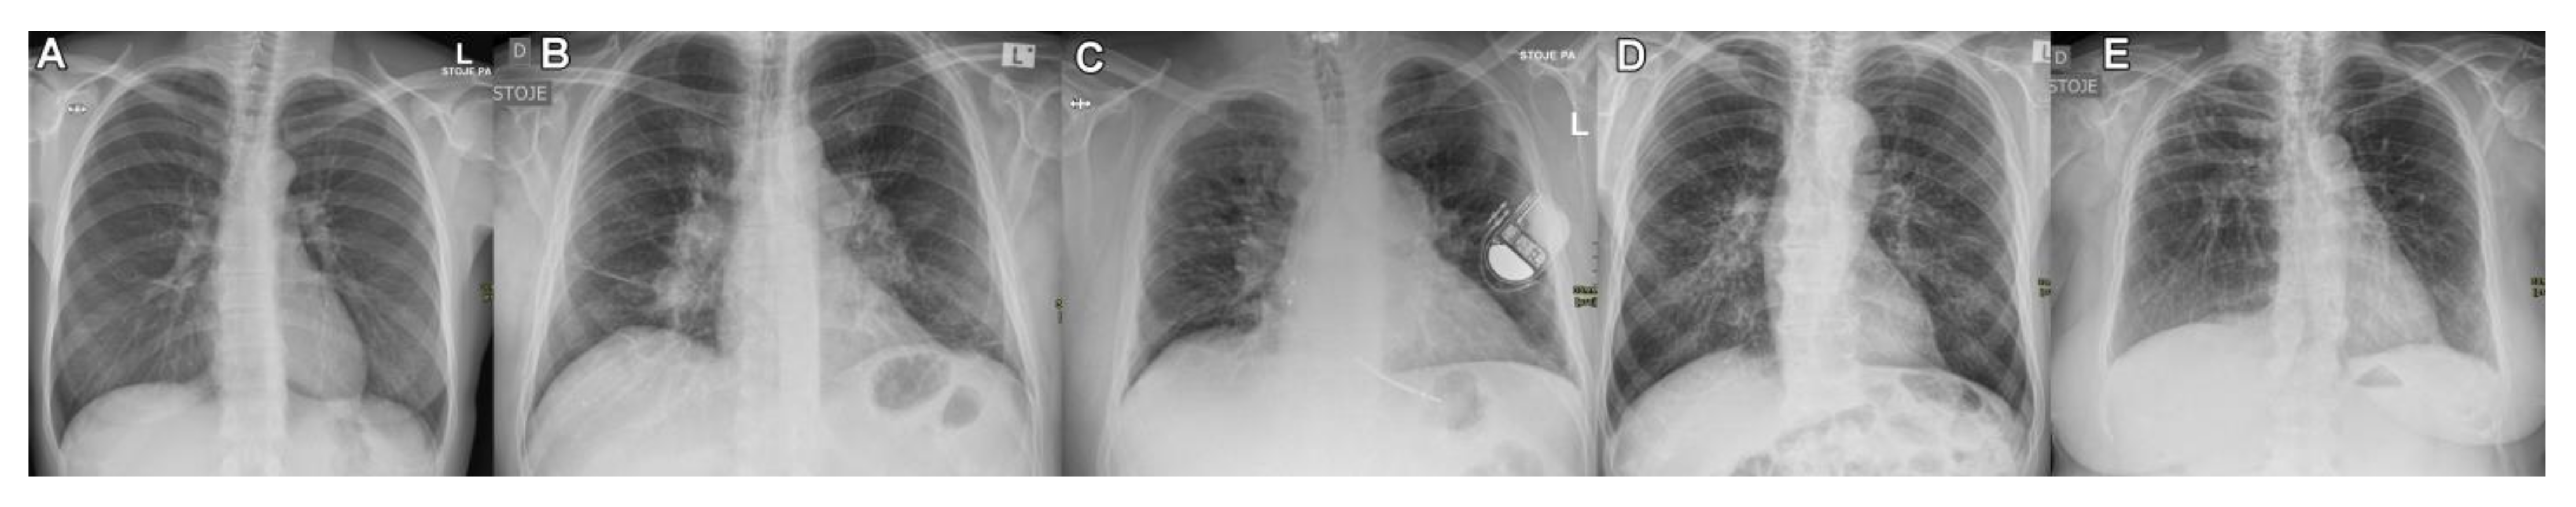
2. Results
3. Discussion
4. Materials and Methods
4.1. Participants
4.2. Chest Radiograph in Two Projections and Staging by Scadding
4.3. Thoracic HRCT
4.4. Serum Samples
4.4.1. Multiplex Biomarker Analysis Procedure
4.4.2. Other Measurements
4.5. Statistical Analysis
5. Conclusions
Supplementary Materials
Author Contributions
Funding
Institutional Review Board Statement
Informed Consent Statement
Data Availability Statement
Acknowledgments
Conflicts of Interest
References
- Ruaro, B.; Confalonieri, P.; Santagiuliana, M.; Wade, B.; Baratella, E.; Kodric, M.; Berria, M.; Jaber, M.; Torregiani, C.; Bruni, C.; et al. Correlation between Potential Risk Factors and Pulmonary Embolism in Sarcoidosis Patients Timely Treated. J. Clin. Med. 2021, 10, 2462. [Google Scholar] [CrossRef] [PubMed]
- Sève, P.; Pacheco, Y.; Durupt, F.; Jamilloux, Y.; Gerfaud-Valentin, M.; Isaac, S.; Boussel, L.; Calender, A.; Androdias, G.; Valeyre, D.; et al. Sarcoidosis: A Clinical Overview from Symptoms to Diagnosis. Cells 2021, 10, 766. [Google Scholar] [CrossRef] [PubMed]
- Iannuzzi, M.C.; Rybicki, B.A.; Teirstein, A.S. Sarcoidosis. N. Engl. J. Med. 2007, 357, 2153–2165. [Google Scholar] [CrossRef] [PubMed]
- Hutchinson, J. Statement on Sarcoidosis. Joint Statement of the American Thoracic Society (ATS), the European Respiratory Society (ERS) and the World Association of Sarcoidosis and Other Granulomatous Disorders (WASOG) adopted by the ATS Board of Directors and by the ERS Executive Committee, February 1999. Am. J. Respir. Crit. Care Med. 1999, 160, 736–755. [Google Scholar] [CrossRef]
- Bargagli, E.; Prasse, A. Sarcoidosis: A review for the internist. Intern. Emerg. Med. 2018, 13, 325–331. [Google Scholar] [CrossRef]
- Crouser, E.D.; Maier, L.A.; Wilson, K.C.; Bonham, C.A.; Morgenthau, A.S.; Patterson, K.C.; Abston, E.; Bernstein, R.C.; Blankstein, R.; Chen, E.S.; et al. Diagnosis and Detection of Sarcoidosis. An Official American Thoracic Society Clinical Practice Guideline. Am. J. Respir. Crit. Care Med. 2020, 201, e26–e51. [Google Scholar] [CrossRef]
- Ruaro, B.; Confalonieri, P.; Torregiani, C.; Pichierri, S.; Salton, F. Risk factor of pulmonary embolism in sarcoidosis patients: A pilot study. Eur. Respir. J. 2022, 60, 315. [Google Scholar] [CrossRef]
- Wessendorf, T.E.; Bonella, F.; Costabel, U. Diagnosis of Sarcoidosis. Clin. Rev. Allergy Immunol. 2015, 49, 54–62. [Google Scholar] [CrossRef]
- Spagnolo, P.; Rossi, G.; Trisolini, R.; Sverzellati, N.; Baughman, R.P.; Wells, A.U. Pulmonary sarcoidosis. Lancet Respir. Med. 2018, 6, 389–402. [Google Scholar] [CrossRef]
- Kouranos, V.; Wells, A.; Walsh, S. Why do people die from pulmonary sarcoidosis? Curr. Opin. Pulm. Med. 2018, 24, 527–535. [Google Scholar] [CrossRef]
- Bennett, D.; Bargagli, E.; Refini, R.M.; Rottoli, P. New concepts in the pathogenesis of sarcoidosis. Expert Rev. Respir. Med. 2019, 13, 981–991. [Google Scholar] [CrossRef]
- Hillerdal, G.; Nöu, E.; Osterman, K.; Schmekel, B. Sarcoidosis: Epidemiology and prognosis. A 15-year European study. Am. Rev. Respir. Dis. 1984, 130, 29–32. [Google Scholar] [CrossRef] [PubMed]
- Kraaijvanger, R.; Bonás, M.J.; Vorselaars, A.D.M.; Veltkamp, M. Biomarkers in the Diagnosis and Prognosis of Sarcoidosis: Current Use and Future Prospects. Front. Immunol. 2020, 11, 1443. [Google Scholar] [CrossRef] [PubMed]
- Zhou, E.-R.; Arce, S. Key Players and Biomarkers of the Adaptive Immune System in the Pathogenesis of Sarcoidosis. Int. J. Mol. Sci. 2020, 21, 7398. [Google Scholar] [CrossRef] [PubMed]
- Bargagli, E.; Bennett, D.; Maggiorelli, C.; Di Sipio, P.; Margollicci, M.; Bianchi, N.; Rottoli, P. Human Chitotriosidase: A Sensitive Biomarker of Sarcoidosis. J. Clin. Immunol. 2013, 33, 264–270. [Google Scholar] [CrossRef]
- Chen, E.S.; Song, Z.; Willett, M.H.; Heine, S.; Yung, R.C.; Liu, M.C.; Groshong, S.D.; Zhang, Y.; Tuder, R.M.; Moller, D.R. Serum Amyloid a Regulates Granulomatous Inflammation in Sarcoidosis through Toll-like Receptor-2. Am. J. Respir. Crit. Care Med. 2010, 181, 360–373. [Google Scholar] [CrossRef] [Green Version]
- Bargagli, E.; Magi, B.; Olivieri, C.; Bianchi, N.; Landi, C.; Rottoli, P. Analysis of serum amyloid A in sarcoidosis patients. Respir. Med. 2011, 105, 775–780. [Google Scholar] [CrossRef] [Green Version]
- Beijer, E.; Roodenburg-Benschop, C.; Schimmelpennink, M.C.; Grutters, J.C.; Meek, B.; Veltkamp, M. Elevated Serum Amyloid a Levels Are not Specific for Sarcoidosis but Associate with a Fibrotic Pulmonary Phenotype. Cells 2021, 10, 585. [Google Scholar] [CrossRef]
- Ramos-Casals, M.; Retamozo, S.; Sisó-Almirall, A.; Pérez-Alvarez, R.; Pallarés, L.; Brito-Zerón, P. Clinically-useful serum biomarkers for diagnosis and prognosis of sarcoidosis. Expert Rev. Clin. Immunol. 2019, 15, 391–405. [Google Scholar] [CrossRef]
- Bergantini, L.; Bianchi, F.; Cameli, P.; Mazzei, M.A.; Fui, A.; Sestini, P.; Rottoli, P.; Bargagli, E. Prognostic Biomarkers of Sarcoidosis: A Comparative Study of Serum Chitotriosidase, ACE, Lysozyme, and KL-6. Dis. Markers 2019, 2019, 8565423. [Google Scholar] [CrossRef]
- Scadding, J.G. Prognosis of Intrathoracic Sarcoidosis in England. A review of 136 cases after five years’ observation. Br. Med. J. 1961, 2, 1165–1172. [Google Scholar] [CrossRef] [PubMed] [Green Version]
- Walsh, S.L.; Wells, A.U.; Sverzellati, N.; Keir, G.J.; Calandriello, L.; Antoniou, K.M.; Copley, S.J.; Devaraj, A.; Maher, T.M.; Renzoni, E.; et al. An integrated clinicoradiological staging system for pulmonary sarcoidosis: A case-cohort study. Lancet Respir. Med. 2014, 2, 123–130. [Google Scholar] [CrossRef] [PubMed] [Green Version]
- Papiris, S.A.; Kolilekas, L.; Rivera, N.; Spanos, M.; Li, G.; Gokulnath, P.; Chatterjee, E.; Georgakopoulos, A.; Kallieri, M.; Papaioannou, A.I.; et al. From Karl Wurm and Guy Scadding’s staging to 18F-FDG PET/CT scan phenotyping and far beyond: Perspective in the evading history of phenotyping in sarcoidosis. Front. Med. 2023, 10, 1174518. [Google Scholar] [CrossRef] [PubMed]
- Levy, A.; Hamzeh, N.; Maier, L.A. Is it time to scrap Scadding and adopt computed tomography for initial evaluation of sarcoidosis? F1000Research 2018, 7, 600. [Google Scholar] [CrossRef] [Green Version]
- Prasse, A.; Pechkovsky, D.V.; Toews, G.B.; Jungraithmayr, W.; Kollert, F.; Goldmann, T.; Vollmer, E.; Müller-Quernheim, J.; Zissel, G. A Vicious Circle of Alveolar Macrophages and Fibroblasts Perpetuates Pulmonary Fibrosis via CCL18. Am. J. Respir. Crit. Care Med. 2006, 173, 781–792. [Google Scholar] [CrossRef] [Green Version]
- Pochetuhen, K.; Luzina, I.G.; Lockatell, V.; Choi, J.; Todd, N.W.; Atamas, S.P. Complex Regulation of Pulmonary Inflammation and Fibrosis by CCL18. Am. J. Pathol. 2007, 171, 428–437. [Google Scholar] [CrossRef] [Green Version]
- Prasse, A.; Probst, C.; Bargagli, E.; Zissel, G.; Toews, G.B.; Flaherty, K.R.; Olschewski, M.; Rottoli, P.; Müller-Quernheim, J. Serum CC-Chemokine Ligand 18 Concentration Predicts Outcome in Idiopathic Pulmonary Fibrosis. Am. J. Respir. Crit. Care Med. 2009, 179, 717–723. [Google Scholar] [CrossRef]
- Cai, M.; Bonella, F.; He, X.; Sixt, S.U.; Sarria, R.; Guzman, J.; Costabel, U. CCL18 in serum, BAL fluid and alveolar macrophage culture supernatant in interstitial lung diseases. Respir. Med. 2013, 107, 1444–1452. [Google Scholar] [CrossRef] [Green Version]
- Bennett, D.; Cameli, P.; Lanzarone, N.; Carobene, L.; Bianchi, N.; Fui, A.; Rizzi, L.; Bergantini, L.; Cillis, G.; D’alessandro, M.; et al. Chitotriosidase: A biomarker of activity and severity in patients with sarcoidosis. Respir. Res. 2020, 21, 6. [Google Scholar] [CrossRef] [Green Version]
- Harlander, M.; Salobir, B.; Zupančič, M.; Dolenšek, M.; Vodovnik, T.B.; Terčelj, M. Serial chitotriosidase measurements in sarcoidosis—Two to five year follow-up study. Respir. Med. 2014, 108, 775–782. [Google Scholar] [CrossRef] [Green Version]
- Terčelj, M.; Salobir, B.; Simcic, S.; Wraber, B.; Zupancic, M.; Rylander, R. Chitotriosidase activity in sarcoidosis and some other pulmonary diseases. Scand. J. Clin. Lab. Investig. 2009, 69, 575–578. [Google Scholar] [CrossRef] [PubMed]
- Harlander, M.; Maver, A.; Terčelj, M.; Salobir, B.; Peterlin, B. Common chitotriosidase duplication gene polymorphism and clinical outcome status in sarcoidosis. Sarcoidosis Vasc. Diffus. Lung Dis. Off. J. WASOG 2015, 32, 194–199. Available online: https://pubmed.ncbi.nlm.nih.gov/26422563/ (accessed on 24 June 2023).
- Bargagli, E.; Margollicci, M.; Luddi, A.; Nikiforakis, N.; Perari, M.G.; Grosso, S.; Perrone, A.; Rottoli, P. Chitotriosidase activity in patients with interstitial lung diseases. Respir. Med. 2007, 101, 2176–2181. [Google Scholar] [CrossRef] [PubMed] [Green Version]
- Bargagli, E.; Maggiorelli, C.; Rottoli, P. Human Chitotriosidase: A Potential New Marker of Sarcoidosis Severity. Respiration 2008, 76, 234–238. [Google Scholar] [CrossRef] [PubMed]
- Hirasawa, Y.; Kohno, N.; Yokoyama, A.; Inoue, Y.; Abe, M.; Hiwada, K. KL-6, a Human MUC1 Mucin, Is Chemotactic for Human Fibroblasts. Am. J. Respir. Cell Mol. Biol. 1997, 17, 501–507. [Google Scholar] [CrossRef] [Green Version]
- Ohshimo, S.; Yokoyama, A.; Hattori, N.; Ishikawa, N.; Hirasawa, Y.; Kohno, N. KL-6, a human MUC1 mucin, promotes proliferation and survival of lung fibroblasts. Biochem. Biophys. Res. Commun. 2005, 338, 1845–1852. [Google Scholar] [CrossRef]
- Miyoshi, S.; Hamada, H.; Kadowaki, T.; Hamaguchi, N.; Ito, R.; Irifune, K.; Higaki, J. Comparative Evaluation of Serum Markers in Pulmonary Sarcoidosis. Chest 2010, 137, 1391–1397. [Google Scholar] [CrossRef] [Green Version]
- Kobayashi, J.; Kitamura, S. Serum KL-6 for the Evaluation of Active Pneumonitis in Pulmonary Sarcoidosis. Chest 1996, 109, 1276–1282. [Google Scholar] [CrossRef] [Green Version]
- Nishikiori, H.; Chiba, H.; Ariki, S.; Kuronuma, K.; Otsuka, M.; Shiratori, M.; Ikeda, K.; Watanabe, A.; Kuroki, Y.; Takahashi, H. Distinct compartmentalization of SP-A and SP-D in the vasculature and lungs of patients with idiopathic pulmonary fibrosis. BMC Pulm. Med. 2014, 14, 196. [Google Scholar] [CrossRef] [Green Version]
- Takahashi, H.; Sano, H.; Chiba, H.; Kuroki, Y. Pulmonary Surfactant Proteins A and D: Innate Immune Functions and Biomarkers for Lung Diseases. Curr. Pharm. Des. 2006, 12, 589–598. [Google Scholar] [CrossRef] [PubMed]
- Beketov, V.D.; Lebedeva, M.V.; Mukhin, A.N.; Serova, A.G.; Ponomarev, A.B.; Popova, E.N.; Yanakaeva, A.S.; Solomka, A.V.; Kondrashov, A.V.; Konovalov, D.V. Clinical significance of the determination of surfactant proteins A and D in assessing the activity of lung sarcoidosis. Ter. Arkhiv 2018, 90, 42–46. [Google Scholar] [CrossRef] [PubMed]
- Culver, D.A.; Baughman, R.P. It’s time to evolve from Scadding: Phenotyping sarcoidosis. Eur. Respir. J. 2018, 51, 1800050. [Google Scholar] [CrossRef] [Green Version]
- Drent, M.; De Vries, J.; Lenters, M.; Lamers, R.J.S.; Rothkranz-Kos, S.; Wouters, E.F.M.; van Dieijen-Visser, M.P.; Verschakelen, J.A. Sarcoidosis: Assessment of disease severity using HRCT. Eur. Radiol. 2003, 13, 2462–2471. [Google Scholar] [CrossRef]
- Mañá, J.; Gómez-Vaquero, C.; Montero, A.; Salazar, A.; Marcoval, J.; Valverde, J.; Manresa, F.; Pujol, R. Löfgren’s syndrome revisited: A study of 186 patients. Am. J. Med. 1999, 107, 240–245. [Google Scholar] [CrossRef] [PubMed]
- Criado, E.; Sánchez, M.; Ramírez, J.; Arguis, P.; de Caralt, T.M.; Perea, R.J.; Xaubet, A. Pulmonary Sarcoidosis: Typical and Atypical Manifestations at High-Resolution CT with Pathologic Correlation. Radiographics 2010, 30, 1567–1586. [Google Scholar] [CrossRef] [PubMed] [Green Version]
- Gay, S.E.; Kazerooni, E.A.; Toews, G.B.; Lynch, J.P.; Gross, B.H.; Cascade, P.N.; Spizarny, D.L.; Flint, A.; Schork, M.A.; Whyte, R.I.; et al. Idiopathic Pulmonary Fibrosis: Predicting response to therapy and survival. Am. J. Respir. Crit. Care Med. 1998, 157, 1063–1072. [Google Scholar] [CrossRef]
- Oberstein, A.; Von Zitzewitz, H.; Schweden, F.; Müller-Quernheim, J. Non invasive evaluation of the inflammatory activity in sarcoidosis with high-resolution computed tomography. Sarcoidosis Vasc. Diffus. Lung Dis. Off. J. WASOG 1997, 14, 65–72. Available online: https://pubmed.ncbi.nlm.nih.gov/9186991/ (accessed on 19 March 2022).
- R: The R Project for Statistical Computing. Available online: https://www.r-project.org/ (accessed on 24 November 2022).


| Variable | Patients (N = 79) |
|---|---|
| Gender | |
| Male | 33 |
| Female | 46 |
| Median age (IQR) | 46.7 (38.2–55.6) |
| Smoking | |
| Never | 60 |
| Former smoker | 10 |
| Current smoker | 9 |
| Pulmonary function tests: | |
| -Median FVC in % (IQR) | 96.0 (88.0–106.5) |
| -Median FEV1 in % (IQR) | 94.5 (85.3–103.0) |
| -Median DLCO in % (IQR) | 80 (73–89) |
| BAL CD4+/CB8+ cell ratio | 4.84 (2.2–8.78) |
| Variable | Patients (N = 79) |
|---|---|
| Scadding stage | |
| 0 | 0 |
| 1 | 9 |
| 2 | 63 |
| 3 | 6 |
| 4 | 1 |
| HRCT characteristics at diagnosis | 44 |
| -Lymph node enlargement | |
| Yes | 38 |
| No | 6 |
| -Perilymphatic nodules | |
| Yes | 28 |
| No | 16 |
| -Peribronchovascular infiltrates | |
| Yes | 22 |
| No | 22 |
| -Ground-glass lesions | |
| Yes | 10 |
| No | 34 |
| -Fibrosis | |
| Yes | 7 |
| No | 37 |
| 18-FDG-PET/CT characteristics at diagnosis | 32 |
| (only patients with no HRCT at diagnosis) | |
| -Lymph node involvement | |
| Yes | 28 |
| No | 4 |
| -Perilymphatic nodules | |
| Yes | 14 |
| No | 18 |
| -Peribronchovascular infiltrates | |
| Yes | 11 |
| No | 21 |
| -Ground-glass lesions | |
| Yes | 4 |
| No | 28 |
| -Fibrosis | |
| Yes | 4 |
| No | 28 |
| Scadding Stages | 0 | 1 | 2 | 3 | 4 |
|---|---|---|---|---|---|
| CXR findings | Normal | Hilar or mediastinal nodal enlargement | Hilar or mediastinal nodal enlargement and parenchymal disease | Parenchymal disease only | Lung fibrosis and volume loss |
| Number of patients | 0 | 9 | 63 | 6 | 1 |
| Variable | n | SAA [mcg/mL] | SP-D [pg/mL] | CCL18 [pg/mL] | CA15.3 [pg/mL] | CXCL9 [pg/mL] | CXCL10 [pg/mL] |
|---|---|---|---|---|---|---|---|
| Healthy cohort | 56 | 3 (2; 4) | 11,901 (8880; 17,878) | 31,809 (25,711; 40,035) | 29 (21; 40) | 520 (321; 646) | 48 (37; 60) |
| Sarcoidosis cohort | 79 | 5 (4; 13) | 13,533 (10,134; 21,292) | 62,690 (48,298; 75,741) | 38 (28; 49) | 829 (673; 1112) | 95 (73; 146) |
| p-value | 0 | 0.23 | 0 | 0.003 | 0 | 0 | |
| Lymph node enlargement | 66 | 5 (4; 13) | 13,496 (10,242; 22,606) | 60,258 (48,052; 72,987) | 38 (28; 50) | 850 (686; 1113) | 98 (77; 162) |
| p-value | 0 | 0.141 | 0 | 0.006 | 0 | 0 | |
| Perilymphatic nodules | 42 | 5 (4; 9) | 14,388 (10,311; 21,492) | 57,413 (46,745; 74,788) | 41 (30; 50) | 870 (673; 1095) | 95 (76; 136) |
| p-value | 0 | 0.098 | 0 | 0.005 | 0 | 0 | |
| Peribroncho-vascular infiltrates | 33 | 5 (3; 9) | 14,477 (11,062; 22,911) | 61,200 (48,140; 76,133) | 43 (30; 53) | 779 (727; 1019) | 95 (80; 142) |
| p-value | 0 | 0.092 | 0 | 0.005 | 0 | 0 | |
| Ground-glass lesions | 14 | 9 (5; 12) | 16,639 (10,457; 33,454) | 61,003 (48,140; 76,133) | 47 (35; 57) | 824 (698; 1553) | 124 (80; 208) |
| p-value | 0 | 0.059 | 0 | 0.012 | 0 | 0 | |
| Fibrosis | 11 | 5 (3; 10) | 30,178 (14,122; 33,752) | 66,812 (53,949; 80,782) | 45 (36; 58) | 1019 (753; 1147) | 91 (69; 135) |
| p-value | 0.021 | 0.014 | 0 | 0.029 | 0 | 0 |
Disclaimer/Publisher’s Note: The statements, opinions and data contained in all publications are solely those of the individual author(s) and contributor(s) and not of MDPI and/or the editor(s). MDPI and/or the editor(s) disclaim responsibility for any injury to people or property resulting from any ideas, methods, instructions or products referred to in the content. |
© 2023 by the authors. Licensee MDPI, Basel, Switzerland. This article is an open access article distributed under the terms and conditions of the Creative Commons Attribution (CC BY) license (https://creativecommons.org/licenses/by/4.0/).
Share and Cite
Leštan Ramovš, Z.; Sodin-Šemrl, S.; Lakota, K.; Čučnik, S.; Manevski, D.; Zbačnik, R.; Zupančič, M.; Verbič, M.; Terčelj, M. Correlation of the High-Resolution Computed Tomography Patterns of Intrathoracic Sarcoidosis with Serum Levels of SAA, CA 15.3, SP-D, and Other Biomarkers of Interstitial Lung Disease. Int. J. Mol. Sci. 2023, 24, 10794. https://doi.org/10.3390/ijms241310794
Leštan Ramovš Z, Sodin-Šemrl S, Lakota K, Čučnik S, Manevski D, Zbačnik R, Zupančič M, Verbič M, Terčelj M. Correlation of the High-Resolution Computed Tomography Patterns of Intrathoracic Sarcoidosis with Serum Levels of SAA, CA 15.3, SP-D, and Other Biomarkers of Interstitial Lung Disease. International Journal of Molecular Sciences. 2023; 24(13):10794. https://doi.org/10.3390/ijms241310794
Chicago/Turabian StyleLeštan Ramovš, Zala, Snežna Sodin-Šemrl, Katja Lakota, Saša Čučnik, Damjan Manevski, Rok Zbačnik, Mirjana Zupančič, Martin Verbič, and Marjeta Terčelj. 2023. "Correlation of the High-Resolution Computed Tomography Patterns of Intrathoracic Sarcoidosis with Serum Levels of SAA, CA 15.3, SP-D, and Other Biomarkers of Interstitial Lung Disease" International Journal of Molecular Sciences 24, no. 13: 10794. https://doi.org/10.3390/ijms241310794